Article

Er:Y2O3 and Nd:Y2O3 Nanoparticles: Synthesis, Pegylation, Characterization and Study of Their Luminescence Properties

1
Dipartimento di Fisica e Astronomia “Ettore Majorana”, Università di Catania, Via Santa Sofia 64, 95123 Catania, Italy
2
Institut des Sciences Chimiques de Rennes, CNRS UMR 6226, Université Rennes 1, Avenue du général Leclerc, 35042 Rennes, France
3
Consiglio Nazionale delle Ricerche, Istituto per la Microelettronica e i Microsistemi (CNR-IMM), Via S. Sofia 64, 95123 Catania, Italy
4
Dipartimento di Scienze Biomediche e Biotecnologiche, Sezione di Biologia e Genetica “G. Sichel”, Università di Catania, Via S. Sofia 89, 95123 Catania, Italy
5
Dipartimento di Scienze Chimiche, Università di Catania, Viale Andrea Doria 6, 95125 Catania, Italy
*
Authors to whom correspondence should be addressed.
Chemosensors 2023, 11(1), 20; https://doi.org/10.3390/chemosensors11010020
Submission received: 21 November 2022 / Revised: 20 December 2022 / Accepted: 23 December 2022 / Published: 26 December 2022
(This article belongs to the Special Issue Room Temperature Detection and Sensing Technologies)

Abstract

:
Lanthanide-doped yttrium oxide nanoparticles can display selective upconversion properties, rendering them invaluable in the field of nanomedicine for both sensing and diagnostics. Different syntheses of Er:Y2O3 and Nd:Y2O3 nanoparticles (NPs) were studied and optimized to obtain small particles of regular shape and good crystallinity. The morphological and compositional characterizations of the nanoparticles were obtained with different techniques and showed that both Er:Y2O3 and Nd:Y2O3 NPs were well dispersed, with dimensions of the order of a few tens of nanometers. The photoluminescence and cathodoluminescence measurements showed that both Er:Y2O3 and Nd:Y2O3 NPs had good emission as well as upconversion. The nanophosphors were functionalized by a pegylation procedure to suppress unwanted reactions of the NPs with other biological components, making the NP systems biocompatible and the NPs soluble in water and well dispersed. The pegylated core/shell nanoparticles showed the same morphological and optical characteristics as the core, promoting their strategic role as photoactive material for theragnostics and biosensing.

1. Introduction

In the field of Bioimaging, fluorescence imaging technology has become an indispensable method for monitoring changes in biochemical indicators and the appearance and development of biomarkers in living systems [1]. Since near-infrared (NIR) light is less absorbed and scattered in biological tissues, it can achieve high penetration efficiency, and thus fluorescence imaging technology has mainly focused on the NIR window [2,3,4,5]. In this context, lanthanide-doped yttrium oxide nanoparticles that can display selective upconversion properties, such as NIR to shorter NIR, visible (blue, green and red) and UV, are the candidates of election for in vivo bioimaging. In fact, it is possible to irradiate them by using NIR excitation light, exploiting the optical transparency window (in the NIR range of 700–1100 nm) of biological tissues, obtaining deeper light penetration and reducing photodamage effects [6,7]. In particular, when Nd3+ was irradiated at 808 nm, showed, in addition to upconversion properties [8], an emission band at 910 nm (4F3/24I9/2), that is, in the first biological window, and two fluorescence bands in the second biological window, with average emission wavelengths at 1050 (4F3/24I11/2) and 1330 nm (4F3/24I13/2). Thus, the use of Nd-doped nanoparticles improves the excitation penetration depth that is weakly attenuated by tissues and allows for a remarkable improvement (in terms of optical penetration depth) with respect to visible emitting NPs [7]. Furthermore, rare earth phosphor nanoparticles (REP-NPs) [7,9,10] possess unique characteristics and optical properties, such as a narrow emission, resulting in high color purity, longer excited state lifetimes and the possibility of covering the entire electromagnetic spectrum as well as low cytotoxicity [10]. In particular, unlike NaYF4 [11], that are usually synthesized at high temperatures and make use of organic solvents, yttria nanoparticles can be obtained by facile and green syntheses with respect to other host materials and showed particular chemical inertia, making them excellent for biomedical applications [12]. Moreover, due to the remarkably high brightness and high electron beam stability of rare earth element-doped NPs, cathodoluminescence electron microscopy can be used, enabling subdiffraction imaging [13]. Cathodoluminescence (CL), combined with other SEM-based techniques, can be used to produce a complete material analysis, providing unique and complementary information to other SEM-based techniques.
The use of upconversion NPs could also be a strategic step in the early diagnosis of several diseases, in particular by using them to target exosomes, a class of small membrane-bound extracellular vesicles (EVs) that act as signaling vehicles in normal cell homeostatic processes or as a consequence of pathological developments [14,15,16]. Obviously, to achieve the selective targeting of small extracellular vesicles, such as exosomes, whose dimensions are typically 30–150 nm in diameter, obtaining properly functionalized rare earth-doped yttrium oxide NPs of small sizes (30–40 nm) is strategic [17].
On the other hand, REP-NPs are generally Y2O3:Ln3+ oxides or NaYF4:Ln3+, and these NPs have no inherent aqueous dispersibility and no intrinsic aqueous solubility. Therefore, being ceramic systems, that is, they are insoluble as well as highly inert, their use in biological fluids in order to label specific targets is practically impossible, and this is a significant drawback for biomedical research [17,18,19]. To impart “stealth” properties to the nanoparticles and increase their circulation time, one of the most frequently used approaches is to coat their surface with an inert polymer that resists interactions with the components of biological fluids. Polyethylene glycol (PEG) coatings on NPs shield their surfaces from aggregation, opsonization and phagocytosis, thereby prolonging their circulation time. Pegylation also renders materials that otherwise could not have been used soluble and biocompatible. Furthermore, pegylated NPs can be easily functionalized by different selected biomolecules able to perform the selective recognition of targeted vesicles and/or tissues. Thus, after a further functionalization with specific antibodies able to recognize the proteins present on the surface of EVs, these systems could be invaluable for the recognition of these small vesicles [16] and the analysis of their cargo.
Given the importance of optically active lanthanide-doped oxide NPs, because of their luminescence and upconversion properties, in this work, three different syntheses were compared for erbium-doped nanoparticles in order to optimize their structural and optical performance to foster future applications for bioimaging and photo-activated processes. Nd:Y2O3 NPs were also synthesized by following the procedure that gave the best results. After NP synthesis, the characterizations of bare and pegylated Er:Y2O3 and Nd:Y2O3 NPs were compared, with the aim of obtaining ceramic nanophosphors of dimensions in the range of a few tens of nanometers with good crystallinity and with good upconversion properties. Additionally, the cathodoluminescence properties of the core systems were also studied, since by using CL microscopy, it is possible to study the details of biological systems with a higher spatial resolution than when using conventional light and super-resolution optical microscopies, overcoming the limitations of individual microscopic techniques and combining luminescence imaging and high-spatial-resolution imaging in the same region of a sample [20].

2. Materials and Methods

2.1. Materials

Y(NO3)3·6H2O, Er(NO3)3·5H2O and urea were obtained as commercial reagents from Alfa Aesar (USA). Nd(NO3)3·6H2O, urease and polyacrylic acid (PAAc) were purchased from Sigma Aldrich (USA), and PAAc-b-PEG was purchased from Polymer Source INC. (Canada). The ultrafiltration devices were the Vivaspin Sartorius VS0651 with an 300,000 MWCO (300 kDa) and Amicon Ultra devices at 10,000 MWCO (10 kDa), 50,000 MWCO (50 kDa) and 100,000 MWCO (100 kDa). All solutions were prepared by using Milli-Q water.

2.2. Synthesis of Er:Y2O3 and Nd:Y2O3

Three different synthetic routes were used to obtain Er:Y2O3 NPs. Synthesis 1 (E1) The NPs were synthesized by slightly modifying the procedure previously reported by Venkatachalam et al. [21].
The following, 0.4596 g of Y(NO3)3·6H2O (4 mM) and 0.0399 g of Er(NO3)3·5H2O (0.3 mM), were solubilized in 300 mL of water. A total of 100 mL of a urea solution (0.4 M) and 30 mg of urease were subsequently added to the solution, which was maintained at room temperature. Synthesis 2 (E2) In this case, the NPs were obtained by mixing 300 mL of a solution of 4 mM in Y(NO3)3·6H2O and 0.3 mM in Er(NO3)3·5H2O at room temperature with 10 mL of a solution of concentrated NH3. Synthesis 3 (E3) The procedure reported by Venkatachalam et al. in 2012 [22] was followed with the difference that nitrates were used instead of carbonates. In this case, urea (0.4 mol), nitrates of yttrium (4 mM), erbium (0.3 mM) and PAAc (0.1 mM) were present in the starting mixture, and the solution was kept at 90 °C for 1 h.
In all cases the precipitate precursors were centrifugally separated and washed three times (5000 rpm for 15 min each time) with Milli-Q water and dried at 100 °C for 12 h. The dried precursor materials were calcined in air at 1100 °C for 60 min to improve the crystallinity of the final product and finally crushed in an Agate mortar to make them homogeneous.
The synthesis of Nd:Y2O3 NPs was carried out by following the third approach; however, a 0.03 mM concentration of Nd(NO3)3·6H2O was used.

2.3. Preparation of PEGylated Er:Y2O3 and Nd:Y2O3 NPs

The pegylation of Er:Y2O3 and Nd:Y2O3 NPs was carried out by slightly modifying the procedure reported by Kamimura et al. [23]. Briefly, 2 mg of NPs were added to 20 mL of a TRIS/HCl (pH = 7.00) buffer solution, containing 0.5 g/L of PEG-b-PAAc, and the resulting mixture was kept at 4 °C for 24 h under magnetic stirring. The obtained solution was split into two aliquots that were differently purified. In one case, the free excess polymer in the solution was removed by ultracentrifugation (9.0 × 10⁴ g, 15 min, 3 times), and the solvent was changed to Milli-Q water, whereas the second aliquot was ultrafiltered using different ultrafiltration devices: a Vivaspin Sartorius VS0651 at 300,000 MWCO (300 kDa) and an Amicon Ultra device at 10,000 MWCO (10 kDa), 50,000 MWCO (50 kDa) and 100,000 MWCO (100 kDa). In all cases, the ultrafiltration was carried out by centrifuging the sample at 3500 rpm for 5 min for three times, and the solvent was changed to Milli-Q water.

2.4. SEM Analyses

Morphology and chemical mapping of the samples was carried out using a field emission scanning electron microscope (Gemini Field Emission SEM SUPRA 25, Zeiss, Germany) equipped with an energy dispersive X-ray (EDX) microanalysis system (X-MAX, 80 mm2 by Oxford Instruments, Abingdon, UK). The analyses were performed at an acceleration voltage of 20 kV, with an aperture size of 30 µm, a working distance of 4–5 mm and using an In-lens detector. Samples were prepared for SEM by placing one drop of the colloidal dispersions of Er:Y2O3 or Nd:Y2O3, both core and pegylated core/shell, onto a 1 cm2 p-doped piece of silicon and allowed to dry for 30 min.

2.5. TEM Analyses

Transmission electron microscopy analysis was carried out with a JEOL 1400 transmission electron microscope (Japan). For the preparation of samples, 300 mesh carbon coated nickel grids were placed for 1 min on top of a 40 µL sample droplet (colloidal dispersions of Er:Y2O3 or Nd:Y2O3, both core and pegylated core/shell) and dried with paper. A 200 kV acceleration voltage was used. Particle diameters were determined from TEM micrographs using ImageJ Software.

2.6. XRD Characterization

Structural characterization was carried out by XRD in Bragg–Brentano mode using a Smartlab Rigaku diffractometer equipped with a rotating anode of Cu Kα radiation operating at 45 kV and 200 mA.

2.7. Rutherford Backscattering Spectrometry

Rutherford backscattering spectrometry (RBS) measurements were carried out by using a 3.5 MV Singletron HVEE (The Netherlands). A 2 MeV He+ ion beam incident normally to the sample surface and detected at 165° was used, and the current beam was set at 80 nA. In this case, the samples were prepared by drop-casting one drop of the NP solution under examination on silicon. A standard sample of amorphous silicon was used to obtain the dead time correction parameters. In order to take into account the roughness of the samples for the quantification of concentrations, simulations of RBS-spectra were performed using the SIMNRA simulation package [24].

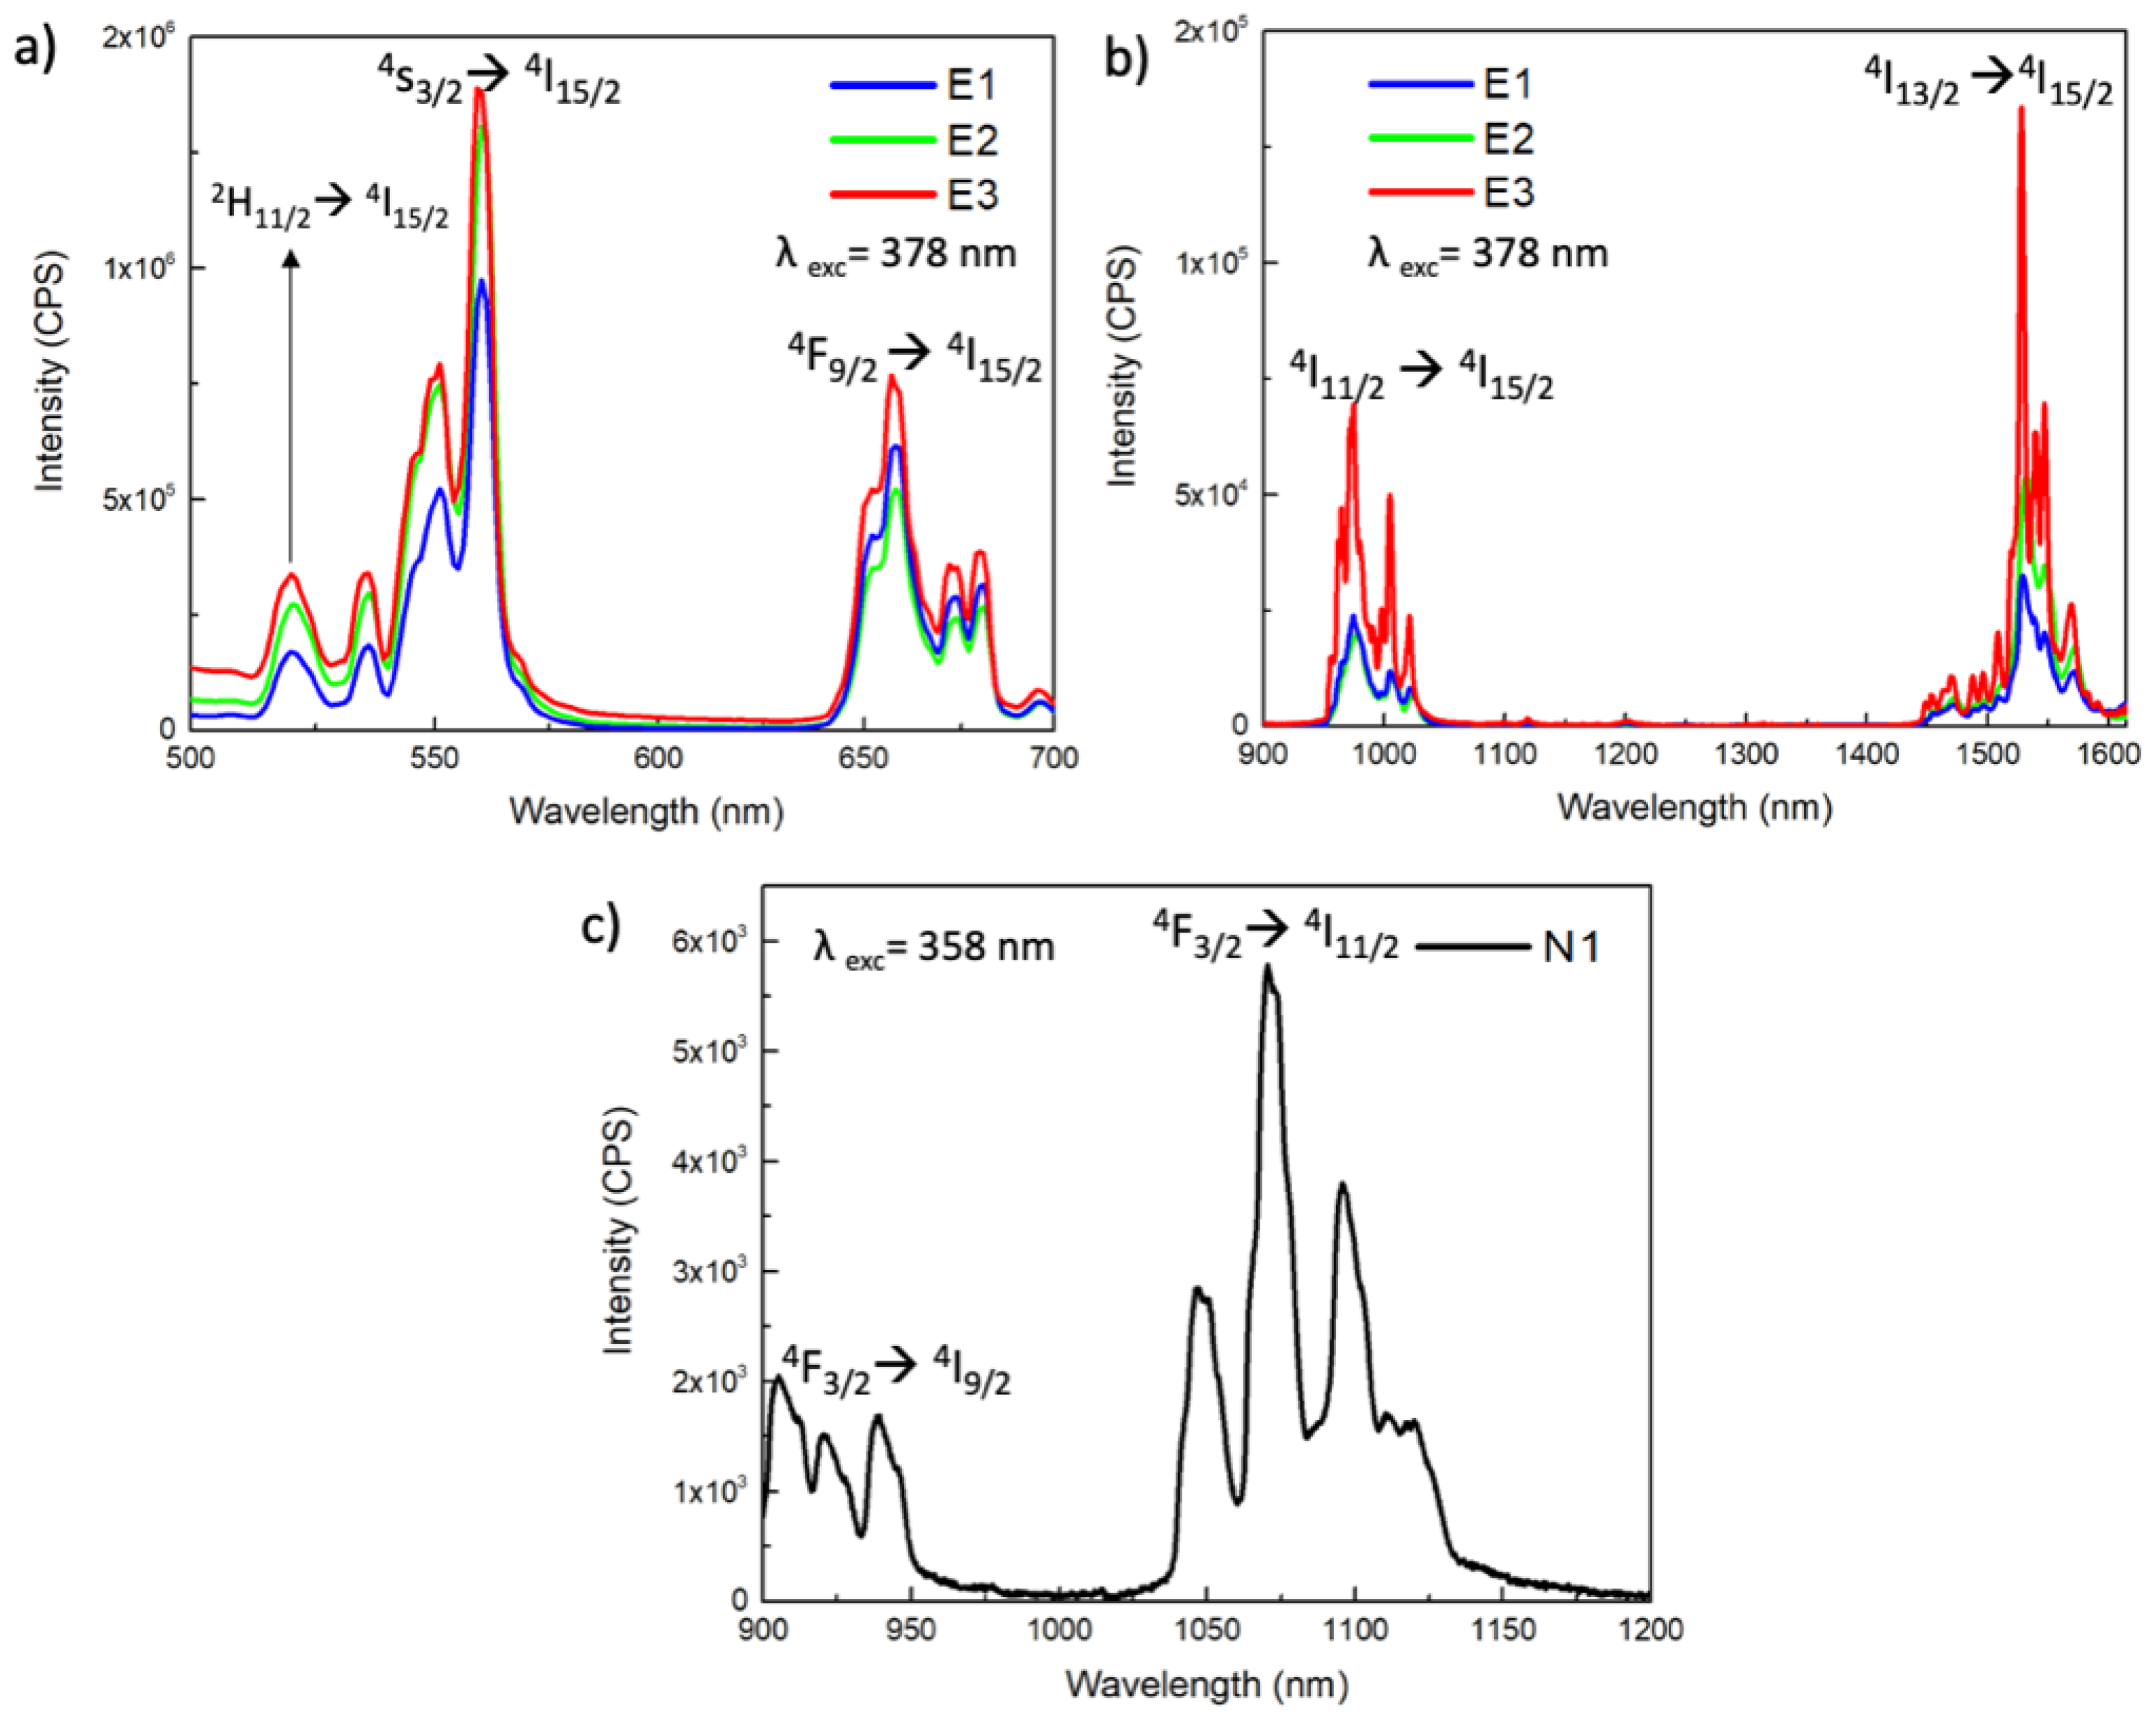
2.8. Photoluminescence

Photoluminescence measurements were performed using a Horiba Nanolog spectrofluorometer (France). The measurements were performed at room temperature on samples drop-cast on silicon (three drops). The wavelength resolution of both the excitation and the emission slits was set to 5 nm for measurements in the visible range and 14 nm for measurements in the IR range. The intrinsic fluorescence of Er:Y2O3 and Nd:Y2O3 NPs was excited at 378 nm and 358 nm, respectively. The corresponding emission spectra were acquired both in the visible and IR region using a Hamamatsu R928 photomultiplier in the UV-Vis-NIR and a Horiba Symphony II InGaAs array as an IR detector, respectively. Two different long-pass filters (400 nm for the visible range and 840 nm for the IR range) were used to block the lamp excitation wavelength. The acquisition times were 1 s for measurements in the visible range and 60 s for measurements in the IR range.

2.9. Upconversion

Upconversion measurements were performed by an instrument made of a tunable Ti:sapphire laser as a light source, a chopper that modulates the frequency of the signal from the source, a sample holder, a photodetector (a classic photomultiplier tube) and a lock-in amplifier. For erbium-doped and neodymium-doped NPs, the laser excitation was tuned to 980 nm and 808 nm, respectively. The power of the light source was 32 mW and a low-pass filter of 750 nm was used.

2.10. ζ-Potential Measurements

The surface charges of the core Er- and Nd-doped Y2O3 NPs and of the pegylated core/shell corresponding charges were measured using a Malvern Zetasizer-Nano single-angle instrument equipped with a 4 mW He-Ne laser (633 nm) and an avalanche photodiode (ZetasizerNano ZS). All measurements were carried out in TRIS-HCl buffer (10 mM, pH 7.4, 15 mM NaCl), with multiple measurements (>3) being made and the trends in the measured zeta-potential values being observed. The reliability of the zeta-potential measurements was ±6 mV. The ζ-potentials were calculated from mobility values by integrated Zetasizer software (Smoluchowski equation).

2.11. Cathodoluminescence

Cathodoluminescence measurements were acquired by a Gemini Field emission scanning electron microscope from ZEISS equipped with a Gatan Mono CL4 setup at 5 kV.

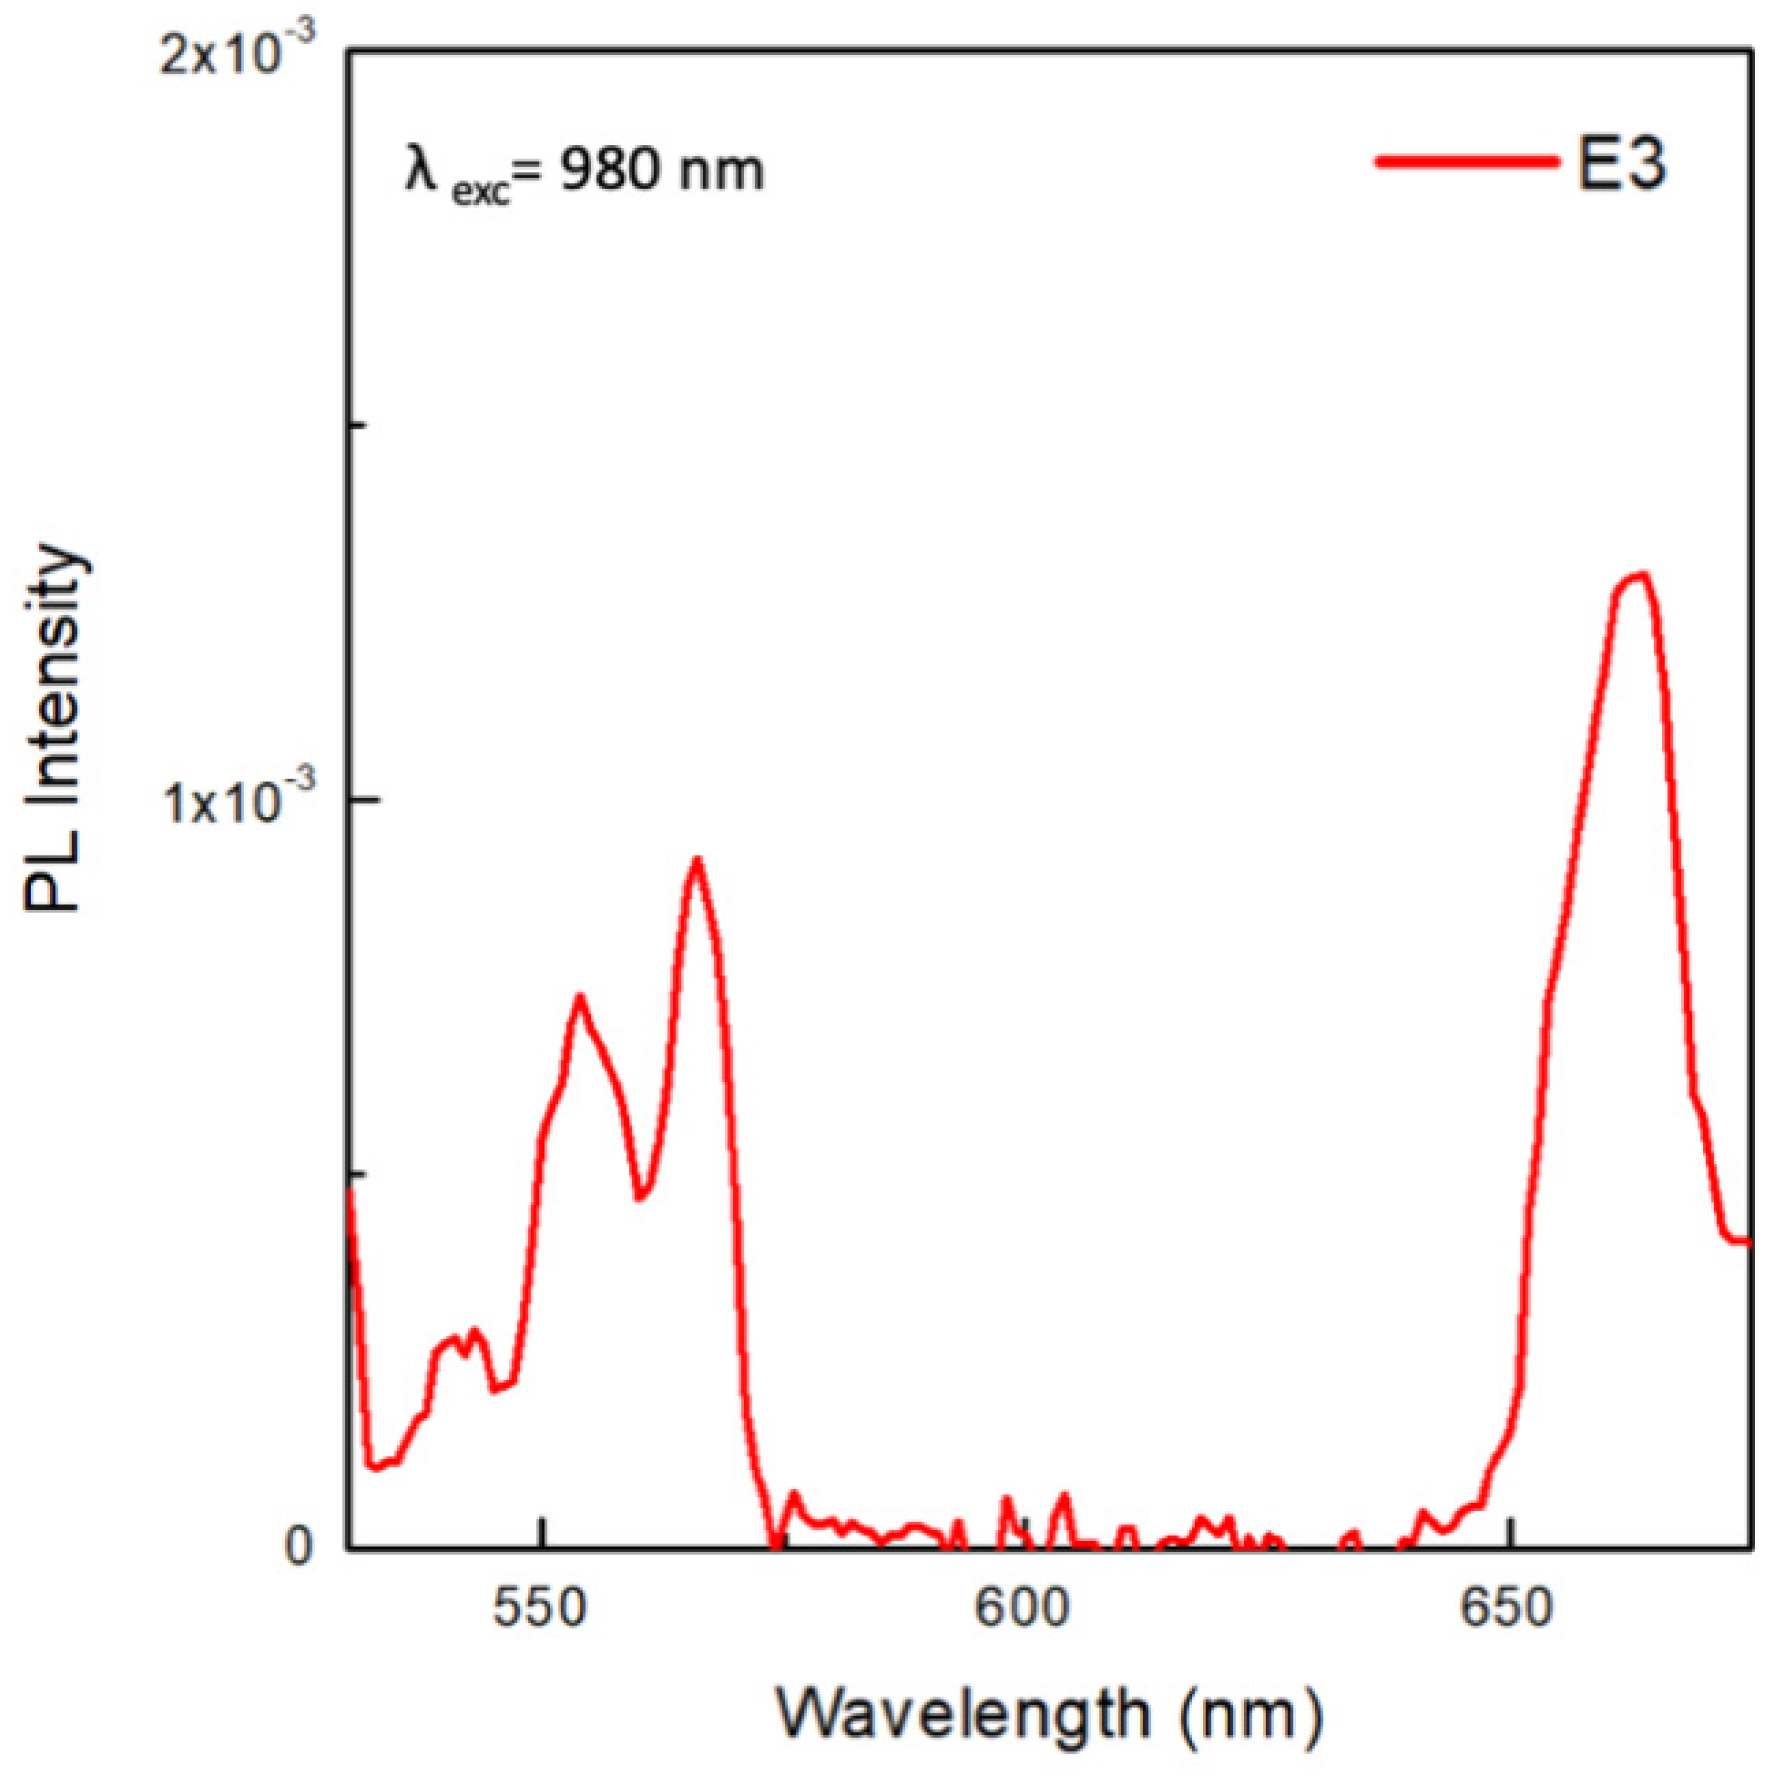
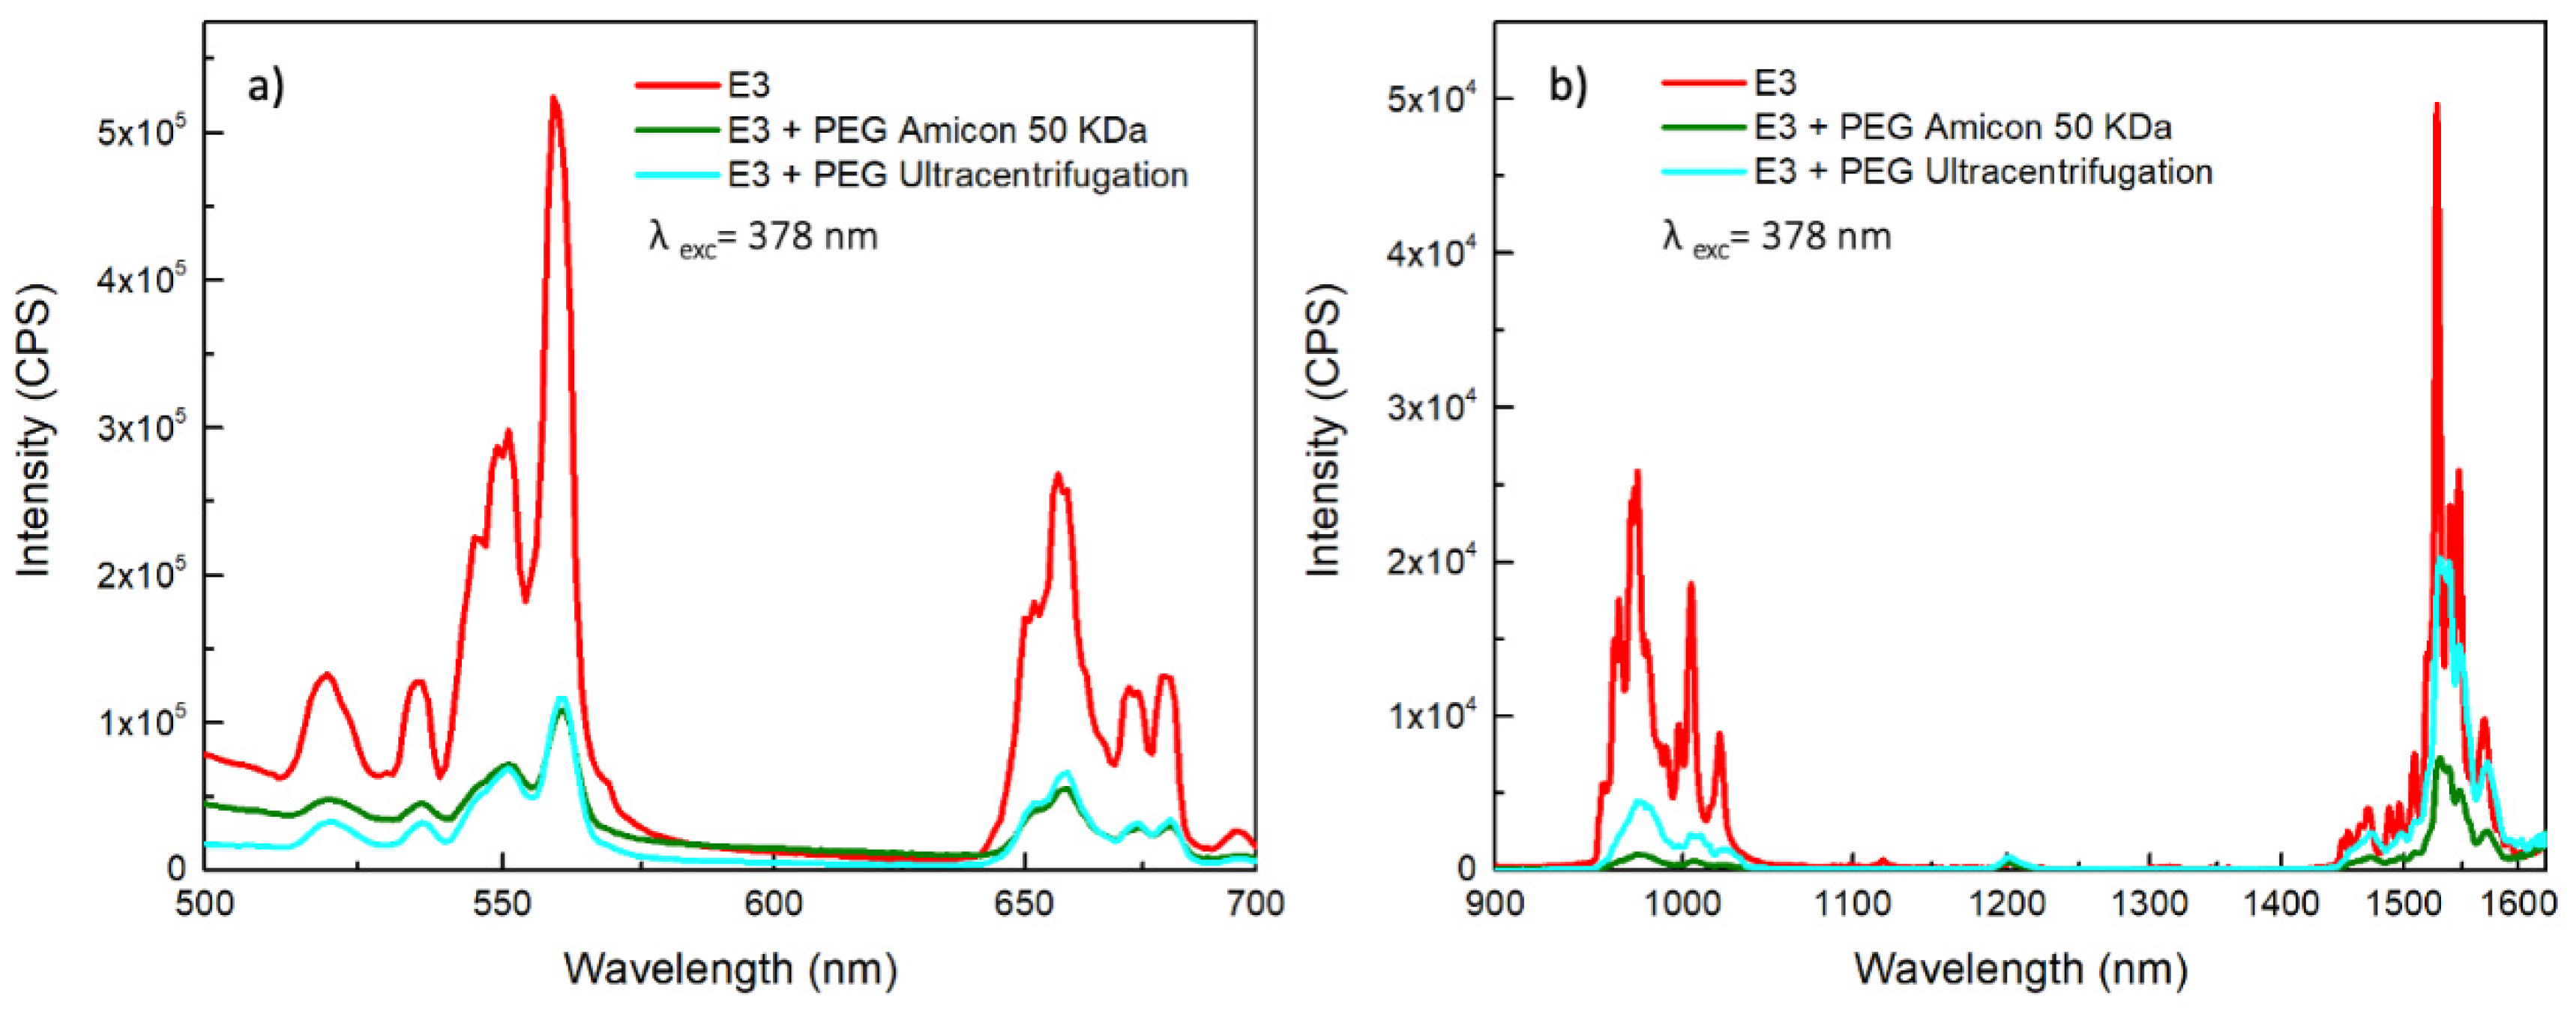
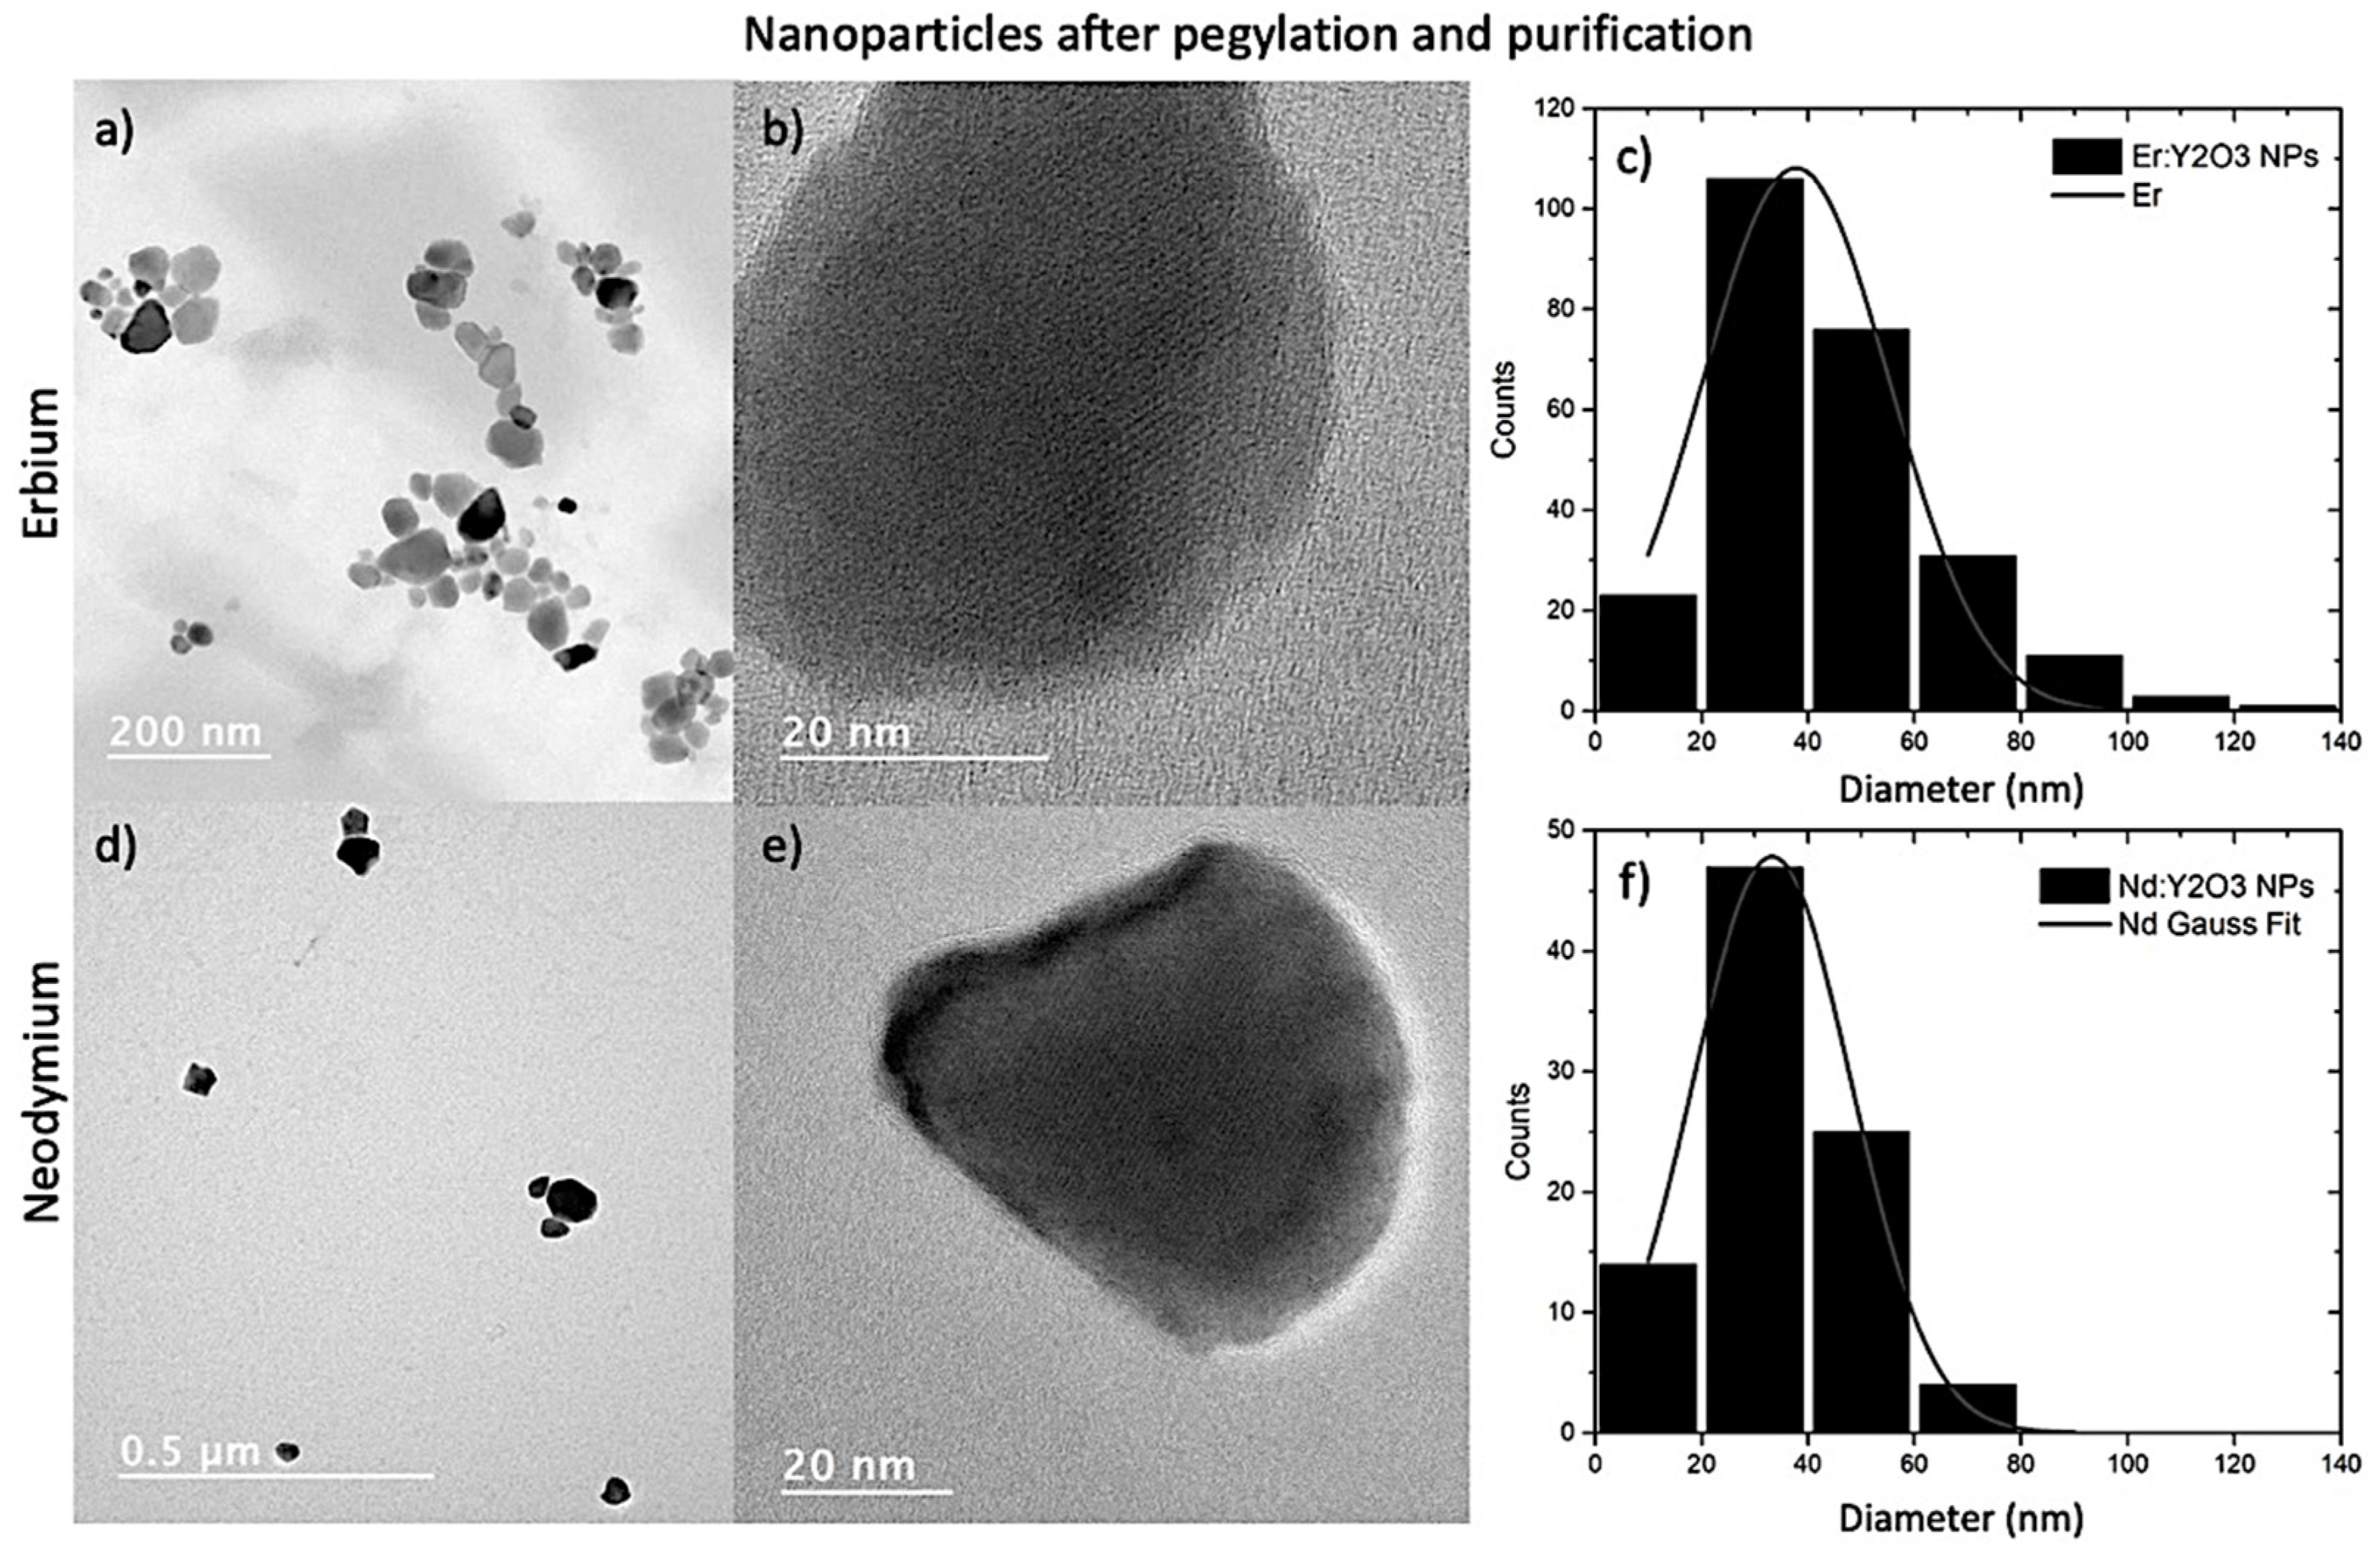
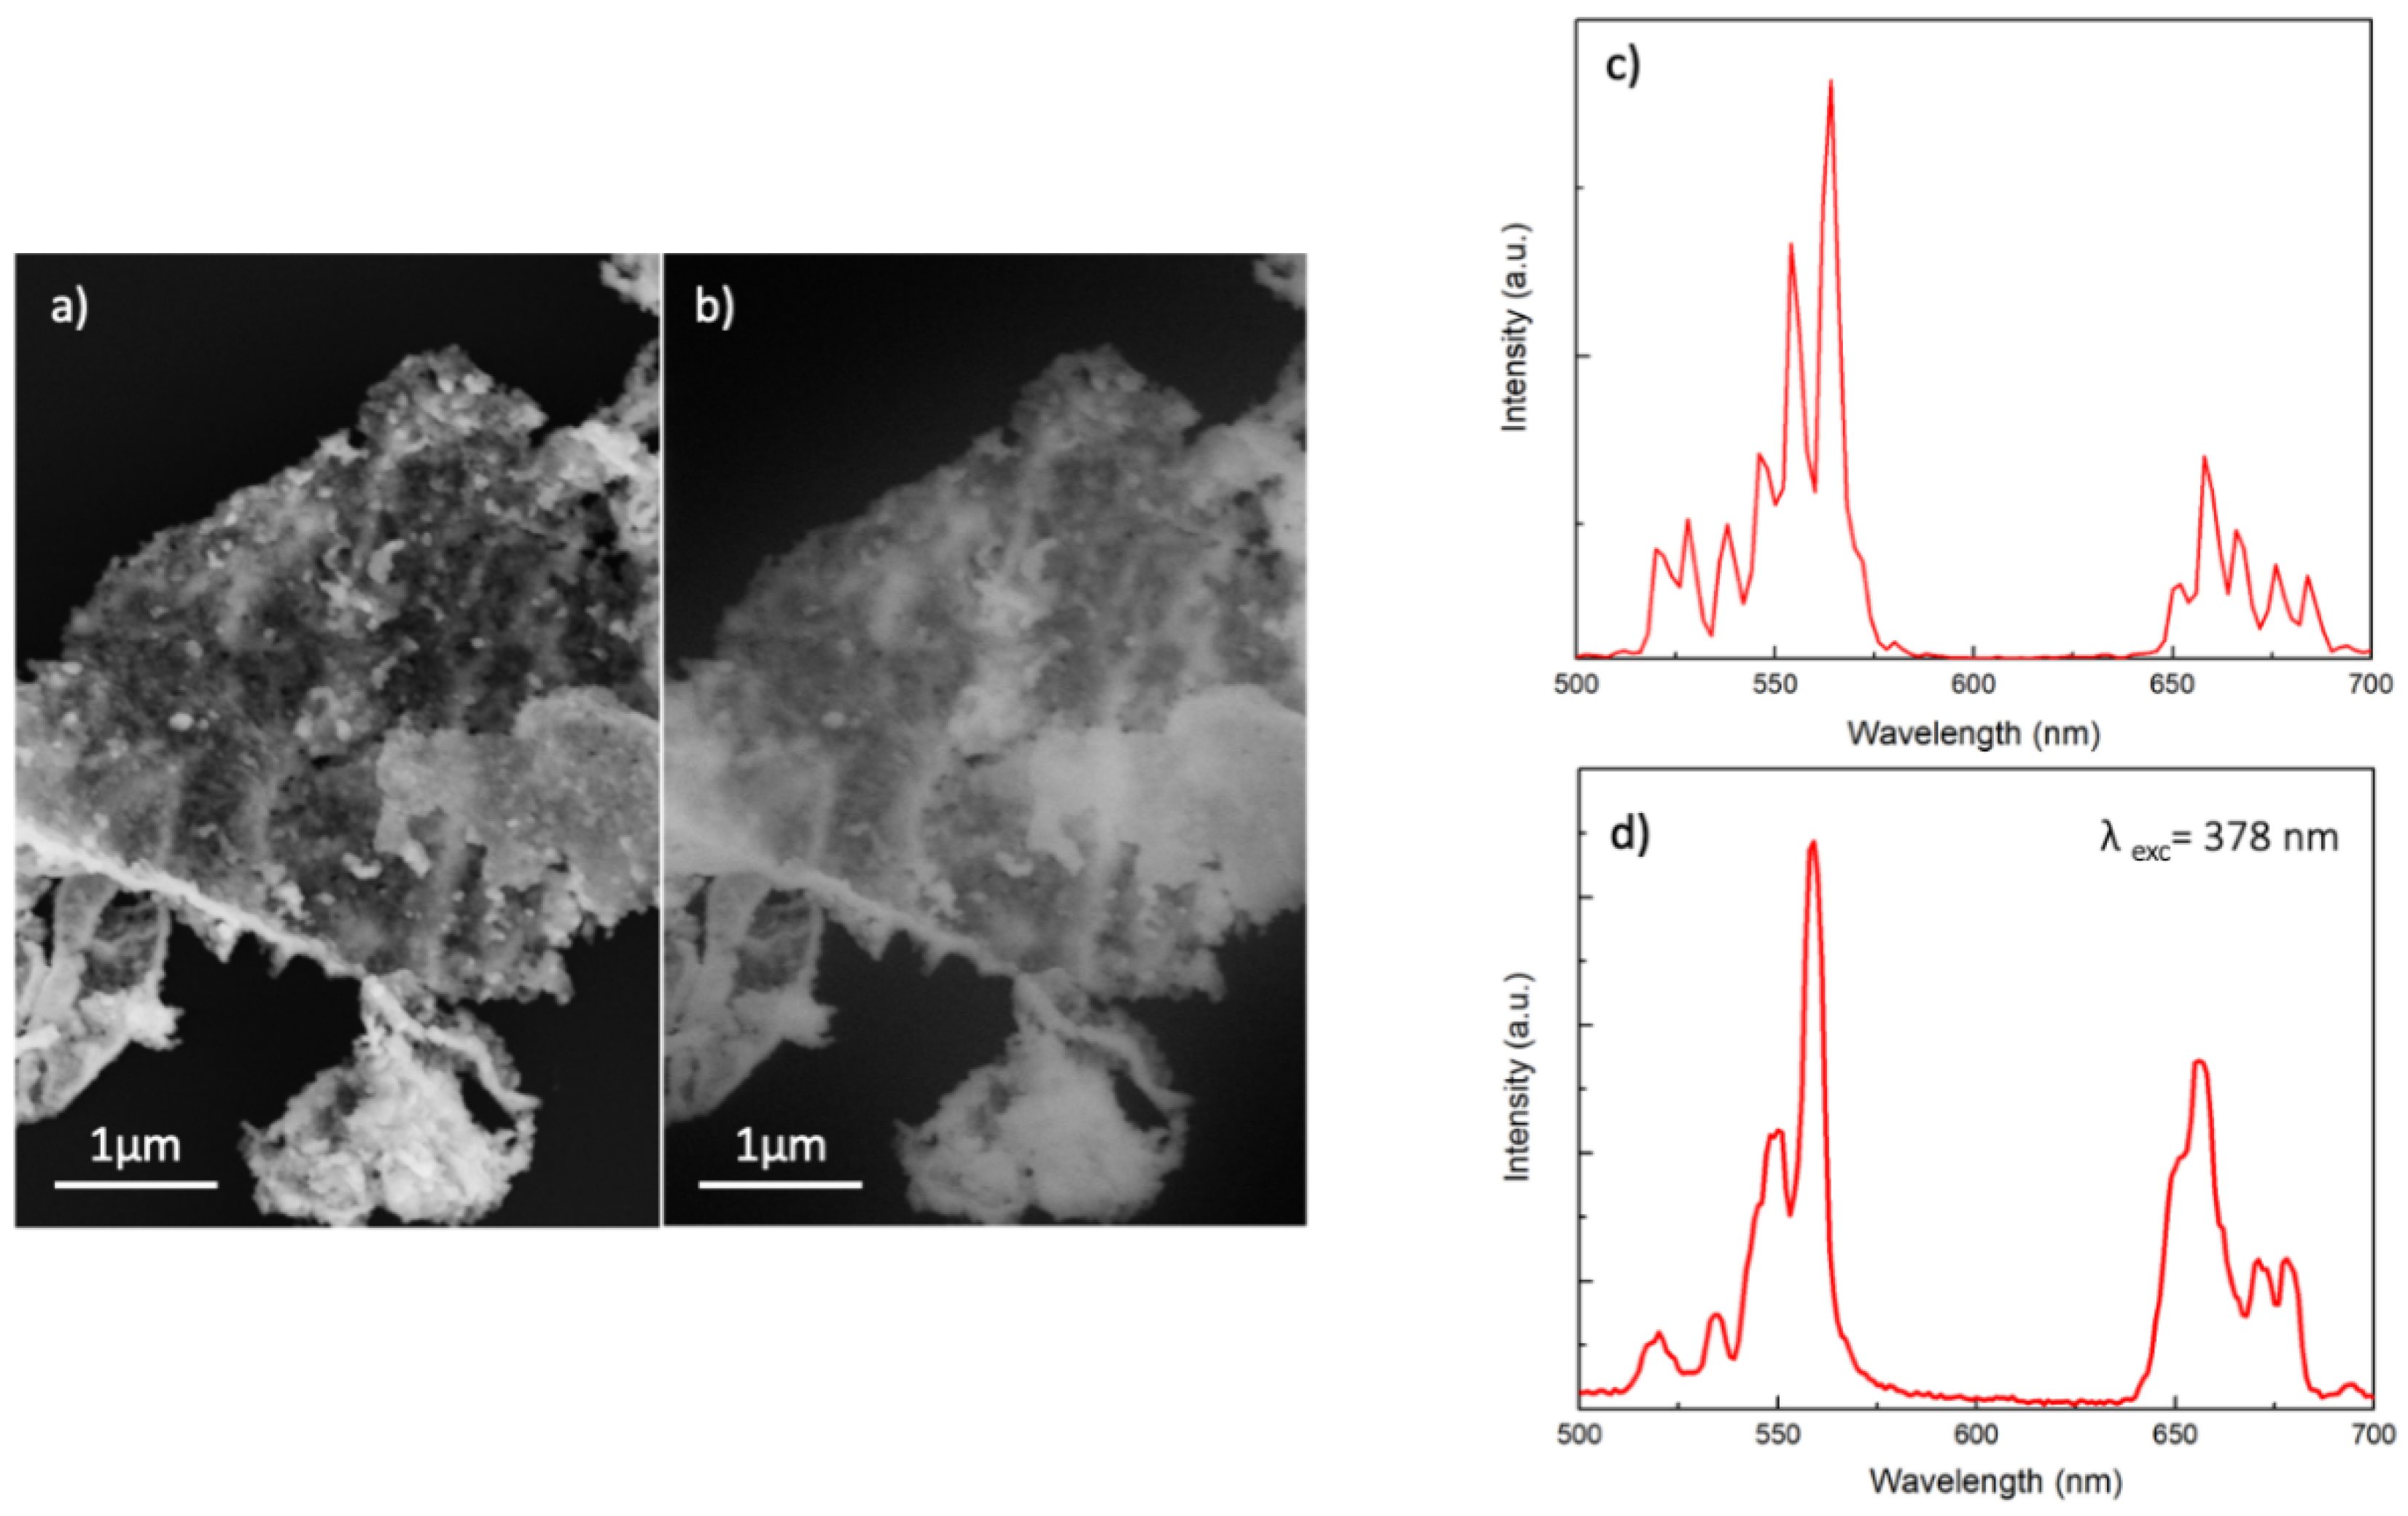
3. Results and Discussion

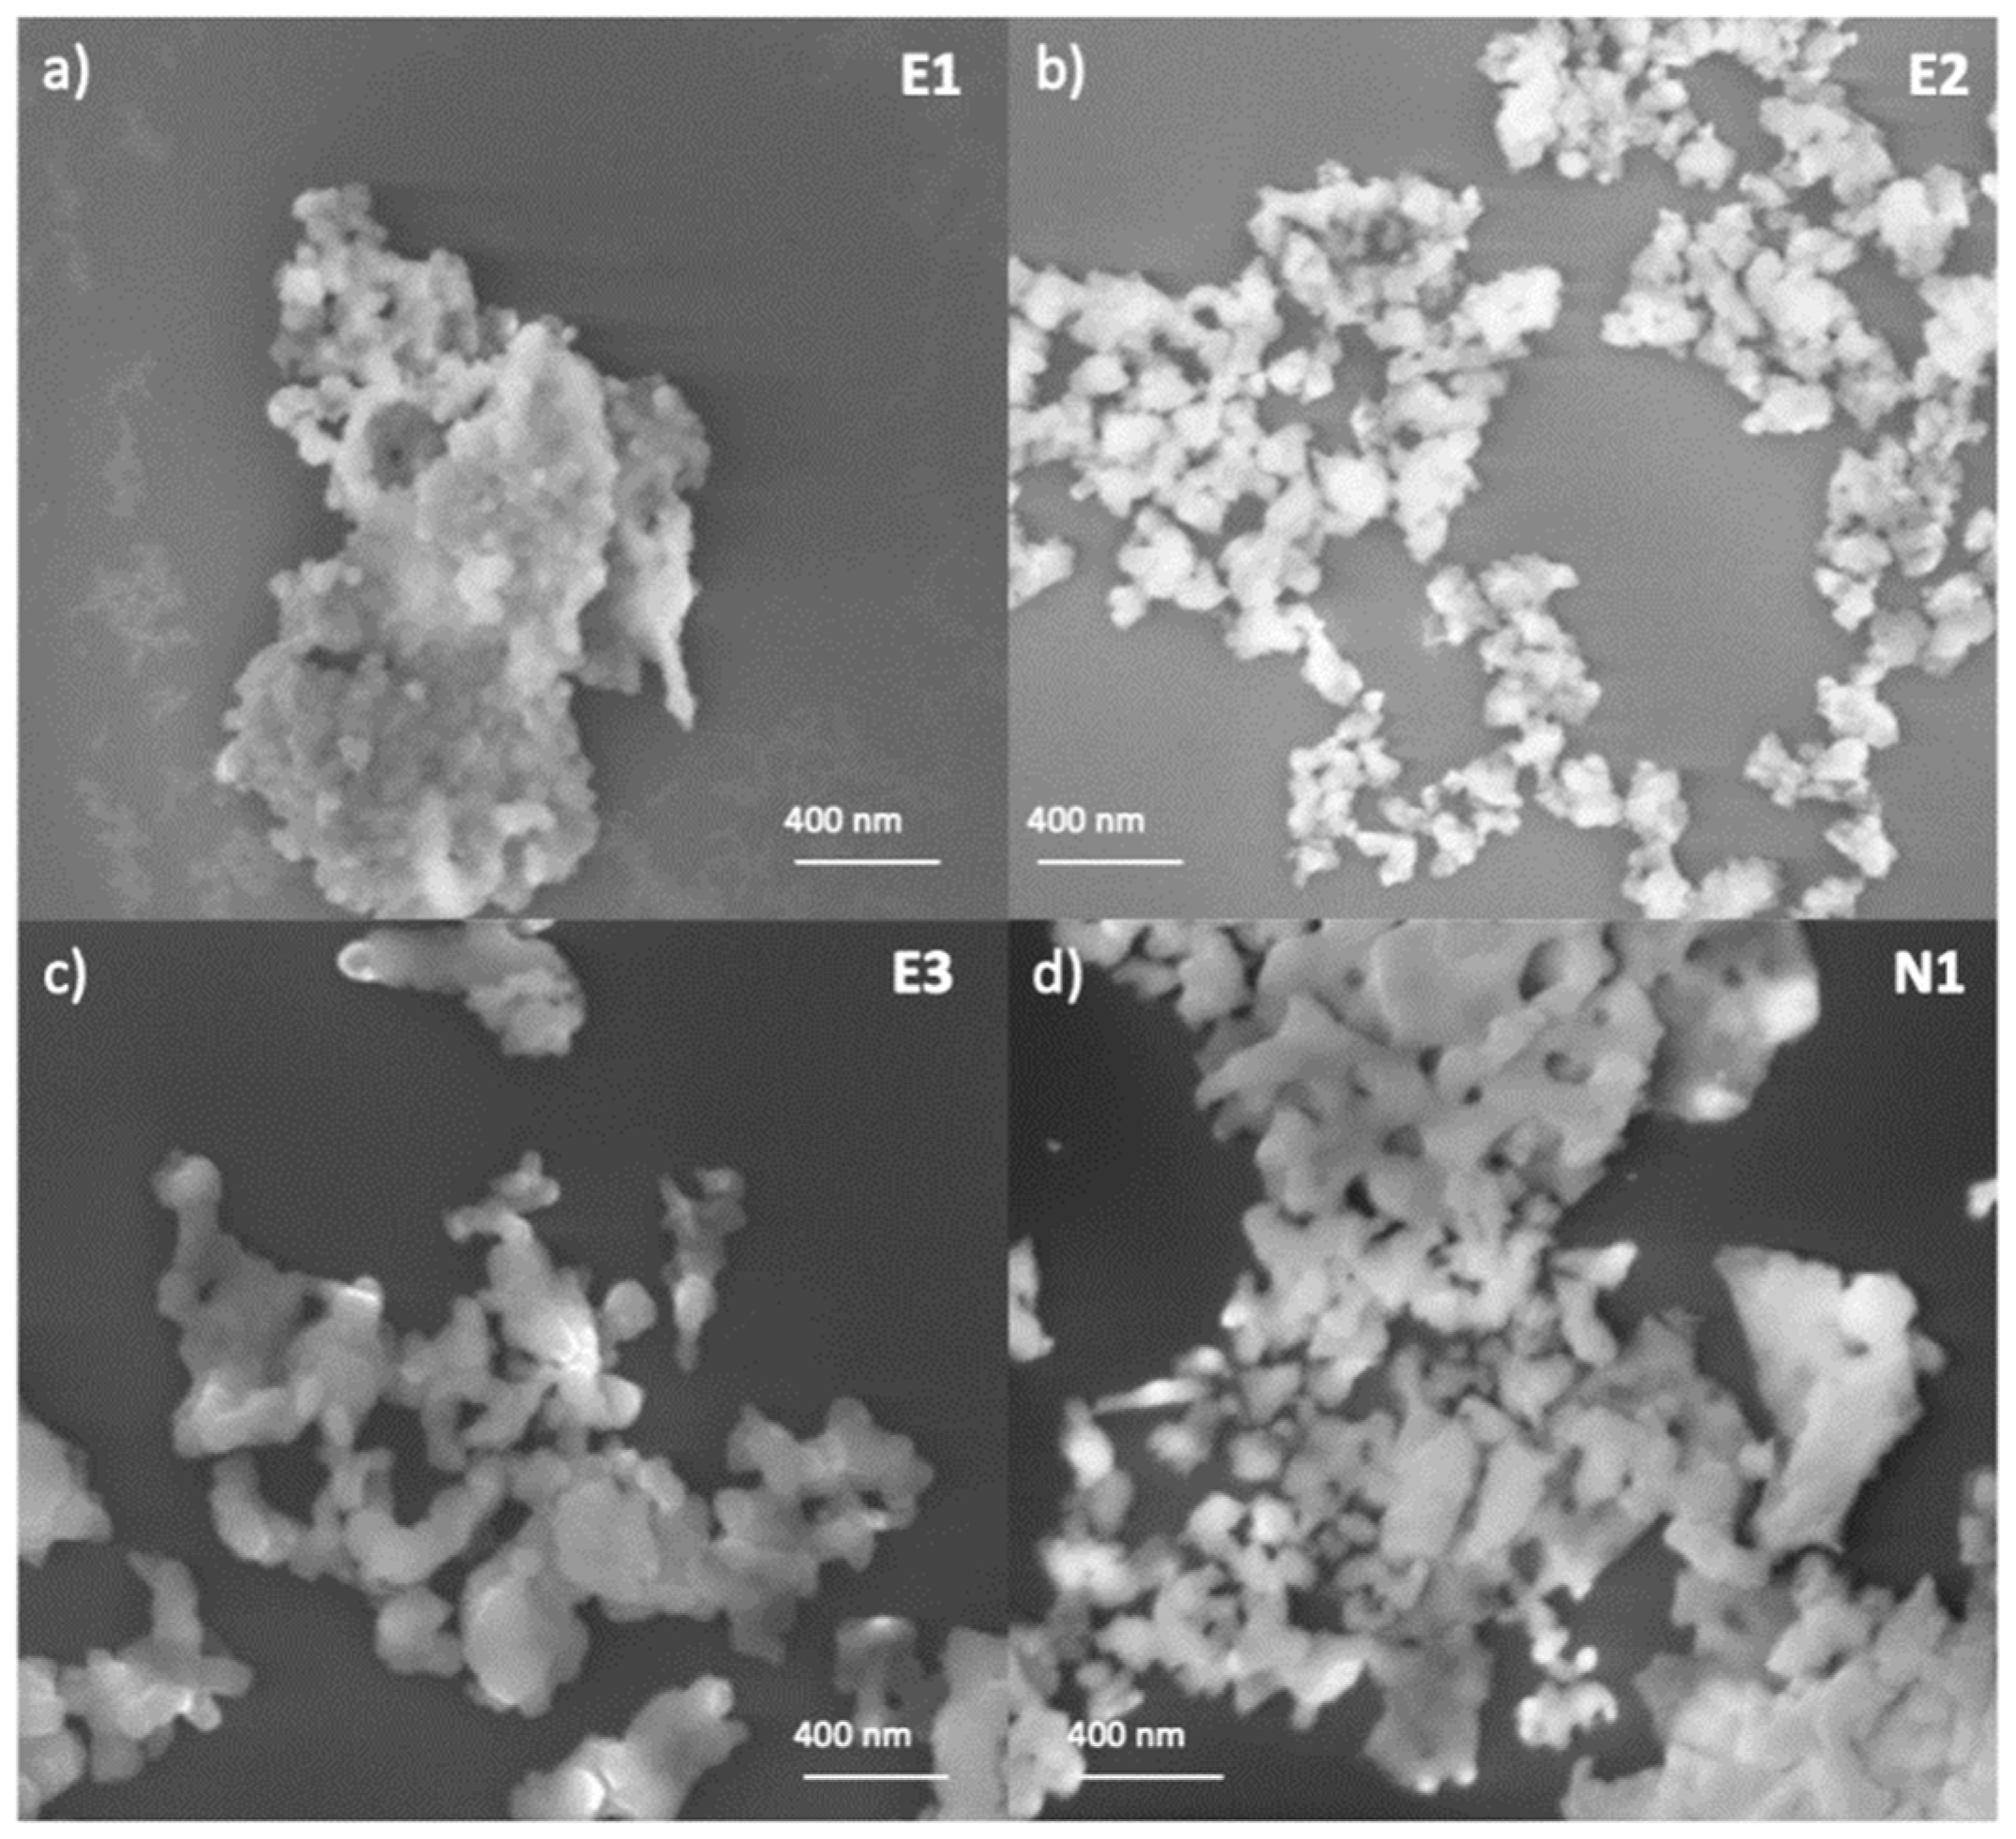
3.1. Synthesis of NPs

In order to obtain doped yttrium oxide NPs of small dimensions with good reaction yields, three different synthetic pathways for erbium-doped NPs were used and compared. In all cases, an alkaline environment was used to promote the precipitation of the hydroxides that, after an appropriate thermal treatment, produced the corresponding oxides. The three syntheses are described in detail in the Section 2.
To avoid the formation of large dimension NPs, Synthesis 1 and 2 were both carried out at room temperature, in the first case by following the procedure reported in Ref. [21], that is, causing the hydrolyzing of urea by the enzyme urease, and in the second case by directly adding concentrated NH3 to the reaction solution, obtaining the samples E1 and E2, respectively. On the other hand, Synthesis 3 was carried out according to Venkatachalam, N. et al. [22] by heating the solution to 80 °C using PAAc as a template, thus obtaining the sample E3. The same procedure was used for neodymium-doped NPs to generate the sample N1. Table 1 shows the yields of the reactions, and Figure 1 shows the SEM microphotographs for all samples.
The SEM images clearly show that the Er:Y2O3 NPs are highly dispersed with dimensions of the order of a few tens of nanometers. This analysis indicated that the products were in the nanoparticle range as desired for their use with EVs. Thus, any synthesis carried out gave rise to particles of the correct dimensions. However, neither Synthesis 1 nor Synthesis 2 gave rise to satisfying results. In fact, even though precipitates with small dimension particles were obtained, in the first case the yield was very low (Table 1) and in both cases the reaction times were extremely long (1–2 weeks).
The obtained results are puzzling. In fact, sample E1 was obtained [21] with a reaction time of 2 h, and sample E2 was supposed to be obtained very quickly because of the high concentration of ammonia added to the solution. The experimental precipitation times actually observed for Synthesis 1 were likely due to the fact that the decomposition rate of urea by urease was different from that which was expected, generating only a low release of ammonia. In Synthesis 2, the observed times were likely due to the fact that, since ammonia is a gas, it moves away from the solution, failing to guarantee the necessary oversaturation.
Synthesis 3, on the other hand, using PAAc as a template, as reported in Ref. [22], gave rise to a good yield in a very short time. The use of both natural and synthetic polymers to direct a synthetic path is a well-acknowledged procedure to obtain NPs [25,26,27,28,29,30,31,32]. In fact, the presence of a polyanionic ionomer, such as poly(acrylic acid), influences both the nucleation process and the subsequent stage of nanoparticle growth, obtaining mono distributed particles of regular shape. The reason for this is that the COOH side chain protonates (COOH) at a pH ≤ 5 and deprotonates (COO) at a pH > 5. Thus, in aqueous media of an appropriate pH and ionic strength, the carboxylic groups ionize and develop fixed charges on the polymer network. The polymer can act as a capping agent, generating electrostatic repulsive forces that limit uncontrolled NP growth. Moreover, PAAc is a biodegradable polymer, and it is effectively removed from the precipitate by the subsequent thermal treatments. Given the good results obtained for the Er-doped NPs with PAAc assisted synthesis, the same procedure (synthesis 3) was adopted for the analogous system doped with Nd, obtaining the sample N1. Moreover, in this case, the SEM micrograph (Figure 1d) showed that the Nd:Y2O3 NPs were highly dispersed with dimensions of the order of a few tens of nanometers.

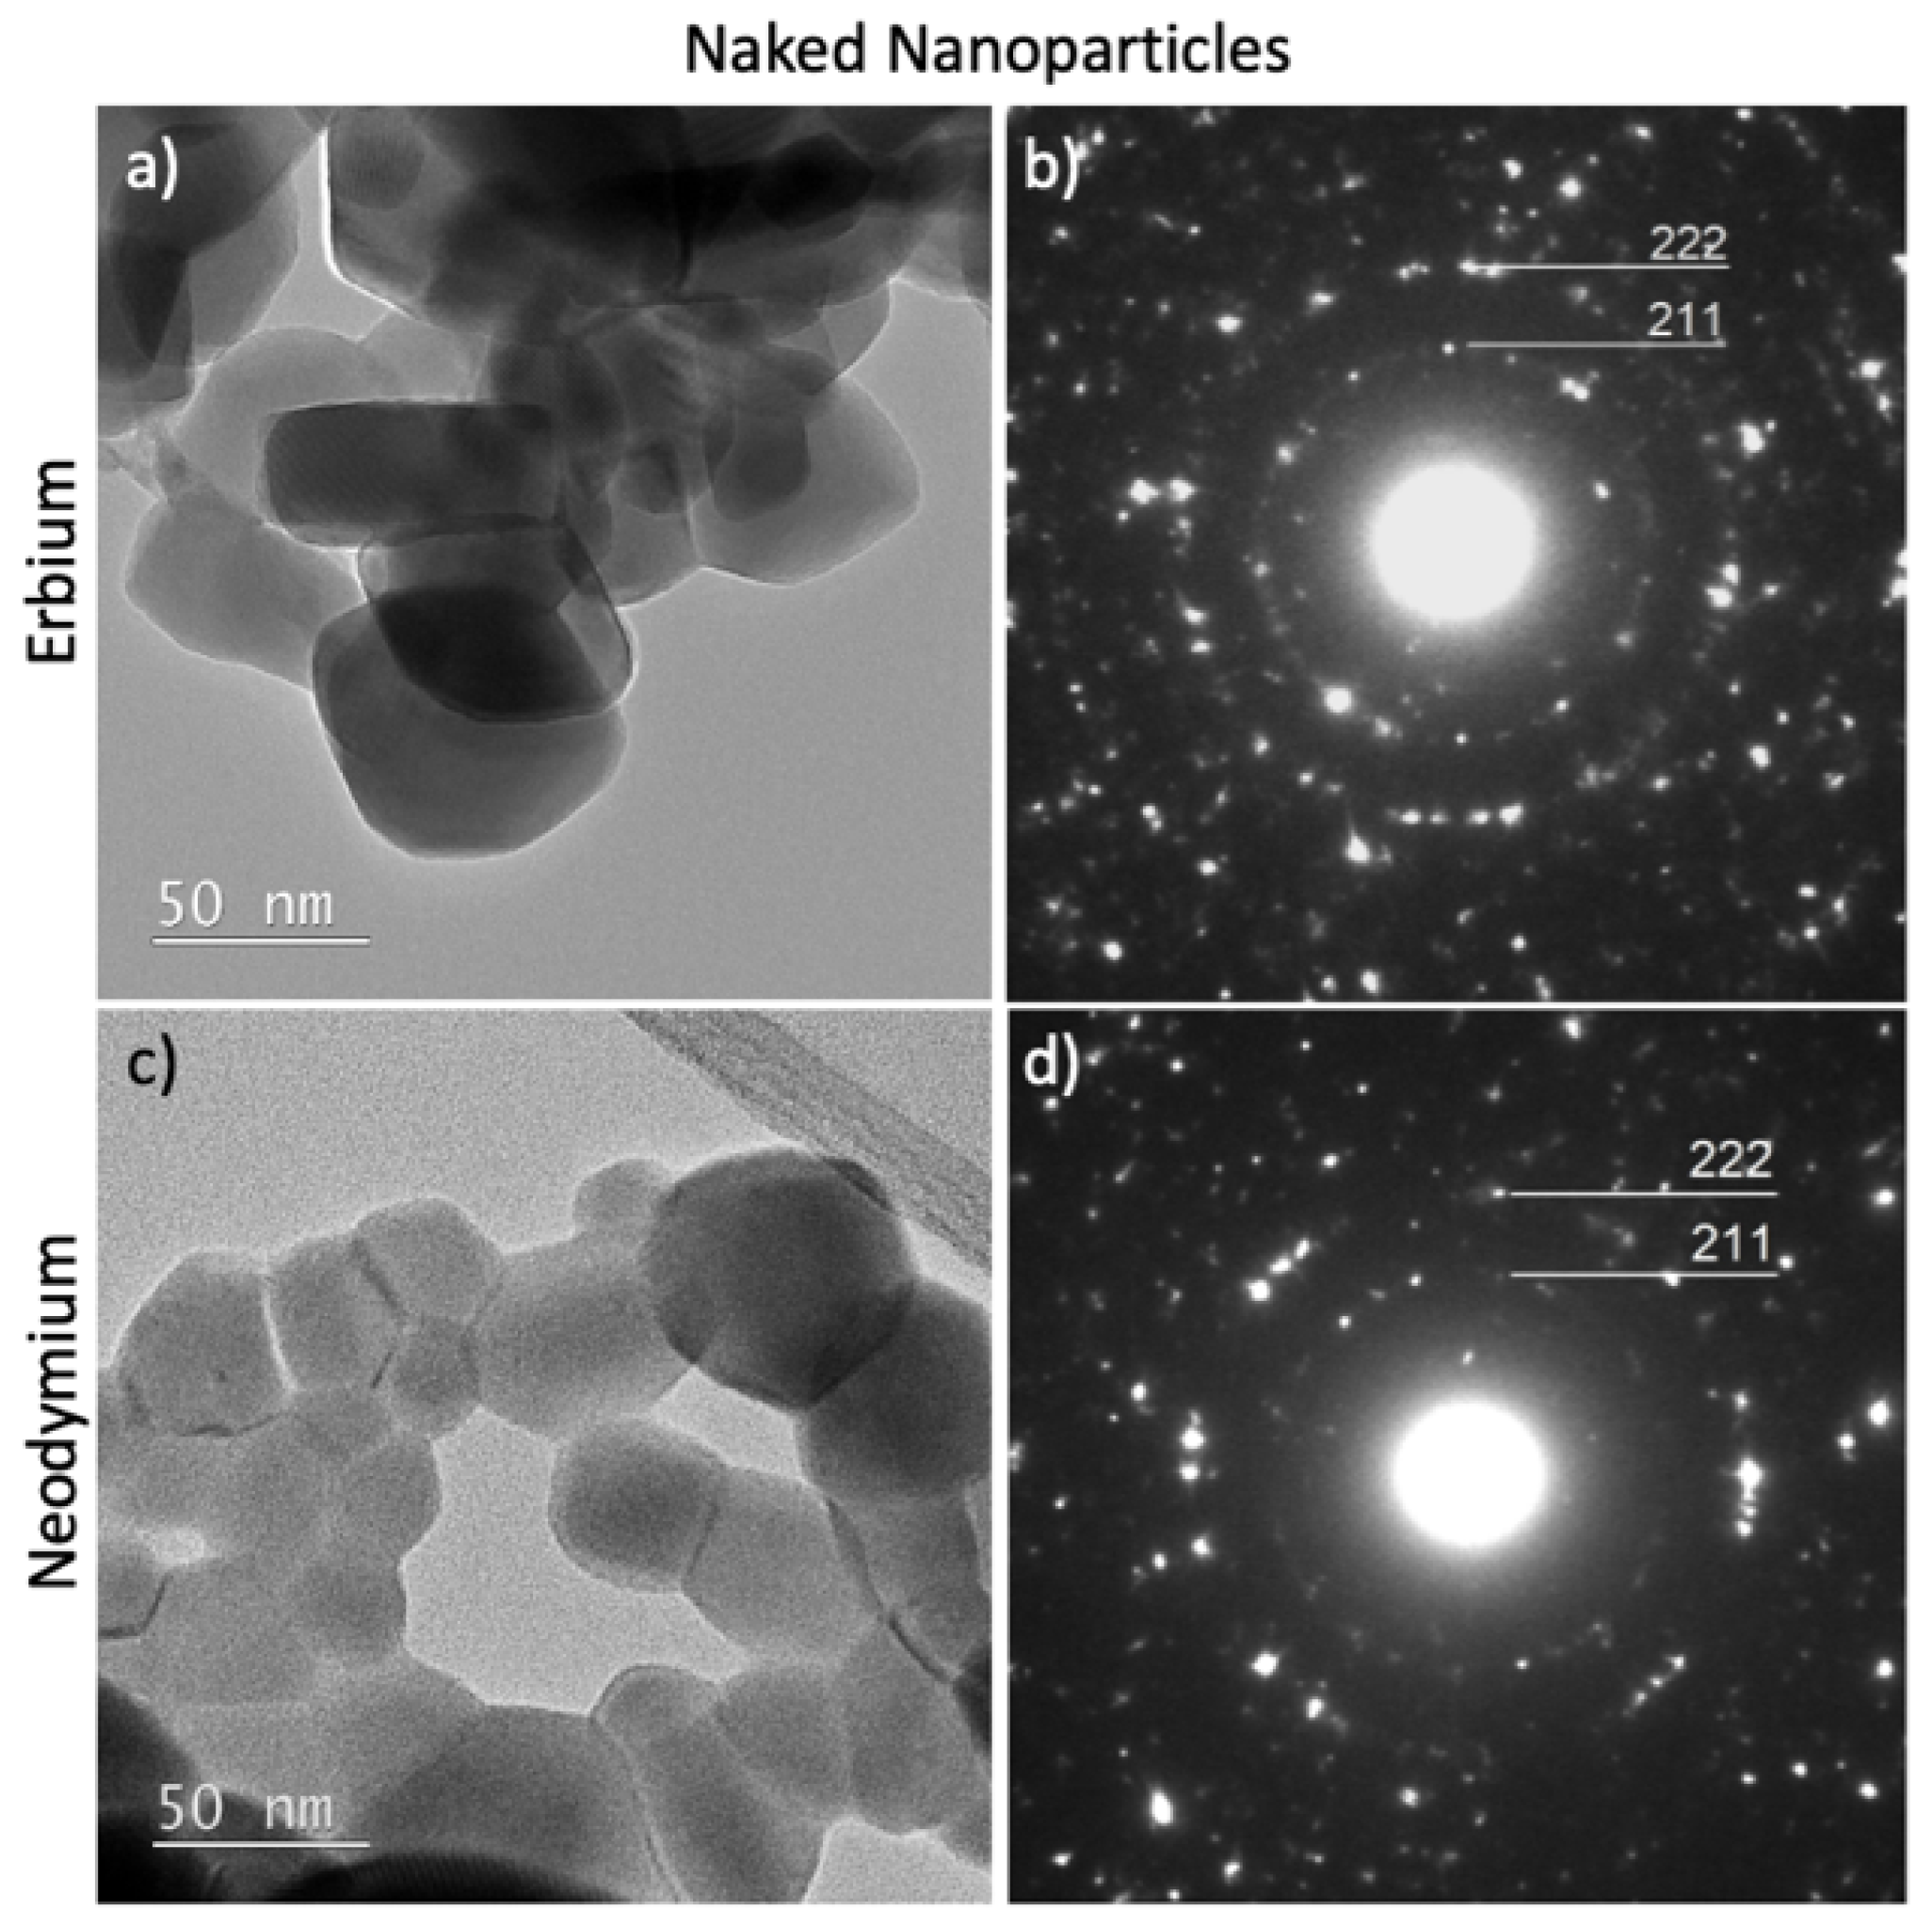
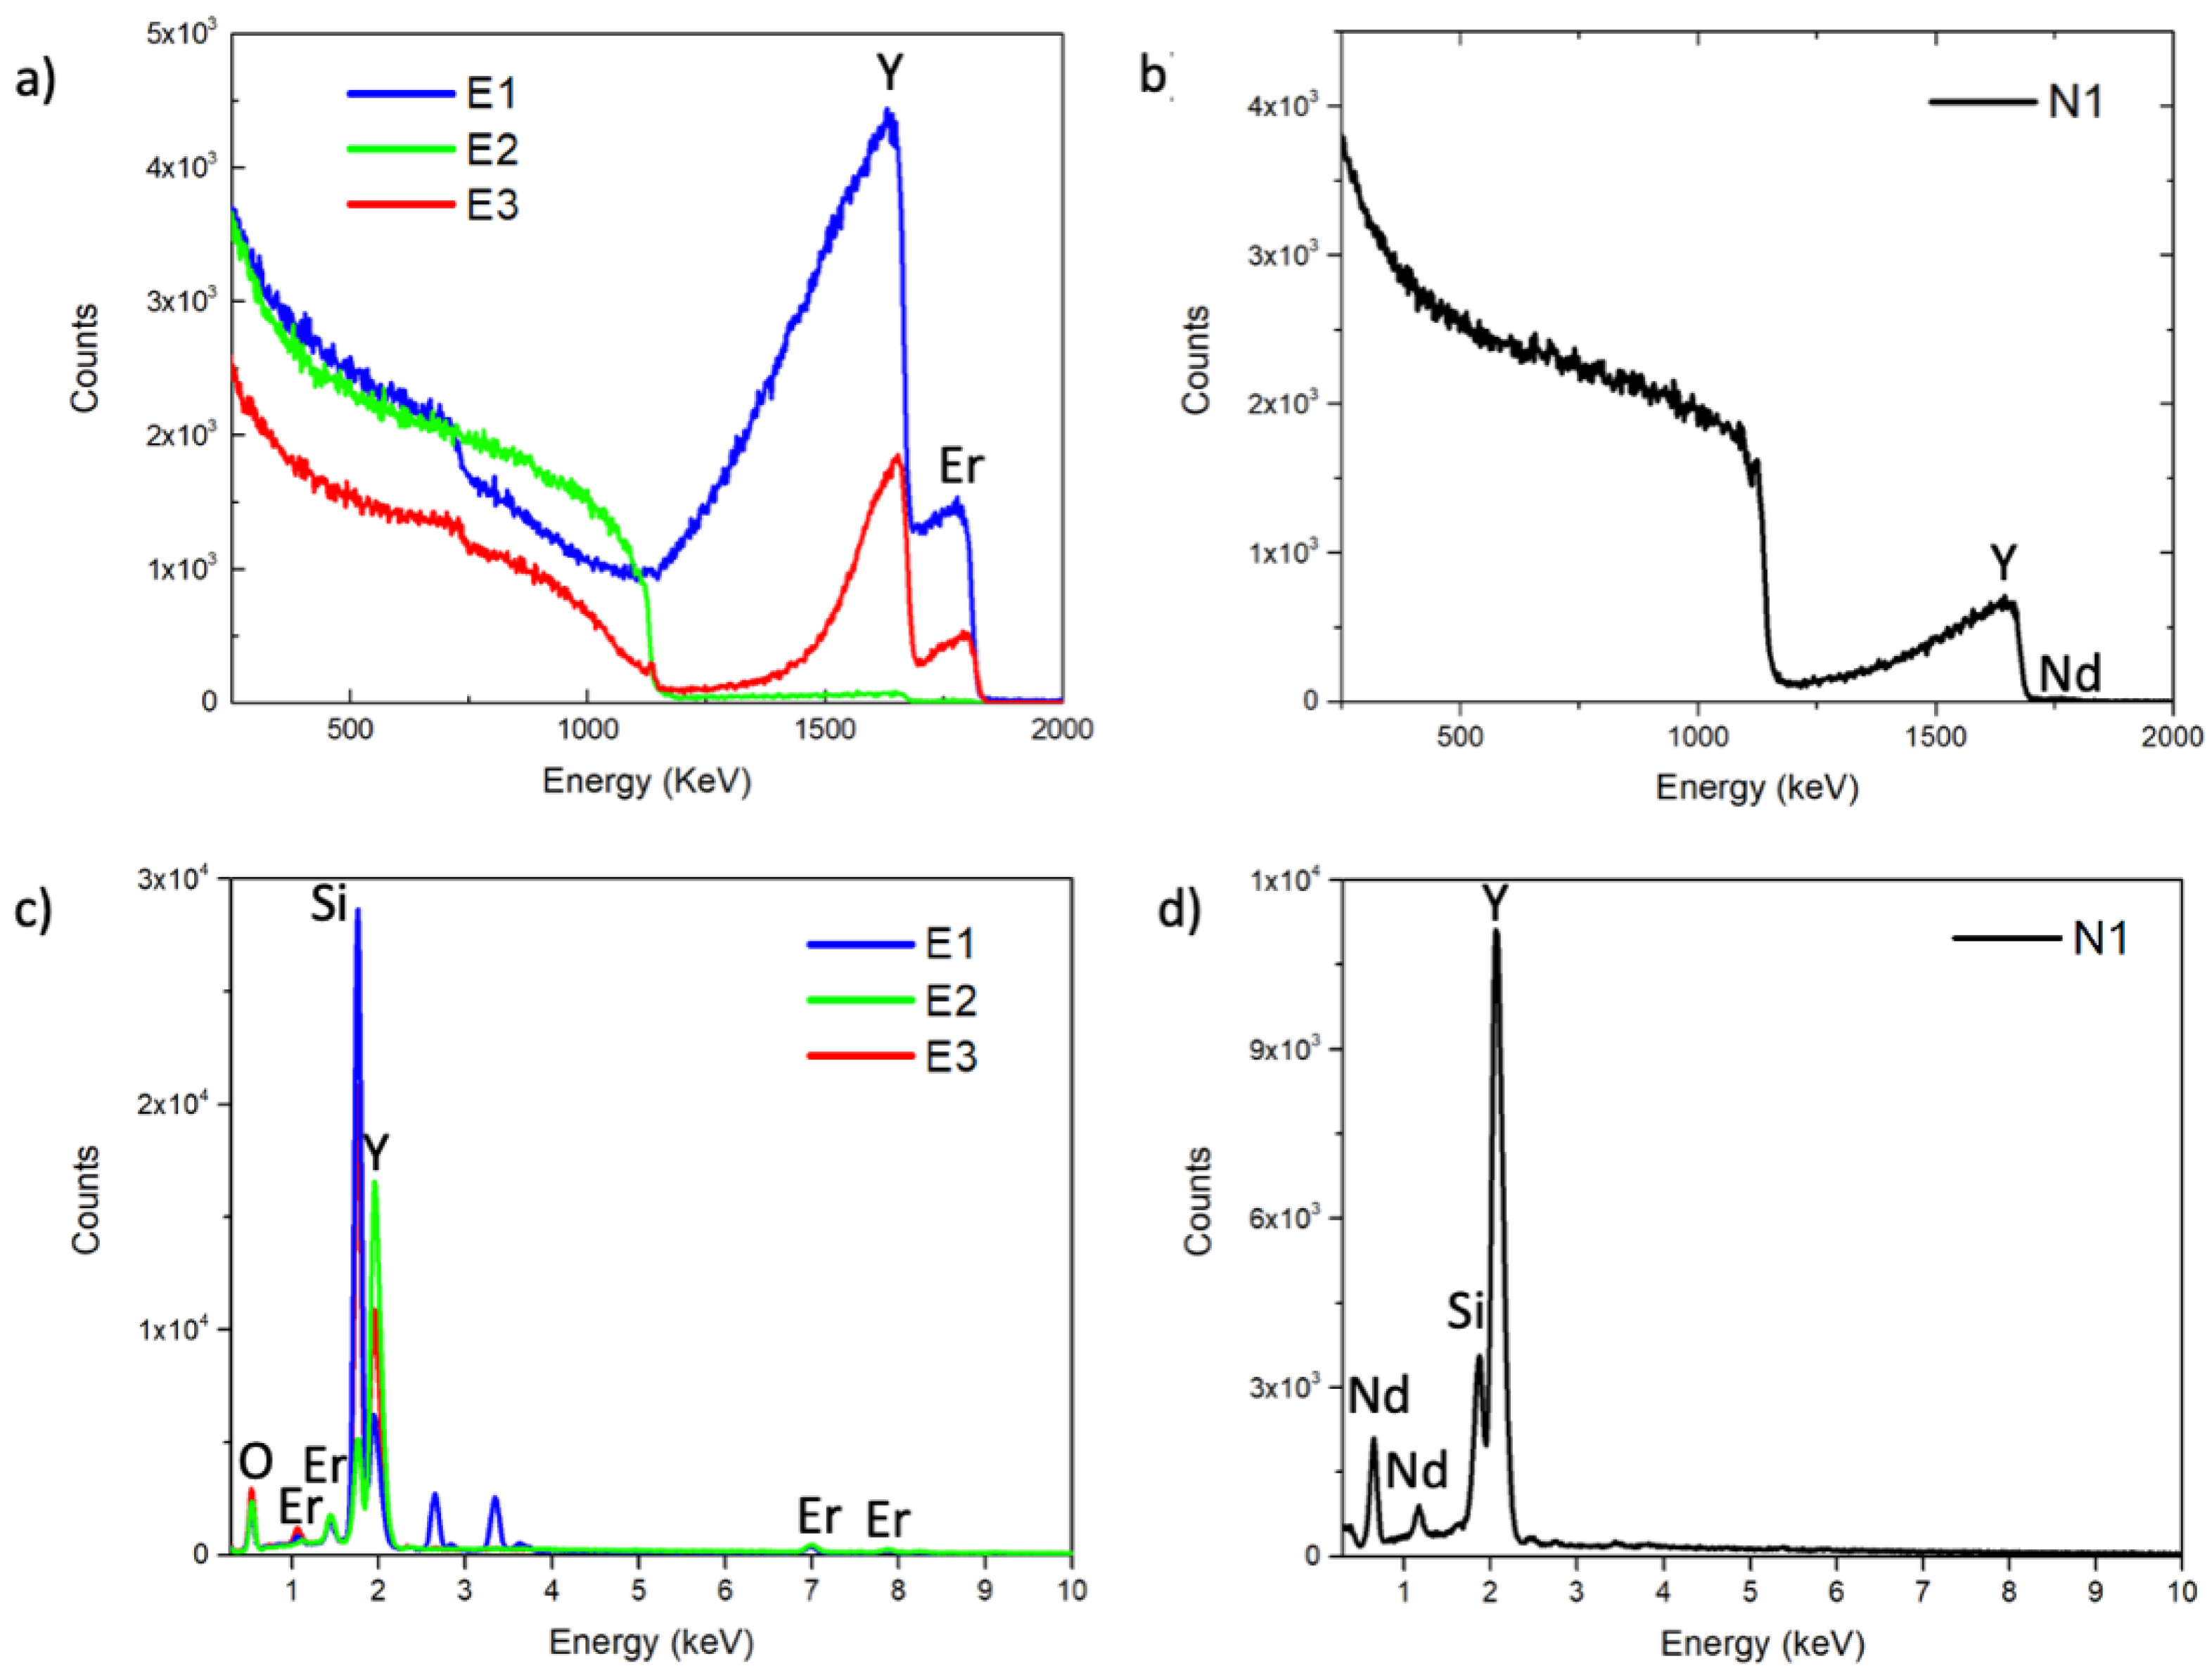
3.2. Structural and Compositional Characterization of NPs

Figure 2 shows the TEM microphotographs and the related diffraction patterns for samples E3 and N1. For both samples, the electron diffraction patterns confirm that the cubic structure is the main crystallographic phase present in the sample, as displayed in Figure 2. For both samples, the lattice parameter resulting from the electron diffractions is of approximately 10.65 Å. Furthermore, the XRD spectra (Figure S1) display the XRD patterns of the Er:Y2O3 and Nd:Y2O3 NPs. The characteristic diffraction peaks of the samples are a good match with the conventional cubic Y2O3 phase with space group Ia-3 (PDF Card No.: 00-079-1256). The calculated lattice constants are 10.58 Å and 10.59 Å for the Er:Y2O3 and Nd:Y2O3 NPs, respectively. These values are in agreement with the one reported in the card (10.60 Å) and with the one calculated from the electron diffraction patterns.
The compositional analysis of samples E3 and N1 was carried out using RBS and EDX techniques. Figure 3a,b show RBS spectra acquired for NPs doped with erbium and neodymium, respectively. The peaks of yttrium and erbium were identified, while the peak of oxygen is barely visible as the backscattering yield is quite low for light elements. The signal at lower energy levels is related to the silicon of the substrate where the samples had been deposited. NPs deposited on a substrate present a significant surface roughness as well as aggregation problems leading to a density gradient [33]. This is clearly visible from the elemental peaks in the spectra, which, indeed, present a progressively decreasing yield with energy.
To overcome this, we used the software simNRA, modeling the sample as three different layers of Er:Y2O3 with decreasing areal densities in terms of yttrium and erbium. The silicon substrate was present both as a superficial element and as a substrate to account for parts of the substrate not covered by the NPs.
Since the oxygen peak cannot be detected in the spectra, its areal density was calculated assuming the stoichiometric ratios of elements inside the sample. The same procedure was also carried out for neodymium-doped NPs. The results of these analyses are reported in Table 2.
The data in Table 2 show that, excluding sample E1, which has an Er/Y value much higher than the expected one, samples E2 and E3 have an Er/Y ratio only slightly higher than the theoretical one (Er/Y = 0.07). In the case of the particles doped with neodymium, the analysis of the RBS spectra (Figure 3b) simulated with the simNRA program highlighted a value of Nd/Y slightly higher than the expected value (Nd/Y = 0.0075). Nonetheless, the total value of Nd was slightly lower than expected (0.5%).
Figure 3c,d show the EDX spectra of erbium-doped NPs obtained by the three different syntheses and EDX spectrum of neodymium-doped NPs, respectively, whereas the corresponding primary data are reported in Table 2.
In the quantitative analysis, performed for the EDX measurements, the spectra were processed to remove background (bremsstrahlung radiation) and spectral artifacts; the characteristic X-rays were then compared with the data of the standards libraries. Through this type of analysis, it is possible to identify the elements from the energy of the peaks and obtain the atomic and weight percentages. Furthermore, in this case, the values obtained differ from those expected with a discrepancy comparable to the values obtained with RBS.
In the EDX spectra, unlike the spectra in RBS, the signals of silicon and oxygen (which include both those associated with Y2O3 and the silicon oxide used as a support) are present.
The EDX measurements did not allow us to make an accurate estimate for the N1 sample, given that the dopant percentage was close to the detection limit of the technique (LOD 1%). Nevertheless, the technique and the associated calculation algorithms managed to detect a small concentration, which appeared to be close to that obtained by RBS. The small discrepancies found between the stoichiometric ratios in the starting solutions and the results obtained by compositional analyses for samples E2 and E3 fall within experimental error. For sample E1, which had a higher value than expected, the discrepancy found could be due to the presence of precipitation phenomena stabilized from a kinetic point of view, which would ensure that the precipitate obtained is enriched with respect to the dopant with the loss of the stoichiometric ratio that had been achieved initially.
The systems were also characterized by photoluminescence measurements. In order to find the proper excitation wavelengths, 2D photoexcitation maps were measured for both the Er:Y2O3 NPs and Nd:Y2O3 NPs (see Figure S2 in the Supplementary Materials). The PL spectra for the Er-doped NPs, E1, E2 and E3, are reported in the visible and IR range in Figure 4a,b, respectively. For all samples, the typical peaks of erbium are present in the visible region at approximately 550 nm and 660 nm, arising from electronic transitions 4S3/24I15/2 and 4F9/24I15/2, respectively, and in the infra-red region at 980 nm and 1522 nm, arising from the electronic transitions 4I11/24I15/2 and 4I13/24I15/2, respectively. Since each spectrum was obtained from an average of three measurements on the same sample and all the measurements were carried out under the same conditions and during the same day, it is also possible to compare the intensities. In particular, it is possible to note how the NPs synthesized by procedure (3) present a higher fluorescence intensity, especially in the IR range. This increase could be attributed to a lower defect density in the NPs due to the different mechanism of nucleation and growth in synthesis 3. Figure 4c shows the PL spectrum for Nd:Y2O3. The most intense emission band was observed at 1064 nm, due to the transition 4F3/24I13/2. Furthermore, a manifold at approximately 946 nm was observed, due to the transition 4F3/24I9/2.
The PL spectra clearly show that both Er:Y2O3 and Nd:Y2O3 NPs possess the luminescence properties required. Furthermore, as shown in Figure 5, Er:Y2O3 upconversion luminescence is also demonstrated.

3.3. Pegylation of Er:Y2O3 and Nd:Y2O3 NPs

However, the more challenging goal in this field of research is to obtain ceramic nanophosphors with good upconversion properties that are maintained after their functionalization. In general, when introduced into biological fluids, every kind of nanoparticle is recognized as a foreign object and thus are readily cleared from systemic circulation by the cells of the mononuclear phagocyte system (MPS), precluding accumulation in target cells and tissues [18]. In addition, Er:Y2O3 and Nd:Y2O3 are ceramics, i.e., insoluble as well as highly inert materials, and thus their use in biological fluids to label specific targets is practically impossible. The pegylation procedure is a well-acknowledged process for the functionalization of systems such as proteins and peptides used in drug delivery that are usually rapidly degraded and cleared from the blood stream and thus necessitate ad hoc approaches for increasing their circulation time. One such approach is to coat the surface of the therapeutic agent with an inert polymer that resists interactions with components of the blood stream, imparting “stealth” properties. Analogously to what has been observed with PEGylated proteins, PEG coatings on NPs shield the surface from aggregation, opsonization and phagocytosis, thereby prolonging the circulation time. In this specific case, pegylation also renders those materials that otherwise could not be used soluble and biocompatible. The pegylation reaction is simple; a buffered solution of the polymer is mixed with the NPs [23]. The critical step is to accurately remove the excess PEG since it shows a wide emission spectrum in the visible region where it covers sharp lanthanide peaks. For this purpose, the solution containing the NPs and the unreacted PEG was split into two aliquots that were ultracentrifuged or ultrafiltered. The two processes are based on the same factor, that is, the difference between the dimensions of the pegylated NPs and the free polymer that obviously gives rise to different densities. Thus, in the first case, by using an ultracentrifuge and applying the right degree of acceleration, it is possible to allow the sedimentation of the pegylated NPs and remove the supernatant containing the unreacted polymer. On the other hand, the ultrafiltration process is a variety of membrane filtrations in which forces such as pressure or concentration gradients lead to a separation through a semipermeable membrane. In this case, the force driving the separation is still provided by the centrifuge, even though it is used to provide a much lower acceleration, thus making ultrafiltration processes more affordable even in laboratories that are not advanced. In order to optimize the purification carried out by the ultrafiltration process, two different typologies of membranes with many different pore sizes were used and, to select the best ultrafiltration device, PL spectra were generated on the purified pegylated core/shell NPs and compared with those of the core spectra. The best results were obtained with the Amicon 50 kDa. For further details, see Figure S3 in the Supplementary Materials. Furthermore, as shown in Figure 6, the photoluminescence spectra are in both cases (pegylated NPs purified by ultrafiltration and by ultracentrifugation), almost comparable to each other, thus making the two methods equivalent.
The pegylated core/shell NPs were characterized by the same techniques used for the core ones. In particular, it is interesting to see that pegylation results in well-dispersed particles, and thus it was easier to accomplish the task of studying their morphologies. The TEM microscopies were carried out on both Er-doped and Nd-doped NPs after pegylation and purification (Figure 7). The TEM, the HR-TEM details and the related distribution for the purified E3 NPs are reported in Figure 7a–c. Pegylation results in highly dispersed NPs and prevents their agglomeration, with them exhibiting sharper outlines, and thus it is possible to make a statistical analysis of the size of NPs using the ImageJ software. The diameter of each nanoparticle of image 7a was measured, assuming that they were spherical, and all the values were plotted as a histogram (Figure 7c). The Gaussian fit distribution of the Er:Y2O3 NPs diameter was 37.7 ± 17.5 nm.
The TEM micrographs, the HR-TEM detail and the related diameter distribution for PEG Nd:Y2O3 are reported in Figure 7d–f, respectively. Moreover, in this case, the Gaussian fit reported a diameter of 33.2 ± 14.9 nm. Thus, the dimensions of both pegylated Er:Y2O3 and Nd:Y2O3 NPs are in the same range. Raman analysis (not shown here) showed no noticeable structural changes before and after pegylation.
Furthermore, in order to determine the surface charges of the investigated systems, ζ-potential measurements were carried out, and the corresponding graphs are reported in Figure S4 in the Supporting Materials. The ζ-potential of both core Er- and Nd-doped Y2O3 NPs was approximately +20 ± 7 mV, in agreement with the literature [23,34], whereas the ζ-potential of the corresponding pegylated core/shell NPs was close to zero (−1 ± 6 mV and +1 ± 6 mV for Er:Y2O3 and Nd:Y2O3, respectively), as already reported by Kamimura et al. [23]. These results suggest that the PAAc segment in the block copolymer was adsorbed on the positive NP surface, allowing the tethered PEG segment, that is neutral, to be exposed from the surface to the aqueous environment.
The SEM images of Er:Y2O3 NPs obtained by secondary electrons (SE) and CL are reported in Figure 8a,b, respectively, where their optical and spatial correlation is well demonstrated.
Furthermore, by comparing the emission spectra obtained by electron beam excitation (Figure 8c) and photoexcitation (Figure 8d; λexc = 378 nm), the characteristic optical emissions, described in the PL spectra section, were observed in both cases; however, the CL emission spectrum had a higher resolution and showed more details.

4. Conclusions

In this paper, three different syntheses for Er3+-doped Y2O3 NPs based on enzymatic (urea/urease), ammonia and polymer-assisted growths were compared. The polymer-assisted method (0.4 M urea, nitrates of yttrium (4 mM) and erbium (0.3 mM) and 0.1 mM PAAc solution stirred for 1 h at 90 °C) was identified as the most feasible approach in terms of yield/time and the luminescence properties of the NPs and, hence, the same approach was also used for the synthesis of Nd3+-doped Y2O3. All the NPs were calcined in air at 1100 °C for 1 h to improve their crystallinity. The Er3+- and Nd3+-doped Y2O3 core NPs were then pegylated with PEG-b-PAAc, forming a core/shell structure, and then purified to improve their biological compatibility. The core and core/shell Er:Y2O3 and Nd:Y2O3 NPs were structurally and optically characterized, attesting an average diameter of approximately 38 and 33 nm, respectively. An in-depth study of the characterizations highlighted the unique properties of these systems, specifically the high crystallinity of both the core and pegylated core/shell NPs. The photoluminescence spectra showed the well-known characteristics of Er ions, with emission in the visible region in the 550 nm (4S3/24I15/2) and 660 nm bands (4F9/24I15/2) as well as in the infra-red region at 980 nm (4I11/24I15/2) and 1522 nm (4I13/24I15/2), also demonstrating the potential visible upconversion properties of erbium under 980 nm excitation. Similarly, Nd:Y2O3 showed the characteristic optical emission at the 1064 nm band (4F3/24I13/2). The structural and optical performances of Er:Y2O3 and Nd:Y2O3 NPs raise the prospect of future applications in the biomedical fields as optical diagnostic tools for phototherapy and for biosensing platforms.

Supplementary Materials

The following supporting information can be downloaded at: https://www.mdpi.com/article/10.3390/chemosensors11010020/s1, Figure S1: XRD patterns for (a) Er:Y2O3 and (b) Nd:Y2O3 NPs compared with the powder diffraction file ICDD 25-1011; Figure S2: Photoexcitation 2D maps of (a) Er:Y2O3 NPs and (b) Nd:Y2O3 NPs; Figure S3: PL emission spectra comparison in (a) visible and (b) IR range of pegylated Er:Y2O3 NPs, sample E3 after ultrafiltration using Amicon with a different pore size (λexc = 378 nm); Figure S4: Zeta potential charts of core (in black) and pegylated (in red) for (a) Er:Y2O3 NPs and (b) Nd:Y2O3 NPs.

Author Contributions

Conceptualization, M.J.L.F., A.C. (Annalinda Contino) and V.M.; investigation, R.M.C., R.R., P.M., M.J.L.F. and A.C. (Angela Caponnetto); data curation, R.M.C., R.R., M.J.L.F. and A.C. (Annalinda Contino); writing—original draft preparation, R.M.C., M.J.L.F. and A.C. (Angela Caponnetto); writing—review and editing, all authors participated; supervision, M.J.L.F. and A.C. (Annalinda Contino); funding acquisition, P.M., G.M. and C.D.P. All authors have read and agreed to the published version of the manuscript.

Funding

We thank University of Catania, PIAno di InCEntivi per la RIcerca di Ateneo—PIA.CE.RI. 2020/2022—linea 2—Pro-getto di ricerca intra-dipartimentale Phototeranostic and MIcrovescicle Recognition Nanostructures under electro-magnetic Activation for financial support. We acknowledge the European Project FSE-REACT-EU, PON Ricerca e Innovazione 2014-2020 DM1062/2021—contract 08-I-12485-2 for supporting this research.

Data Availability Statement

Data is contained within the article or Supplementary Materials.

Acknowledgments

The authors thank the Bio-nanotech Research and Innovation Tower (BRIT) laboratory of the University of Catania (Grant no. PONa3_00136 financed by the Italian Ministry for Education, University and Research, MIUR) for the fluorescence and the diffractometer facilities and are grateful to Vincent Dorcet for his assistance in TEM experiments performed on the THEMIS platform. We also thank Corrado Bongiorno for his assistance in the interpretation of TEM micrographs. The authors would like to thank the Scientific Bureau of the University of Catania for language support.

Conflicts of Interest

The authors declare no conflict of interest.

References

  1. Li, Y.; Chen, Q.; Pan, X.; Lu, W.; Zhang, J. Development and Challenge of Fluorescent Probes for Bioimaging Applications: From Visualization to Diagnosis. Top. Curr. Chem. 2022, 380, 22. [Google Scholar] [CrossRef]
  2. Harrison, V.S.R.; Carney, C.E.; MacRenaris, K.W.; Waters, E.A.; Meade, T.J. Multimeric Near IR–MR Contrast Agent for Multimodal In Vivo Imaging. J. Am. Chem. Soc. 2015, 137, 9108–9116. [Google Scholar] [CrossRef]
  3. Thi Kim Dung, D.; Umezawa, M.; Nigoghossian, K.; Yeroslavsky, G.; Okubo, K.; Kamimura, M.; Yamaguchi, M.; Fujii, H.; Soga, K. Development of Molecular Imaging Probe for Dual NIR/MR Imaging. J. Photopolym. Sci. Technol. 2020, 33, 117–122. [Google Scholar] [CrossRef]
  4. Yang, Z.; Sharma, A.; Qi, J.; Peng, X.; Lee, D.Y.; Hu, R.; Lin, D.; Qu, J.; Kim, J.S. Super-Resolution Fluorescent Materials: An Insight into Design and Bioimaging Applications. Chem. Soc. Rev. 2016, 45, 4651–4667. [Google Scholar] [CrossRef]
  5. Liu, J.; Chen, C.; Ji, S.; Liu, Q.; Ding, D.; Zhao, D.; Liu, B. Long Wavelength Excitable Near-Infrared Fluorescent Nanoparticles with Aggregation-Induced Emission Characteristics for Image-Guided Tumor Resection. Chem. Sci. 2017, 8, 2782–2789. [Google Scholar] [CrossRef] [Green Version]
  6. Chen, G.; Qiu, H.; Prasad, P.N.; Chen, X. Upconversion Nanoparticles: Design, Nanochemistry, and Applications in Theranostics. Chem. Rev. 2014, 114, 5161–5214. [Google Scholar] [CrossRef]
  7. Chen, Y.; Xue, L.; Zhu, Q.; Feng, Y.; Wu, M. Recent Advances in Second Near-Infrared Region (NIR-II) Fluorophores and Biomedical Applications. Front. Chem. 2021, 9, 750404. [Google Scholar] [CrossRef]
  8. Camargo, K.C.; Pereira, R.R.; dos Santos, L.F.; de Oliveira, S.R.; Gonçalves, R.R.; de S. Menezes, L. Continuous Wave Near-Infrared Phonon-Assisted Upconversion in Single Nd3+-Doped Yttria Nanoparticles. J. Lumin. 2017, 192, 963–968. [Google Scholar] [CrossRef]
  9. Gupta, S.K.; Sudarshan, K.; Kadam, R.M. Optical Nanomaterials with Focus on Rare Earth Doped Oxide: A Review. Mater. Today Commun. 2021, 27, 102277. [Google Scholar] [CrossRef]
  10. Bouzigues, C.; Gacoin, T.; Alexandrou, A. Biological Applications of Rare-Earth Based Nanoparticles. ACS Nano 2011, 5, 8488–8505. [Google Scholar] [CrossRef]
  11. Liu, S.; De, G.; Xu, Y.; Wang, X.; Liu, Y.; Cheng, C.; Wang, J. Size, Phase-Controlled Synthesis, the Nucleation and Growth Mechanisms of NaYF4:Yb/Er Nanocrystals. J. Rare Earths 2018, 36, 1060–1066. [Google Scholar] [CrossRef]
  12. Rajakumar, G.; Mao, L.; Bao, T.; Wen, W.; Wang, S.; Gomathi, T.; Gnanasundaram, N.; Rebezov, M.; Shariati, M.A.; Chung, I.-M.; et al. Yttrium Oxide Nanoparticle Synthesis: An Overview of Methods of Preparation and Biomedical Applications. Appl. Sci. 2021, 11, 2172. [Google Scholar] [CrossRef]
  13. Keevend, K.; Puust, L.; Kurvits, K.; Gerken, L.R.H.; Starsich, F.H.L.; Li, J.-H.; Matter, M.T.; Spyrogianni, A.; Sotiriou, G.A.; Stiefel, M.; et al. Ultrabright and Stable Luminescent Labels for Correlative Cathodoluminescence Electron Microscopy Bioimaging. Nano Lett. 2019, 19, 6013–6018. [Google Scholar] [CrossRef]
  14. Battaglia, R.; Musumeci, P.; Ragusa, M.; Barbagallo, D.; Scalia, M.; Zimbone, M.; Lo Faro, J.M.; Borzì, P.; Scollo, P.; Purrello, M.; et al. Ovarian Aging Increases Small Extracellular Vesicle CD81+ Release in Human Follicular Fluid and Influences MiRNA Profiles. Aging 2020, 12, 12324–12341. [Google Scholar] [CrossRef]
  15. van Niel, G.; D’Angelo, G.; Raposo, G. Shedding Light on the Cell Biology of Extracellular Vesicles. Nat. Rev. Mol. Cell Biol. 2018, 19, 213–228. [Google Scholar] [CrossRef]
  16. Huang, G.; Zhu, Y.; Wen, S.; Mei, H.; Liu, Y.; Wang, D.; Maddahfar, M.; Su, Q.P.; Lin, G.; Chen, Y.; et al. Single Small Extracellular Vesicle (SEV) Quantification by Upconversion Nanoparticles. Nano Lett. 2022, 22, 3761–3769. [Google Scholar] [CrossRef]
  17. Bogdan, N.; Vetrone, F.; Ozin, G.A.; Capobianco, J.A. Synthesis of Ligand-Free Colloidally Stable Water Dispersible Brightly Luminescent Lanthanide-Doped Upconverting Nanoparticles. Nano Lett. 2011, 11, 835–840. [Google Scholar] [CrossRef]
  18. Suk, J.S.; Xu, Q.; Kim, N.; Hanes, J.; Ensign, L.M. PEGylation as a Strategy for Improving Nanoparticle-Based Drug and Gene Delivery. Adv. Drug Deliv. Rev. 2016, 99, 28–51. [Google Scholar] [CrossRef] [Green Version]
  19. Partikel, K.; Korte, R.; Stein, N.C.; Mulac, D.; Herrmann, F.C.; Humpf, H.-U.; Langer, K. Effect of Nanoparticle Size and PEGylation on the Protein Corona of PLGA Nanoparticles. Eur. J. Pharm. Biopharm. 2019, 141, 70–80. [Google Scholar] [CrossRef]
  20. Fukushima, S.; Furukawa, T.; Niioka, H.; Ichimiya, M.; Sannomiya, T.; Tanaka, N.; Onoshima, D.; Yukawa, H.; Baba, Y.; Ashida, M.; et al. Correlative Near-Infrared Light and Cathodoluminescence Microscopy Using Y2O3:Ln, Yb (Ln = Tm, Er) Nanophosphors for Multiscale, Multicolour Bioimaging. Sci. Rep. 2016, 6, 25950. [Google Scholar] [CrossRef]
  21. Venkatachalam, N.; Saito, Y.; Soga, K. Synthesis of Er3+ Doped Y2O3 Nanophosphors. J. Am. Ceram. Soc. 2009, 92, 1006–1010. [Google Scholar] [CrossRef]
  22. Venkatachalam, N.; Hemmer, E.; Yamano, T.; Hyodo, H.; Kishimoto, H.; Soga, K. Synthesis and Toxicity Assay of Ceramic Nanophosphors for Bioimaging with Near-Infrared Excitation. Prog. Cryst. Growth Charact. Mater. 2012, 58, 121–134. [Google Scholar] [CrossRef]
  23. Kamimura, M.; Miyamoto, D.; Saito, Y.; Soga, K.; Nagasaki, Y. Design of Poly(Ethylene Glycol)/Streptavidin Coimmobilized Upconversion Nanophosphors and Their Application to Fluorescence Biolabeling. Langmuir 2008, 24, 8864–8870. [Google Scholar] [CrossRef] [PubMed]
  24. Mayer, M. SIMNRA, a Simulation Program for the Analysis of NRA, RBS and ERDA. In AIP Conference Proceedings; AIP: Denton, TX, USA, 1999; pp. 541–544. [Google Scholar] [CrossRef]
  25. Jiang, X.; Wu, W.; Li, Y.; Guo, X.; Wang, N.; Song, Q.; Wang, X.; Han, Y.; Wang, L. Hydrothermal Method for Y2O3:Eu3+ Uniform Nanophosphors with Different Templates. Mod. Phys. Lett. B 2019, 33, 1950227. [Google Scholar] [CrossRef]
  26. Wang, L.; Wang, N.; Wang, S.; Liang, D.; Cai, X.; Wang, D.; Han, Y.; Jia, G. Preparation of Lanthanide Ions-Doped BiPO4 Nanoparticles and Fe3+ Ions Assay. J. Nanosci. Nanotechnol. 2018, 18, 4000–4005. [Google Scholar] [CrossRef] [PubMed]
  27. Zimbone, M.; Musumeci, P.; Contino, A.; Maccarrone, G.; Calcagno, L. DNA-Triggered Asymmetric ZnO Nanoparticles. Colloids Surf. Physicochem. Eng. Asp. 2016, 489, 336–342. [Google Scholar] [CrossRef]
  28. Hanafy, N.A.N.; De Giorgi, M.L.; Nobile, C.; Rinaldi, R.; Leporatti, S. Control of Colloidal CaCO3 Suspension by Using Biodegradable Polymers during Fabrication. Beni-Suef Univ. J. Basic Appl. Sci. 2015, 4, 60–70. [Google Scholar] [CrossRef] [Green Version]
  29. Hanafy, N.; Kemary, M.; Leporatti, S. Reduction Diameter of CaCO3 Crystals by Using Poly Acrylic Acid Might Improve Cellular Uptake of Encapsulated Curcumin in Breast Cancer. J. Nanomed. Res. 2018, 7, 235–239. [Google Scholar] [CrossRef]
  30. Sanchez, L.M.; Martin, D.A.; Alvarez, V.A.; Gonzalez, J.S. Polyacrylic Acid-Coated Iron Oxide Magnetic Nanoparticles: The Polymer Molecular Weight Influence. Colloids Surf. Physicochem. Eng. Asp. 2018, 543, 28–37. [Google Scholar] [CrossRef]
  31. Panáček, A.; Prucek, R.; Hrbáč, J.; Nevečná, T.; Šteffková, J.; Zbořil, R.; Kvítek, L. Polyacrylate-Assisted Size Control of Silver Nanoparticles and Their Catalytic Activity. Chem. Mater. 2014, 26, 1332–1339. [Google Scholar] [CrossRef]
  32. Alrowaili, Z.A.; Taha, T.A.; El-Nasser, K.S.; Donya, H. Significant Enhanced Optical Parameters of PVA-Y2O3 Polymer Nanocomposite Films. J. Inorg. Organomet. Polym. Mater. 2021, 31, 3101–3110. [Google Scholar] [CrossRef]
  33. Laricchiuta, G.; Vandervorst, W.; Vickridge, I.; Mayer, M.; Meersschaut, J. Rutherford Backscattering Spectrometry Analysis of InGaAs Nanostructures. J. Vac. Sci. Technol. A 2019, 37, 020601. [Google Scholar] [CrossRef]
  34. Kamimura, M.; Kanayama, N.; Tokuzen, K.; Soga, K.; Nagasaki, Y. Near-Infrared (1550 Nm) in Vivo Bioimaging Based on Rare-Earth Doped Ceramic Nanophosphors Modified with PEG-b-Poly(4-Vinylbenzylphosphonate). Nanoscale 2011, 3, 3705. [Google Scholar] [CrossRef] [PubMed]
Figure 1. SEM micrographs of the core Er- and Nd-doped Y2O3 NPs, after synthesis and annealing, deposited onto an Si wafer for (a) sample E1, (b) sample E2, (c) sample E3 and (d) sample N1.
Chemosensors 11 00020 g001
Figure 2. TEM micrographs and related diffraction patterns: (a,b) for sample E3 and (c) and (d) for sample N1.
Chemosensors 11 00020 g002
Figure 3. RBS spectra of (a) Er:Y2O3 NPs samples E1, E2 and E3 and (b) Nd:Y2O3 NPs sample N1. EDX spectra of (c) Er:Y2O3 NPs samples E1, E2 and E3 and (d) Nd:Y2O3 NPs sample N1.
Chemosensors 11 00020 g003
Figure 4. PL emission spectra of Er:Y2O3 NPs samples E1, E2 and E3 in the visible (a) and IR (b) range (λexc = 378 nm). (c) PL emission spectrum of the Nd:Y2O3 NPs sample. N1 (λexc = 358 nm).
Chemosensors 11 00020 g004
Figure 5. Upconversion spectrum of the Er:Y2O3 NPs sample E3 (λexc = 980 nm).
Chemosensors 11 00020 g005
Figure 6. PL emission spectra in the visible (a) and IR (b) range of Er:Y2O3 NPs sample E3 core and pegylated core/shell after purification (λexc = 378 nm).
Chemosensors 11 00020 g006
Figure 7. (a) TEM images, (b) HR-TEM details and (c) particle diameter distribution histogram and gaussian fit obtained by TEM images of pegylated Er:Y2O3 NPs sample E3; (d) TEM images, (e) HR-TEM details and (f) particle diameter distribution histogram and gaussian fit obtained by TEM images of pegylated Nd:Y2O3 NPs sample N1.
Chemosensors 11 00020 g007
Figure 8. SEM image of Er:Y2O3 NPs obtained by (a) secondary electrons and (b) cathodoluminescence. Related emission spectra obtained by (c) electron beam excitation and (d) photoexcitation (λexc = 378 nm).
Chemosensors 11 00020 g008
Table 1. Obtained yields for the different synthetic procedures.
CalculatedObtainedYield
E10.2703 g0.0157 g5.6%
E20.2703 g0.1006 g37.0%
E30.2703 g0.0637 g23.6%
N10.2703 g0.1152 g42.6%
Table 2. Elemental concentrations as determined by RBS analysis and EDX analysis.
RBS
Y 1015 at/cm2Er 1015 at/cm2Er / (Er + Y)Er % in NPs
E1535 ± 2770 ± 40.12 ± 0.014.6 ± 0.3%
E28.0 ± 0.40.75 ± 0.040.09 ± 0.013.4 ± 0.2%
E3229 ± 1122 ± 10.09 ± 0.013.5 ± 0.2%
Y 1015at/cm2Nd 1015at/cm2Nd / (Nd + Y)Nd % in NPs
N163 ± 3.140.84 ± 0.040.010 ± 0.0010.5 ± 0.1%
EDX
Y (At %)Er (At %)Er / (Er + Y)Er % in NPs
E189.50 ± 0.1110.50 ± 0.710.110 ± 0.0084.2 ± 0.3%
E293.50 ± 0.036.50 ± 0.390.060 ± 0.0032.6 ± 0.2%
E392.40 ± 0.057.60 ± 0.460.080 ± 0.0053.2 ± 0.2%
Y (At %)Nd (At %)Nd / (Nd + Y)Nd % in NPs
N198.60 ± 0.461.4 ± 31.280.01 ± 0.220.6 ± 13.4%
Disclaimer/Publisher’s Note: The statements, opinions and data contained in all publications are solely those of the individual author(s) and contributor(s) and not of MDPI and/or the editor(s). MDPI and/or the editor(s) disclaim responsibility for any injury to people or property resulting from any ideas, methods, instructions or products referred to in the content.

