Article

Selective Detection of Folic Acid Using a Water-Stable Fluorescent CsPbBr3/Cs4PbBr6 Perovskite Nanocrystal Probe

Key Laboratory of Medicinal Chemistry for Natural Resource (Yunnan University), Ministry of Education, National Demonstration Center for Experimental Chemistry and Chemical Engineering Education (Yunnan University), School of Chemical Science and Technology, Yunnan University, Kunming 650091, China
*
Authors to whom correspondence should be addressed.
Chemosensors 2023, 11(1), 19; https://doi.org/10.3390/chemosensors11010019
Submission received: 23 October 2022 / Revised: 14 December 2022 / Accepted: 21 December 2022 / Published: 26 December 2022
(This article belongs to the Special Issue Nanoparticles in Chemical and Biological Sensing)

Abstract

:
A water-stable cesium lead bromide (CsPbBr3/Cs4PbBr6) perovskite nanocrystal (PNC) was synthesized and studied as a fluorescence probe for the selective detection of folic acid (FA). The as-prepared PNCs emitted strong green fluorescence at 525 nm, and their structure was systematically characterized by X-ray powder diffraction, X-ray photoelectron spectroscopy, and transmission electron microscopy. The interaction between the PNCs and small biological molecules was investigated and the results indicated that the fluorescence of the PNCs could be selectively quenched by FA. The quenching rate has a linear relationship with the concentration of FA in the concentration range from 10 to 800 μM, with a correlation coefficient R2 of 0.9841, and a limit of detection (LOD, 3σ) of 1.69 μM. The mechanism of the interaction between the PNCs and FA was discussed, and the reliability of the method for real sample detection was also verified by the standard addition method. The method proposed here, using a fluorescence PNCs probe, provided a simple alternative strategy for detecting FA that will play an important role in biochemical analysis.

Graphical Abstract

1. Introduction

All-inorganic cesium lead halide perovskite nanocrystals (CsPbX3 PNCs, X = Cl, Br or I), a new class of luminescent materials [1,2], exhibit excellent optical properties, such as high photoluminescence quantum yield, half-peak width, full-width, and a wide color gamut [3], while possessing unique carrier separation properties, high charge carrier mobility and long carrier diffusion length [4,5,6,7,8]. However, conventional CsPbX3 PNCs are highly sensitive to moisture and other polar solvents, leading to degradation [9,10,11], which makes it difficult to develop analytical methods for the detection of targets in aqueous solutions. Therefore, the synthesis of water-stable PNCs and their application in the detection of targets in aqueous solutions have attracted extensive attention [12,13].
To improve the water stability of PNCs, polymers [14,15,16], inert oxides (silica or alumina) [17,18,19], metal–organic framework materials [20,21,22], and carbon materials [23] have been widely used as coatings or stabilizers. For example, Ma et al. promoted the stripping and fragmentation of MnO2 nanosheets by utilizing the reducibility of cysteine and intramolecular hydrogen bonding, providing a protective microenvironment [24]. However, the as-prepared products tend to agglomerate when in solution, due to the bulk formation of coating materials on the surface of PNCs. Directly preparing water-stable CsPbX3 PNCs using suitable ligands has attracted much research attention. For example, Li et al. synthesized water-stable CsPbBr3/Cs4PbBr6 PNCs using a fluorocarbon agent (FCA) [3,25]. The FCA that they used has a hydrophobic structure and promotes colloidal dispersion, which enables the direct synthesis of PNCs in aqueous solutions. Hu et al. utilized water-stable L-lysine to directly synthesize Lys-PNCs in water, and the synthesized Lys-PNCs exhibited enhanced water resistance [26]. The reports of these highly water-stable perovskite synthesis methods lay the foundation for the application of perovskites in aqueous solutions.
FA is commonly taken by pregnant women to treat and prevent macrocytic anemia [27]. Insufficient levels of folate can disrupt cell division, leading to defects in fetal development. FA deficiency also leads to elevated serum homocysteine levels [28], which, in turn, leads to cardiovascular diseases such as coronary heart disease and stroke [29]. Traditional methods for the determination of FA include capillary electrophoresis [30,31], chromatography [32,33,34], electrochemical sensors [35], chemiluminescence [36,37,38], and fluorescence [39,40,41,42]. However, some methods still suffer from certain limitations, such as being time-consuming, low sensitivity, and high cost, along with the need for complex sample pretreatment. Therefore, it is necessary to develop a simple and effective method to detect FA. The method proposed in this paper, using a fluorescence PNCs probe, provides a simple alternative strategy for detecting FA.
In this work, we improved the reported aqueous emulsion method for the synthesis of water-stable cesium lead bromide PNCs using CsBr, PbBr2, N-6-trifluoroacetyl-l-lysine, and oleylamine (OLA) as the raw materials. The synthesized nanocrystals exhibited strong green fluorescence at 525 nm and had good water stability. The structure of the PNCs was systematically characterized by X-ray powder diffraction, X-ray photoelectron spectroscopy, and transmission electron microscopy. We also found that folic acid (FA) could selectively quench the fluorescence of PNCs in an aqueous solution. The quenching rate has a linear relationship with the concentration of FA, in the concentration range from 10 to 800 μM. Based on this phenomenon, a fast, efficient, selective, and visual detection method for FA was established, using the PNCs as a fluorescent probe.

2. Experimental Section

2.1. Materials and Instruments

CsBr (AR), PbBr2 (AR), N-6-trifluoroacetyl-L-lysine (98%), oleylamine (OLA) (90%), and small biomolecules were purchased from Adamas-beta China Shanghai Sinopharm Reagent Chemical Reagent Co., Ltd. Shanghai, China. HBr (40%) was sourced from Tianjin Fengchuan Chemical Reagent Technology Co., Ltd. Tianjin, China. DMF (99.5%) was purchased from Shanghai Titan Scientific Co., Ltd. Tianjin, China. All chemicals were used as received, without further purification. Ultra-pure water (18.25 MΩ) was prepared by the Milli-Q ultrapure water preparation system.
Fluorescence and absorption spectra were measured using an F-7000 spectrofluorometer (Hitachi, Tokyo, Japan) and a UV-2700 spectrophotometer (Shimadzu, Tokyo, Japan), respectively. X-ray photoelectron spectroscopy (XPS) data were collected on a K-Alpha X-ray photoelectron spectrometer (American Thermo Fisher Scientific, Waltham, MA, USA). Transmission electron microscope (TEM) images and HAADF were taken on FEI Talos F200s (American Thermo Fisher Scientific, Waltham, MA, USA). X-ray diffraction (XRD) measurements were carried out using an Ultima IV diffractometer, with monochromatized Cu Kα radiation at 40 kV and 40 mA, and were recorded (Rigaku Corporation, Tokyo, Japan).

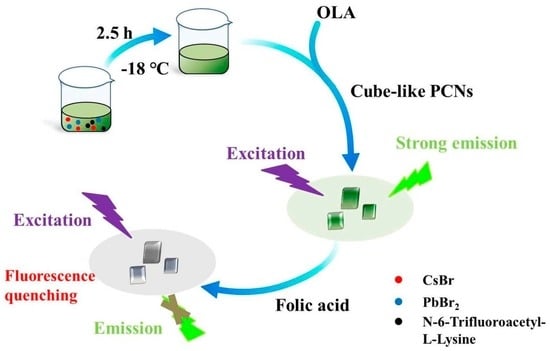
2.2. Synthesis of the CsPbBr3/Cs4PbBr6 PNCs

The CsPbBr3/Cs4PbBr6 PNCs were synthesized using the aqueous emulsion method, with appropriate modifications of the reported method [3,25]. First, 0.5 M CsBr, 0.5 M PbBr2, and 0.05 M N-6-trifluoroacetyl-L-lysine were prepared in 40% HBr solution. Take 1.0 mL of DMF into a 5.0 mL tube, add 125.0 μL of CsBr and 125.0 μL of PbBr2 solution, in turn, mix well, and, after the temperature has cooled to room temperature, add 125.0 μL of N-6-trifluoroacetyl-L-lysine. After mixing evenly, the mixture was maintained at −18 °C and left to react for 2.5 h to obtain a precursor solution. Then, 250 μL of OLA was added to the precursor solution, mixed well, and diluted to 40 mL with ultrapure water. After sonication for 20 min, the mixture was centrifuged at 6000 rpm for 5 min, and the resulting supernatant of CsPbBr3/Cs4PbBr6 PNCs was stored in a refrigerator at 4 °C for further use.

2.3. Detection of Folic Acid by CsPbBr3/Cs4PbBr6 PNCs

In a typical process, the resulting supernatant is diluted twice with ultra-pure water, then 200 μL of CsPbBr3/Cs4PbBr6 PNCs solution is added to a 1.5 mL tube and a series of different concentrations of FA are added to the tube containing CsPbBr3/Cs4PbBr6 PNCs solution. It is then filled with ultra-pure water to 1.0 mL and mixed well. After thorough mixing and standing for 5 min, the mixture was transferred to fluorescence measurements. For verifying the selectivity of FA, other small biomolecules including cysteine (Cys), dopamine (DA), folic acid (FA), glucose (Glu), glutathione (GSH), isoleucine (Ile), leucine (Leu), lysine (Lys), methionine (Met), phenylalanine (Phe), threonine (Thr), tryptophan (Trp), and ascorbic acid (Vc) were utilized under the same experimental conditions. The concentrations of FA and other small biomolecules were always the same. In order to explore the feasibility of FA detection in actual samples, human urine collected from healthy people was selected for testing and the standard addition method was used for verification. The test conditions were the same as in the detection of FA described above.

3. Results and Discussion

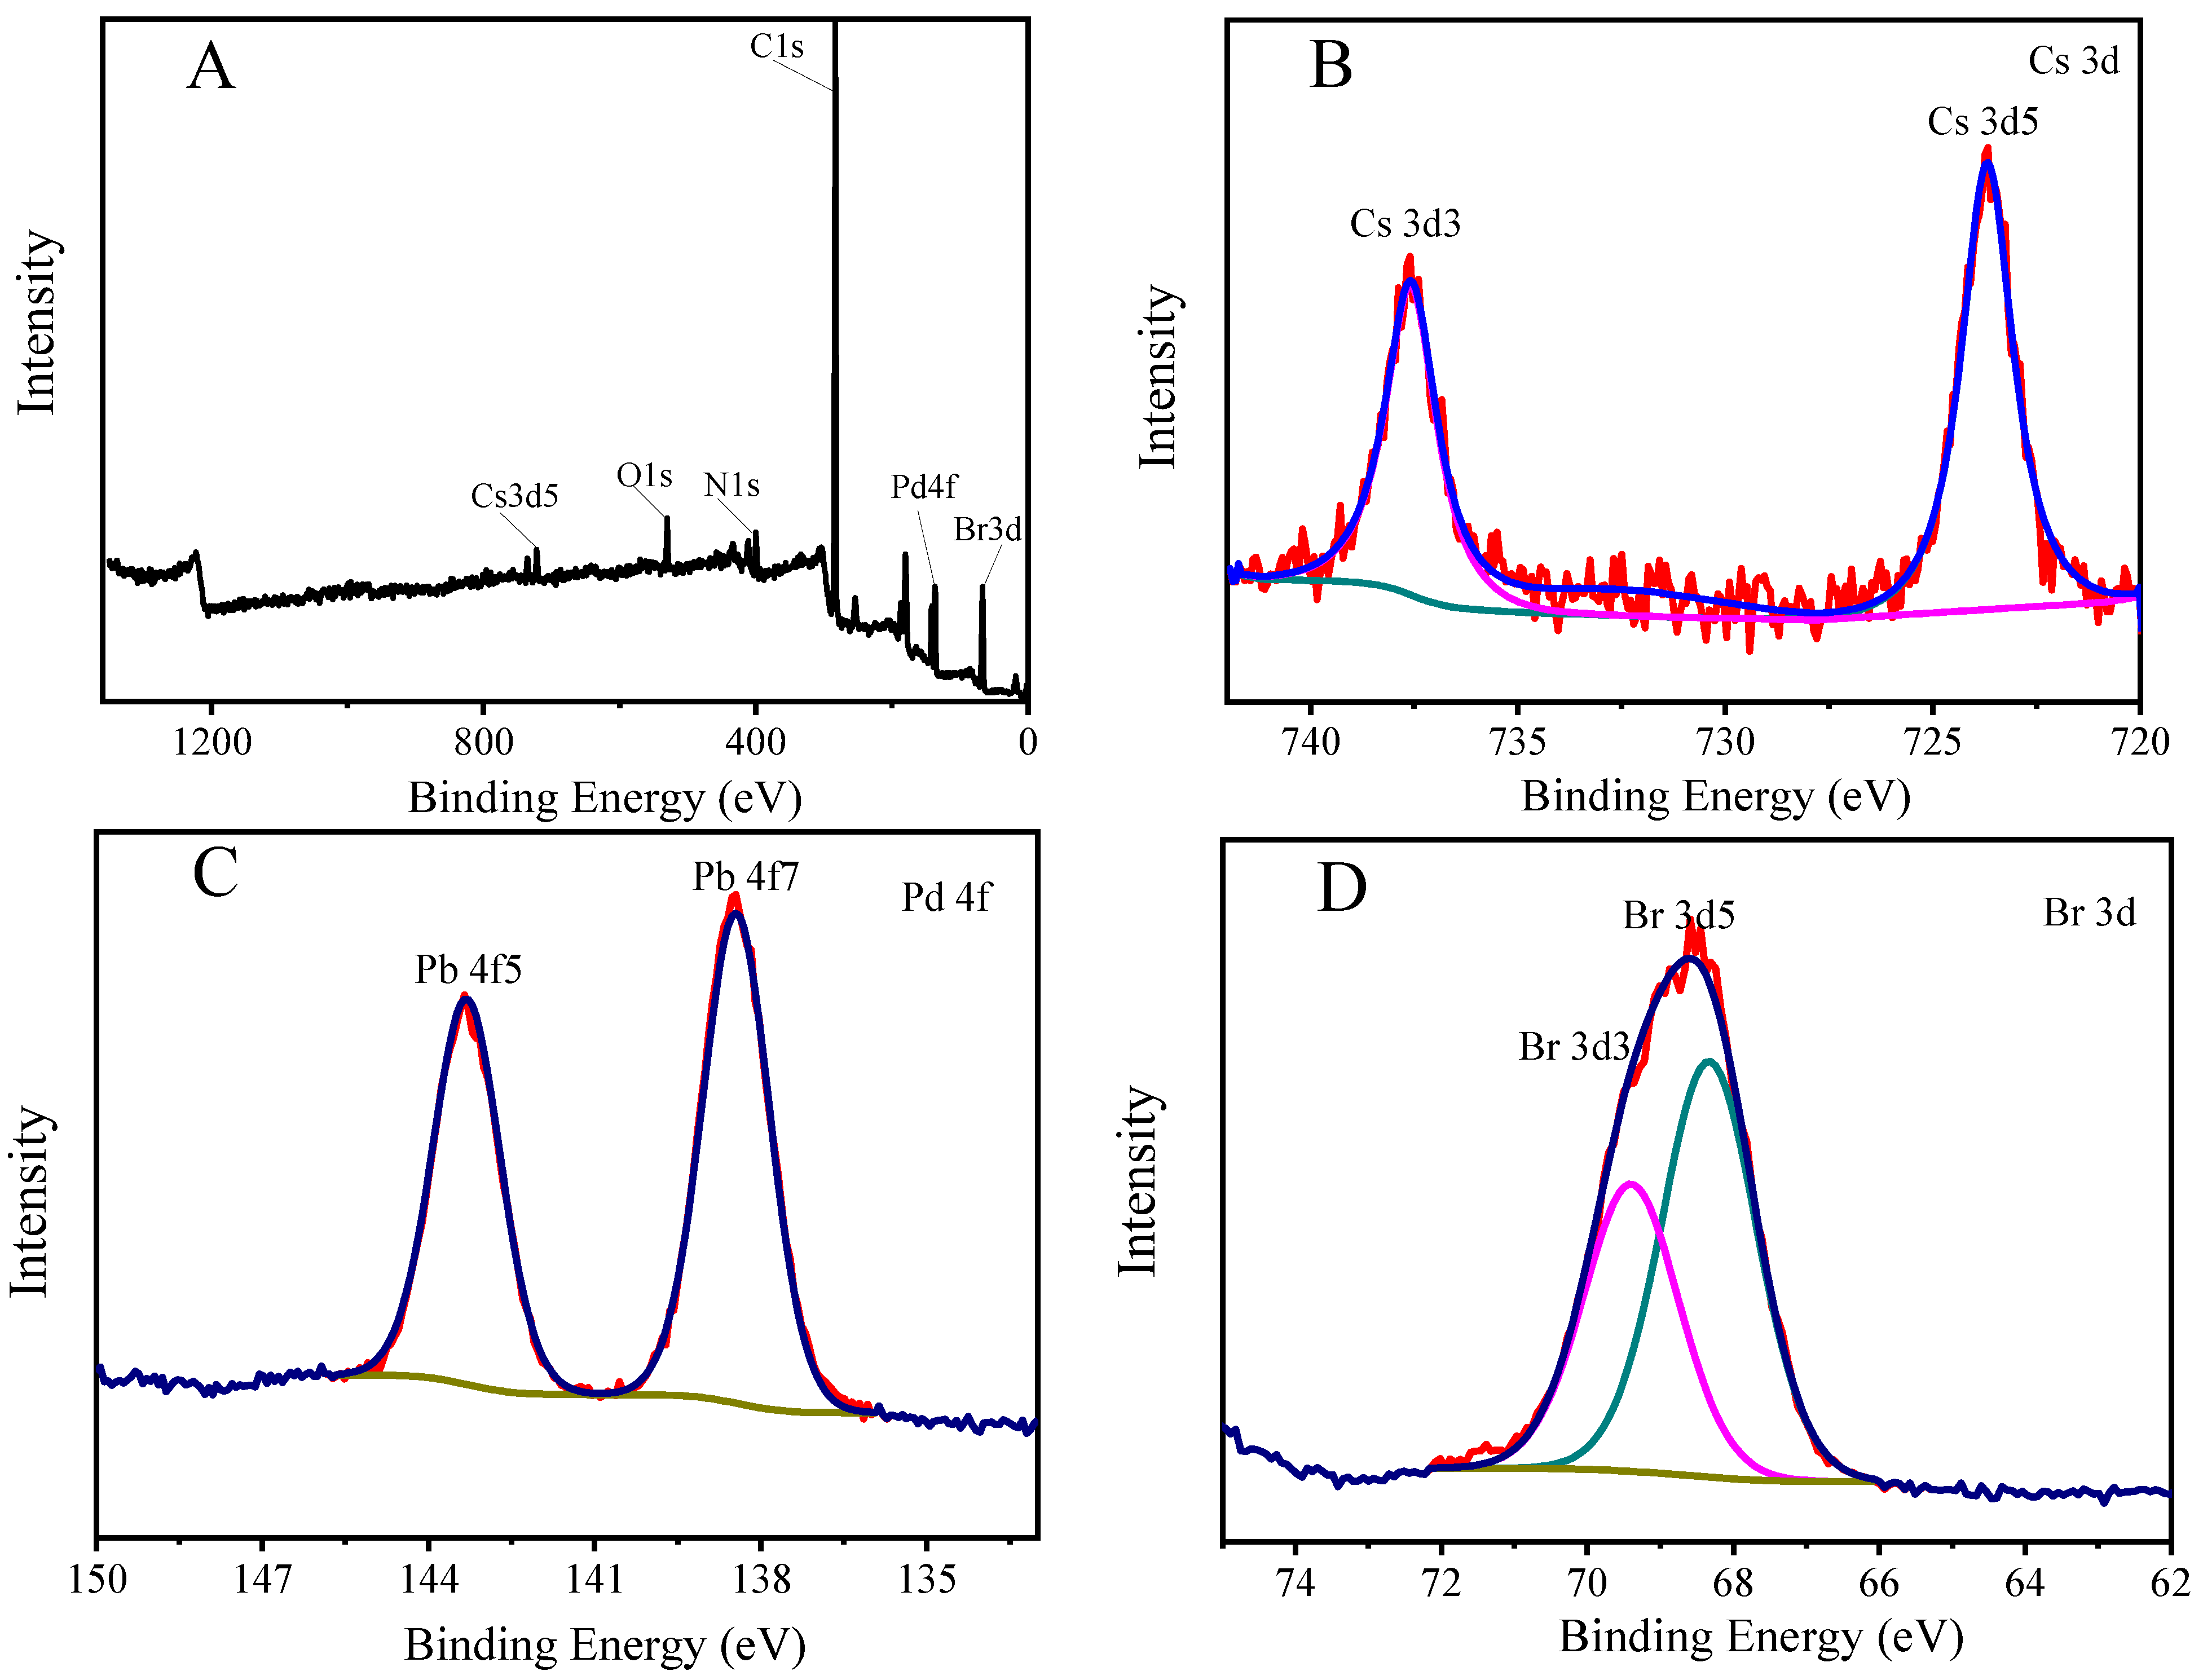
3.1. Characterization of CsPbBr3/Cs4PbBr6 PNCs

As shown in Figure 1, the CsPbBr3/Cs4PbBr6 PNCs showed strong fluorescence emission, with a maximum emission wavelength of 525 nm; a narrow half-peak width can be observed in the figure. The UV-Vis absorption showed that the PNCs had a weak absorption peak at 510 nm, and the peak shape and peak position were consistent with the CsPbBr3/Cs4PbBr6 PNCs reported in the literature [3]. The PNCs solution showed strong green fluorescence under UV light irradiation with a wavelength of 365 nm (see inset in Figure 1). At the same time, we also measured the fluorescence lifetime of the PNCs, as shown in Figure S5 of the Supplementary Materials, the fluorescence lifetime of the PNCs was 8.28 ns, established by fitting the fluorescence lifetime decay curve.
The as-synthesized PNCs were observed in the transmission electron microscopy (TEM) images (Figure 2A) as regular cube-like shapes, with different sizes and length distributions, ranging from 30 to 130 nm. Clear lattice fringes can be observed on the cubes in Figure 2B, and a clear and distinct lattice can be observed via high-resolution transmission electron microscopy (HRTEM) magnification (Figure 2C), with a lattice spacing of 0.42 nm. It was characterized by X-ray powder diffraction; the results are shown in Figure 2D, at 12.6°, 20.1°, 25.4°, 27.5°, 30.2°, 30.9°, 34.1°, and 38.9° (shown in green in the figure). The diffraction peaks that appeared correspond to the 012, 113, 024, 131, 223, 006, 134, and 324 crystal planes of Cs4PbBr6 (PDF card 73-2478). The diffraction peaks at 18.3°, 22.01°, 35.5°, 37.4°, 42.05°, and 54.14° (marked with red stars in the figure) correspond to the 020, 111, 132, 041, 140, and 055 crystal planes of CsPbBr3 (PDF card 54-0752). It has a typical cubic phase (111), which is consistent with that reported in the literature [3].
In order to determine the elements contained in the PNCs and the valence states of each element, X-ray electron spectroscopy (XPS) was used to characterize them, and the results are shown in Figure 3. The characteristic peak at the binding energy of 723.69 eV in Figure 3B is fitted to Cs 3d5, and the characteristic peak at the binding energy of 737.57 eV is fitted to Cs 3d3; the characteristic peak at the binding energy of 138.44 eV in Figure 3C is fitted to Pb 4f7. The characteristic peak at the binding energy of 143.31 eV was fitted to Pb 4f5; the characteristic peak at the binding energy of 68.33 eV in Figure 3D was fitted to Br 3d5, and the characteristic peak at the binding energy of 69.40 eV was fitted to Br 3d3. The resulting binding energies for each element are consistent with those reported previously [43,44].

3.2. Optimization of Synthesis Conditions for CsPbBr3/Cs4PbBr6 PNCs

The synthesis of the PNCs was carried out in two steps: the synthesis of the precursor solution and the reaction of the precursor solution and the ligand solution to obtain an aqueous solution of the PNCs. During this process, the reaction temperature and time of the precursor synthesis, the volume ratio of the precursor and the ligand, and the reaction time of the precursor and the ligand were studied. The reaction temperature of the precursor is important for the formation of the precursor, and it can be seen in Figure S1 of the Supplementary Materials that the fluorescence of the PNCs is rapidly enhanced as the reaction temperature of the precursor decreases, which is because the low temperature helps the perovskite ore precipitation [3]. Therefore, −18 °C was chosen as the optimum precursor reaction temperature. The effect of the precursor reaction time on the fluorescence intensity of PNCs is shown in Figure S2A,B of the Supplementary Materials. With the increase in reaction time, the fluorescence intensity of the PNCs gradually increased and reached a maximum after 2.5 h. When the reaction time was longer than 2.5 h, the fluorescence intensity gradually decreased. The volume ratio of the precursor solution and the ligand (OLA) also affected the synthesis of PNCs, and the results are shown in Figure S3 of the Supplementary Materials. When the volume ratio of the precursor to the ligand was 11:1–11:6, the fluorescence intensity of the PNCs gradually increased with the increase in OLA volume, and the fluorescence intensity reached the maximum when the ratio was 11:2. Conversely, when the volume ratio of the precursor solution to the ligand was greater than 11:2, the fluorescence intensity gradually decreased, because the strong scattering of the ligand will affect the luminescence performance of the nanocrystals with the increase in the ligand concentration [45]. The effect of reaction time on the fluorescence intensity of the PNCs is shown in Figure S4 in the Supplementary Materials. The results show that the time required for the ligand to bind to the precursor is very short, and PCNs with strong fluorescence can be formed in 5 min. In order to ensure better fluorescence properties in the synthesized PNCs, the reaction time of the precursor and ligand was selected as 20 min.

3.3. Stability of CsPbBr3/Cs4PbBr6 PNCs

The reaction time and the temperature of the medium are important factors that affect the fluorescence intensity. Temperature and standing time stability were investigated in this experiment, and the results are shown in Figure 4. It can be seen that with the gradual increase in temperature, the fluorescence intensity of CsPbBr3/Cs4PbBr6 PNCs gradually decreases, indicating that the fluorescence intensity of PNCs is closely related to temperature and will weaken its fluorescence intensity at high temperatures. This is because the Ostwald ripening occurred during the crystal growth process with the increase in temperature, resulting in a larger crystal size [46]. Therefore, we stored the prepared CsPbBr3/Cs4PbBr6 PNCs in a low-temperature environment. At the same time, the fluorescence intensity of the PNCs did not change much within 21.5 h of placement. As long as it was used within this time range, the fluorescence intensity of the PNCs remained stable.

3.4. Analytical Parameter of FA Detection

Various common small biomolecules, including cysteine (Cys), dopamine (DA), folic acid (FA), glucose (Glu), glutathione (GSH), isoleucine (Ile), leucine (Leu), lysine (Lys), methionine (Met), phenylalanine (Phe), threonine (Thr), tryptophan (Trp), and ascorbic acid (Vc) were added to the PNCs for studying the selectivity of the fluorescence probe. The results shown in Figure 5A,B indicated that FA can significantly quench the fluorescence of the PNCs, while other small biomolecules have little effect on the fluorescence of the PNCs. We also investigated the interference in terms of the detection of FA in the presence of other small biomolecules. As shown in Figure 5C, the detection of FA using the PNCs was not disturbed in the presence of 2000 μM of other biomolecules.
Since the fluorescence of the PNCs can be quenched by FA selectivity, a method for the quantitative detection of FA using the PNCs as a fluorescent probe could be established. Before the quantitative detection of FA, the reaction time and temperature need to be studied. As shown in Figure 6, the fluorescence quenching rate (I0/I) of the PNCs was not greatly affected by temperature, and the reaction temperature was fixed at 25 °C. The interaction between the PNCs and FA could be completed within 5 min and would not change in the following 1 h.
For the detection of FA, the linear relationship between the fluorescence quenching rate and the FA concentration of the PNCs was investigated, as shown in Figure 7A,B; they have a good linear relationship, and the calibration curve is I0/I = 0.01145cFA + 0.5822. The correlation coefficient, R2, was 0.9841, and the limit of detection (LOD) was 1.695 μM in the range of a FA concentration of 10–800 μM. In addition, our method can also be used for the rapid real-time detection of FA by the naked eye. As shown in Figure 7C, the fluorescence intensity gradually decreased from left to right with the increase in FA concentration under the 365 nm ultraviolet light.
Recently, several assays have been developed to detect FA. A comparison of this analytical method with other reported folate assays is shown in Table 1, and the concentration range and LOD are comparable to or better than most of the reported methods [34,47,48,49,50,51,52]. In addition, fluorescence analysis is simple and time-saving, compared to other methods.

3.5. Fluorescence Quenching Mechanism of the CsPbBr3/Cs4PbBr6 PNCs by Folic Acid

The mechanism for the fluorescence quenching of the PNCs by FA is discussed. As shown in Figure 8A,B, the high concentration of FA has a weak fluorescence and the mixing of FA and PNCs would quench their fluorescence. The UV absorption spectrum of FA overlaps with the excitation spectrum of the PNCs, so the inner filter effect may be one of the possible factors leading to the fluorescence quenching of the PNCs. However, later study found more evidence for the quenching of fluorescence. As shown in Figure 8C, the zeta potential analysis showed that FA and the PNCs have opposite charges (−23.4 and 79.0 mV, respectively) and the mixing of FA and the PNCs would reduce the distance between each other. The fluorescence decay of the PNCs decreased significantly in the presence of FA (Figure 8D), and the changes in fluorescence lifetime (shown in Table 2) indicated that the quenching process is that of dynamic quenching, which may be caused by the collision between the two via electrostatic interaction. The inner filter effect of PNCs and FA is not the only cause for the quenching of fluorescence because the fluorescence lifetime does not change in terms of the inner filter effect [53]. To further study the electrostatic interaction of FA and the PNCs, similar molecules (including methotrexate, pemetrexed, aspartic acid, and histidine) containing polar groups (such as OH, −COOH, and −NH2) were used to interact with the PNCs. The zeta potential test results showed that methotrexate, pemetrexed, and histidine have negative charges on their surfaces and can interact with the PNCs electrostatically. However, the fluorescence of the PNCs did not change after interaction with these molecules (Supplementary Materials, Figure S7). Thus, electrostatic interaction is not a key factor for fluorescence quenching. Another possible reason is that the amino group on the surface of the PNCs interacts with the carboxyl group on the surface of folic acid to form a complex. The energy in the conduction band of the PNCs is transferred to the LUMO orbital of the complex, eventually leading to fluorescence quenching [54]. However, other similar molecules do not affect the fluorescence of the PNCs because the LUMO orbital energy is higher than the energy of the perovskite conduction band after the formation of the complex.

3.6. Real Sample Detection

In order to further investigate the practicability and accuracy of the method, this experiment further adopted the standard addition method to detect an actual sample (urine). As shown in Table 3, the results show that the detection recovery rate of FA by this method is 99.04–106.1%. Therefore, we believe that the analytical method for the detection of FA using the PNCs as fluorescent probes is a highly selective and accurate method.

4. Conclusions

In summary, we have developed a method for the sensitive and selective detection of FA, based on fluorescence quenching. FA can effectively quench the fluorescence of the PNCs. After optimizing the synthesis conditions of the PNCs and the experimental conditions for the detection of FA, the fluorescence intensity of the PNCs was linearly correlated with the concentration of FA in the range of 10–800 μM, and the LOD was 1.695 μM. The proposed method was used to detect the folate measured in urine, with recoveries of between 99.04% and 106.1%. These satisfactory results demonstrate that this novel sensing system greatly expands the application range of PNCs in the field of fluorescence detection. The mechanism of the FA and the PNCs interaction was also discussed. The results indicated the fluorescence quenching is caused by the electrostatic interaction between FA and PNCs, which reduced the distance between each one, transferring and consuming the exciting energy in this process.

Supplementary Materials

The following supporting information can be downloaded at: https://www.mdpi.com/article/10.3390/chemosensors11010019/s1, Figure S1: Effect of the precursor reaction temperature on the fluorescence intensity of CsPbBr3/Cs4PbBr6 PNCs; Figure S2: The effect of precursor reaction time on the fluorescence intensity of CsPbBr3/Cs4PbBr6 PNCs (A and B); Figure S3: Effect of the volume ratio of the precursor to the ligand on the fluorescence intensity of CsPbBr3/Cs4PbBr6 PNCs (A and B); Figure S4: The effect of the reaction time of precursor and ligand on the fluorescence intensity of CsPbBr3/Cs4PbBr6 PNCs (A and B); Figure S5: Fluorescence lifetime map of CsPbBr3/Cs4PbBr6 PNCs; Figure S6: Optimization of temperature (A) and time (B) for detection of FA by CsPbBr3/Cs4PbBr6 PNCs. Experimental conditions: the concentration of CsPbBr3/Cs4PbBr6 PNCs (0.156 mmol, in terms of Cs atoms), the concentration of FA is 200 μM; (A) reaction temperature: 4–60 °C; response time: 15 min; (B) reaction temperature: 25 °C, response time: 5–50 min; Figure S7: Zeta potential of different molecules and the PNCs (A); Effects of four similar molecules on the fluorescence intensity of the PNCs (B). Experimental conditions: The concentration of the four molecules was 200 μM.

Author Contributions

Conceptualization, W.-Z.S. and R.-X.Z.; methodology, R.-X.Z.; software, J.-Z.L.; validation, R.-X.Z. and W.-Z.S.; formal analysis, J.-Z.L.; investigation, H.-C.Z. and M.-T.L.; resources, Q.C. and J.L.; data curation, R.-X.Z.; writing—original draft preparation, R.-X.Z. and W.-Z.S.; writing—review and editing, W.-Z.S., R.S.L. and J.L.; visualization, W.-Z.S., R.S.L. and J.L.; supervision, J.L. and C.-H.Z., project administration, J.L.; funding acquisition, J.L. and Q.C. All authors have read and agreed to the published version of the manuscript.

Funding

This work was financially supported by the National Natural Science Foundation of China (Nos. 21565030, 22164020), Program for Excellent Young Talents of Yunnan University. Thanks to the Advanced Analysis and Measurement Center of Yunnan University for providing a sample testing service.

Institutional Review Board Statement

Not applicable.

Informed Consent Statement

Not applicable.

Data Availability Statement

The study did not report any data.

Conflicts of Interest

The authors declare no conflict of interest.

References

  1. Protesescu, L.; Yakunin, S.; Bodnarchuk, M.I.; Krieg, F.; Caputo, R.; Hendon, C.H.; Yang, R.X.; Walsh, A.; Kovalenko, M.V. Nanocrystals of Cesium Lead Halide Perovskites (CsPbX(3), X = Cl, Br, and I): Novel Optoelectronic Materials Showing Bright Emission with Wide Color Gamut. Nano Lett. 2015, 15, 3692–3696. [Google Scholar] [CrossRef] [PubMed] [Green Version]
  2. Zhang, B.; Altamura, D.; Caliandro, R.; Giannini, C.; Peng, L.; De Trizio, L.; Manna, L. Stable CsPbBr3 Nanoclusters Feature a Disk-like Shape and a Distorted Orthorhombic Structure. J. Am. Chem. Soc. 2022, 144, 5059–5066. [Google Scholar] [CrossRef] [PubMed]
  3. Li, Z.; Hu, Q.; Tan, Z.; Yang, Y.; Leng, M.; Liu, X.; Ge, C.; Niu, G.; Tang, J. Aqueous Synthesis of Lead Halide Perovskite Nanocrystals with High Water Stability and Bright Photoluminescence. ACS Appl. Mater. Interfaces 2018, 10, 43915–43922. [Google Scholar] [CrossRef] [PubMed]
  4. Akkerman, Q.A.; D’Innocenzo, V.; Accornero, S.; Scarpellini, A.; Petrozza, A.; Prato, M.; Manna, L. Tuning the Optical Properties of Cesium Lead Halide Perovskite Nanocrystals by Anion Exchange Reactions. J. Am. Chem. Soc. 2015, 137, 10276–10281. [Google Scholar] [CrossRef] [Green Version]
  5. Bai, Z.; Zhong, H. Halide perovskite quantum dots: Potential candidates for display technology. Sci. Bull. 2015, 60, 1622–1624. [Google Scholar] [CrossRef] [Green Version]
  6. Bekenstein, Y.; Koscher, B.A.; Eaton, S.W.; Yang, P.; Alivisatos, A.P. Highly Luminescent Colloidal Nanoplates of Perovskite Cesium Lead Halide and Their Oriented Assemblies. J. Am. Chem. Soc. 2015, 137, 16008–16011. [Google Scholar] [CrossRef] [Green Version]
  7. Sheng, X.; Liu, Y.; Wang, Y.; Li, Y.; Wang, X.; Wang, X.; Dai, Z.; Bao, J.; Xu, X. Cesium Lead Halide Perovskite Quantum Dots as a Photoluminescence Probe for Metal Ions. Adv. Mater. 2017, 29, 1700150. [Google Scholar] [CrossRef]
  8. Rosales, B.A.; Mundt, L.E.; Schelhas, L.T.; Wheeler, L.M. Reversible Methanolation of Metal Halide Perovskites. J. Am. Chem. Soc. 2022, 144, 667–672. [Google Scholar]
  9. Huang, S.; Li, Z.; Wang, B.; Zhu, N.; Zhang, C.; Kong, L.; Zhang, Q.; Shan, A.; Li, L. Morphology Evolution and Degradation of CsPbBr3 Nanocrystals under Blue Light-Emitting Diode Illumination. ACS Appl. Mater. Interfaces 2017, 9, 7249–7258. [Google Scholar] [CrossRef]
  10. Park, B.; Kang, S.-M.; Lee, G.-W.; Kwak, C.H.; Rethinasabapathy, M.; Huh, Y.S. Fabrication of CsPbBr3 Perovskite Quantum Dots/Cellulose-Based Colorimetric Sensor: Dual-Responsive On-Site Detection of Chloride and Iodide Ions. Ind. Eng. Chem. Res. 2019, 59, 793–801. [Google Scholar] [CrossRef]
  11. Roda, C.; Abdelhady, A.L.; Shamsi, J.; Lorenzon, M.; Pinchetti, V.; Gandini, M.; Meinardi, F.; Manna, L.; Brovelli, S. O2 as a molecular probe for nonradiative surface defects in CsPbBr3 perovskite nanostructures and single crystals. Nanoscale 2019, 11, 7613–7623. [Google Scholar] [CrossRef] [PubMed]
  12. Zhang, L.; Zhu, Y.; Li, F.; Zhang, L.; You, L.; Guo, Z.; Huang, Y.; Zhao, L.; Chen, X. Colorimetric Sensing of Benzoyl Peroxide Based on the Emission Wavelength-Shift of CsPbBr3 Perovskite Nanocrystals. Chemosensors 2021, 9, 319. [Google Scholar] [CrossRef]
  13. Fu, Y.-B.; Wen, Q.-L.; Ding, H.-T.; Yang, N.; Chai, X.-Y.; Zhang, Y.; Ling, J.; Shi, Y.-G.; Cao, Q. Green and simple synthesis of NH2-functionalized CsPbBr3 perovskite nanocrystals for detection of iodide ion. Microchem. J. 2022, 182, 107892. [Google Scholar] [CrossRef]
  14. Wang, Z.; Fu, R.; Li, F.; Xie, H.; He, P.; Sha, Q.; Tang, Z.; Wang, N.; Zhong, H. One-Step Polymeric Melt Encapsulation Method to Prepare CsPbBr3 Perovskite Quantum Dots/Polymethyl Methacrylate Composite with High Performance. Adv. Funct. Mater. 2021, 31, 2010009. [Google Scholar] [CrossRef]
  15. Wu, H.; Wang, S.; Cao, F.; Zhou, J.; Wu, Q.; Wang, H.; Li, X.; Yin, L.; Yang, X. Ultrastable Inorganic Perovskite Nanocrystals Coated with a Thick Long-Chain Polymer for Efficient White Light-Emitting Diodes. Chem. Mater. 2019, 31, 1936–1940. [Google Scholar] [CrossRef]
  16. Xin, Y.; Zhao, H.; Zhang, J. Highly Stable and Luminescent Perovskite-Polymer Composites from a Convenient and Universal Strategy. ACS Appl. Mater. Interfaces 2018, 10, 4971–4980. [Google Scholar] [CrossRef]
  17. Loiudice, A.; Saris, S.; Oveisi, E.; Alexander, D.T.L.; Buonsanti, R. CsPbBr3 QD/AlOx Inorganic Nanocomposites with Exceptional Stability in Water, Light, and Heat. Angew. Chem. Int. Ed. Engl. 2017, 56, 10696–10701. [Google Scholar] [CrossRef]
  18. Wang, H.C.; Lin, S.Y.; Tang, A.C.; Singh, B.P.; Tong, H.C.; Chen, C.Y.; Lee, Y.C.; Tsai, T.L.; Liu, R.S. Mesoporous Silica Particles Integrated with All-Inorganic CsPbBr3 Perovskite Quantum-Dot Nanocomposites (MP-PQDs) with High Stability and Wide Color Gamut Used for Backlight Display. Angew. Chem. Int. Ed. Engl. 2016, 55, 7924–7929. [Google Scholar] [CrossRef]
  19. Li, H.; Li, F.; Huang, Y.; Zhang, L.; Ye, M.; Jin, J.; Chen, X. Photoluminescence Sensing of Chloride Ions in Sea Sand Using Alcohol-Dispersed CsPbBr3@SiO2 Perovskite Nanocrystal Composites. Chemosensors 2022, 10, 170. [Google Scholar] [CrossRef]
  20. Ren, J.J.; Li, T.R.; Zhou, X.P.; Dong, X.; Shorokhov, A.V.; Semenov, M.B.; Krevchik, V.D.; Wang, Y.H. Encapsulating all-inorganic perovskite quantum dots into mesoporous metal organic frameworks with significantly enhanced stability for optoelectronic applications. Chem. Eng. J. 2019, 358, 30–39. [Google Scholar] [CrossRef]
  21. Rungtaweevoranit, B.; Zhao, Y.; Choi, K.M.; Yaghi, O.M. Cooperative effects at the interface of nanocrystalline metal–organic frameworks. Nano Res. 2016, 9, 47–58. [Google Scholar] [CrossRef]
  22. Zhang, C.; Li, W.; Li, L. Metal Halide Perovskite Nanocrystals in Metal-Organic Framework Host: Not Merely Enhanced Stability. Angew. Chem. Int. Ed. Engl. 2021, 60, 7488–7501. [Google Scholar] [CrossRef] [PubMed]
  23. Xu, Y.F.; Yang, M.Z.; Chen, B.X.; Wang, X.D.; Chen, H.Y.; Kuang, D.B.; Su, C.Y. A CsPbBr3 Perovskite Quantum Dot/Graphene Oxide Composite for Photocatalytic CO2 Reduction. J. Am. Chem. Soc. 2017, 139, 5660–5663. [Google Scholar] [CrossRef]
  24. Ma, Z.; Xu, Y.; Li, P.; Cheng, D.; Zhu, X.; Liu, M.; Zhang, Y.; Liu, Y.; Yao, S. Self-Catalyzed Surface Reaction-Induced Fluorescence Resonance Energy Transfer on Cysteine-Stabilized MnO2 Quantum Dots for Selective Detection of Dopamine. Anal. Chem. 2021, 93, 3586–3593. [Google Scholar] [CrossRef]
  25. Hu, Y.-L.; Yang, N.; Zhao, R.-X.; Fu, Y.-B.; Ling, J.; Xie, X.-G.; Cao, Q. A water-soluble luminescent cesium-lead perovskite nanocrystal probe for sensitive detection of penicillamine. Dye. Pigment. 2022, 205, 110537–110545. [Google Scholar] [CrossRef]
  26. Hu, Y.L.; Wen, Q.L.; Pu, Z.F.; Liu, A.Y.; Wang, J.; Ling, J.; Xie, X.G.; Cao, Q.E. Rapid synthesis of cesium lead halide perovskite nanocrystals by l-lysine assisted solid-phase reaction at room temperature. RSC Adv. 2020, 10, 34215–34224. [Google Scholar] [CrossRef] [PubMed]
  27. Paulino, L.S.; Angeles-Agdeppa, I.; Etorma, U.M.; Ramos, A.C.; Cavalli-Sforza, T. Weekly iron-folic acid supplementation to improve iron status and prevent pregnancy anemia in Filipino women of reproductive age: The Philippine experience through government and private partnership. Nutr. Rev. 2005, 63 Pt 2, S109–S115. [Google Scholar] [CrossRef]
  28. Rosenquist, T.H.; Finnell, R.H. Genes, folate and homocysteine in embryonic development. Proc. Nutr. Soc. 2007, 60, 53–61. [Google Scholar] [CrossRef] [Green Version]
  29. Tsolaki, M.; Kartali, N. Folic acid and Alzheimer’s disease. Int. J. Geriatr. Psychiatry 2003, 18, 187–188. [Google Scholar] [CrossRef]
  30. Hau Fung Cheung, R.; Hughes, J.G.; Marriott, P.J.; Small, D.M. Investigation of folic acid stability in fortified instant Asian noodles by use of capillary electrophoresis. Food Chem. 2009, 112, 507–514. [Google Scholar] [CrossRef]
  31. Zhao, T.; Lin, H.; Li, N.; Shi, H.; Kang, W.; Xu, X. Determination of folic acid by capillary zone electrophoresis with indirect chemiluminescence detection. RSC Adv. 2021, 11, 20063–20069. [Google Scholar] [CrossRef] [PubMed]
  32. Aurora-Prado, M.S.; Silva, C.A.; Tavares, M.F.M.; Altria, K.D. Determination of folic acid in tablets by microemulsion electrokinetic chromatography. J. Chromatogr. A 2004, 1051, 291–296. [Google Scholar] [CrossRef] [PubMed]
  33. Kang, L.; Lin, C.; Ning, F.; Sun, X.; Zhang, M.; Zhang, H.; Wang, Y.; Hu, P. Rapid determination of folic acid and riboflavin in urine by polypyrrole magnetic solid-phase extractant combined ultra-performance liquid chromatography. J. Chromatogr. A 2021, 1648, 462192. [Google Scholar] [CrossRef] [PubMed]
  34. Martín Tornero, E.; Espinosa-Mansilla, A.; Durán Merás, I. High-performance liquid chromatography with fast-scanning fluorescence detection and post-column on-line photoderivatization for the analysis of folic acid and its metabolites in vegetables. Microchem. J. 2017, 133, 333–345. [Google Scholar] [CrossRef]
  35. Ganesh, P.-S.; Kim, S.-Y.; Kaya, S.; Salim, R.; Shimoga, G.; Lee, S.-H. Quantum Chemical Studies and Electrochemical Investigations of Polymerized Brilliant Blue-Modified Carbon Paste Electrode for In Vitro Sensing of Pharmaceutical Samples. Chemosensors 2021, 9, 135. [Google Scholar] [CrossRef]
  36. Han, S.; Chen, X. Copper nanoclusters-enhanced chemiluminescence for folic acid and nitrite detection. Spectrochim. Acta A Mol Biomol. Spectrosc. 2019, 210, 315–320. [Google Scholar] [CrossRef]
  37. Zhang, B.T.; Zhao, L.; Lin, J.M. Determination of folic acid by chemiluminescence based on peroxomonosulfate-cobalt(II) system. Talanta 2008, 74, 1154–1159. [Google Scholar] [CrossRef]
  38. Zhou, C.; Chen, Y.; Shang, P.; Chi, Y. Strong electrochemiluminescent interactions between carbon nitride nanosheet-reduced graphene oxide nanohybrids and folic acid, and ultrasensitive sensing for folic acid. Analyst 2016, 141, 3379–3388. [Google Scholar] [CrossRef]
  39. Liu, Z.-G.; Xiao, M.; Yang, R.-Z.; Zhou, Q.-Q.; Ye, H.-F.; Yi, C.-Q. Multiplexed Detection of Fe3+, Cobalamin and Folate Using Fluorescent Nanoprobe-Based Microarrays and a Smartphone. J. Anal. Test. 2021, 5, 19–29. [Google Scholar] [CrossRef]
  40. Liu, B.; Wei, S.; Liu, E.; Zhang, H.; Lu, P.; Wang, J.; Sun, G. Nitrogen-doped carbon dots as a fluorescent probe for folic acid detection and live cell imaging. Spectrochim. Acta Part A Mol. Biomol. Spectrosc. 2022, 268, 120661. [Google Scholar] [CrossRef]
  41. Wen, Q.-L.; Pu, Z.-F.; Yang, Y.-J.; Wang, J.; Wu, B.-C.; Hu, Y.-L.; Liu, P.; Ling, J.; Cao, Q. Hyaluronic acid as a material for the synthesis of fluorescent carbon dots and its application for selective detection of Fe3+ ion and folic acid. Microchem. J. 2020, 159, 105364–105372. [Google Scholar] [CrossRef]
  42. Hao, Y.; Yu, L.; Li, T.; Chen, L.; Han, X.; Chai, F. The synthesis of carbon dots by folic acid and utilized as sustainable probe and paper sensor for Hg2+ sensing and cellular imaging. Spectrochim. Acta Part A Mol. Biomol. Spectrosc. 2023, 285, 121865. [Google Scholar] [CrossRef] [PubMed]
  43. Chen, D.; Li, J.; Chen, X.; Chen, J.; Zhong, J. Grinding Synthesis of APbX3 (A = MA, FA, Cs; X = Cl, Br, I) Perovskite Nanocrystals. ACS Appl. Mater. Interfaces 2019, 11, 10059–10067. [Google Scholar] [CrossRef]
  44. Chen, X.M.; Zhang, F.; Ge, Y.; Shi, L.F.; Huang, S.; Tang, J.L.; Lv, Z.; Zhang, L.; Zou, B.S.; Zhong, H.Z. Centimeter-Sized Cs4PbBr6 Crystals with Embedded CsPbBr3 Nanocrystals Showing Superior Photoluminescence: Nonstoichiometry Induced Transformation and Light-Emitting Applications. Adv. Funct. Mater. 2018, 28, 1706567. [Google Scholar] [CrossRef]
  45. Wang, C.; Zhang, C.; Wang, F.; Chen, J.; Ren, E.; Kong, J.; Li, L.; Xu, J.; Zhang, Y. Synthesis of highly luminescent CsPbBr3@Cs4PbBr6 nanocrystals via ligand-assisted reaction. Opt. Mater. 2022, 128, 112444–112452. [Google Scholar] [CrossRef]
  46. Peng, X.; Chen, J.; Wang, F.; Zhang, C.; Yang, B. One-pot synthesis of CsPbBr3/Cs4PbBr6 perovskite composite. Optik 2020, 208, 164579. [Google Scholar] [CrossRef]
  47. Gültekin, A.; Karanfil Celep, G.; Say, R. Gadolinium chelate monomer based memories onto QCM electrodes for folic acid detection in commercial follow-on baby milk. J. Food Meas. Charact. 2018, 12, 2892–2898. [Google Scholar] [CrossRef]
  48. Sun, Y.; Wang, X.; Zhang, H. Sensitive and Stable Electrochemical Sensor for Folic Acid Determination Using a ZIF-67/AgNWs Nanocomposite. Biosensors 2022, 12, 382. [Google Scholar] [CrossRef]
  49. Kayani, K.F.; Omer, K.M. A red luminescent europium metal organic framework (Eu-MOF) integrated with a paper strip using smartphone visual detection for determination of folic acid in pharmaceutical formulations. New J. Chem. 2022, 46, 8152–8161. [Google Scholar] [CrossRef]
  50. Li, X.F.; Qiao, J.; Sun, Y.J.; Li, Z.W.; Qi, L. Ligand-modulated synthesis of gold nanoclusters for sensitive and selective detection of folic acid. J. Anal. Sci. Technol. 2021, 12, 12–17. [Google Scholar] [CrossRef]
  51. Nghia, N.N.; Huy, B.T.; Lee, Y.I. Paper-based colorimetric probe for highly sensitive detection of folic acid based on open-ring form amplification of rhodamine B derivative. J. Ind. Eng. Chem. 2020, 81, 352–359. [Google Scholar] [CrossRef]
  52. Vaishanav, S.K.; Korram, J.; Nagwanshi, R.; Karbhal, I.; Dewangan, L.; Ghosh, K.K.; Satnami, M.L. Interaction of Folic Acid with Mn(2+) Doped CdTe/ZnS Quantum Dots: In Situ Detection of Folic Acid. J. Fluoresc. 2021, 31, 951–960. [Google Scholar] [CrossRef] [PubMed]
  53. Yang, M.; Wang, C.J.; Yan, Y.J.; Liu, E.Z.; Hu, X.Y.; Hao, H.; Fan, J. Visual detection of folic acid based on silica coated CdTeS quantum dots in serum samples. Mater. Res. Bull. 2021, 144, 111509. [Google Scholar] [CrossRef]
  54. Li, X.; Chen, L. Fluorescence Probe Based on an Amino-Functionalized Fluorescent Magnetic Nanocomposite for Detection of Folic Acid in Serum. ACS Appl. Mater. Interfaces 2016, 8, 31832–31840. [Google Scholar] [CrossRef]
Figure 1. Fluorescence and UV absorption spectra of CsPbBr3/Cs4PbBr6 PNCs. Inset: photos of the CsPbBr3/Cs4PbBr6 PNCs under UV irradiation and natural light. Experimental conditions: synthetic precursors: CsBr (45.4 mM), PbBr2 (45.4 mM), N-6-trifluoroacetyl-L-lysine (4.54 mM), reaction time: 2.5 h, reaction temperature: −18 °C. Synthesis of CsPbBr3/Cs4PbBr6 PNCs: OLA (250 μL), precursor (1.375 mL). Reaction time: 20 min. Reaction temperature: 25 °C.
Chemosensors 11 00019 g001
Figure 2. TEM images of CsPbBr3/Cs4PbBr6 PNCs (AC), X-ray powder diffraction patterns of CsPbBr3/Cs4PbBr6 PNCs (D). Experimental conditions: synthetic precursors: CsBr (45.4 mM), PbBr2 (45.4 mM), N-6-trifluoroacetyl-L-lysine (4.54 mM), reaction time: 2.5 h, reaction temperature: −18 °C. Synthesis of CsPbBr3/Cs4PbBr6 PNCs: OLA (250 μL), precursor (1.375 mL). Reaction time: 20 min, reaction temperature: 25 °C.
Chemosensors 11 00019 g002
Figure 3. X-ray photoelectron spectra of CsPbBr3/Cs4PbBr6 PNCs (AD). Experimental conditions: synthetic precursors: CsBr (45.4 mM), PbBr2 (45.4 mM), N-6-trifluoroacetyl-L-lysine (4.54 mM), reaction time: 2.5 h, reaction temperature: −18 °C. Synthesis of CsPbBr3/Cs4PbBr6 PNCs: OLA (250 μL), precursor (1.375 mL). Reaction time: 20 min, reaction temperature: 25 °C.
Chemosensors 11 00019 g003
Figure 4. Variation of fluorescence intensity of CsPbBr3/Cs4PbBr6 PNCs, with temperature (A,B) and time (C,D). Experimental conditions: synthetic precursors: CsBr (45.4 mM), PbBr2 (45.4 mM), N-6-trifluoroacetyl-L-lysine (4.54 mM), reaction time: 2.5 h, reaction temperature: −18 °C. Synthesis of CsPbBr3/Cs4PbBr6 PNCs: OLA (250 μL), precursor (1.375 mL). Reaction time: 20 min, reaction temperature: 25 °C.
Chemosensors 11 00019 g004aChemosensors 11 00019 g004b
Figure 5. Selective detection of biological small molecules by CsPbBr3/Cs4PbBr6 PNCs (A,B) and interference experiments (C). Experimental conditions: the concentration of CsPbBr3/Cs4PbBr6 PNCs is 0.156 mmol, in terms of Cs atoms, the concentration of all small molecules is 200 μM (selectivity experiment), the concentration of FA is 200 μM, the concentration of other small molecules is 2000 μM (interference experiment). Reaction temperature: 25 °C, response time: 5 min.
Chemosensors 11 00019 g005aChemosensors 11 00019 g005b
Figure 6. Optimization of temperature (A) and time (B) for the detection of FA by CsPbBr3/Cs4PbBr6 PNCs. Experimental conditions: the concentration of CsPbBr3/Cs4PbBr6 PNCs is 0.156 mmol; in terms of Cs atoms, the concentration of FA is 200 μM; (A) reaction temperature: 4–60 °C; reaction time: 15 min; (B) reaction temperature: 25 °C, reaction time: 5–50 min.
Chemosensors 11 00019 g006
Figure 7. Quantitative detection (A,B) and visual detection (C) of folate acid by CsPbBr3/Cs4PbBr6 PNCs. Fluorescence quenching ratio (I0/I) (B) and fluorescence spectrum (A) as a function of FA concentration. Experimental conditions: the concentration of CsPbBr3/Cs4PbBr6 PNCs is 0.156 mmol, in terms of Cs atoms, and the concentration of FA is 10–1600 μM. Reaction temperature: 25 °C, response time: 5 min.
Chemosensors 11 00019 g007
Figure 8. The fluorescence emission of CsPbBr3/Cs4PbBr6 PNCs, FA, and CsPbBr3/Cs4PbBr6 after adding FA spectra (A); the fluorescence excitation spectra of CsPbBr3/Cs4PbBr6 PNCs and FA; UV-Vis absorption spectra of CsPbBr3/Cs4PbBr6 PNCs, FA, CsPbBr3/Cs4PbBr6 PNCs after adding FA (B); the Zeta potential of FA and CsPbBr3/Cs4PbBr6 (C) and fluorescence lifetime decay curves of CsPbBr3/Cs4PbBr6 in the presence and absence of FA (D). Experimental conditions: the concentration of CsPbBr3/Cs4PbBr6 PNCs (0.156 mmol, in terms of Cs atoms), the concentration of FA was 20 μM. The reaction temperature was 25 °C; the response time was 5 min.
Chemosensors 11 00019 g008aChemosensors 11 00019 g008b
Table 1. The comparison of the proposed method with other methods of FA determination.
MethodSystemLinear Range (µM)LOD (µM)Ref.
HPLCPterin-6-carboxylic acid0.11~2.30.017[33]
Electrochemical
analysis
MAAP–Gd(III)@EDMA0~1000.0080[36]
Electrochemical
analysis
ZIF-67/AgNWs@SPCE0.10~100.030[37]
FluorescenceEu-MOF1.0~12.50.30[38]
FluorescenceD-Trp@AuNCs6.3~1005.8[39]
FluorescenceMn2+ − doped CdTe/ZnS QDs0.10~500.20[41]
FluorescenceCsPbBr3/Cs4PbBr6 PNCs10~8001.695This work
Table 2. PL decay parameters of the CsPbBr3/Cs4PbBr6 PNCs and CsPbBr3/Cs4PbBr6 PNCs/FA mixture.
τ1 (ns)τ2 (ns)τaverage (ns)
CsPbBr3/Cs4PbBr6 PNCs2.8117.558.28
CsPbBr3/Cs4PbBr6 PNCs + FA18.193.433.97
Table 3. Detection of FA in the actual samples.
SamplesAdded (μL)Found (µM)Recovery (%)RSD (n = 3, %)
10N.Db----
2100.099.0499.040.2520
3350.0339.496.980.1220
4450.0411.791.480.1960
5600.0657.1109.50.2000
N.Db means below the detection limit (not detected).
Disclaimer/Publisher’s Note: The statements, opinions and data contained in all publications are solely those of the individual author(s) and contributor(s) and not of MDPI and/or the editor(s). MDPI and/or the editor(s) disclaim responsibility for any injury to people or property resulting from any ideas, methods, instructions or products referred to in the content.

