
Single-Cell Transcriptome Analysis of H5N1-HA-Stimulated Alpaca PBMCs
by

Menghua Lyu
1,2,†,
Xuyang Shi
1,†,
Yang Liu
1,
Hongyan Zhao
1,
Yue Yuan
1,
Run Xie
1,
Ying Gu
1,
Yuliang Dong
1 and
Meiniang Wang
1,* 1
BGI-Shenzhen, Shenzhen 518083, China
2
College of Life Science and Agronomy, Zhoukou Normal University, Zhoukou 466001, China
*
Author to whom correspondence should be addressed.
†
These authors contributed equally to this work.
Biomolecules 2023, 13(1), 60; https://doi.org/10.3390/biom13010060
Submission received: 31 October 2022
/
Revised: 30 November 2022
/
Accepted: 2 December 2022
/
Published: 28 December 2022
(This article belongs to the Special Issue Metagenomics and Metatranscriptomics: Recent Advances and Emerging Technologies)
Abstract
:Avian influenza A virus H5N1 is a highly pathogenic and persistently a major threat to global health. Vaccines and antibodies targeting hemagglutinin (HA) protein are the primary management strategies for the epidemic virus. Although camelids possess unique immunological features, the immune response induced by specific antigens has not yet been thoroughly investigated. Herein, we immunized an alpaca with the HA antigen of the H5N1 virus and performed single-cell transcriptome profiling for analysis of longitudinal peripheral blood mononuclear cell (PBMCs) behavior using single-cell sequencing technology (scRNA-seq). We revealed multiple cellular immunities during the immunization. The monocytes continued to expand after immunization, while the plasma cells reached their peak three days after the second antigen stimulation. Both monocytes and B cells were stimulated by the HA antigen and produced cell-type-specific cytokines to participated in the immune response. To our knowledge, this is the first study to examine the HA-specific immunological dynamics of alpaca PBMCs at the single-cell level, which is beneficial for understanding the anti-viral immune system and facilitating the development of more potent vaccines and antibodies in camelid animals.
1. Introduction
The highly pathogenic avian influenza virus (HPAIv) has caused worldwide epidemics in poultry and humans [1]. The H5N1 influenza virus first affected humans in 1997; in 2021, it spread at an unprecedented rate throughout the east coasts of Canada and the United States. Since late 2003, H5N1 has become the most contagious and deadly pathogen in domestic fowl and wild birds, as well as in human populations in Asia, the Middle East, Eastern Europe, and Africa. Over 800 human cases have been recorded, with a fatality rate of more than 50% [1,2]. Hemagglutinin (HA) is a major envelope glycoprotein on the surface of the influenza virus. By mediating the fusion of the endosomal membrane through interaction with the sialic acid receptors on target cells, the HA trimer initiates the viral infection [3,4,5,6]. Therefore, HA proteins have been utilized as primary targets for the influenza vaccine and antibody development to neutralize the influenza virus. Therapeutic approaches that interfere with the HA protein on the influenza virus have demonstrated excellent anti-viral activity in clinical trials [3,7,8].
Camelids as domesticated animals are significant for the economy in many regions of the world and can adapt to a wide range of extreme ecosystems [9]. Recent research on camelid B cells has shown that all individuals of this species possess a special immunological trait that is uncommon in other species [10]. A ‘nanobody’ is a novel single-domain antibody derived from the variable domain of the heavy chain, from heavy-chain-only antibodies (VHH) in camelids. Due to the unique biochemical characteristics, including small size, high affinity, low cytotoxicity, as well as deep tissue penetration [11], nanobodies have been considered the “next generation” antibodies [12]. Recently, there has been an increased interest in camelid immunology. Considerable research has been devoted to studying immunoglobulin and nanobody development [13,14,15]. However, the immune system consists of a complex network of immune cells and related cytokines that contribute to efficient immune responses against infections. Studies on the immune response to antigen-specific immunization are important to understand the immune system of camelid animals.
To date, only a few studies have investigated the cellular components of the camelid immune system. Several studies have described the diversity of peripheral blood mononuclear cells (PBMCs) and revealed the relative proportions of the primary leukocyte subpopulations in camelid animals using flow cytometry [9,16]. Due to the small number of identified cell subgroups and the inconsistent phenotypic and functional definition of leukocyte composition, it is challenging to accurately compare the immunophenotype of leukocytes obtained in different studies [17,18,19]. Single-cell RNA sequencing (scRNA-seq) technology offers unprecedented precision for describing novel cell types, cell states varying from healthy to pathological, or immune cell responses to antigen stimulation [20]. Sophisticated scRNA-seq technology has been used to analyze the kinetics of the immune response during pathogen infections and to reveal the immune regulation mechanism at the single-cell level [21].
In this study, we collected PBMCs from an alpaca and described the transcriptome landscape and longitudinal alterations in response to H1N1-HA protein immunization at the single-cell level. A total of 35,853 cells were obtained during the pre- and post-immunization stages. Based on transcriptome data, we defined the immunophenotype of leukocytes and discovered that HA antigen boosting triggered both innate and adaptive immune responses in the alpaca. Characterization of important lymphocyte subpopulations and dynamics of the immune response to antigen-specific immunization offer valuable information for the development of potent nanobodies and influenza vaccines in camelid animals.
2. Materials and Methods
2.1. Alpaca Immunization
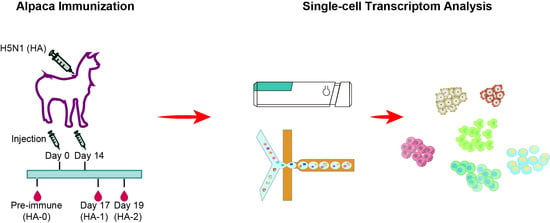
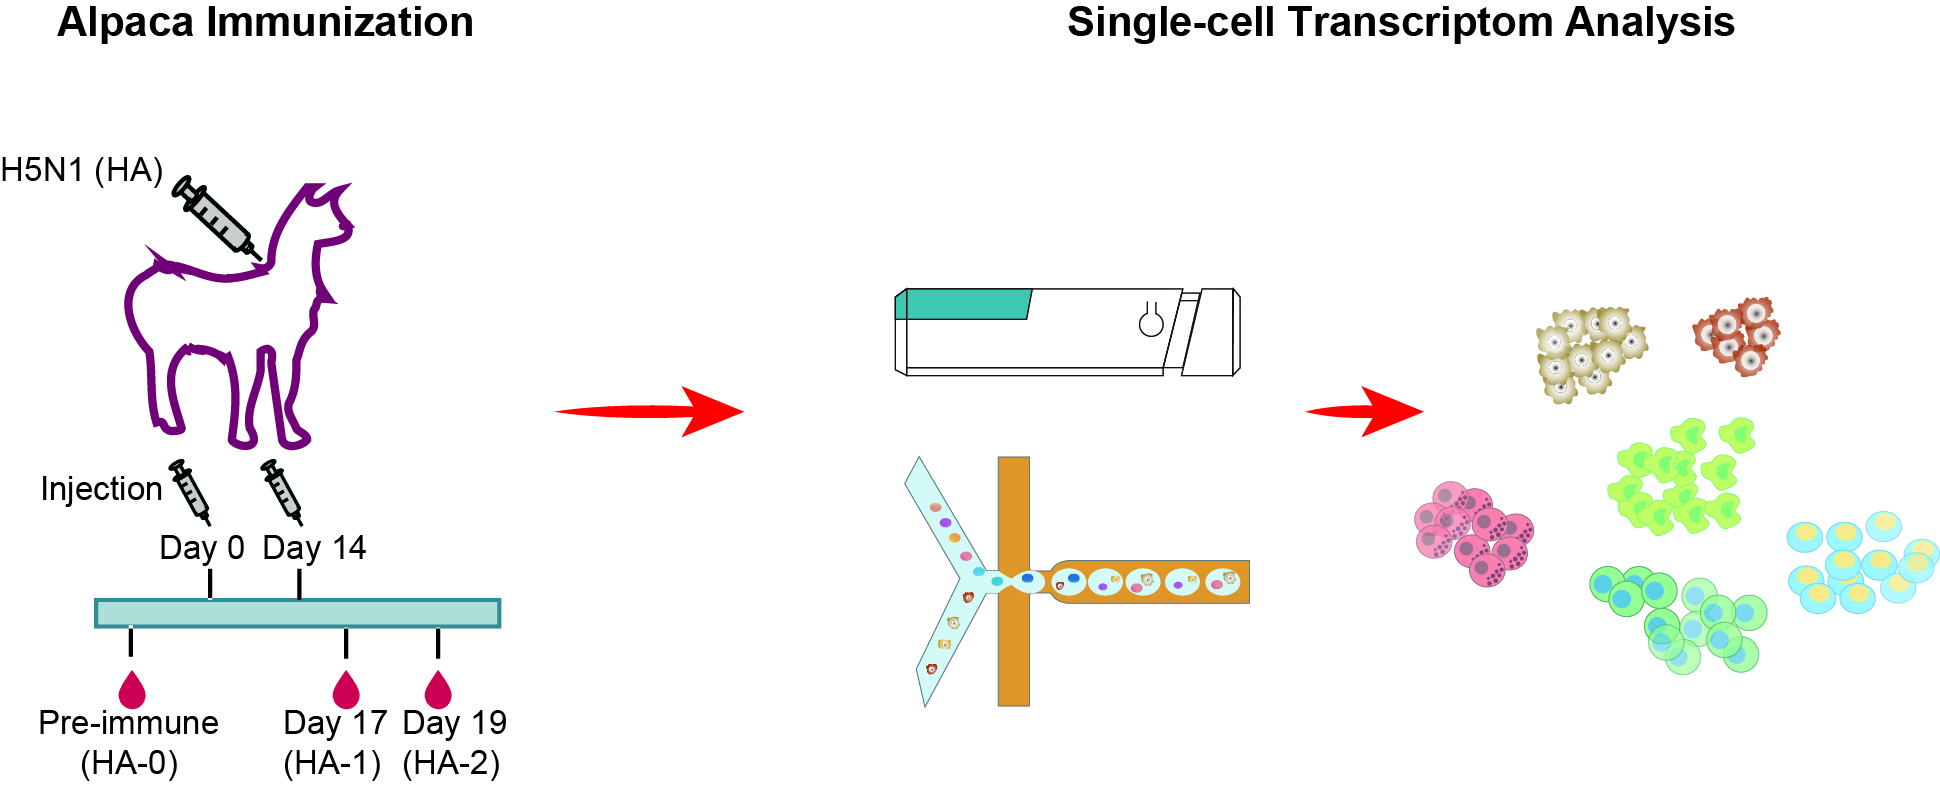
A young, healthy adult female alpaca raised in the China National Gene Bank was immunized twice over a period of 14 days. For immunization, the animal was injected with 250 µg of influenza A hemagglutinin protein (HA1-V5229-1mg, ACROBiosystems, Newark, DE, USA) mixed 1:1 with complete/incomplete Freund’s adjuvant. Whole blood samples were collected before immunization (day 0, HA-0), and at day 17 (HA-1) and day 19 (HA-2) after the second immunization (Figure 1A).
2.2. Serum Titer Assay
An HA-specific enzyme-linked immunosorbent assay (ELISA) binding assay was performed to determine the antibody titer in the alpaca serum. Maxisorp ELISA plates (Invitrogen) were coated with 100 ng of HA protein in a coating buffer (100 nM NaHCO3 in phosphate-buffered saline (PBS), pH 8.3) and incubated overnight at 4 °C, with corresponding blank (non-antigen containing) control and negative (irrelevant antigen containing) control sets. Next, 200 μL of blocking buffer (2% skimmed milk in PBS) was added for 1 h at 25 °C. The alpaca serum collected at HA-0, HA-1, and HA-2 was serially diluted from 101- to 108-fold with phosphate-buffered saline (PBS) and incubated in the plate at 25 °C for 1 h. Next, the plates were washed five times with PBST (0.05% Tween-20 in PBS) before adding the secondary antibody. HRP-conjugated mouse anti-alpaca IgG-antibody (Abcam) was added at a 1:2000 dilution and incubated for 1 h at 25 °C. After adding 100 μL TMB substrate (Abcam, Cambridge, UK), the absorbance at 450 nm was read within 15 min using Synergy™ H1 (BioTek, Winowski, VT, USA).
2.3. Peripheral Blood Mononuclear Cell (PBMC) Isolation
Whole blood samples were collected, and peripheral blood mononuclear cells (PBMCs) from each sample were isolated using Ficoll-Paque™ PLUS Media (GE Healthcare, Chicago, IL, USA) within 2 h, according to the manufacturer’s instructions. Briefly, 10 mL of whole blood was transferred from the collection vessel to a 50 mL EP tube; an equal volume of PBS solution was added to the EP tube to dilute the blood. Then, the diluted blood was added to 15 mL of Ficoll and centrifuged at 500× g for 20 min (accelerate 3, decelerate 0); next, the buffy coat was carefully transferred to a new tube and diluted with PBS to a total volume of 20 mL. The samples were centrifuged again at 600× g for 6 min, after which the buffer was discarded, and the cell pellet was resuspended in 3 mL PBS.
2.4. Single-Cell Library Construction and Sequencing
The DNBelab C Kit (MGI, #1000021082) was used to construct the library. Isolated PBMCs were resuspended as single cells at a density of 5000 cells/mL. Cells were wrapped in droplets with a negative pressure chip, and mRNA was transcribed to cDNA to generate a sequencing library according to the manufacturer’s instructions. Sequencing libraries were quantified using a Qubit™ ssDNA Assay Kit (Thermo Fisher Scientific, Waltham, MA, USA). The cDNA libraries were then subjected to DIPSEQ T1 sequencing (MGI).
2.5. scRNA-Seq Data Processing
High-quality scRNA-seq data with valid barcodes were aligned to the genome of VicPac3.1 through the STAR software, and a unique molecular identifier (UMI) count matrix was generated using PISA (version 1.10.2) (https://github.com/shiquan/PISA (accessed on 8 August 2021)). The raw transcript count matrix was loaded into the R (v4.0) software using the Seurat (v3.1.5) package [22].
2.6. Data Integrating and Cell Clustering
We used the R package Seurat 3.1.5 to integrate and analyze datasets from the three samples (HA-0, HA-1, and HA-2). The integrated mRNA expression matrix was first filtered following the Seurat recommendation and a total of 35,853 cells with unique UMI were obtained [23]. Unsupervised clustering was conducted using Seurat with the parameter res = 0.5, which revealed a total of 18 clusters. We used mRNA biomarkers obtained from recently published articles to classify these clusters into seven major groups (Supplemental Table S1) [24].
2.7. Differentially Expressed Gene (DEG) Analysis
DEGs were calculated using the function FindMarkers built in Seurat with the default parameters. The resulting DEGs were filtered with p_val_adj < 0.05 and then sorted according to the average log2 fold change (avg_log2FC).
2.8. Gene Ontology Analysis
We used the clusterProfiler to annotate the functions of the cell subsets. We filtered the enriched pathways with an FDR q-val of ≤0.05 [25]. The pathways that normalized the enrichment score in the top 20 are shown in the results.
3. Results
3.1. Overview of the Transcriptome Landscape of Alpaca PBMCs
To determine how immunization with the HA protein affected the transcriptome landscape of the alpaca immune system, we administered an adult alpaca twice with the purified HA protein of the H5N1 virus on day 0 and day 14. Using a DIPSEQ T1 sequencer, we sequenced and analyzed the PBMCs isolated on day 0 (HA-0) prior inoculation and days 17 (HA-1) and 19 (HA-2) after the second inoculation (Figure 1A). The serum titer assay revealed that after the second immunization, humoral immunity was boosted by HA-specific antibodies in the alpaca (Figure 1B).
Following strict quality control (with > 350 genes per cell), PBMCs at HA-0, HA-1, and HA-2 generated 13,284, 10,792, and 11,769 single cells, respectively. The average numbers of genes per cell for the three samples were 825, 1163, and 1355, respectively (Supplemental Figure S1). The integrated 35,853 cells were analyzed and plotted using uniform manifold approximation and projection (UMAP) (Figure 1C). Unsupervised clustering of the integrated PBMCs yielded seven major clusters (Figure 1C,E) according to the canonical markers listed in Supplemental Table S1, including CD4+ T cells (CD3+, CD4+, CD8−), CD8+ T cells (CD3+, CD4−, CD8+), double naive T cells (DNT, CD3+, CD4−, CD8−), monocytes (CD3−, CD14+, ITGAM+, CD86+, KLRF4+), B cells (CD19+, MS4A1+, CD79A+, CD79B+), natural killer cells (NK, CD3−, NKG7+, KLRB1+), and dendritic cells (DC, MZB1+, LAMP3+, VASH1+, IRF8+, IL3RA+, CD86+, KLF4+). Additionally, we compared the leukocyte composition between HA-0, HA-1, and HA-2 (Figure 1D, Supplemental Table S2). The immune cell compositions of alpacas underwent a significant alteration upon HA antigen inoculation. Particularly, the percentage of monocytes dramatically increased from 22.31% at baseline (HA-0) to 56.60% on day 19 (HA-2), which implies that innate immunity is involved in antigen-specific immunity.
3.2. Monocyte Response to HA Immunization
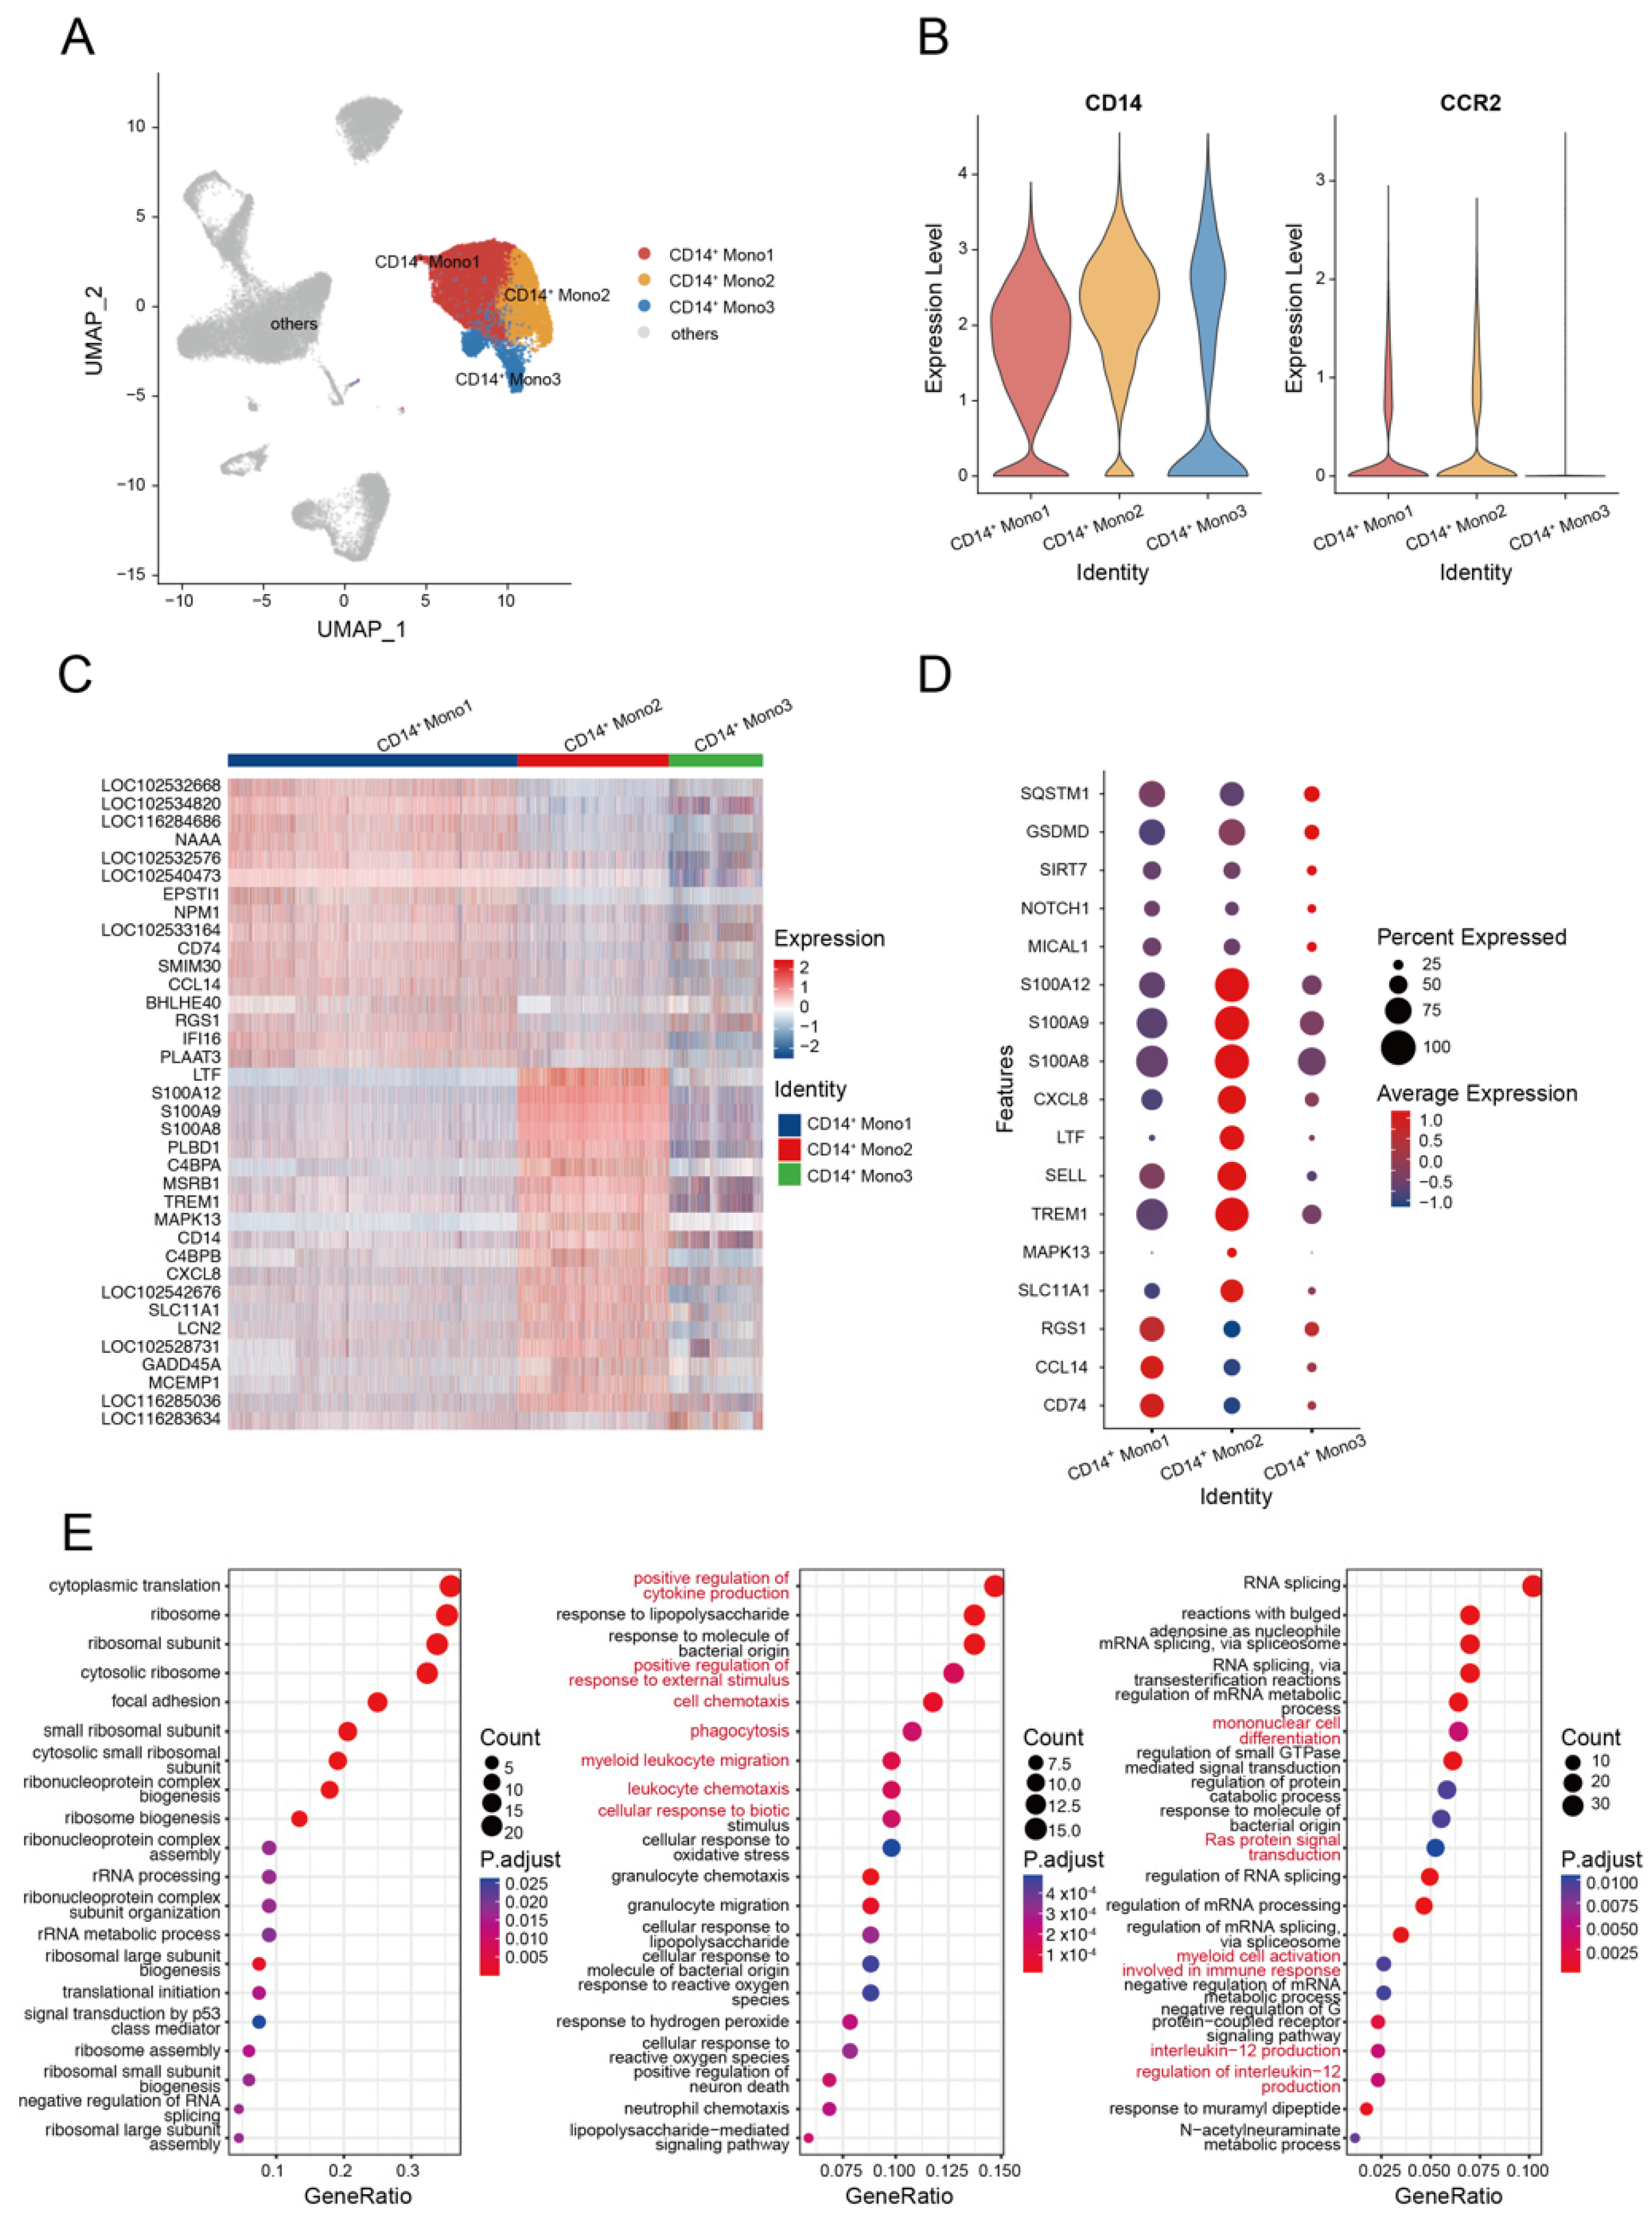
Monocytes are crucial immunological components that play important roles in infection resistance. They participate in innate immune reactions and serve as a bridge to adaptive immune reactions [26]. Based on the relative expression levels of CD14 and CCR2 (CD16 was not found in the current study), we divided the alpaca monocytes into three subsets (Mono1, Mono2, and Mono3) to describe their functional characteristics. We identified the CCR2 gene in the Mono1 and Mono2 subsets (CCR2+), but not in the Mono3 subset (CCR2−). The Mono2 subset was differentiated from Mono1 by a higher expression level of CD14 (Figure 2A,B, Supplemental Figure S2). According to the heatmap, alpaca monocytes constituted heterogeneous populations with distinct transcriptional profiles (Figure 2C).
Mono1 is the majority subset of monocytes, accounting for over 50% of the total monocytes (Supplemental Table S3). Mono1 shows CD14+, SELL+, IL4R+, ITGAL+, ITGAM−, AIF1+, PTPRC+, CD44+, MSR1+, F13A1+, CARD9+, PDXK+, CSF1R+, and BLVRB+. The Mono2 subset shows CD14+, SELL+, IL4R+, ITGAL+, ITGAM+, AIF1+, PTPRC+, CD44+, MSR1+, F13A1+, CARD9+, PDXK+, CSF1R+, and BLVRB+. Compared with Mono2 and Mono3 subsets, Mono1 cells highly expressed the MHC class II antigen-related gene CD74 and chemotaxis-related gene CCL14 and RGS1. Mono2 cells highly expressed genes related to cell activation and differentiation (such as SLC11A1 and MAPK13) [27,28], cell trafficking (TREM1 and SELL) [29], cytokine production LTF [30], and chemokine ligand CXCL8, which indicate the pro-inflammatory state of monocytes. Intriguingly, we discovered that Mono2 cells had high levels of expression of S100 protein-coding genes, including S100A8, S100A9, and S100A12 (Figure 2D), which are associated with inflammatory processes [31,32,33]. Mono3 cells show CD14+, SELL+, IL4R−, ITGAL+, ITGAM−, AIF1+, PTPRC−, CD44−, MSR1−, F13A1+/−, CARD9−, PDXK−, CSF1R−, and BLVRB−. The Mono3 subset highly expressed the reactive oxygen species (ROS) production modulation gene MICAL1 [34], cell tracking and/or differentiation-related gene NOTCH1 [35,36,37] and SIRT7 [38], and the inflammation markers GSDMD and SQSTM1 [39,40].
Next, we conducted a gene ontology (GO) analysis of the upregulated genes for each of the three monocyte subsets. Significant enrichments in the pathways of the positive regulation of cytokine production, positive regulation of response to external stimulus, cell chemotaxis, phagocytosis, myeloid leukocyte migration, cellular response to biotic stimulus, and leukocyte chemotaxis were identified in Mono2 cells (Figure 2E). These findings indicate that the Mono2 subset of alpaca is similar to classical human monocytes and participates in the pro-inflammatory process by activating and priming phagocytosis, innate sensing/immune responses, and migration [41]. Genes highly expressed in Mono3 cells were significantly enriched in mononuclear cell differentiation, Ras protein signal transduction, myeloid cell activation involved in immune response, interleukin-12 production, and regulation of interleukin-12 production (Figure 2E), suggesting that these processes were triggered by HA immunization, resulting in the production of IL-12.
3.3. B Cell Response to H5N1-HA Stimulation
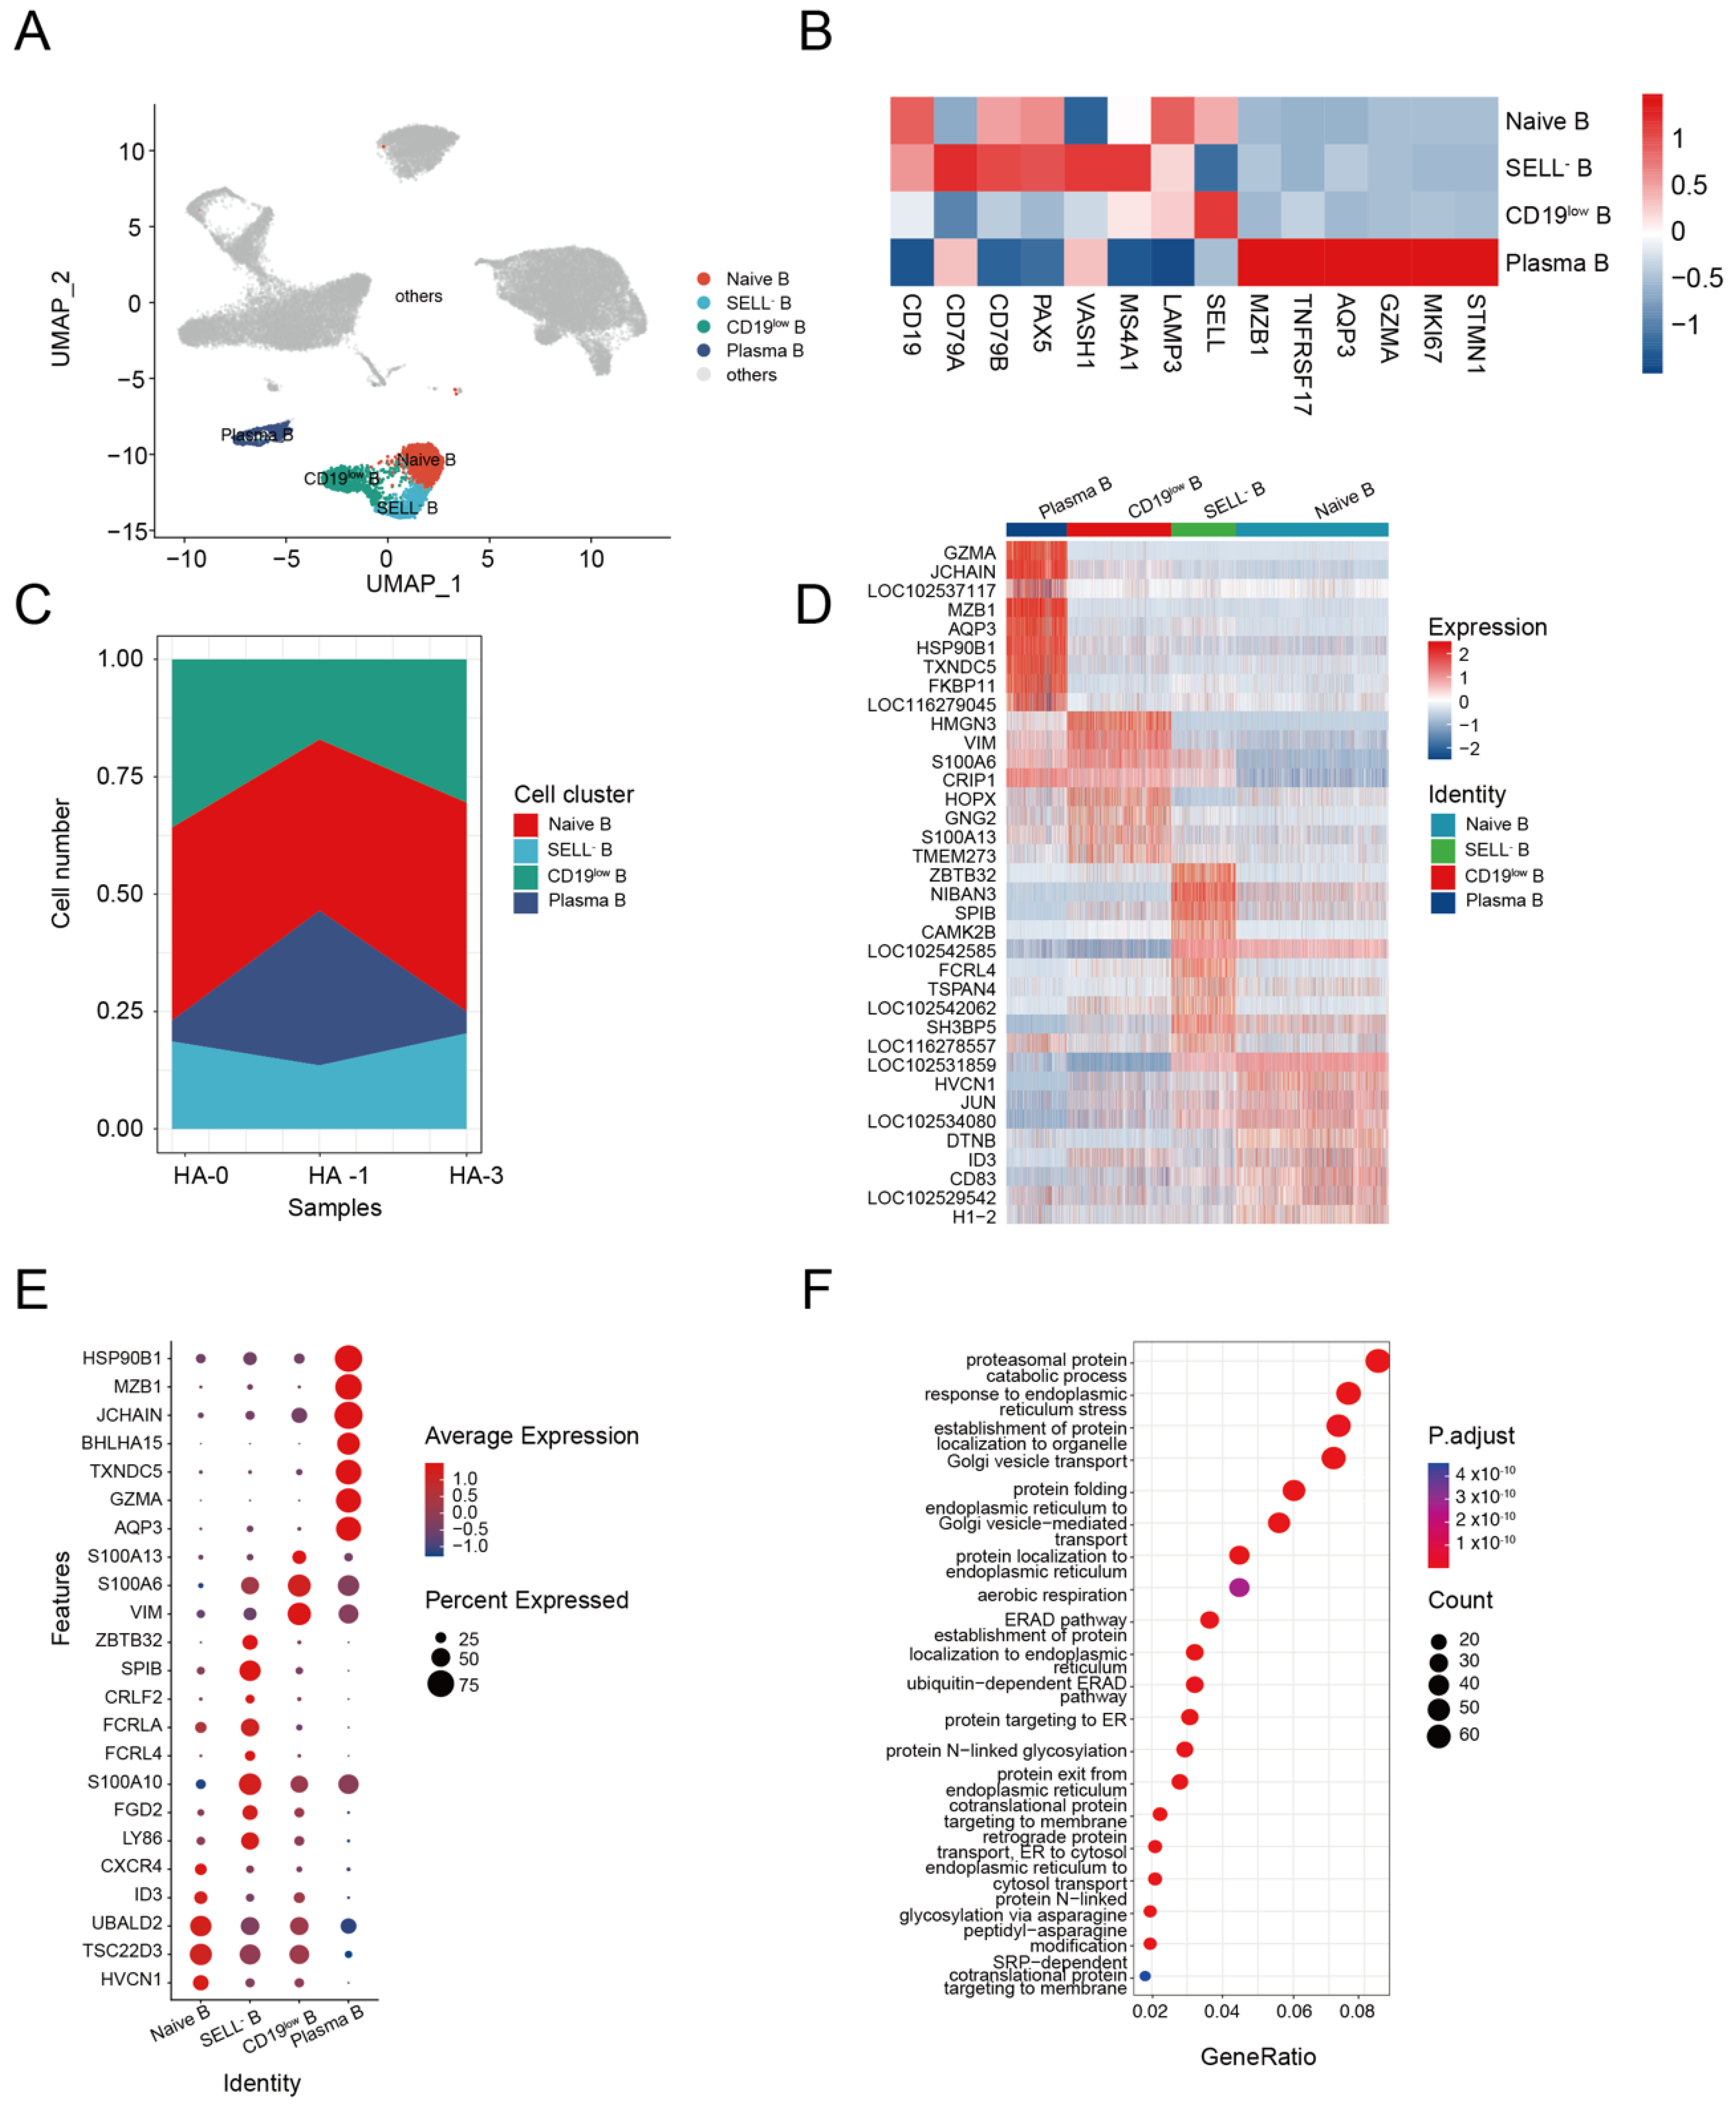
Humoral immunity mediated by the B cell response is known to protect the host during different pathogen infections [42]. We identified four subsets of B cells from alpaca PBMCs, including naive B cells (CD19+, SELL+), SELL− B cells (SELL−, MS4A1+, LAMP3+), CD19low B cells (CD19low, MS4A1+), and plasma B cells (MZB1+, GZMA+, AQP3+) (Figure 3A,B). The composition and changes of the four subsets at HA-0, HA-1, and HA-2 are shown in Figure 3C. The plasma B cell composition of total B cells changed from 4.65% at HA-0 to 32.96% at HA-1 and then back to 4.65% at HA-2 (Supplemental Table S4). Given the production of HA-specific antibodies in the serum (Figure 1B), we assumed that plasma B cells were involved in the enhancement of immunity during immunization with the HA antigen.
Using the FindAllMarkers function, we profiled the transcriptome characteristics of naive B, SELL− B, CD19low B, and plasma B cell subsets and identified differentially expressed genes (DEGs) (Supplemental Table S5). The heatmap of the top 10 DEGs revealed that the four B-cell clusters were distinctly differentiated from each other (Figure 3E).
DEG analysis revealed that the naive B cells highly expressed genes involved in homeostasis, such as HVCN1, TSC22D3 (GILZ), UBALD2 gene, transcription factor ID3 molecule, and the chemokine receptor CXCR4, indicating a relative resting state [43,44,45] (Figure 3F). SELL− B cells highly expressed a series of genes related to memory B (LY86, FGD2, and S100A10) [46,47]. However, some genes related to the atypical memory B cell phenotype, such as the Fc family receptor genes FCRL4 and FCRLA, CRLF2 [48], SPIB [49], and ZBTB32 [50], were found in the SELL− B cells (Figure 3F). These results indicated that the SELL− B cells are dysfunctional atypical memory B cells. CD19low B cells highly expressed genes related to cell motility, such as the encoding type III intermediate filament protein (VIM) [51] and S100 calcium-binding proteins (S100A6, S100A13) [52,53], indicating their activation state (Figure 3F). Plasma B cells highly expressed genes related to cell activation (AQP3, GZMA) [54], differentiation (TXNDC5, BHLHA15) [55,56], and antibody production (JCHAIN, MZB1, and HSP90B1) (Figure 3F) [57,58,59,60,61]. GO analysis demonstrated the significant enrichment of genes associated with Golgi vesicle transport, protein folding, endoplasmic reticulum to Golgi vesicle-mediated transport, protein localization to endoplasmic reticulum, and establishment of protein localization to endoplasmic pathways in plasma B cells (Figure 3G). These results suggest that repeated HA immunization could activate alpaca B cells, which produce antibodies to induce a humoral immune response against the infection.
3.4. The Transcriptome Landscape of T Cells in the Alpaca
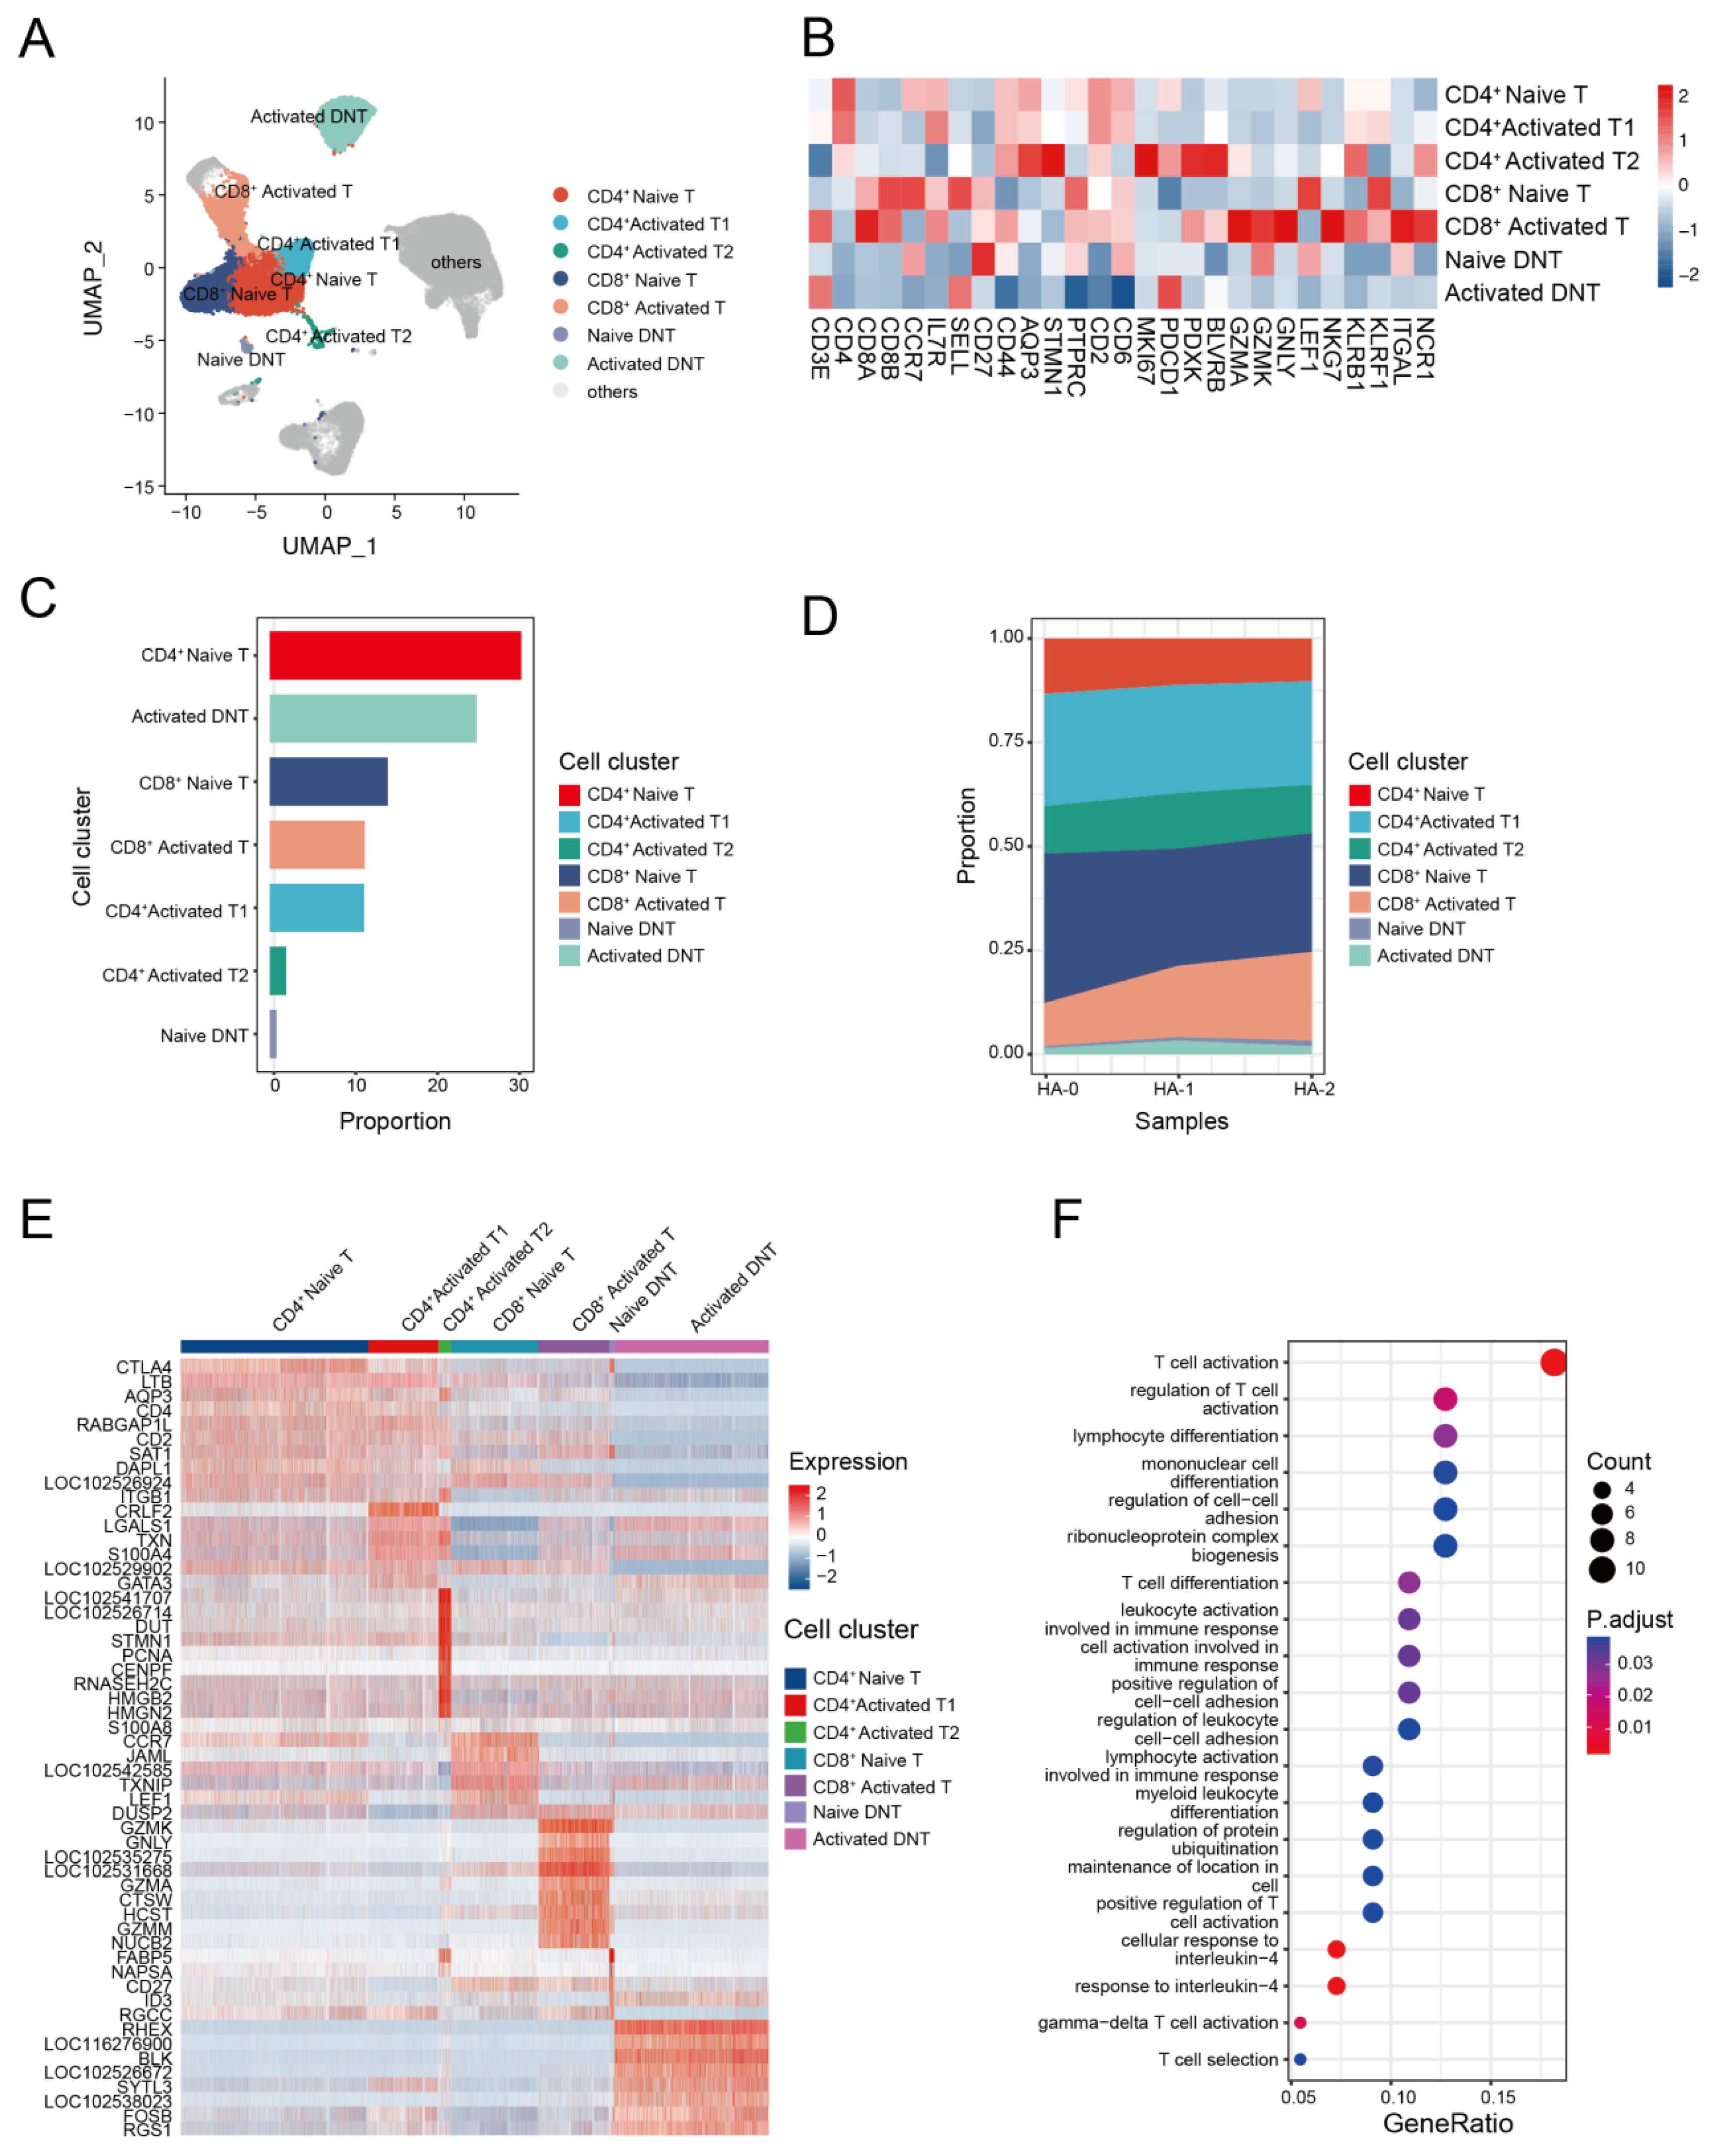
T cells play a key role in the immune response against avian IAV infections [62,63]. To investigate the transcriptome characteristics of T cells, we further classified the T cell subsets with canonical markers into seven clusters. These included three CD4+ T cell subsets: CD4+ naive T cells (CD4+, CCR7+), CD4+ activated T1 cells (CD4+, KLRB1+), and CD4+ activated T2 cells (STMN1+, MKI67+, PDCD1+); two CD8+ T cell subsets: CD8+ naive T cells (CD8A+, LEF1+, CCR7+) and CD8+ activated T cells (CD8A+, GZMK+); and two double negative T (CD4−CD8− T, DNT) cell subsets: naive DNT (CD27+) and activated DNT (PDCD1+) (Figure 4A,B, and Supplemental Figure S3).
The compositions of the seven T cell subsets revealed that CD4+ T cells were the dominant T cell subset (Figure 4C and Supplemental Table S6). Analysis of T cell composition at the sample level revealed a significant decline in naive CD4+ T cells and an increase in activated CD8+ T cells following the second immunization. This finding suggests that antigen immunization may stimulate the proliferation of activated CD8+ T cells (Figure 4D). To identify cell-subtype-specific gene signatures associated with antigen stimulation, we performed an integrated comparative analysis of DEGs from T cell subgroups and found that alpaca T cells exhibited heterogeneous transcriptional changes (Figure 4E). Naive CD4+ T cells highly expressed CCR7 and LEF1, and activated CD4+ T cells expressed S100A4 and S100A8, while GZMK, GNLY, and GZMA genes were enriched in activated CD8+ T cells. GO analysis revealed that the up-regulated expression genes in activated CD8+ T cells were mostly involved in T cell activation, cell killing, and the regulation of the immune effector process. Upregulated genes in other T cell subsets were enriched in different pathways and were associated with various function (Figure 4F).
4. Discussion
Studies on camelid immunity have mainly focused on the generation of nanobodies, which have been widely used in therapeutics and diagnostics [64,65]. Few studies have examined the characteristics of alpaca immune cell composition in response to antigen immunization. In this study, we constructed a comprehensive single-cell landscape of peripheral immune cells from an alpaca with HA antigen stimulation. Using single-cell RNA sequencing, we profiled 35,853 immune cells sampled before and after immunizations. Immune cells were classified into seven major clusters, including CD4+ T cells, naive T cells, monocytes, natural killer cells, and dendritic cells. The immune responses of PBMC clusters were analyzed in detail separately. It is crucial to systematically identify the characteristics of immune cells in response to antigen-specific immunization, and this dataset will undoubtedly further elucidate the underlying molecular mechanisms of the unique immune system of camelid animals.
Antigen-mediated induction of antigen-specific B and T-cell responses requires the activation of the innate immune system, particularly with respect to antigen-presenting cells [66]. Following HA immunization, we found that the proportion of CD14+ monocytes steadily increased to >50%. Two subsets of CD14+ monocytes were activated and displayed pro-inflammatory characteristics by upregulating the expression of genes related to cell activation and differentiation, cell trafficking, and cytokine production. DEG analysis revealed that monocytes were mostly enriched in activities of antigen presentation and granulocyte chemotaxis pathways, which indicates that the innate and adaptive immune cells were activated in response to HA stimulation in the alpaca. However, the activation of the innate immune system can be both protective and detrimental during infections [67]. HPAIv infections can induce a cytokine storm and exaggerate innate immune response, which results in severe pneumonia or death [26,62,68,69]. The substantial increase in monocyte percentage and cytokine production seen in response to HA immunization may indicate an excessive infiltration of pro-inflammatory monocytes, which may result in immunopathology [26,70]. This discovery offers a different perspective to illustrate the generation of cytokine storms.
In addition to the monocytes, the proportion of CD8+ activated T cells also increased. GO analysis revealed that the T cell activation pathway and expression levels of cytotoxicity-related genes were upregulated in CD8+ activated T cells. These results demonstrated that HA-immunization activated the innate immune system, which could assist T cell activation against the infection. We have also noticed that part of the CCR7+SELL+ CD4+ naive T cell cluster identified in this study simultaneously expressed T cell activating genes such as CTLA4 and LTB. This phenomenon emphasizes that naive T cells are much more heterogeneous than previously understood [71,72,73,74,75]. These CCR7+CTLA4+ T cells were evenly distributed among the HA-0, HA-1, and HA-2 samples (data not shown), indicating that the expression of CTLA4 CD4+ in naive T cells was not induced by HA immunization. We speculate that the co-expression of CCR7 and CTLA4 in these CD4+ naive T cells might be a result of continuous stimulation by other antigens several months prior to HA immunization. Further studies on the immune landscape of camelid animals are needed to reveal the occurrence of these naive T cells.
Four B cell subclusters, including naïve B cells, CD19low B cells, SELL− B cells, and plasma B cells were identified in the alpaca PBMCs. This study revealed that SELL− B cells highly express the FCRL4 gene, which may inhibit memory B cells from differentiating into plasma cells by reducing the proliferation and differentiation potential [76]. SELL− B cells were assumed to have an atypical memory B cell phenotype following specific antigen stimulation [77]. A high proportion of plasma B cells highly expressed antibody secretion-related genes, such as TNFRSF17 (BCMA), FKBP11, and MZB1, which can be utilized to develop antibodies targeting alpaca plasma B cells. This is helpful for alpaca plasma cell enrichment during nanobody development. The proportion of plasma B cells during antigen immunization determines the effectiveness of antigen-specific antibody generation [78,79,80]. In this study, we found that the proportions of plasma B cells dramatically increased by day 17 but were significantly reduced by day 19 (day 5 after the second HA immunization), suggesting that the proportion of plasma B cells would reach a peak at three days after the second immunization. Plasma cell dynamics during the specific antigen immunization should offer valuable references for nanobody discovery in immunized camelids [79,80]. However, the sampling periods between the first and second immunizations were not studied here. A larger and more thorough cohort of camelid animals should be constructed in the future to accurately identify the molecular mechanisms underlying the immune response.
5. Conclusions
In summary, we demonstrated the dynamic characteristics of the immune response in an alpaca following immunization with the H5N1 virus HA protein. To our knowledge, this is the first study to examine the immune cell population in camelids at the single-cell level. Our study revealed that both innate and adaptive immune cells were activated after HA antigen stimulation in the alpaca. This work may offer new insights for understanding the unique camelid immune system and provide benefits for research focused on potent vaccine development and antigen-specific nanobodies.
Supplementary Materials
The following supporting information can be downloaded at: https://www.mdpi.com/article/10.3390/biom13010060/s1; Figure S1. scRNA-seq data quality control of alpaca’s PBMCs in each sampling time; Figure S2. Violin plots show the expression levels of mark genes in each subset of monocyte, Figure S3. Feature plots show the expression levels of mark genes in each T cell subset; Table S1. Canonical markers of cell clusters; Table S2. Composition of cell clusters in each sample; Table S3. Proportations of Monocyte subsets in each sample; Table S4. Proportations of B cell subsets in each sample; Table S5. Differentialy expressed genes among B cell subsets; Table S6. Proportations of T cell subsets in each sample.
Author Contributions
M.W. designed and supervised the study; M.L., Y.L. and Y.Y. performed the experiments together; M.L. conducted data analysis; M.L. and X.S. interpreted the data and drafted the manuscript; M.L., X.S., Y.L., H.Z., R.X., Y.G., Y.D. and M.W. revised the manuscript together. All authors have read and agreed to the published version of the manuscript.
Funding
This research was funded by the open project of BGI-Shenzhen, Shenzhen 518000, China (BGIRSZ20210007).
Institutional Review Board Statement
All animal experiments carried out in this study were under the ethical approval guidelines of the Bioethics and Biological Safety Review Committee of BGI-Shenzhen (No. FT20021-T1).
Informed Consent Statement
Not applicable.
Data Availability Statement
Acknowledgments
This work was supported by China National GeneBank (CNGB).
Conflicts of Interest
All authors declare that this research was conducted without any commercial or financial relationships that have potential conflicts of interest.
References
- Wille, M.; Barr, I.G. Resurgence of avian influenza virus. Science 2022, 376, 459–460. [Google Scholar] [CrossRef] [PubMed]
- World Health Organization. Influenza at the Human-Animal Interface: Monthly Risk Assessment and Summary; WHO: Geneva, Switzerland, 2019. [Google Scholar]
- Skarlupka, A.L.; Bebin-Blackwell, A.-G.; Sumner, S.F.; Ross, T.M. Universal Influenza Virus Neuraminidase Vaccine Elicits Protective Immune Responses against Human Seasonal and Pre-pandemic Strains. J. Virol. 2021, 95, JVI0075921. [Google Scholar] [CrossRef] [PubMed]
- De Clercq, E.; Neyts, J. Avian influenza A (H5N1) infection: Targets and strategies for chemotherapeutic intervention. Trends Pharmacol. Sci. 2007, 28, 280–285. [Google Scholar] [CrossRef]
- Berlanda Scorza, F.; Tsvetnitsky, V.; Donnelly, J.J. Universal influenza vaccines: Shifting to better vaccines. Vaccine 2016, 34, 2926–2933. [Google Scholar] [CrossRef] [Green Version]
- Subbarao, K.; Murphy, B.R.; Fauci, A.S. Development of effective vaccines against pandemic influenza. Immunity 2006, 24, 5–9. [Google Scholar] [CrossRef] [PubMed] [Green Version]
- Nachbagauer, R.; Feser, J.; Naficy, A.; Bernstein, D.I.; Guptill, J.; Walter, E.B.; Berlanda-Scorza, F.; Stadlbauer, D.; Wilson, P.C.; Aydillo, T.; et al. A chimeric hemagglutinin-based universal influenza virus vaccine approach induces broad and long-lasting immunity in a randomized, placebo-controlled phase I trial. Nat. Med. 2021, 27, 106–114. [Google Scholar] [CrossRef] [PubMed]
- Clegg, C.H.; Rininger, J.A.; Baldwin, S.L. Clinical vaccine development for H5N1 influenza. Expert Rev. Vaccines 2013, 12, 767–777. [Google Scholar] [CrossRef]
- Hussen, J.; Schuberth, H.J. Recent Advances in Camel Immunology. Front. Immunol. 2021, 11, 614150. [Google Scholar] [CrossRef]
- Kulkarni, S.S.; Falzarano, D. Unique aspects of adaptive immunity in camelids and their applications. Mol. Immunol. 2021, 134, 102–108. [Google Scholar] [CrossRef]
- Blanc, M.R.; Anouassi, A.; Abed, M.A.; Tsikis, G.; Canepa, S.; Labas, V.; Belghazi, M.; Bruneau, G. A one-step exclusion-binding procedure for the purification of functional heavy-chain and mammalian-type γ-globulins from camelid sera. Biotechnol. Appl. Biochem. 2009, 54, 207–212. [Google Scholar] [CrossRef]
- Hamers-Casterman, C.; Atarhouch, T.; Muyldermans, S.; Robinson, G.; Hammers, C.; Songa, E.B.; Bendahman, N.; Hammers, R. Naturally occurring antibodies devoid of light chains. Nature 1993, 363, 446–448. [Google Scholar] [CrossRef] [PubMed]
- Del Rosario, J.M.M.; Smith, M.; Zaki, K.; Risley, P.; Temperton, N.; Engelhardt, O.G.; Collins, M.; Takeuchi, Y.; Hufton, S.E. Protection From Influenza by Intramuscular Gene Vector Delivery of a Broadly Neutralizing Nanobody Does Not Depend on Antibody Dependent Cellular Cytotoxicity. Front. Immunol. 2020, 11, 627. [Google Scholar] [CrossRef] [PubMed]
- Vanlandschoot, P.; Stortelers, C.; Beirnaert, E.; Ibañez, L.I.; Schepens, B.; Depla, E.; Saelens, X. Nanobodies®: New ammunition to battle viruses. Antivir. Res. 2011, 92, 389–407. [Google Scholar] [CrossRef] [PubMed]
- Muyldermans, S. Nanobodies: Natural single-domain antibodies. Annu. Rev. Biochem. 2013, 82, 775–797. [Google Scholar] [CrossRef] [Green Version]
- Topliff, C.L.; Alkheraif, A.A.; Kuszynski, C.A.; Davis, W.C.; Steffen, D.J.; Schmitz, J.A.; Eskridge, K.M.; Charleston, B.; Henningson, J.N.; Kelling, C.L. Experimental acute infection of alpacas with Bovine viral diarrhea virus 1 subgenotype b alters peripheral blood and GALT leukocyte subsets. J. Vet. Diagn. Investig. 2017, 29, 186–192. [Google Scholar] [CrossRef] [Green Version]
- Zidan, M.; Schuberth, H.J.; Pabst, R. Immunohistology of the splenic compartments of the one humped camel (Camelus dromedarius). Vet. Immunol. Immunopathol. 2000, 74, 17–29. [Google Scholar] [CrossRef]
- Ungar-Waron, H.; Yagil, R.; Brenner, J.; Paz, R.; Partosh, N.; van Creveld, C.; Lubashevsky, E.; Trainin, Z. Reactions of peripheral blood mononuclear cells (PBMC) of camels with monoclonal antibodies against ruminant leukocytes. Comp. Immunol. Microbiol. Infect. Dis. 2003, 26, 137–143. [Google Scholar] [CrossRef]
- Henry, K.A.; van Faassen, H.; Harcus, D.; Marcil, A.; Hill, J.J.; Muyldermans, S.; Mackenzie, C.R. Llama peripheral B-cell populations producing conventional and heavy chain-only IgG subtypes are phenotypically indistinguishable but immunogenetically distinct. Immunogenetics 2019, 71, 307–320. [Google Scholar] [CrossRef]
- Papalexi, E.; Satija, R. Single-cell RNA sequencing to explore immune cell heterogeneity. Nat. Rev. Immunol. 2018, 18, 35–45. [Google Scholar] [CrossRef]
- Olsen, T.K.; Baryawno, N. Introduction to Single-Cell RNA Sequencing. Curr. Protoc. Mol. Biol. 2018, 122, e57. [Google Scholar] [CrossRef]
- Satija, R.; Farrell, J.A.; Gennert, D.; Schier, A.F.; Regev, A. Spatial reconstruction of single-cell gene expression data. Nat. Biotechnol. 2015, 33, 495–502. [Google Scholar] [CrossRef] [PubMed] [Green Version]
- Stuart, T.; Butler, A.; Hoffman, P.; Hafemeister, C.; Papalexi, E.; Mauck, W.M.; Hao, Y.; Stoeckius, M.; Smibert, P.; Satija, R. Comprehensive Integration of Single-Cell Data. Cell 2019, 177, 1888–1902.e21. [Google Scholar] [CrossRef] [PubMed]
- Szabo, P.A.; Levitin, H.M.; Miron, M.; Snyder, M.E.; Senda, T.; Yuan, J.; Cheng, Y.L.; Bush, E.C.; Dogra, P.; Thapa, P.; et al. Single-cell transcriptomics of human T cells reveals tissue and activation signatures in health and disease. Nat. Commun. 2019, 10, 4706. [Google Scholar] [CrossRef] [Green Version]
- Among, T.; Clusters, G.; Yu, G. clusterProfiler: An R Package for Comparing Biological Themes Among Gene Clusters. OMICS 2012, 16, 284–287. [Google Scholar] [CrossRef]
- Lamichhane, P.P.; Samarasinghe, A.E. The Role of Innate Leukocytes during Influenza Virus Infection. J. Immunol. Res. 2019, 2019, 8028725. [Google Scholar] [CrossRef] [PubMed] [Green Version]
- Hedges, J.F.; Kimmel, E.; Snyder, D.T.; Jerome, M.; Jutila, M.A. Solute Carrier 11A1 Is Expressed by Innate Lymphocytes and Augments Their Activation. J. Immunol. References 2022, 190, 4263–4273. [Google Scholar] [CrossRef] [Green Version]
- Zhang, Z.; Shively, J.E. Acceleration of Bone Repair in NOD/SCID Mice by Human Monoosteophils, Novel LL-37-Activated Monocytes. PLoS ONE 2013, 8, e67649. [Google Scholar] [CrossRef] [Green Version]
- Vandestienne, M.; Zhang, Y.; Santos-Zas, I.; Al-Rifai, R.; Joffre, J.; Giraud, A.; Laurans, L.; Esposito, B.; Pinet, F.; Bruneval, P.; et al. TREM-1 orchestrates angiotensin II-induced monocyte trafficking and promotes experimental abdominal aortic aneurysm. J. Clin. Investig. 2021, 131, e142468. [Google Scholar] [CrossRef]
- Ando, K.; Hasegawa, K.; Shindo, K.-I.; Furusawa, T.; Fujino, T.; Kikugawa, K.; Nakano, H.; Takeuchi, O.; Akira, S.; Akiyama, T.; et al. Human lactoferrin activates NF-jB through the Toll-like receptor 4 pathway while it interferes with the lipopolysaccharide-stimulated TLR4 signaling. FEBS J. 2010, 277, 2051–2066. [Google Scholar] [CrossRef]
- Ghavami, S.; Chitayat, S.; Hashemi, M.; Eshraghi, M.; Chazin, W.J.; Halayko, A.J.; Kerkhoff, C. S100A8/A9: A Janus-faced molecule in cancer therapy and tumorgenesis. Eur. J. Pharmacol. 2009, 625, 73–83. [Google Scholar] [CrossRef]
- Manolakis, A.C.; Kapsoritakis, A.N.; Tiaka, E.K.; Potamianos, S.P. Calprotectin, Calgranulin, C, and Other Members of the S100 Protein Family in Inflammatory Bowel Disease. Dig. Dis. Sci. 2011, 56, 1601–1611. [Google Scholar] [CrossRef] [PubMed]
- Foell, D.; Wittkowski, H.; Kessel, C.; Lüken, A.; Weinhage, T.; Varga, G.; Vogl, T.; Wirth, T.; Viemann, D.; Björk, P.; et al. Proinflammatory S100A12 can activate human monocytes via toll-like receptor 4. Am. J. Respir. Crit. Care Med. 2013, 187, 1324–1334. [Google Scholar] [CrossRef] [PubMed]
- Deng, W.; Wang, Y.; Zhao, S.; Zhang, Y.; Chen, Y.; Zhao, X.; Liu, L.; Sun, S.; Zhang, L.; Ye, B.; et al. MICAL1 facilitates breast cancer cell proliferation via ROS-sensitive ERK/cyclin D pathway. J. Cell. Mol. Med. 2018, 22, 3108–3118. [Google Scholar] [CrossRef]
- Xu, J.; Chi, F.; Guo, T.; Punj, V.; Paul Lee, W.N.; French, S.W.; Tsukamoto, H. NOTCH reprograms mitochondrial metabolism for proinflammatory macrophage activation. J. Clin. Investig. 2015, 125, 1579–1590. [Google Scholar] [CrossRef] [PubMed] [Green Version]
- Singla, D.K.; Wang, J.; Singla, R. Primary human monocytes differentiate into M2 macrophages and involve notch-1 pathway. Can. J. Physiol. Pharmacol. 2016, 95, 288–294. [Google Scholar] [CrossRef] [PubMed] [Green Version]
- Gamrekelashvili, J.; Kapanadze, T.; Sablotny, S.; Ratiu, C.; Dastagir, K.; Lochner, M.; Karbach, S.; Wenzel, P.; Sitnow, A.; Fleig, S.; et al. Notch and TLR signaling coordinate monocyte cell fate and inflammation. Elife 2020, 9, e57007. [Google Scholar] [CrossRef]
- Kaiser, A.; Schmidt, M.; Huber, O.; Frietsch, J.J.; Scholl, S.; Heidel, F.H.; Hochhaus, A.; Müller, J.P.; Ernst, T. SIRT7: An influence factor in healthy aging and the development of age-dependent myeloid stem-cell disorders. Leukemia 2020, 34, 2206–2216. [Google Scholar] [CrossRef]
- Li, H.; Zhao, X.-K.; Cheng, Y.-J.; Zhang, Q.; Wu, J.; Lu, S.; Zhang, W.; Liu, Y.; Zhou, M.-Y.; Wang, Y.; et al. Gasdermin D-mediated hepatocyte pyroptosis expands inflammatory responses that aggravate acute liver failure by upregulating monocyte chemotactic protein 1/CC chemokine receptor-2 to recruit macrophages. World J. Gastroenterol. 2019, 25, 6527–6540. [Google Scholar] [CrossRef]
- Zhou, B.; Liu, J.; Zeng, L.; Zhu, S.; Wang, H.; Billiar, T.R.; Kroemer, G.; Klionsky, D.J.; Zeh, H.J.; Jiang, J.; et al. Extracellular SQSTM1 mediates bacterial septic death in mice through insulin receptor signalling. Nat. Microbiol. 2020, 5, 1576–1587. [Google Scholar] [CrossRef]
- Kapellos, T.S.; Bonaguro, L.; Gemünd, I.; Reusch, N.; Saglam, A.; Hinkley, E.R.; Schultze, J.L. Human monocyte subsets and phenotypes in major chronic inflammatory diseases. Front. Immunol. 2019, 10, 2035. [Google Scholar] [CrossRef]
- Krammer, F. The human antibody response to influenza A virus infection and vaccination. Nat. Rev. Immunol. 2019, 19, 383–397. [Google Scholar] [CrossRef] [PubMed]
- Jang, J.W.; Thuy, P.X.; Lee, J.W.; Moon, E.Y. CXCR4 promotes B cell viability by the cooperation of nuclear factor (erythroid-derived 2)-like 2 and hypoxia-inducible factor-1α under hypoxic conditions. Cell Death Dis. 2021, 12, 330. [Google Scholar] [CrossRef] [PubMed]
- Nie, Y.; Waite, J.; Brewer, F.; Sunshine, M.J.; Littman, D.R.; Zou, Y.R. The role of CXCR4 in maintaining peripheral B cell compartments and humoral immunity. J. Exp. Med. 2004, 200, 1145–1156. [Google Scholar] [CrossRef] [PubMed] [Green Version]
- Fan, H.; Morand, F.E. The Role of GILZ in Anti-Inflammatory and Immunosuppressive Actions of Glucocorticoids. In Glucocorticoids—New Recognition of Our Familiar Friend; InTech: Rijeka, Croatia, 2012; pp. 175–192. [Google Scholar] [CrossRef]
- Morgan, D.; Tergaonkar, V. Unraveling B cell trajectories at single cell resolution. Trends Immunol. 2022, 43, 210–229. [Google Scholar] [CrossRef] [PubMed]
- Huber, C.; Mårtensson, A.; Bokoch, G.M.; Nemazee, D.; Gavin, A.L. FGD2, a CDC42-specific exchange factor expressed by antigen-presenting cells, localizes to early endosomes and active membrane ruffles. J. Biol. Chem. 2008, 283, 34002–34012. [Google Scholar] [CrossRef] [PubMed] [Green Version]
- Junco, J.J.; Zorman, B.; Gant, V.U.; Muñoz, J.; Lacorazza, H.D.; Sumazin, P.; Rabin, K.R. CRLF2 overexpression results in reduced B-cell differentiation and upregulated E2F signaling in the Dp16 mouse model of Down syndrome. Exp. Hematol. 2022, 110, 34–38. [Google Scholar] [CrossRef]
- Schmidlin, H.; Diehl, S.A.; Nagasawa, M.; Scheeren, F.A.; Schotte, R.; Uittenbogaart, C.H.; Spits, H.; Blom, B. Spi-B inhibits human plasma cell differentiation by repressing BLIMP1 and XBP-1 expression. Blood 2008, 112, 1804–1812. [Google Scholar] [CrossRef] [Green Version]
- Jash, A.; Wang, Y.; Weisel, F.J.; Scharer, C.D.; Boss, J.M.; Shlomchik, M.J.; Bhattacharya, D. ZBTB32 Restricts the Duration of Memory B Cell Recall Responses. J. Immunol. 2016, 197, 1159–1168. [Google Scholar] [CrossRef] [Green Version]
- Tsui, C.; Maldonado, P.; Montaner, B.; Borroto, A.; Alarcon, B.; Bruckbauer, A.; Martinez-Martin, N.; Batista, F.D. Dynamic reorganisation of intermediate filaments coordinates early B-cell activation. Life Sci. Alliance 2018, 1, e201800060. [Google Scholar] [CrossRef]
- Wang, X.H.; Du, H.; Li, L.; Shao, D.F.; Zhong, X.Y.; Hu, Y.; Liu, Y.Q.; Xing, X.F.; Cheng, X.J.; Guo, T.; et al. Increased expression of S100A6 promotes cell proliferation in gastric cancer cells. Oncol. Lett. 2017, 13, 222–230. [Google Scholar] [CrossRef] [Green Version]
- Yamaguchi, F.; Umeda, Y.; Shimamoto, S.; Tsuchiya, M.; Tokumitsu, H.; Tokuda, M.; Kobayashi, R. S100 proteins modulate protein phosphatase 5 function: A link between Ca2+ signal transduction and protein dephosphorylation. J. Biol. Chem. 2012, 287, 13787–13798. [Google Scholar] [CrossRef] [PubMed] [Green Version]
- Charlestin, V.; Fulkerson, D.; Arias Matus, C.E.; Walker, Z.T.; Carthy, K.; Littlepage, L.E. Aquaporins: New players in breast cancer progression and treatment response. Front. Oncol. 2022, 12, 988119. [Google Scholar] [CrossRef] [PubMed]
- Shen, T.; Sanchez, H.N.; Zan, H.; Casali, P. Genome-wide analysis reveals selective modulation of microRNAs and mRNAs by histone deacetylase inhibitor in B cells induced to undergo class-switch DNA recombination and plasma cell differentiation. Front. Immunol. 2015, 6, 627. [Google Scholar] [CrossRef] [PubMed] [Green Version]
- Kassambara, A.; Herviou, L.; Ovejero, S.; Jourdan, M.; Thibaut, C.; Vikova, V.; Pasero, P.; Elemento, O.; Moreaux, J. RNA-sequencing data-driven dissection of human plasma cell differentiation reveals new potential transcription regulators. Leukemia 2021, 35, 1451–1462. [Google Scholar] [CrossRef] [PubMed]
- Castro, C.D.; Flajnik, M.F. Putting J Chain Back on the Map: How Might Its Expression Define Plasma Cell Development? J. Immunol. 2014, 193, 3248–3255. [Google Scholar] [CrossRef] [Green Version]
- Erlandsson, L.; Akerblad, P.; Vingsbo-Lundberg, C.; Kallberg, E.; Lycke, N.; Leanderson, T. Joining Chain-expressing and-nonexpressing B Cell Populations in the Mouse. J. Exp. Med. 2001, 194, 557–570. [Google Scholar] [CrossRef]
- Xu, A.Q.; Barbosa, R.R.; Calado, D.P. Genetic timestamping of plasma cells in vivo reveals tissue-specific homeostatic population turnover. Elife 2020, 9, e59850. [Google Scholar] [CrossRef]
- Andreani, V.; Ramamoorthy, S.; Pandey, A.; Lupar, E.; Nutt, S.L.; Lämmermann, T.; Grosschedl, R. Cochaperone Mzb1 is a key effector of Blimp1 in plasma cell differentiation and β1-integrin function. Proc. Natl. Acad. Sci. USA 2018, 115, E9630–E9639. [Google Scholar] [CrossRef] [Green Version]
- Liu, B.; Li, Z. Endoplasmic reticulum HSP90bl (gp96, grp94) optimizes B-cell function via chaperoning integrin and TLR but not immunoglobulin. Blood 2008, 112, 1223–1230. [Google Scholar] [CrossRef]
- Koutsakos, M.; Kedzierska, K.; Subbarao, K. Immune Responses to Avian Influenza Viruses. J. Immunol. 2019, 202, 382–391. [Google Scholar] [CrossRef] [Green Version]
- Wang, Z.; Loh, L.; Kedzierski, L.; Kedzierska, K. Avian influenza viruses, inflammation, and CD8+ T cell immunity. Front. Immunol. 2016, 7, 60. [Google Scholar] [CrossRef] [PubMed] [Green Version]
- Comor, L.; Dolinska, S.; Bhide, K.; Pulzova, L.; Munguía, I.J.; Bencurova, E.; Flachbartova, Z.; Potocnakova, L.; Kanova, E.; Bhide, M. Joining the in vitro immunization of alpaca lymphocytes and phage display: Rapid and cost effective pipeline for sdAb synthesis. Microb. Cell Fact. 2017, 16, 13. [Google Scholar] [CrossRef] [PubMed] [Green Version]
- Chow, K.M.; Whiteheart, S.W.; Smiley, J.R.; Sharma, S.; Boaz, K.; Coleman, M.J.; Maynard, A.; Hersh, L.B.; Kooi, C.W.V. Immunization of Alpacas (Lama pacos) with Protein Antigens and Production of Antigen-specific Single Domain Antibodies. J. Vis. Exp. 2019, 143, e58471. [Google Scholar] [CrossRef] [Green Version]
- Pulendran, B.; Ahmed, R. Translating innate immunity into immunological memory: Implications for vaccine development. Cell 2006, 124, 849–863. [Google Scholar] [CrossRef] [PubMed] [Green Version]
- Biondo, C.; Lentini, G.; Beninati, C.; Teti, G. The dual role of innate immunity during influenza. Biomed. J. 2019, 42, 8–18. [Google Scholar] [CrossRef]
- Hoeve, M.A.; Nash, A.A.; Jackson, D.; Randall, R.E.; Dransfield, I. Influenza virus A infection of human monocyte and macrophage subpopulations reveals increased susceptibility associated with cell differentiation. PLoS ONE 2012, 7, e29443. [Google Scholar] [CrossRef] [Green Version]
- Tisoncik, J.R.; Korth, M.J.; Simmons, C.P.; Farrar, J.; Martin, T.R.; Katze, M.G. Into the Eye of the Cytokine Storm. Microbiol. Mol. Biol. Rev. 2012, 76, 16–32. [Google Scholar] [CrossRef] [Green Version]
- Van Furth, R. Monocyte production during inflammation. Comp. Immunol. Microbiol. Infect. Dis. 1985, 8, 205–211. [Google Scholar] [CrossRef]
- Van Den Broek, T.; Borghans, J.A.M.; Van Wijk, F. The full spectrum of human naive T cells. Nat. Rev. Immunol. 2018, 18, 363–373. [Google Scholar] [CrossRef]
- Caccamo, N.; Joosten, S.A.; Ottenhoff, T.H.M.; Dieli, F. Atypical Human Effector/Memory CD4+ T Cells with a Naive-Like Phenotype. Front. Immunol. 2018, 9, 2832. [Google Scholar] [CrossRef] [Green Version]
- Tena-Coki, N.G.; Scriba, T.J.; Peteni, N.; Eley, B.; Wilkinson, R.J.; Andersen, P.; Hanekom, W.A.; Kampmann, B. CD4 and CD8 T-cell responses to mycobacterial antigens in African children. Am. J. Respir. Crit. Care Med. 2010, 182, 120–129. [Google Scholar] [CrossRef] [PubMed] [Green Version]
- Soares, A.P.; Kwong Chung, C.K.C.; Choice, T.; Hughes, E.J.; Jacobs, G.; Van Rensburg, E.J.; Khomba, G.; De Kock, M.; Lerumo, L.; Makhethe, L.; et al. Longitudinal changes in CD4+ T-cell memory responses induced by BCG vaccination of newborns. J. Infect. Dis. 2013, 207, 1084–1094. [Google Scholar] [CrossRef] [PubMed] [Green Version]
- Soares, A.P.; Scriba, T.J.; Joseph, S.; Harbacheuski, R.; Murray, R.A.; Gelderbloem, S.J.; Hawkridge, A.; Hussey, G.D.; Maecker, H.; Kaplan, G.; et al. Bacillus Calmette-Guérin Vaccination of Human Newborns Induces T Cells with Complex Cytokine and Phenotypic Profiles. J. Immunol. 2008, 180, 3569–3577. [Google Scholar] [CrossRef] [PubMed] [Green Version]
- Li, H.; Dement-Brown, J.; Liao, P.J.; Mazo, I.; Mills, F.; Kraus, Z.; Fitzsimmons, S.; Tolnay, M. Fc receptor-like 4 and 5 define human atypical memory B cells. Int. Immunol. 2020, 32, 755–770. [Google Scholar] [CrossRef] [PubMed]
- Sutton, H.J.; Aye, R.; Idris, A.H.; Vistein, R.; Nduati, E.; Kai, O.; Mwacharo, J.; Li, X.; Gao, X.; Andrews, T.D.; et al. Atypical B cells are part of an alternative lineage of B cells that participates in responses to vaccination and infection in humans. Cell Rep. 2021, 34, 108684. [Google Scholar] [CrossRef] [PubMed]
- Mazutis, L.; Gilbert, J.; Ung, W.; A Weitz, D.; Griffiths, A.D.; Heyman, J.A. Single-cell analysis and sorting using droplet-based microfluidics. Nat. Protoc. 2014, 8, 870–891. [Google Scholar] [CrossRef] [PubMed]
- Gérard, A.; Woolfe, A.; Mottet, G.; Reichen, M.; Castrillon, C.; Menrath, V.; Ellouze, S.; Poitou, A.; Doineau, R.; Briseno-Roa, L.; et al. High-throughput single-cell activity-based screening and sequencing of antibodies using droplet microfluidics. Nat. Biotechnol. 2020, 38, 715–721. [Google Scholar] [CrossRef]
- Lyu, M.; Shi, X.; Liu, X.; Liu, Y.; Zhu, X.; Liao, L.; Zhao, H.; Sun, N.; Wang, S.; Chen, L.; et al. Generation and Screening of Antigen-Specific Nanobodies from Mammalian Cells Expressing the BCR Repertoire Library Using Droplet-Based Microfluidics. Anal. Chem. 2022, 94, 7970–7980. [Google Scholar] [CrossRef]
- Guo, X.; Chen, F.; Gao, F.; Li, L.; Liu, K.; You, L.; Hua, C.; Yang, F.; Liu, W.; Peng, C.; et al. CNSA: A data repository for archiving omics data. Database 2020, 2020, baaa055. [Google Scholar] [CrossRef]
- Chen, F.; You, L.; Yang, F.; Wang, L.; Guo, X.; Gao, F.; Hua, C. CNGBdb: China National GeneBank DataBase. Heredity 2020, 42, 799–809. [Google Scholar] [CrossRef]
Figure 1.
Study design and single-cell dynamic landscape of HA-stimulated PBMCs in the alpaca. (A) The alpaca received HA stimulations two times, and blood samples were taken from the alpaca at three time points before and after stimulations. Then, scRNA-seq dynamic analyses were conducted. (B) Line plots display the result of the ELISA binding assay testing the titer of the HA-specific antibody in alpaca serum. (C) Top: UMAP plot shows HA-0, HA-1, and HA-2 in three colors indicating no batch effects; Bottom: UMAP plot shows seven major cell types of 35,853 immune cells by unsupervised clustering. Cells are colored by clusters. (D) Histogram shows the cell proportion of PBMC at different time points. (E) Heatmap shows representative marker expression patterns, which annotate clusters to related cell types.
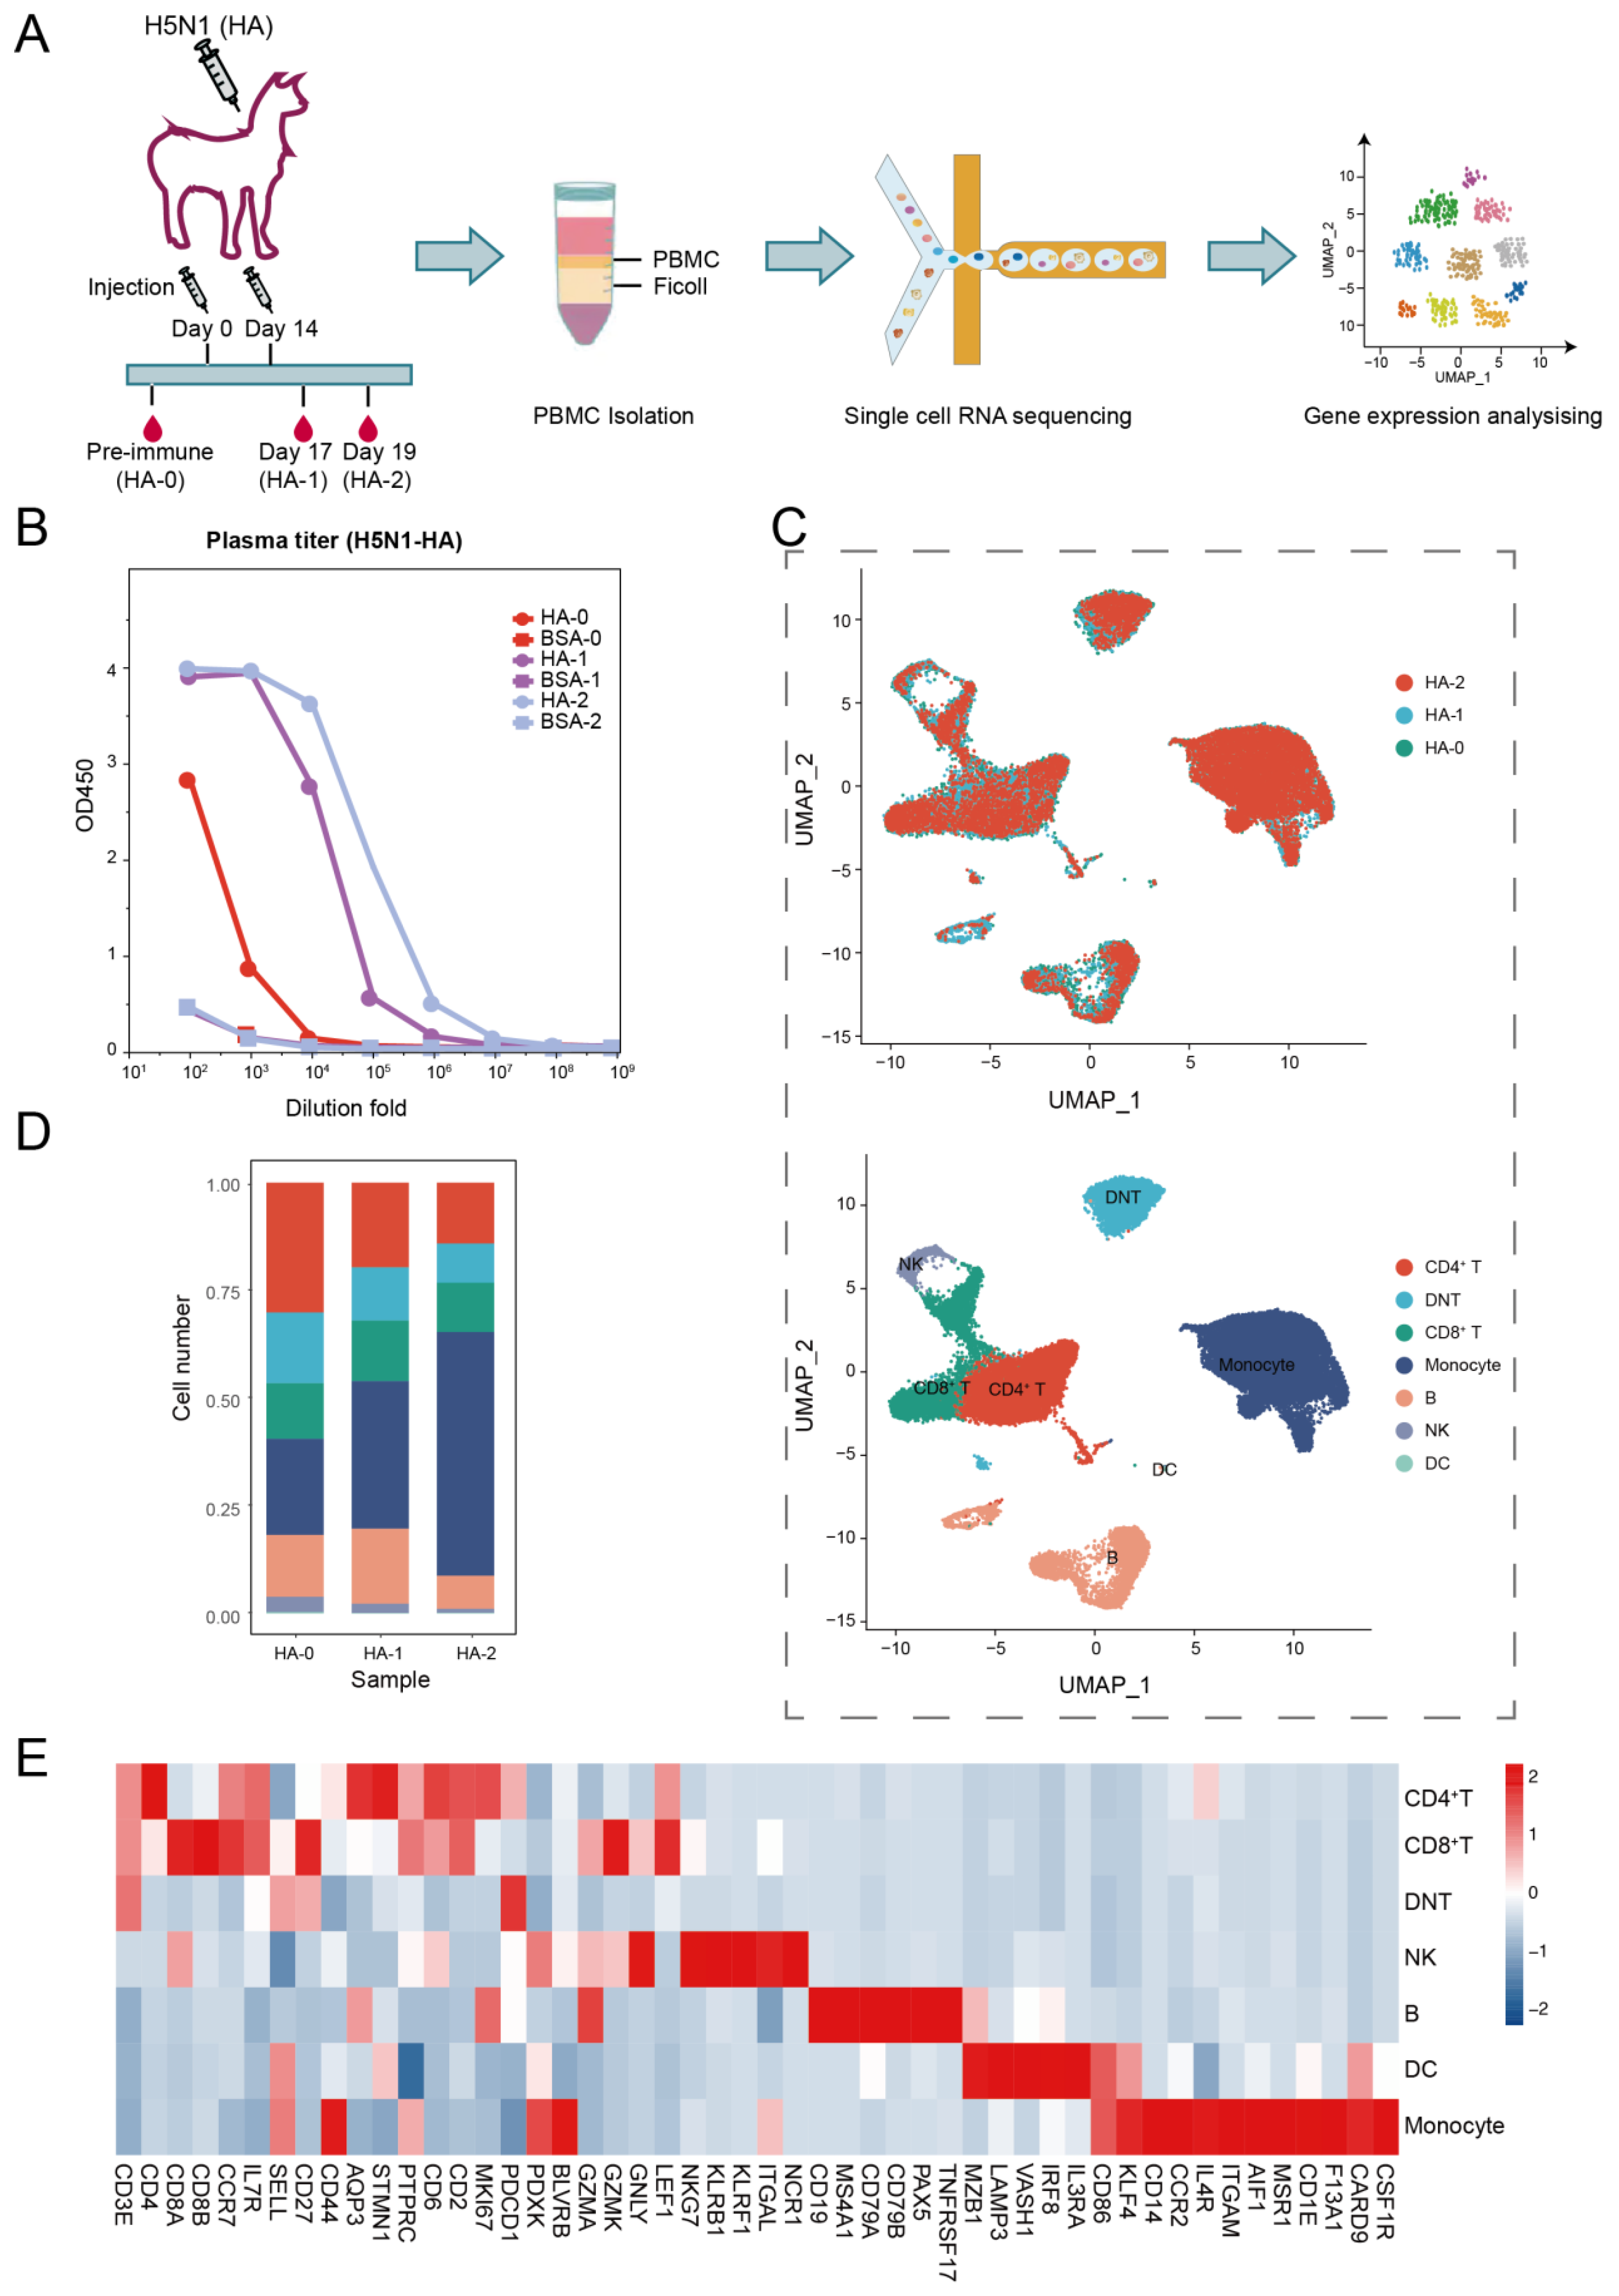
Figure 2.
Examination of subclusters of monocyte cells in HA-stimulated PBMCs. (A) UMAP plot shows the results of sub-clustering involving monocyte cells. (B) The classic marker gene was identified in three clusters. (C) Heatmap shows differential gene expression patterns in various monocyte cell types. (D) Dotplot shows the marker gene expressions pattern in various clusters. (E) Representative GO terms and pathways enriched in DEGs of various monocyte cell subsets of PBMCs. Left, CD14+ Mono1; middle, CD14+ Mono2; right, CD14+ Mono3.

Figure 3.
Dynamic changes in functional status among B cell subsets. (A) UMAP plot shows the results of sub-clustering of B cells. (B) Heatmap shows representative marker expression patterns, annotating clusters to related B cell types. (C) Dynamic changes of B cell proportions were identified two times after immunization. (D) Heatmap shows differential gene expression patterns in various B cell types. (E) Dotplot shows the marker gene expressions pattern in various clusters. (F) Representative GO terms and pathways enriched in DEGs of plasma B cell subsets of PBMC.

Figure 4.
T cell immunity in response to H5N1-HA stimulation. (A) UMAP plot shows the results of sub-clustering of T cells. (B) Heatmap shows representative marker expression patterns, annotating clusters to related T cell types. (C) Histogram shows PBMC cell proportions in various T cell types. (D) Dynamic changes in T cell proportions were identified two times after immunization. (E) Heatmap shows differential gene expression patterns in various T cell types. (F) Representative GO terms and pathways enriched in DEGs of CD8+ activated T subsets of PBMCs.
Disclaimer/Publisher’s Note: The statements, opinions and data contained in all publications are solely those of the individual author(s) and contributor(s) and not of MDPI and/or the editor(s). MDPI and/or the editor(s) disclaim responsibility for any injury to people or property resulting from any ideas, methods, instructions or products referred to in the content. |
© 2022 by the authors. Licensee MDPI, Basel, Switzerland. This article is an open access article distributed under the terms and conditions of the Creative Commons Attribution (CC BY) license (https://creativecommons.org/licenses/by/4.0/).
Share and Cite
MDPI and ACS Style
Lyu, M.; Shi, X.; Liu, Y.; Zhao, H.; Yuan, Y.; Xie, R.; Gu, Y.; Dong, Y.; Wang, M. Single-Cell Transcriptome Analysis of H5N1-HA-Stimulated Alpaca PBMCs. Biomolecules 2023, 13, 60. https://doi.org/10.3390/biom13010060
AMA Style
Lyu M, Shi X, Liu Y, Zhao H, Yuan Y, Xie R, Gu Y, Dong Y, Wang M. Single-Cell Transcriptome Analysis of H5N1-HA-Stimulated Alpaca PBMCs. Biomolecules. 2023; 13(1):60. https://doi.org/10.3390/biom13010060
Chicago/Turabian StyleLyu, Menghua, Xuyang Shi, Yang Liu, Hongyan Zhao, Yue Yuan, Run Xie, Ying Gu, Yuliang Dong, and Meiniang Wang. 2023. "Single-Cell Transcriptome Analysis of H5N1-HA-Stimulated Alpaca PBMCs" Biomolecules 13, no. 1: 60. https://doi.org/10.3390/biom13010060
Note that from the first issue of 2016, this journal uses article numbers instead of page numbers. See further details here.