Article

Quality and Fertility Assessments of Municipal Solid Waste Compost Produced from Cleaner Development Mechanism Compost Projects: A Case Study from Uganda

by
Juliet Kiiza Kabasiita
1,*,
Emmanuel Opolot
2 and
Geoffrey Maxwell Malinga
3
1
Department of Agronomy, Faculty of Agriculture and Environment, Gulu University, Gulu P.O. Box 166, Uganda
2
Department of Agricultural Production, College of Agricultural and Environmental Sciences, Makerere University, Kampala P.O. Box 7062, Uganda
3
Department of Biology, Faculty of Science, Gulu University, Gulu P.O. Box 166, Uganda
*
Author to whom correspondence should be addressed.
Agriculture 2022, 12(5), 582; https://doi.org/10.3390/agriculture12050582
Submission received: 28 February 2022 / Revised: 30 March 2022 / Accepted: 1 April 2022 / Published: 21 April 2022

Abstract

:
Despite the fact that compost projects under the Cleaner Development Mechanism (CDM) have been implemented in Sub-Saharan Africa in recent years, there is a paucity of information on the quality of compost produced from the compost plants. This study fills this gap by evaluating the properties of MSWC produced from 12 CDM plants in Uganda based on quality and fertilizing indices. pH, Pb N, K, P, Mn, Cd, Ca, Mg, Cu, Fe, Cr, Zn, OC, and CN levels differed significantly between locations. MSWC’s Fertility Indices (FI) ranged from 1.9 to 2.9, with Mbarara having the highest (2.9) and Soroti having the lowest (1.9). Fort Portal, Mbarara, Kasese, and Masindi have Clean Indices (CI) ranging from 3.8 to 4.9. According to the results of the fertility and Clean Indices analysis, all MSW composts generated at CDM facilities have low fertilizing capacity and poor quality and are classified as Class RU-1, which does not meet international and national compost criteria. As a result, these composts cannot be utilized as fertilizers and can only be used as soil conditioners under certain conditions. Windrow composting has been proven to be a viable method for lowering huge amounts of organic municipal solid waste in urban areas, and it can be scaled up to other parts of the world according to this study. Authorities must, however, engage urban citizens in waste separation at the source and MSWC enrichment with organic sources. This will aid in improving its quality and fertilizing capacity, as well as in ensuring that the MSWC produced is uniform and suited for use in agriculture and the market.

1. Introduction

Municipal Solid Waste (MSW) management has become a serious environmental concern for many urban areas due to rapid urbanization and economic development [1,2,3]. Like many other developing nations, Uganda faces rapid urbanization with a high urban population growth rate of 5.2% per annum [4], yet providing solid waste management services is costly [5]. The waste generation rate ranges from 0.3 kg/person/per day to 0.66/person/day [5], and waste management is characterized by a high percentage of uncollected waste, with most of the wastes directed to open dumpsites and strained by inadequate budgets due to insufficient cost recovery and low collection service fees. In Sub-Sahara African countries such as Uganda, waste management receives less than 10% of urban council budgets compared to other policy areas [6]. This results in uncollected MSW and disposal in poorly managed landfills, open burning, and indiscriminately discarding the MSW on streets and local waterways, which threatens the environment and human health [7,8,9].
Composting, the controlled conversion of degradable organic products and wastes into stable products with the aid of microorganisms, is one viable and economical alternative for managing organic wastes [10,11,12] that diverts the organic waste stream from landfills, minimizing its pollution potential [13], reduces costs and improves the state of public health. Composting helps to reduce solid waste volumes and generates a stable soil conditioner while providing vital nutrients for crops. Hence, using derived organic compost represents an appropriate waste management strategy and a sustainable soil fertility management practice [7,12]. In Uganda, according to Tibihika et al. [14] the largest percentage of the municipal fresh solid wastes is mainly composed of biodegradable organic matter, including garden, yard, and park wastes (49%) and food and food wastes (43.2%), which is suitable for composting. The World Bank Clean Development Mechanism (CDM) program finances lower-income countries’ greenhouse gas (GHG) reduction measures. One of the sectors considered under CDM is waste handling and disposal, including solid waste management such as composting. Windrow composting is practiced in 12 urban councils in Uganda under the (CDM) project, with a total composting capacity of 70 metric tonnes per day installed [15]. However, none of the compost plants was operating at full capacity by 2014 [15].
The derived Municipal Solid Waste Compost (MSWC) is increasingly being used in agriculture as a soil conditioner and as a fertilizer [16,17,18,19]. MSWC is cheaper and affordable for smallholder farmers than inorganic fertilizers [20]. While composting and the use of MSWC diverts organic wastes from being landfilled, there is concern about segregation of the solid wastes at the source, leading to elevated metal and excess nutrients, which can harm and inhibit crop growth, negatively affecting the soil. Furthermore, metals and excess nutrients can pollute water bodies.
The extent of the MSWC fertilizing potential and associated toxicity largely depends on the geographic origin of the MSW and/or composting technology; the physical, chemical, and biological properties of the composts [14,19,21]; and different lifestyles. The composition of MSW can differ depending on the seasons of the year [22]. Although the investigation results of case studies from other world regions suggest that the MSWC is of acceptable quality and can be used as a fertilizer, there is a lack of information regarding the quality of the MSWC produced from CDM projects. The lack of such information can hinder its use and adoption by farmers. To ensure the good quality and safety of the MSWC and improve its marketability, there is a need for urban authorities in Uganda to understand the fertilizing potential and the quality of the MSWC generated at CDM plants. The information obtained will help optimize the composting process, improve its quality, eliminate barriers to market development [23], and promote composting as the best treatment system for MSW in urban settings. With the National Standards for Compost [24] that regulate the marketing and use of good quality composts in place, urban authorities can develop a suitable compost product with minimal negative environmental effects. Though previous studies have assessed the physico-chemical characteristics of urban solid wastes in Uganda [8,14], none has assessed the quality and graded the MSWC from the different CDM plants. This study hypothesized that the MSWC produced from the unsorted MSW is of inferior quality. We, therefore, examined the fertilizing and quality indices of the MSWC currently produced at the CDM plants in Uganda. This information will help operators of all CDM compost plants to understand and improve its quality and marketability, ensure a uniform grade, and provide users with information regarding its use, and therefore ensure the sustainability of the CDM projects.

2. Materials and Methods
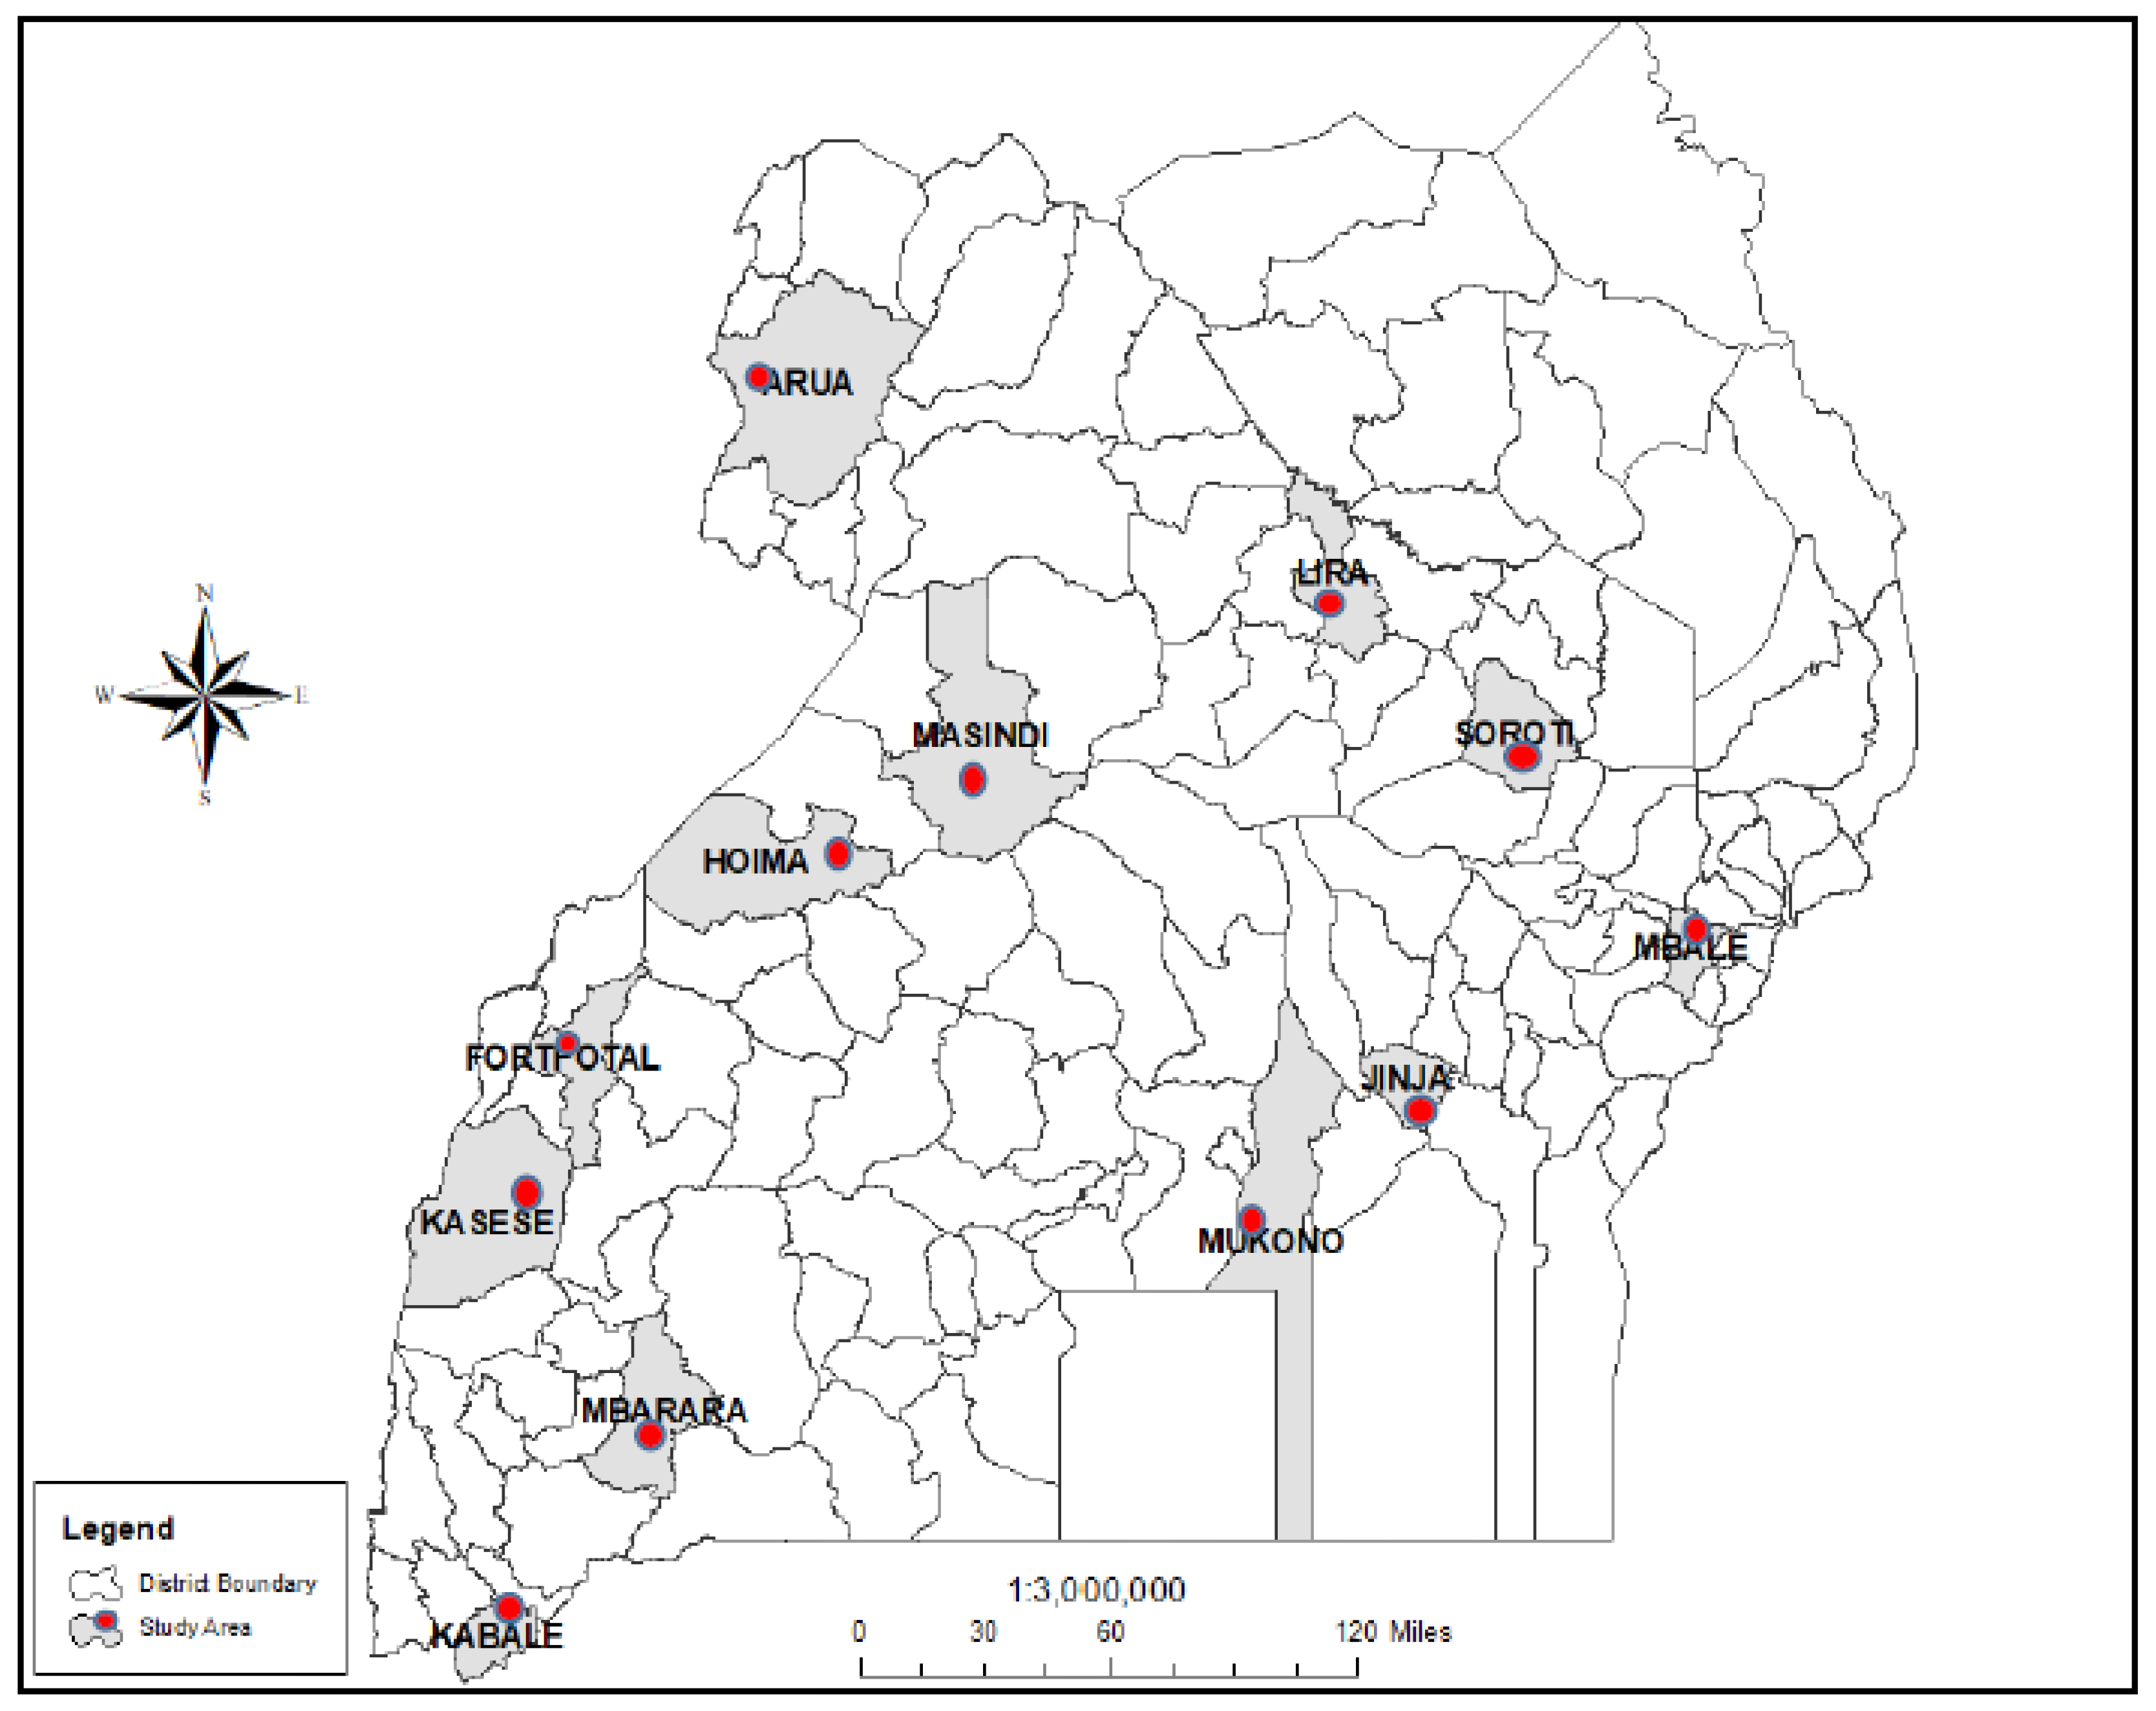
2.1. Study Areas

Samples of MSWC were obtained in June from 12 municipalities with CDM plants distributed in different regions of Uganda (Figure 1). These included Mbarara, Fort Portal, Arua, Mbale, Jinja, Kabale, Lira, Kasese, Mukono, Hoima, Soroti, and Masindi municipalities. These sites are located in different agroecological zones with varying soils and climatic conditions and have a high usage rate (39.6%) of organic fertilizers in Uganda [25].

2.2. Composting Mechanisms at the CDM Plants

The generation of compost at the study sites follows the aerobic windrow composting technique, consisting of an aerobic composting yard (approximately 3405 m2) made of concrete floors and a series of sloping double-pitched roofs where organic wastes are piled and turned in long rows. However, due to constraints in logistics and workforce, the majority of operators in the different CDM plants do not usually follow this composting process. Municipal wastes from the urban areas are collected and taken to the composting plant for segregation. At the plant, non-biodegradables are sorted from biodegradable wastes. The biodegradable wastes are then aligned in the first windrow where decomposition initially occurs. In most cases, turning off the windrow is generally carried out manually to improve aeration, ensure proper mixing, and remove moisture. Recycled leachate from the compost windrows is collected and added to facilitate composting. Sieving of the stabilized material is carried out after about 5–6 weeks with further curing for almost two weeks. It is sorted to remove the small pieces of paper, plastic, and other remaining materials observed in the prepared compost. The final product is stored under the shade and sold to farmers.

2.3. Collection, Preparation, and Chemical Analyses of Samples

At each location (compost plants), compost samples were taken in triplicate from different parts and depths of the compost windrows to form composite samples [26,27]. Each composite sample (approximately 20 kg) was mixed thoroughly, and 1 kg of it was separated, put into air-tight labelled polythene bags, transported to the laboratory in an icebox, and stored at 4 °C until further analysis. At the MetLab laboratory in Kampala, Uganda the samples were sub-sampled (reduced), air-dried at room temperature to terminate biological activities, ground in a mechanical motor and pestle, and sieved through a 2 mm screen to ensure a homogeneous mixture. One hundred grams of each processed sample of the MSWC was analyzed for pH, electrical conductivity (EC), total Nitrogen (N), total Phosphorous (P), total Potassium (K), soil Organic Carbon (OC), Carbon-Nitrogen ratio (CN), Calcium (Ca), Magnesium (Mg) and heavy metals; Boron (B), Copper (Cu), Iron (Fe), Zinc (Zn), Lead (Pb), Cadmium (Cd), Chromium (Cr), and Manganese (Mn). The pH and EC of samples were measured in aqueous suspensions with a solid-to-deionized-distilled-water ratio of 1:10 ratio of w/v. Total P and Total N were determined using the Kjeldahl distillation method described in Okalebo et al. [28,29]. The OC was determined by the procedure of Walkey–Black using the dichromate wet oxidation method [30,31]. Exchangeable K, Ca, and Mg were extracted using 1M ammonium acetate [32]. Thereafter, the concentration of K was determined on a flame photometer, and Ca and Mg were determined using EDTA titration method [33]. Heavy metals, including Zn, Pb, Cd, Cu, Cr, and nickel, were analyzed through atomic absorption spectroscopy [34].

2.4. Methods of Analysis

2.4.1. Indices for Compost Quality

To determine the usability of compost generated at the 12 CDM plants for agricultural purposes, the quality of the MSWC samples was characterized by computing the ‘Fertility Index’ (FI) and ‘Clean Index’ (CI) based on the revised indices method described in Saha et al. [11]. For each type of analytical data such as total C, N, P, and K contents, as well as C:N ratio, contributing to the fertilizing value (i.e., responsible for improving soil productivity) of the compost, we assigned a ‘score’ value following Saha et al. [11]. Each of these fertility parameters was then assigned a ‘weighting factor’ on a five-point scale (1–5) according to the method of Saha et al. [11]. The Fertility Index (FI) values of the compost samples were calculated using the formula [11,16]
Fertility   Index   ( FI ) = n i = 1 S i w i / n i = 1 w i
where Si is the score value and wi is the weighting factor of the ith fertility parameter of analytical data. The criteria for assigning ‘weighting factor’ to each heavy metal/analytic parameter and ‘score value’ to compost followed Saha et al. [11]. The Clean Index (CI) values of compost were also calculated using the formula given by Saha et al. [11] as;
Clean   Index = n J = 1 S J w J / n J = 1 w J
where Sj is the score value and wj is the weighting factor of the jth heavy metal parameter of analytical data. The weighting factor also varies from 1 to 5 based on the toxicity levels of different parameters. A higher value of CI indicates lesser heavy metal contamination and vice versa [16]. Nonetheless, we assigned a 5 (maximum) score to Cd due to its high mammalian toxicity [35,36]. Regulatory authorities use CI values to restrict the entry of heavy metals into agricultural land through composting. For their use in different application areas and their suitability as marketable products, different classes of MSWC have been proposed, based on a critical analysis of their ‘Fertilizing Index’ and ‘Clean Index’ values [11].

2.4.2. Statistical Analysis

We tested for differences in the physico-chemical parameters of MSWC among the CDM plants with univariate permutational multivariate analysis of variance (PERMANOVA) in Primer-E version 6 [37], using Euclidian distance as a similarity measure, unrestricted 999 permutation of raw data, and type III sum of squares, taking the CDM plant as a fixed factor. PERMANOVA partitions the sources of variation in the distance matrix using permutation tests with pseudo-F ratios. It has become widely used in studies analyzing physico-chemical parameters of compost [38] and in univariate analyses [39].

3. Results and Discussion

3.1. MSWC Quality

Generally, results from the laboratory analysis of the MSWC show that contents of the macronutrients, the secondary nutrients, and the micronutrients were low in the MSWC in all the locations.

3.1.1. Macronutrients

Assessing the quality of the MSWC and its nutrient level is essential in determining its potential use in agriculture [16]. In the present study, the major parameters used for the evaluation of MSWC quality were pH, electrical conductivity (EC), total Nitrogen (N), total Phosphorous (P), total Potassium (K), Organic Carbon (OC), Carbon-Nitrogen ratio (CN), Calcium (Ca), Magnesium (Mg) and heavy metals; Boron (B), Copper (Cu), Iron (Fe), Zinc (Zn), Lead (Pb), Cadmium (Cd), Chromium (Cr), and Manganese (Mn).
MSWCs from all locations had an average pH value of 9.16. These values were higher than the average value (7.24) obtained from different Indian cities [40] and 7.3 from Bangladesh and Netherlands [41,42] and were within the regulatory limits (6–10) set by the UNBS (UNBS, 2017a) for compost and the Australian Standard for composts, soil conditioners, and mulches, pH > 5 [43], but were above the African Standard for pH [44]. The high pH in the MSWC could have resulted from the mineralization of carbon and subsequent production of OH− ions by ligand exchange as well as the introduction of basic cations, such as K+, Ca2+, and Mg2+, during decomposition [45]. This high pH limits the availability of heavy metals [45,46] but may induce a deficiency of Total P and most micronutrients as they become less available when applied to the soil.
The average EC obtained in all compost plants was 4701 µS/cm. The results of this study are consistent with the findings of WCA [42], who reported similar results of MSWC in the Netherlands but much higher than the values (580–830 µS/cm) obtained for MSWC in Indian cities [47]. The EC in Mbarara is higher than the recommended maximum values by UNBS of 5000 µS/cm but lower than the Australian guidelines of 10,000 µS/cm [43]. Higher values of EC in MSWC could mean the presence of high levels of nutrients or a slower decomposition of the MSWC [48] but could also inhibit seed germination and plant growth [22,41] when used in large amounts.
The average OC content obtained in all locations was 8.5%. These compared with results obtained from Solan city (14.22%) and Mandi city (12.46%) of India [49,50]. Only MSWC from Mbarara had OC above the Uganda standards of 12% [24]. However, the OC values in all the locations were below the Australian Standard for OC of ≥20% [43]. Low OC in MSWC was a sign of mature and stable compost, and therefore, MSWC was stable and ready for agricultural application.
The average CN ratio from all locations was 17.2. The highest CN ratio in Mbarara compares well with the results obtained from the Indian cities of Solan (26.02) and Mandi (28.32) [49]. The low CN ratio from Fort Portal compares with CN obtained in MSWC in Riyadh city (9.57–10.5) by Mutairi et al. [13]. Stable and mature compost has a CN ratio of <17 unless ligno-cellulosic material remains [51]. Other studies suggest that a value of 12 is ideal, while other authors have recommended a CN ratio of 20–40 as the best for use as a fertilizer [47]. Only Fort Portal (10.5), Hoima (14.0), and Masindi (13.3) were within the Ugandan standards of 12–15 [24]. MSWC with CN values above the recommended highest or lowest for compost may inhibit seed germination and reduce plant growth and damage crops by causing phytotoxicity to plants due to insufficient biodegradation of organic matter when applied to crops.
The average value of N in MSWC from all locations was 0.5%. These values are relatively low compared to the reported content of N in MSWC from Solan (0.8%) and Mandi cities (0.92%) in India [49] and 0.896% in Bangladesh [41]. The N content in all locations was lower than the specified value in the Uganda Standard of 1% [24]. The low N content in the MSWC produced at these plants may require enrichment with organic amendments such as green manure and cow dung [52].
The average P (Phosphorus) content in all locations was highest in compost from Lira (0.8%) and lowest in Hoima, Kabale, Masindi, and Soroti (0.2%), with an average of 0.3% in all locations, which compares favourably with values obtained from MSWC in Bangladesh (0.3%). However, P content was low compared to 6.8% from MSWC in the Netherlands and 4.2% from Ireland [42]. Although there is no Ugandan Standard specified for P, the standard range based on a database of samples from the U.S. Composting Council’s Compost Analysis Proficiency Program is 0.3–0.9% [53], meaning the P content in all locations were within this range. However, compost exceeding 0.7% indicates that the compost feedstocks likely included manure [53]. A high P would have been expected from MSWC from a cattle-rearing area such as Mbarara. However, with concentrations as low as 0.4%, cattle manure never reaches the compost plant. Where P content is below 0.3%, supplemental P fertilizer application should be considered if a soil test indicates the need [53].
The average K content in MSWC from all locations was 1.3%. These values were higher than those obtained in the MSWC from Bangladesh [41] but lower than values obtained from the MSWC of European cities of Netherlands (10.30%), Scotland (7.62%), and Ireland (11.6%). There are no standards specified for K in Uganda; however, the standard range based on a database of samples from the U.S. Composting Council’s Compost Analysis Proficiency Program is 0.5–1.5% [53]. If K exceeds 1.5%, the compost feedstocks likely included manure, food waste, or grass clippings. Compost K is considered equivalent to fertilizer K as a source of K for plants [53].

3.1.2. Secondary Nutrients

The average Ca content in MSWC from all locations was 2%. Contents of Ca in compost from Mbale were higher than that in MSWC in the Netherlands (2.5%) and Bangladesh (1.33%) [41]. Although Uganda does not have a standard for Ca, the Ca content in all locations complies with the Africa Standard for Ca, which is ≥1% [44]. According to Sullivan et al. [53], if Ca exceeds 4%, the compost feedstocks may have included soil, gypsum, or lime, which was not the case in any MSWC from all locations.
The average content (0.6%) from all locations complies with the African Standard of ≥0.5%, and MSWC from Arua, Kabale, Soroti (0.4%), and Lira (0.3%) had concentrations lower than the standard. If Mg exceeds 0.75% such as in the case of Mbarara and Masindi and K is less than 1.5%, an imbalance in the ratio of Mg to K may affect plant growth [53]. None of the study locations had this scenario.
The univariate PERMANOVA shows a statistically significant difference between N, P, K p, CN, Ca, Mg, pH, and OM in MSWCs produced in the different CDM plants (Table 1). However, the OC and EC did not differ among the CDM plants. This observed difference in the physico-chemical parameters could be explained by the fact that the MSWC in different locations is made from different feedstocks. The effect of compost application onto soil largely depends on soil and feedstock properties [50].

3.1.3. Heavy Metal Contamination in MSWC

The heavy metals in the compost ranged from 10.6 to 54.6 mg/kg for B, 6362.5 to 31,591.7 mg/kg for Fe, 0.02 to 0.42 mg/kg for Mn, 272.8 to 1088.7 mg/kg for Zn, 33.5 to 139.5 mg/kg for Cu, 5.8 to 33.5 mg/kg for Pb, <0.00 to 0.77 mg/kg for Cd, and 3.7 to 15.9 mg/kg for Cr (Table 2).
From the analysis, the average content from all locations was 19.9 mg/kg lower than the B concentrations found in MSWC from U.S cities (72.4 mg/kg in Arizona and 113 mg/kg in Texas) [22]. Although there exists no Ugandan Standard for B, all the MSWC in Uganda complied with the Australian Standard of 100 mg/kg [43] and the African Standard of <200 mg/kg [44]. The low levels of B in the MSWC may not be sufficient to improve the B levels in soils, yet in Sub-Saharan African countries, soils are highly deficient in B [54]. This deficiency calls for B fertilization/agronomic biofortification to increase the B content of soils. This B biofortification may be done during the composting process or after composting.
The average Cu content from all locations was 60.8 mg/kg and was within the UNBS limits of 300 mg/kg [24], the African Standard of 8–300 mg/kg [44], and the Australian Standard of 400 mg/kg [43].
The average iron (Fe) content of MSWC from all locations was 17,148.5 mg/kg (Table 2) lower than the MSWC content in US cities, such as 21,700 mg/kg in Arizona, 25,600 mg/kg in Kansas, and 28,100 mg/kg in Texas [22]. There exists no standard for Fe in Uganda; however, the average content of MSWC from all locations was within the African standard limits of 1000–2500 mg/kg.
The average content of Zn in MSWC from all locations was 478.8 mg/kg. The high content of Zn in Soroti compares well with MSWC from Tunisia [55], where the content of Zn was 1174.5 mg/kg, while the lower contents were higher compared to 141.64 mg/kg reported by Rahman et al. [41] in MSWC from Bangladesh. Although Uganda does not have a Standard for Zn, the content in all the locations exceeded the African Standard of 40–100 mg/kg [44].
The average of 15.3 mg/kg from all locations was lower compared to MSWC from France (57 mg/kg), UK (95 mg/kg), Belgium (64 mg/kg), Scotland (51 mg/kg) [42], and Tunisia (411.5 mg/kg) [55]. MSWC from all locations had levels of Pb within the permissible limits of UNBS for composts (100 mg/kg), [24]. However, Pb from Jinja exceeded the recommended value of 30 mg/kg of the African Standard [44].
The average content of Cd in MSWC from all locations was 0.31 mg/kg, which was below the content of Cd in MSWC in Switzerland, 0.89 mg/kg [56]; Bangladesh, 0.39 mg/kg; and Tunisia, 5.17 mg/kg [55]. MSWC in all locations complied with the UNBS’s and African’s Standards of 5 mg/kg [24,44].
The average Cr content of 10.5 mg/kg in all locations was lower than levels in MSWC of most European cities [42,56]. Cr levels in all MSWC complied with the UNBS’s and African Standards’ permissible limit of 50 mg/kg [24,44].
The Mn average content of 0.1 mg/kg from all locations was compliant with the African Standard’s 200–800 mg/kg limits [44]. Uganda does not have standards for Mn in MSWC.
Results from the univariate PERMANOVA show a statistically significant difference between Fe, Mn, Zn, Pb, Cd, and Cr in MSWCs produced in the different CDM plants. MSWC from different compost plants contained heavy metals at variable levels. This correlated well with Tibihika et al. [14], who found that the different CDM plants’ feedstock composition was also different. The elements B, Zn, and Cu are essential in small amounts, but they may decrease plant growth in higher amounts. Other trace elements such as Cd and Pb are of concern mainly because of their potential to harm soil organisms, animals, and humans that may eat contaminated plants or soil [41,57]. MSWC from the Jinja compost plant contained elevated amounts of heavy metals compared to other compost plants. Jinja is an industrial city, and as such, most industries dispose of their unsegregated wastes at this facility, which could explain this situation. Tibihika et al. [14] found out that the composition of the fresh wastes and macro-nutrients varied between CDM plants and correlated with the economic activities and the population’s lifestyles. Reducing the content of heavy metals in composts would be of great significance for minimizing the damage caused by them. This can be accomplished by segregating the MSW at the source before composting.

3.1.4. Fertility Index and Clean Index

The Fertility Index (FI) and Clean Index (CI) are quality parameters used to grade the MSWC and its market value. Out of the seven classes of compost quality (A, B, C, D, RU-1, RU-2, and RU-3) based on the determination of FI and CI [11], classes A-D depict good quality and good market value and can be used for organic farming and high-value crops [49], while the other remaining classes have restricted usage and cannot be applied for organic farming. The FI and CI values for composts generated from different CDM plants and their respective classes are presented in Table 3. All the composts produced in all the CDMs belonged to Class RU-1 as classified by Saha et al. [11].
Although the low MSWC Fertilizer and Clean Indices obtained from all locations could be correlated with the quality of the feedstock, which is not usually sorted at the source [14], other factors such as the stage of compost maturity and its stability could also be responsible for its quality [58].
Potential hazards could accompany the application of low-quality composts to the soil, the environment, and humans, caused by heavy metals and other pollutants [59]. The application of such composts could also lead to low crop yields and economic returns to farmers, hence leading to its low use and adoption.

4. Conclusions

With the increasing population in urban areas leading to increased generation of MSW—0.4–0.6 kg/person/day [60]—and the need to improve the agricultural productivity of Ugandan soils, farmers need to utilize the organic fraction of solid waste as fertilizers through composting. Compost made from MSWC contains large amounts of nutrients and is known to improve the nutrient status of soils and favour the bioavailability of nutrients. However, the quality of MSWC and its suitability for an agricultural application depend upon physical and chemical parameters as well as the absence of toxic substances. The grades and marketability of MSWC largely depend on the fertilizing potential (Fertilizer Index (FI)) and pollution potential (Clean Index (CI)). These two indices provide information about the quality of MSWC before its application for different purposes. This study assessed the nutrient status of the MSWCs from 12 CDM plants in Uganda and characterized them based on the FI and CI. The results revealed significant differences in MSWC for N, P, K, CN, Ca, Mg, pH, Mn, Zn, Pb, Cd, and Cr while OC and EC did not differ significantly among the CDM plants. Although most chemical parameters in the MSWC from the different CDM plants complied with the UNBS Standards, the OC in Mbarara MSWC; the EC in Mbarara, Kasese, Masindi, and Lira; the CN ratio in Jinja, Mbale, Soroti, Lira, and Mbarara MSWC were above the UNBS limits. In contrast, the CN ratio in Fort Portal and Masindi was below the UNBS lower limit of 12. The FI and CI showed that all MSWCs produced in all locations are unsuitable as fertilizers for crops and can only be used under restrictions as soil conditioners. Although a statistically significant variation in some of the parameters in the compost between locations existed, it did not influence the MSWC classes. The information obtained from this study will help CDM plant management optimize the compost processing operations and make their compost marketable and acceptable to farmers. This can be made by source separation of the solid wastes before composting to reduce the trace element levels and enrichment with macro- and micronutrients from organic sources. Because of their poor quality, low fertilizing potential, and poor CI, it is recommended that these composts should not be allowed on the market. However, they can be used as a soil conditioner for rehabilitating degraded land such as mined areas. To improve adoption, there is a need for research to examine the maturity and stability of MSWC and therefore develop relevant indices. However, one major limitation of the current study was that it was conducted only during the dry season.
Future studies should aim to repeat this work in the wet season using the same methodology and compare results.

Author Contributions

Conceptualization, J.K.K.; methodology, J.K.K. and G.M.M.; software, G.M.M. and J.K.K.; validation, J.K.K., E.O. and G.M.M.; formal analysis, J.K.K. and G.M.M., investigation, J.K.K. and G.M.M.; resources, J.K.K.; data curation J.K.K. and G.M.M.; writing—original draft preparation, J.K.K.; writing—review and editing, J.K.K.; E.O. and G.M.M.; supervision, E.O. and G.M.M.; funding acquisition, J.K.K. All authors have read and agreed to the published version of the manuscript.

Funding

This research received no external funding.

Institutional Review Board Statement

Not applicable.

Informed Consent Statement

Not applicable.

Data Availability Statement

Not applicable.

Acknowledgments

The authors appreciate the help received from METLAB for chemical analyses of the compost samples.

Conflicts of Interest

The authors declare no conflict of interest.

References

  1. Chen, X. Life Cycle Assessment (LCA) of Five Municipal Solid Waste Management Systems (MSWMS): A Case Study of Nanjing, China; Doctoral Dissertation, Master’s Thesis of Science, Norwich Research Park; University of East Anglia: Norwich, UK, 2012; pp. 1–48. Available online: https://pdfs.semanticscholar.org/ff80/a0fd04868b9cdcadcac48bcc31fcb6fd3951.pdf (accessed on 19 May 2020).
  2. Banna, F.M.; Bhada-Tata, P.; Ho, R.; Kaza, S.; Lee, M. Results-based Financing for Municipal Solid Waste. Main Report (English) in Urban Development Series Knowledge; World Bank Group: Washington, WA, USA, 2014; Volume 2, pp. 1–84. [Google Scholar]
  3. Ziraba, A.K.; Haregu, T.N.; Mberu, B. A review and framework for understanding the potential impact of poor solid waste management on health in developing countries. Arch. Public Health 2016, 74, 55. [Google Scholar] [CrossRef] [PubMed] [Green Version]
  4. UNHABITAT. Towards achieving SDG 11 in Uganda: Making Cities and Human Settlements Inclusive, Liveable, Safe, Resilient, Productive and Sustainable. Available online: https://unhabitat.org/sites/default/files/documents/2019-05/un-habitat_country_programme_document_2016-_2021_-_uganda.pdf (accessed on 2 February 2022).
  5. Okot-Okumu, J. Solid Waste Management in African Cities-East Africa in Waste Management-An Integrated Vision; IntechOpen: Kampala, Uganda, 2012; Available online: http://www.intechopen.com/books/waste-management-an-integrated-vision/solid-waste-management-in-african-cities-east-africa (accessed on 2 February 2022).
  6. Oosterveer, P.; Van Vliet, B. Environmental Systems and Local Actors: Decentralizing Environmental Policy in Uganda. Environ. Manag. 2010, 45, 284–295. [Google Scholar] [CrossRef] [Green Version]
  7. Rogger, C.; Beaurain, F.; Schmidt, T.S. Composting projects under the Clean Development Mechanism: Sustainable contribution to mitigate climate change. Waste Manag. 2011, 31, 138–146. [Google Scholar] [CrossRef] [PubMed]
  8. Komakech, A.J.; Banadda, N.E.; Kinobe, J.R.; Kasisira, L.; Sundberg, C.; Gebresenbet, G.; Vinnerås, B. Characterization of municipal waste in Kampala, Uganda. J. Air Waste Manag. Assoc. 2014, 64, 340–348. [Google Scholar] [CrossRef] [PubMed] [Green Version]
  9. Komakech, A.; Zurbrügg, C.; Miito, G.; Wanyama, J.; Vinnerås, B. Environmental impact from vermicomposting of organic waste in Kampala, Uganda. J. Environ. Manag. 2016, 181, 395–402. [Google Scholar] [CrossRef] [PubMed]
  10. Luske, B. Reduced GHG Emissions Due to Compost Production and Compost Use in Egypt. Comparing Two Scenarios; Louis Bolk Instituut: Bunnik, The Netherlands, 2010; pp. 1–30. [Google Scholar]
  11. Saha, J.; Panwar, N.; Singh, M. An assessment of municipal solid waste compost quality produced in different cities of India in the perspective of developing quality control indices. Waste Manag. 2010, 30, 192–201. [Google Scholar] [CrossRef] [PubMed]
  12. Kumar, S. Composting of municipal solid waste. Crit. Rev. Biotechnol. 2011, 31, 112–136. [Google Scholar] [CrossRef] [PubMed]
  13. Mutairi, S.O.; Ghoneim, A.M.; Modaihsh, A.S.; Mahjoub, M.O.; Abdel-Aziz, R.A. The characterization and composting of the municipal solid waste of Riyadh city, Saudi Arabia. Waste Manag. Environ. VII 2014, 180, 283–292. [Google Scholar]
  14. Tibihika, P.D.; Okurut, T.; Lugumira, J.S.; Akello, C.; Muganga, G.; Tumuhairwe, J.B.; Nsereko, M.; Kiguli, D.; Mugambwa, R. Characteristics of municipal fresh solid wastes from the selected large urban centres in Uganda: Implication for re-use and soil amendment strategies. J. Air Waste Manag. Assoc. 2021, 71, 923–933. [Google Scholar] [CrossRef]
  15. Kaza, S.; Yao, L.; Stowell, A. Sustainable Financing and Policy: Models for Municipal Composting (Urban development series, Knowledge Papers 24). Available online: https://openknowledge.worldbank.org/handle/10986/26286 (accessed on 14 April 2021).
  16. Mandal, P.; Chaturvedi, M.; Bassin, J.K.; Vaidya, A.N.; Gupta, R.K. Qualitative assessment of municipal solid waste compost by indexing method. Int. J. Recycl. Org. Waste Agric. 2014, 3, 133–139. [Google Scholar] [CrossRef] [Green Version]
  17. Chrysargyris, A.; Tzortzakis, N. Municipal solid wastes and mineral fertilizer as an eggplant transplant medium. J. Soil Sci. Plant Nutr. 2015, 15, 11–23. [Google Scholar] [CrossRef] [Green Version]
  18. Shweta, C. Valuable black gold as a result of utilization of municipal solid waste. Recent Res. Sci. Technol. 2014, 6, 241–244. [Google Scholar]
  19. Jodar, J.R.; Ramos, N.; Carreira, J.A.; Pacheco, R.; Fernández-Hernández, A. Quality assessment of compost prepared with municipal solid waste. Open Eng. 2017, 7, 221–227. [Google Scholar] [CrossRef]
  20. Nsimbe, P.; Mendoza, H.; Wafula, S.T.; Ndejjo, R. Factors Associated with Composting of Solid Waste at Household Level in Masaka Municipality, Central Uganda. J. Environ. Public Health 2018, 2018, 1284234. [Google Scholar] [CrossRef] [PubMed]
  21. Jalal, S.Y.; Hanna, N.S.; Shekha, Y.A. The effects of Insects on the Physicochemical Characteristics During Composting. Iraqi J. Sci. 2019, 2019, 2426–2432. [Google Scholar] [CrossRef]
  22. He, X.-T.; Logan, T.J.; Traina, S.J. Physical and Chemical Characteristics of Selected U.S. Municipal Solid Waste Composts. J. Environ. Qual. 1995, 24, 543–552. [Google Scholar] [CrossRef]
  23. Eggerth, L.; Diaz, L.; Chang, M.; Iseppi, L. Chapter 12 Marketing of composts. Biogranulation Technol. Wastewater Treat. 2007, 8, 325–355. [Google Scholar]
  24. Uganda National Bureau of Standards. Organic Fertilizer—Specification, US 1584.2017. Available online: https://members.wto.org/crnattachments/2017/TBT/UGA/17_1082_00_e.pdf (accessed on 14 April 2021).
  25. Uganda Bureau of Statistics. Uganda Census of Agriculture 2008/2009. Crop. Area Prod. Rep. 2010, 4, 1–178. [Google Scholar]
  26. Bary, A.I.; Sullivan, D.M.; Cogger, C.G. Fertilizing with Manure and Other Organic Amendments. Available online: https://s3.wp.wsu.edu/uploads/sites/411/2016/07/Paper_FertManure2016.pdf (accessed on 14 April 2021).
  27. Brinton, W.; Bonhotal, J.; Fiesinger, T. Compost Sampling for Nutrient and Quality Parameters: Variability of Sampler, Timing and Pile Depth. Compos. Sci. Util. 2012, 20, 141–149. [Google Scholar] [CrossRef]
  28. Okalebo, J.R.; Gathua, K.W.; Woomer, P.L. Laboratory Methods of Soil and Plant Analysis: A working Manual; TSBF Programme. Soil Sci. Soc. East Afr. Tech. Publ. 1993, 1, 88. [Google Scholar]
  29. Okalebo, J.R.; Gathua, K.W.; Woomer, P.L. Laboratory methods of soil and plant analysis: A working manual second edition. Sacred Afr. Nairobi. 2002, 21, 25–26. [Google Scholar]
  30. Nelson, D.W.; Sommers, L.E. Total Carbon, Organic Carbon, and Organic Matter. In Methods of Soil Analysis: Part 3 Chemical Methods; Sparks, D.L., Ed.; Soil Science Society of America: Madison, WI, USA, 1996; Volume 5, pp. 961–1010. [Google Scholar]
  31. Hendershot, W.H.; Lalande, H. Ion Exchange and Exchangeable Cations in Soil Sampling and Methods of Analysis; Carter, M.R., Ed.; Lewis Publishers, CRC Press: Cambridge, UK, 1993. [Google Scholar]
  32. Walkley, A.J.; Black, I.A. Estimation of soil organic carbon by the chromic acid titration method. Soil Sci. 1934, 37, 29–38. [Google Scholar] [CrossRef]
  33. Horwitz, W.; Latimer, G.W. Official Methods of Analysis of AOAC International; AOAC International: Gaithersburg, MD, USA, 2005. [Google Scholar]
  34. Schrenk, W. Analytical Atomic Spectroscopy in Modern Analytical Chemistry [Internet]; Springer Science & Business Media: Manhattan, KS, USA, 2012. [Google Scholar]
  35. Lane, E.A.; Canty, M.J.; More, S.J. Cadmium exposure and consequence for the health and productivity of farmed ruminants. Res. Vet. Sci. 2015, 101, 132–139. [Google Scholar] [CrossRef]
  36. World Health Organization. Exposure to Lead: A Major Public Health Concern. 2010. Available online: https://www.who.int/ipcs/features/cadmium.pdf (accessed on 27 August 2021).
  37. Anderson, M.J.; Gorley, R.N.; Clarke, K.R. PERMANOVA+ for PRIMER: Guide to Software and Statistical Methods; PRIMER-E Ltd.: Plymouth, UK, 2008; p. 214. [Google Scholar]
  38. Ye, J.; Zhang, R.; Nielsen, S.; Joseph, S.D.; Huang, D.; Thomas, T. A Combination of Biochar–Mineral Complexes and Compost Improves Soil Bacterial Processes, Soil Quality, and Plant Properties. Front. Microbiol. 2016, 7, 372. [Google Scholar] [CrossRef]
  39. Rutaro, K.; Malinga, G.M.; Lehtovaara, V.J.; Opoke, R.; Valtonen, A.; Kwetegyeka, J.; Nyeko, P.; Roininen, H. The fatty acid composition of edible grasshopper Ruspolia differens (Serville) (Orthoptera: Tettigoniidae) feeding on diversifying diets of host plants. Èntomol. Res. 2018, 48, 490–498. [Google Scholar] [CrossRef]
  40. Vyas, P.B. Assessment of municipal solid waste compost characterization and compliance. I Control. Pollut. 2011, 27, 87–91. [Google Scholar]
  41. Rahman, M.M.; Bhuiyan, M.; Rouf, M.; Sarker, R.; Rashid, M.H. Quality Assessment of Municipal Solid Waste Compost. Acta Chem. Malays. 2020, 4, 33–39. [Google Scholar] [CrossRef]
  42. WCA Environment Ltd. Review of Scientific Literature on Compost Produced from Food and Garden Organic Waste in Final Report to New South Wales Environment Protection Authority; WCA Environment Ltd.: Faringdon, UK, 2019; pp. 1–35. [Google Scholar]
  43. Standards Association of Australia. Composts, Soil Conditioners and Mulches; Standards Australia International Ltd.: Sydney, Australia, 2012; Volume 4, pp. 1–74. [Google Scholar]
  44. The African Organization for Standardization (ARSO). African Standard WD-ARS; The African Organization for Standardization (ARSO): Waknaghat, India, 2018; pp. 1–25. [Google Scholar]
  45. Mkhabela, M.; Warman, P. The influence of municipal solid waste compost on yield, soil phosphorus availability and uptake by two vegetable crops grown in a Pugwash sandy loam soil in Nova Scotia. Agric. Ecosyst. Environ. 2005, 106, 57–67. [Google Scholar] [CrossRef]
  46. Bazrafshan, E.; Zarei, A.; Mostafapour, F.K.; Poormollae, N.; Mahmoodi, S.; Zazouli, M.A. Maturity and Stability Evaluation of Composted Municipal Solid Wastes. Health Scope 2016, 5, e33202. [Google Scholar] [CrossRef] [Green Version]
  47. Rawat, M.; Ramanathan, A.; Kuriakose, T. Characterisation of Municipal Solid Waste Compost (MSWC) from Selected Indian Cities—A Case Study for Its Sustainable Utilisation. J. Environ. Prot. 2013, 4, 163–171. [Google Scholar] [CrossRef] [Green Version]
  48. Zaha, C.; Dumitrescu, L.; Manciulea, I. Correlations between composting conditions and characteristics of compost as biofertilizer. Bulletin of the Transilvania University of Brasov. Eng. Sci. Ser. I 2013, 6, 51. [Google Scholar]
  49. Sharma, A.; Ganguly, R.; Gupta, A.K. Spectral characterization and quality assessment of organic compost for agricultural purposes. Int. J. Recycl. Org. Waste Agric. 2019, 8, 197–213. [Google Scholar] [CrossRef] [Green Version]
  50. Sayara, T.; Basheer-Salimia, R.; Hawamde, F.; Sánchez, A. Recycling of organic wastes through composting: Process performance and compost application in agriculture. Agronomy 2020, 10, 1838. [Google Scholar] [CrossRef]
  51. Silva, M.T.; Menduíña, A.M.; Seijo, Y.C.; Viqueira, F.D. Assessment of municipal solid waste compost quality using standardized methods before preparation of plant growth media. Waste Manag. Res. 2007, 25, 99–108. [Google Scholar] [CrossRef]
  52. Sultana, M.; Jahiruddin, M.; Islam, M.R.; Rahman, M.M.; Abedin, M.A.; Solaiman, Z.M. Nutrient Enriched Municipal Solid Waste Compost Increases Yield, Nutrient Content and Balance in Rice. Sustainability 2021, 13, 1047. [Google Scholar] [CrossRef]
  53. Sullivan, D.M.; Bary, A.I.; Miller, R.O.; Brewer, L.J. Interpreting Compost Analyses; Oregon State University: Corvallis, OR, USA, 2018. [Google Scholar]
  54. Kihara, J.; Bolo, P.; Kinyua, M.; Rurinda, J.; Piikki, K. Micronutrient deficiencies in African soils and the human nutritional nexus: Opportunities with staple crops. Environ. Geochem. Health 2020, 42, 3015–3033. [Google Scholar] [CrossRef] [PubMed] [Green Version]
  55. Ayari, F.; Hamdi, H.; Jedidi, N.; Gharbi, N.; Kossai, R. Heavy metal distribution in soil and plant in municipal solid waste compost amended plots. Int. J. Environ. Sci. Technol. 2010, 7, 465–472. [Google Scholar] [CrossRef] [Green Version]
  56. Yüksel, O. Influence of municipal solid waste compost application on heavy metal content in soil. Environ. Monit. Assess. 2015, 187, 313. [Google Scholar] [CrossRef]
  57. Guerra, F.; Trevizam, A.R.; Fior, R.C.; Muraoka, T. Cadmium phytoavailability in soils and evaluation of extractant effectiveness using an isotope technique. Sci. Agric. 2014, 71, 410–415. [Google Scholar] [CrossRef] [Green Version]
  58. Mukai, S.; Oyanagi, W. Evaluation on maturity and stability of organic fertilisers in semi-arid Ethiopian Rift Valley. Sci. Rep. 2021, 11, 4035. [Google Scholar] [CrossRef] [PubMed]
  59. Barčauskaitė, K.; Žydelis, R.; Mažeika, R. Screening of chemical composition and risk index of different origin composts produced in Lithuania. Environ. Sci. Pollut. Res. 2020, 27, 24480–24494. [Google Scholar] [CrossRef] [PubMed]
  60. Nyakaana, J.B. Solid Waste Management in Urban Centers: The Case of Kampala City—Uganda. East Afr. Geogr. Rev. 1997, 19, 33–43. [Google Scholar] [CrossRef]
Figure 1. Location of municipalities with CDM compost plants surveyed in Uganda in June 2019.
Agriculture 12 00582 g001
Table 1. Physico-chemical characterization of MSWC from 12 CDM plants in Uganda.
Compost PlantpHElectrical
Conductivity (µs/cm)
Organic Matter (%)Organic Carbon (%)C:N RatioTotal N (%)Total P (%)Total K (%)Calcium (%)Magnesium (%)
Arua8.9 ± 0.153779 ± 85.247.8 ± 0.434.1 ± 0.1812.9 ± 0.320.3 ± 0.040.3 ± 0.100.8 ± 0.052.1 ± 0.140.4 ± 0.00
Hoima9.4 ± 0.324841 ± 50.0113.8 ± 0.277.4 ± 0.9014.0 ± 0.000.5 ± 0.060.2 ± 0.011.3 ± 0.022.1 ± 0.030.5 ± 0.00
Fort Portal9.6 ± 0.184427 ± 652.1210.2 ± 1.195.7 ± 1.0410.5 ± 1.030.5 ± 0.050.4 ± 0.021.8 ± 0.201.3 ± 0.100.6 ± 0.04
Jinja8.9 ± 0.154925 ± 11521.3 ± 1.0011.8 ± 1.1723.8 ± 1.590.5 ± 0.020.3 ± 0.011.5 ± 0.172.1 ± 0.110.5 ± 0.02
Kabale9.3 ± 0.082867 ± 141.7115.6 ± 1.108.6 ± 1.4015.9 ± 0.770.5 ± 0.060.2 ± 0.040.8 ± 0.051.2 ± 0.000.4 ± 0.01
Mbarara9.6 ± 0.069511 ± 505.228.6 ± 1.5615.7 ± 2.0726.3 ± 0.570.6 ± 0.070.4 ± 0.032.3 ± 0.173.0 ± 0.160.9 ± 0.04
Kasese9.2 ± 0.165577 ± 395.1914.3 ± 1.238.3 ± 0.8814.5 ± 2.370.6 ± 0.040.5 ± 0.031.4 ± 0.022.1 ± 0.280.7 ± 0.03
Mbale8.9 ± 0.394097 ± 453.9116.3 ± 1.129.7 ± 0.5523.2 ± 4.620.4 ± 0.100.3 ± 0.020.8 ± 0.023.2 ± 0.090.7 ± 0.08
Masindi9.6 ± 0.205124 ± 351.6112.6 ± 2.016.8 ± 1.6913.3 ± 2.490.5 ± 0.030.2 ± 0.032.3 ± 0.042.7 ± 0.040.8 ± 0.02
Mukono9.3 ± 0.073230 ± 1498.2317.5 ± 3.5210.1 ± 2.2516.8 ± 2.780.6 ± 0.040.3 ± 0.010.9 ± 0.572.4 ± 0.100.5 ± 0.02
Soroti9.0 ± 0.232888 ± 272.5210.1 ± 0.656.1 ± 0.4915.3 ± 0.470.4 ± 0.020.2 ± 0.020.7 ± 0.061.4 ± 0.090.4 ± 0.05
Lira8.3 ± 0.485148 ± 256.0714.1 ± 1.787.9 ± 1.1220.9 ± 3.960.4 ± 0.020.8 ± 0.600.8 ± 0.060.7 ± 0.040.3 ± 0.02
Average9.24701.215.28.517.20.50.31.32.00.6
Maximum9.6951128.615.726.30.60.82.33.20.9
Minimum8.32867.37.84.110.50.30.20.70.70.3
UNBS6–105000-1212–151----
Pseudo-F (11, 24)7.761.762.621.362.542.602.814.992.602.81
p value0.0010.1230.0240.2460.0260.0320.0090.0030.0270.019
Values represent the mean of three replicates ± SE (standard errors). Values of the probability of PERMANOVA analysis are indicated. Significant p-values are indicated in bold.
Table 2. Heavy metal parameters of MSWC from 12 CDM plants in Uganda.
Compost PlantBoron (mg/kg)Copper (mg/kg)Iron (mg/kg)Manganese (%)Zinc (mg/kg)Lead (mg/kg)Cadmium (mg/kg)Chromium (mg/kg)
Arua10.6 ± 0.6158.8 ± 10.378826.2 ± 300.70.02 ± 0.006409.2 ± 8.812.8 ± 1.970.04 ± 0.0710.0 ± 0.2
Hoima13.7 ± 1.5853.4 ± 9.423,208.3 ± 1690.80.05 ± 0.009553.3 ± 117.1913.3 ± 3.53Not detected11.0 ± 1.65
Fort Portal12.8 ± 0.6546.7 ± 7.1412,780.0 ± 4429.50.07 ± 0.004272.8 ± 23.809.8 ± 6.7Not detected15.9 ± 4.25
Jinja21.6 ± 8.64139.5 ± 23.132,925.3 ± 82500.12 ± 0.015605.3 ± 0.5833.5 ± 18.110.77 ± 0.1513.5 ± 2.93
Kabale54.6 ± 70.555.0 ± 9.315,630.0 ± 2671.10.07 ± 0.003384.2 ± 190.716.0 ± 2.610.30 ± 0.5210.5 ± 0.83
Mbarara25.8 ± 3.2233.5 ± 10.176362.5 ± 1282.760.42 ± 0.33301.2 ± 10.7912.6 ± 4.6Not detected10.9 ± 2.23
Kasese15.2 ± 1.3750.7 ± 11.99884.7 ± 291.210.05 ± 0.01400.7 ± 17.2116.4 ± 8.670.07 ± 0.1213.0 ± 0.63
Mbale16.8 ± 1.6656.6 ± 0.2615,773.3 ± 1037.70.08 ± 0.01429.0 ± 15.615.8 ± 6.78Not detected7.9 ± 0.56
Masindi15.3 ± 2.2139.0 ± 5.6634,591.7 ± 1983.10.06 ± 0.01444.3 ± 23.813.9 ± 3.870.07 ± 0.1211.5 ± 1.36
Mukono19.8 ± 0.5994.1 ± 6.3412,770.0 ± 331.510.06 ± 0.02516.7 ± 8.524.8 ± 10.90.27 ± 0.2511.2 ± 1.97
Soroti12.5 ± 0.6450.5 ± 8.715,676.7 ± 610.440.05 ± 0.011088.7 ± 68.165.8 ± 0.49Not detected6.7 ± 1.8
Lira20.4 ± 8.9951.4 ± 9.717,353.3 ± 13,009.60.03 ± 0.002335.5 ± 289.59.0 ± 0.060.10 ± 0.13.7 ± 0.66
Average19.960.817,148.50.1478.815.30.1310.5
Maximum54.6139.534,591.70.421088.733.50.7715.9
Minimum10.633.56362.50.02272.85.8Not detected3.7
UNBS-300---100550
F0.9690.99113.8113.69513.8112.9224.5568.256
p values0.4990.481<0.0010.004<0.0010.0140.001<0.001
Values represent the mean of three replicates ± SE (standard errors). Differences in physico-chemical parameters among the CDM plants were analyzed by univariate permutational multivariate analysis of variance (PERMANOVA) in Primer-E. Significant p-values are in bold.
Table 3. Quality control indices and their respective classes for MSWC generated from the 12 CDM compost plants in Uganda.
AruaHoimaFort PortalJinjaKabaleMbararaKaseseMbaleMasindiMukonoSorotiLira
Fertility Index2.22.12.52.22.02.92.72.12.12.51.92.2
Clean Index4.74.64.93.84.44.94.94.74.94.64.64.7
Compost ClassRU-1RU-1RU-1RU-1RU-1RU-1RU-1RU-1RU-1RU-1RU-1RU-1
Publisher’s Note: MDPI stays neutral with regard to jurisdictional claims in published maps and institutional affiliations.

