1. Introduction
Buckwheat is a pseudocereal of renewed interest that gained popularity as it often provides a distinguished nutritional and health-promoting value [
1,
2]. The genus
Fagopyrum includes three species (
F. esculentum,
F. tataricum, and
F. cymosum), but
F. esculentum Moench is widely cultivated for human consumption [
3,
4]. Buckwheat seeds flour is considered to be a remarkable resource for functional food development and was used as an ingredient in bread, pasta, cake, and pancake [
5,
6,
7,
8] due to its nutritional quality and bioactive compounds. The major nutritional components in buckwheat seeds are represented by the carbohydrates that vary between 63.1 and 82.1%, of which from 54.5% to 54.7% was found to be starch [
9] with a relatively high level of amylose (18.3–47% of total starch) [
10]. Moreover, buckwheat has high levels of resistant starch (27–33.5%) which provides health benefits [
11]. Buckwheat starch is concentrated in the endosperm, similarly to common cereals, while protein and lipids are located in the embryo that extends through the starchy endosperm [
12]. Buckwheat grains represent an excellent source of dietary fiber (17.8%) with a low ratio of soluble–insoluble dietary fiber (0.5–0.28) [
13]. The protein content of buckwheat ranges from 5.7% to 14.2%, depending on the variety and environmental conditions [
11]. Buckwheat protein is characterized by a high biological value due to its excellent amino acids balance [
14] and it is close to the optimum composition suggested by FAO/WHO [
15], making buckwheat an essential contributor to human protein intake. This gluten-free high-quality protein is rich, especially in lysine, methionine, and tryptophan, which are limiting amino acids in most cereals [
14,
16]. Lipid content from buckwheat (0.75–7.4%) is higher than that of wheat, being characterized by a high degree of unsaturation, a fact preferable from a nutritional point of view [
2,
14]. The main mineral compounds in buckwheat are potassium, magnesium, and phosphorous followed by calcium and other important minerals [
2,
17,
18], showing variability among genotypes. Buckwheat grains contain a higher content of vitamins, especially the group of B vitamins, and buckwheat flour was highlighted by the presence of vitamins B2, B3 and B6 [
1,
19]. In addition to being a source of nutrients components, buckwheat contains non-nutrient components that present health benefits recognized as bioactive compounds. One group of bioactive components include the phenolic compounds that are of great interest, considering the design and the development of functional food products. Due to the high levels of phenolic compounds, buckwheat can be considered an excellent source of phenols [
20,
21]. The supplementation of common cereals like wheat with buckwheat possessing better nutritive value and nutraceutical characteristics would be a feasible strategy to improve the features of final products [
22] and dietary diversification. In the literature, most of the study focuses on the levels of buckwheat flours added in wheat flour because the addition in high amounts led to various technological challenges related to the fiber content and due to the gluten dilution effect. As a gluten-free protein, buckwheat has negative effects on dough due to the absence of gluten proteins that form the structure, resulting in poor dough strength. To minimize such an undesirable effect, an appropriate level of buckwheat needs to be used to supplement wheat flour.
Nowadays, it is a challenge to produce flour at different particle sizes, because milling fractions varying in physical and chemical properties, and thus offering the possibility to produce flours with specific features for diverse use products [
23]. The flour separated on different granularities with high concentrations of valuable components of interest such as proteins, soluble dietary fiber and polyphenols could be used to obtain bakery products with desired features [
24]. The functionality of buckwheat milling fractions is essential. Functional properties describe the behavior of components during the technological process, and how they affect the final products in terms of rheological and sensorial properties [
25]. Very few studies regarding the functionality of buckwheat milling fractions have been published [
22,
26], without studying their effects on wheat bread dough. Flour particle sizes influence dough behavior with an impact on the quality attributes of the finite products. In some previous investigations [
27,
28,
29] the impact of the chemical composition and functionality of different particle size and their effect on rheological properties was highlighted, but there was no evident tendency.
Knowing the rheological behavior of composite flour is necessary for designing and developing new baked products because, in this study, the dilution of wheat gluten when buckwheat flour is added in the wheat flour dough, can impair proper dough rheological characteristics. In order to obtain information on the rheological characteristics, the Mixolab technique can be taken into account since, in only one test, it can predict the quality of the finite product, simulating dough behavior in the bread-making process. The Mixolab technique has been used to assess the impact of different milling fractions from whole buckwheat grains on the rheological properties [
30], as well as the effect of amaranth and quinoa milling fractions on wheat flour dough rheology [
31,
32].
Response surface methodology (RSM) is recognized as a useful statistical tool that provides more information for a few numbers of experiments that require assessing the factors that influence the process and their interaction that implies mathematical models and needs small time resources [
33]. In order to optimize the various composite flour formulation, multiple-response optimization, in conjunction with the desirability function, has been successfully applied [
34,
35].
An optimal amount of buckwheat flour that could be added in wheat flour has tried to be established by various researches, but, to the best of our knowledge, the impact of particle size of buckwheat flour on wheat flour dough rheology, assessed by applying the Mixolab technique, is yet unknown. Moreover, to our knowledge, the effect of the interaction between particle size and the level of buckwheat flour on wheat dough rheology to find the optimal values that give the best technological parameters has not yet been studied. The results will provide millers and manufacturers with scientific evidence of an optimal buckwheat flour particle size range and of an optimal supplementation level of refined wheat flour to improve the quality of baked products.
The aim of this study was to investigate the impact of buckwheat milling fractions on the chemical composition and functional properties, and to evaluate the effect of wheat flour substitution level by buckwheat flour at 0, 5, 10, 15, and 20% at three different milling fractions (large, medium, and small) on thermo-mechanical characteristics and to find the optimal particle size and level added, which inform on the bread-making potential of buckwheat—wheat composite flour.
2. Materials and Methods
2.1. Raw Materials
Commercial refined wheat flour of 650 type that has been used to formulate buckwheat-wheat composite flour was acquired from a local company S.C. Mopan S.A. (Suceava, Romania). Buckwheat seeds (Fagopyrum esculentum Moench) were purchased from a local market (S.C. SANOVITA S.R.L) and they were grinded with a laboratory machinery (Grain Mill, KitchenAid, Model 5KGM, Italy) to obtain buckwheat flour and sieved through a Retsch Vibratory Sieve Shaker AS 200 basic (Haan, Germany) to obtain three milling fractions: large (L > 300 μm), medium (M > 180 μm, < 300 μm) and small fractions (S < 180 μm).
2.2. Proximate Composition
The main raw material, wheat flour was investigated for its moisture (14.00%), ash (0.65%), fat (1.40%), protein (12.60%), wet gluten (30.00%), Falling number index (312 s), and gluten deformation index (6.00 mm) by the ICC methods 110/1, 104/1, 105/1, 105/2, 106/1, 107/1 and by the Romanian standard method SR 90:2007, respectively. These results make it be a suitable flour for bread making according to the Romanian standard SR 877:1996. Buckwheat grains’ analytical characteristics included 13.28% moisture (SR EN ISO 665:2003), 2% ash (SR ISO 2171:2009), 3.40% fat (SR EN ISO 659:2009), and 13.26% protein (SR EN ISO 20483:2007). Total carbohydrate content was determined by difference as 100 − (moisture + ash + protein + total lipids). All measurements were taken at least in duplicate, and the results were expressed as the average ± standard deviation.
2.3. Functional Properties of Buckwheat Milling Fractions
For each buckwheat flour particle size (BL, BM, BS) the functional properties considered were water absorption and water retention capacity, swelling capacity, and volumetric density. All the analyses were determined at least in duplicate and values were calculated on a dry weight basis.
2.3.1. Water Absorption Capacity
The method described by Raghavendra et al. (2004) [
36], with slight modifications, was used to determine the water absorption capacity (WAC) for the particle size of BF. From each sample, 1 g was measured and then was mixed into a 50 mL test tube with 10 mL distilled water. This mixture was left 30 min at room temperature and then placed in a centrifuge for 10 min at 2000 rpm (MPW-223e, MPW Med. Instruments, Warszaw, Poland). During this time, the following scientific phenomenon occurs: the water molecules hydrate the damaged starch, the glutenin and gliadin, and other components until molecules of starch and protein create hydrophilic interactions and hydrogen bonds with the molecules of water. When the hydration was over the supernatant was removed and the tubes were weighed.
2.3.2. Water Retention Capacity
To determine the water retention capacity (WRC), accurately weighed BF milling fractions (2.0 g) were loaded into a weighed centrifuged tube with 20 mL of water and stirred continuously on a water bath at 25 °C (Memmert Waterbath, Germany) for 1 h. After centrifugation at 1600 rpm for 25 min, the supernatant was filtrated off on a paper towel and the sample was dried at 105 °C for 2 h to obtain residue dry weight [
37]. The weights obtained were specified as a % water per gram of flour.
2.3.3. Swelling Capacity
Swelling capacity (SC), also known as the swelling index (SI) was determined according to the method previously applied by Olapade et al. (2003) [
38] with minor changes. This property indicates the volume in milliliter taken up by the swelling of flour (1 g) under specific conditions. One gram for each BF fractions was mixed in a centrifuge tube with 10 mL of water and then a weighed tube was heated in a water bath at 80 °C for 15 min. After centrifugation at 2000 rpm for 30 min, the supernatant was decanted and the pellet was estimated. The final volume attained by the sample was measured as a percent of swelled per gram of sample, which gave SC.
2.3.4. Volumetric Density
Volumetric density (VD), known also as bulk density, was measured following the procedure described by Ikegwu (2009) [
39]. Buckwheat flour milling fractions (50 g) were placed into a dry graduated cylinder (50 mL) and it was shaken slightly until no volume differences were observed. Volumetric density was determined as a sample weight (g) per sample volume (mL).
2.4. Influence of Buckwheat Milling Fractions Addition on the Falling Number Values
The Falling number index (FN) value, determined at least in duplicate using the standard method (ICC 107/1) and FN device (Perten Instruments AB, Stockholm, Sweden), was performed. The method is a viscometer assay, based on the rapid gelatinization of a flour suspension in a boiling water bath and the measurement of its liquefaction by α-amylase. FN index value gives an estimation of the α-amylase activity from the wheat-buckwheat flour.
2.5. Dough Rheology Assessed by Mixolab
The influence of buckwheat flour milling fractions and the level added on the rheological properties of composite flours dough was assessed using a Mixolab analyzer (Chopin, Tripette et Renaud, Paris, France) and ICC-Standard Methods No. 173 (ICC, 2010) by applying the standard Chopin+ protocol, as described in previous studies [
31,
32]. For all wheat-buckwheat flour samples, the first stage was determined by the following mixing parameters: water absorption, WA (%), dough development time, DT (min), and dough stability, ST (min). In the following stages, the minimum torque C2 (N⋅m), related to protein reduction due to temperature rise; peak torque, C3 (N⋅m), related to starch gelatinization; minimum torque C4 (N⋅m), as the stability of hot-formed gel; maximum torque, C5 (N⋅m), as a starch retrogradation measure during dough cooling were recorded. From the Mixolab curve registered, the differences between torques C1 and C2 (C1-2), C3 and C2 torques (C2-3), C3 and C4 torques (C3-4), and C4 and C5 torques (C4-5) associated with protein weakening, starch gelatinization, cooking stability and starch retrogradation were also determined.
2.6. Factorial Design and Statistics
A full factorial design was used to study the main and interaction effect of replacing wheat flour with buckwheat milling fractions on the responses, Falling number (FN) index, water absorption of composite flour, and Mixolab properties. The studied factors were three buckwheat flour particle sizes (large, medium, and small) and the level added in wheat flour (0, 5, 10, 15, and 20%). An experimental design that consists of fifteen combinations (
Table 1) was conducted. The simultaneous effect of these two factors on the responses was investigated through the response surface methodology (RSM) in conjunction with the desirability function approach. RSM is a powerful technique mainly used in the design and innovation of bakery products, and to find the optimum level of formulation factors [
34,
40] or the optimal processing conditions [
41].
The quadratic polynomial regression model (Equation (1)) was proposed for all responses. In the equation, Y represents the response and the regression coefficients represented by b
o—coefficient of intercept, b
1, b
2—coefficient of linear terms, b
11, b
22—coefficient of quadratic terms, and b
12—coefficient of interactions between effects of A (particle size of buckwheat flour) and B (level of buckwheat flour added in wheat flour) factors.
The multiple linear regression analysis was applied to fit the data obtained for each response to linear, two-factor interactions, quadratic and 2FI models. The most adequately model to predict data variation for each factor was found through a sequential F-test, coefficients of determination (R2), adjusted coefficients of determination (Adj.- R2). To evaluate the significant differences (p < 0.05) between the samples, one-way ANOVA and Tukey’s HSD post-hoc test was used to describe means with 95% confidence. All the analysis was determined in duplicate. These analyses were performed using Stat Ease Design-Expert 12.00 software (Stat-Ease, Inc., Minneapolis, MN, USA) (trial version), and the relationships between composite flour and chemical characterization and functional properties were verified using XLSTAT 2020.2 software (Addinsoft, Paris, France, 2020). To establish the optimal value of the factors, buckwheat flour particle size and addition level, the multiple responses methodology was used to adequately predict the models. For the numerical optimization applied in this study, the desired goal established for each response included: dough stability (ST) at maximum value, starch retrogradation (C5-4) was minimized and the level of the other responses which have been taken into account in this research were maintain within studied limits. The one-way analysis of variance (ANOVA) was performed by using XLSTAT 2020.2 software (Addinsoft, Paris, France, 2020) to test if the effect of the particle sizes on the physicochemical and functional properties of buckwheat flour was significant (p < 0.05).
3. Results
3.1. Buckwheat Milling Fractions Composition
The values of physico-chemical analyses of the buckwheat milling fractions, large (BL), medium (BM), and small (BS) are presented in
Table 2. It can be seen that the moisture content ranged from 12.00% to 12.85% and the lowest value has been obtained for the medium particle size. The low moisture found for this particle size suggested its potential for higher storage stability and longer shelf life. Offia-Olua (2014) [
42] mentioned that a moisture flour up to 12% indicated higher storage stability compared to the one with higher moisture. The results showed different moisture among the samples (
p < 0.05). Similar data on the content of different buckwheat milling fractions was reported by Sciarini et al. (2020) [
43] and Slukova et al. (2017) [
44].
The ash content for all fractions was between 1.01% and 4.23%. Similar results were found by Kasar et al. (2020) [
26], Martin-Garcia et al. (2019) [
45], and Bobkov S. (2016) [
24]. The ash content of the studied milling fractions showed significant differences (
p < 0.05) between all the samples. These findings can be attributed to the biochemical and morphological structure of the buckwheat seeds. In comparison with wheat flour, buckwheat is a good source of iron, zinc, copper and manganese [
18,
46], minerals that act as cofactors of antioxidant enzymes and serve as indirect antioxidants. A high level of magnesium, potassium, and phosphorus and a slightly low content of calcium was reported in buckwheat [
18,
47]. The high ash value (4.23%) observed in medium particle size (BM) can be related to the minerals such as magnesium, potassium, and phosphorus, which are stored in the embryo [
48], and thus, BM was expected to have a high ash content. The supplementation of wheat flour with buckwheat flour fractions with high ash content could imply a rise in the mineral amount in the newly formulated flour.
Buckwheat flour milling fractions had a high protein content, which varied between 10.09% and 26.61% and was only different (
p < 0.05) between fraction BM and the other two particles (BL and BS). Close results for protein content of various buckwheat milling fractions that differ from those studied in this work were reported in some studies [
43,
45,
49]. Therefore, it can be concluded that noticeable differences in protein content can be associated with the presence of different embryo parts in the milling fractions. The protein content between BL and BS fractions did not show significant differences (
p > 0.05), which can be possible because, during milling, the parts of the embryo where the protein is concentrated are separated as components of the BM fractions. In this case, the BM fraction, which is high in ash, may be a feasible option for use as a mineral-rich ingredient.
The fat content of the buckwheat milling fractions varied from 1.93% to 5.63% and was significantly different (
p < 0.05) between the medium fraction and the other large and small fractions. Similar data for fat content on various buckwheat flour fractions were reported in some studies [
24,
50]. Most lipids in buckwheat seeds are located in the embryo and seed coat, followed by the pericarp and endosperm [
51]. According to Ahmed et al. (2014) [
46], the total lipid content in buckwheat grains ranged from 2.8% to 3.4%, while Dziadek et al. (2016) [
19] found a significantly lower lipid content in whole common buckwheat grain samples (1.72–2.24%), a variation that can be attributed to the crop genetics and growing condition. As can be observed in
Table 2, the fat content has an irregular trend with particle size variation. The highest values of fat (5.63%) were found for the medium fraction and can be related to the large amount presence of the lipidic part from buckwheat seed in this fraction.
The amount of carbohydrate in buckwheat fractions ranged from 51.52% to 74.02%, the milling fractions showing a significant (p < 0.05) effect on the carbohydrate content. The large particle size (BL) presented the highest carbohydrate content (74.02%), which can be related to the starchy endosperm. A decrease in carbohydrates in medium particle size was expected due to the rise in protein and ash content in this fraction.
3.2. Functional Proprieties of Buckwheat Milling Fractions
The water absorption capacity (WAC) of buckwheat milling fractions showed a significant reduction in a small fraction (BS) compared to medium (BM) and large particle size (
Table 2). Data revealed that buckwheat milling fractions were statistically different (
p < 0.05). The highest value (2.91%) observed at BM could be explained by the presence of a higher quantity of hydrophilic compounds from this fraction. The proteins and carbohydrates have a great influence on WAC due to the presence of such components as polar or charged side chains [
52]. A high WAC implies high water incorporation in the dough, which can improve bread properties, especially texture and mouthfeel, with the knowledge that WAC is an index of the ability of protein and fiber to absorb and retain water. Thus, the WAC values confirmed that M particle size can absorb water well and swell for improved dough consistency, making it suitable for use in bread making. This WAC provides information on the strength of the starch inter-granular bond. A lower WAC was attributed to a close association of starch polymers in the native granule or can be attributed to the presence of the lower amounts of hydrophilic constituents in BF like carbohydrates and proteins, and influenced the cohesiveness of the food products.
Water retention capacity (WRC) for buckwheat flours fractions ranged between 3.81 and 5.91 g/g (
Table 2), and are similar to the results obtained by Kasar et al. (2020) [
26] for different buckwheat milling fractions. Differences were found among all the studied milling fractions (
p < 0.05). These differences can be due to the different compositions of milling fractions and to the particle size distribution and its morphology. The increase of WRC in BM (5.91%) can be linked to a substantial content of ash and protein from this fraction.
Swelling capacity (SC) for the milling fractions of buckwheat flour studied ranged between 5.02 and 5.67 mL/g and does not present significant differences (
p > 0.05) among the samples (
Table 2). A similar trend was reported by Kasar et al. (2020) [
26] when some functional properties of different buckwheat milled fractions were investigated. Buckwheat starch granules have a diameter of, on average, 5 μm and presented pores [
53,
54], facilitating, more or less, the penetration of water molecules into buckwheat starch granules, depending on particle size, but a regular trend was not observed. The values obtained for SC can be related to the extent of degree swelling during the heating process, and can also predict the buckwheat milling fractions behavior in further processing.
Volumetric density (VD) values for each particle size are showed in
Table 2, which varied from 0.49 to 0.61 g/mL, showing a statistically difference (
p < 0.05) for each particle size. The BS presented the highest volumetric density that can be explained, probably, by the positive association with the carbohydrates and negatively with the lipid content. Similar results (0.67 g/mL) were reported by Sindhu et Khatkar (2016) [
55]. The lower VD value found for medium particle size indicated a relatively good packaging characteristic of this milling fractions compared to other particle sizes.
It can be concluded that the compositional difference of carbohydrates and proteins between the particle sizes affected the functional properties of buckwheat particle size. The hydrophilic components present in milling fractions, like polysaccharides, have a good water retention capacity, whereas the polar amino acid residues of proteins have an affinity for water molecules, imparting water binding property.
3.3. Fitting Models
The investigation was conducted following the experimental design for determining the effects of the particle size and buckwheat milling fractions level added in wheat flour on falling number (FN) value and thermo-mechanical parameters. Mixolab rheological properties during the mixing stage in terms of water absorption (WA), dough stability (ST), dough development time (DT), minimum C2 torque, the difference between torques C1 and C2 (C1-2), and in the starch behaviour process as maximum C3 torque (C3), the difference between torques C3 and C2 (C3-2), minimum C4 torque (C4), the difference between torques C3 and C4, (C3-C4), maximum C5 torque (C5) and the difference between torques C5 and C4 (C5-4) [
32] were assessed. The most fitting models were highly significant for almost all responses and were used for studying the influence of factors on the responses. These adequate models represented the experimental data well, showing high values (0.66–0.92) for coefficients of determination (
R2) (
Table 3). The ANOVA results, which comprise significant regression coefficients (
p < 0.05), expressed in terms of coded value, quadratic determination coefficients (
R2), and adjusted-
R2 (
Adj.-
R2), were calculated to assess the adequacy of quadratic models and are shown in
Table 3.
3.4. Falling Number Index Estimation as Influenced by Buckwheat Milling Fractions and the Addition Level in Wheat Flour
The Falling Number (FN) index values as the parameter used for estimation of amylolytic activity of grain enzymatic complex in the buckwheat-wheat composite flours formulated ranged from 299 to 369.5 s. The model can be adequate to predict the FN index, with a high level of significance (
p < 0.001), defining the amylolytic activity of the buckwheat-wheat flour through the FN index. As in data showed in
Table 3, the milling fractions caused a significant negative influence (
p < 0.001) on FN, while the amount of buckwheat flour (BF) added was not-significant (
p > 0.05). The negative effect of buckwheat milling fractions addition showed that the FN index of buckwheat-wheat flour increased with decreasing particle size of BF. This consequence can be probably associated to the phenolic compounds from the lowest fractions that bind to α-amylase and changing its conformation, and thus led to a rise in the FN index. A significant negative correlation was observed between FN and the interaction effect between the factors, while the quadratic term of BF addition showed a significant positive correlation with FN (
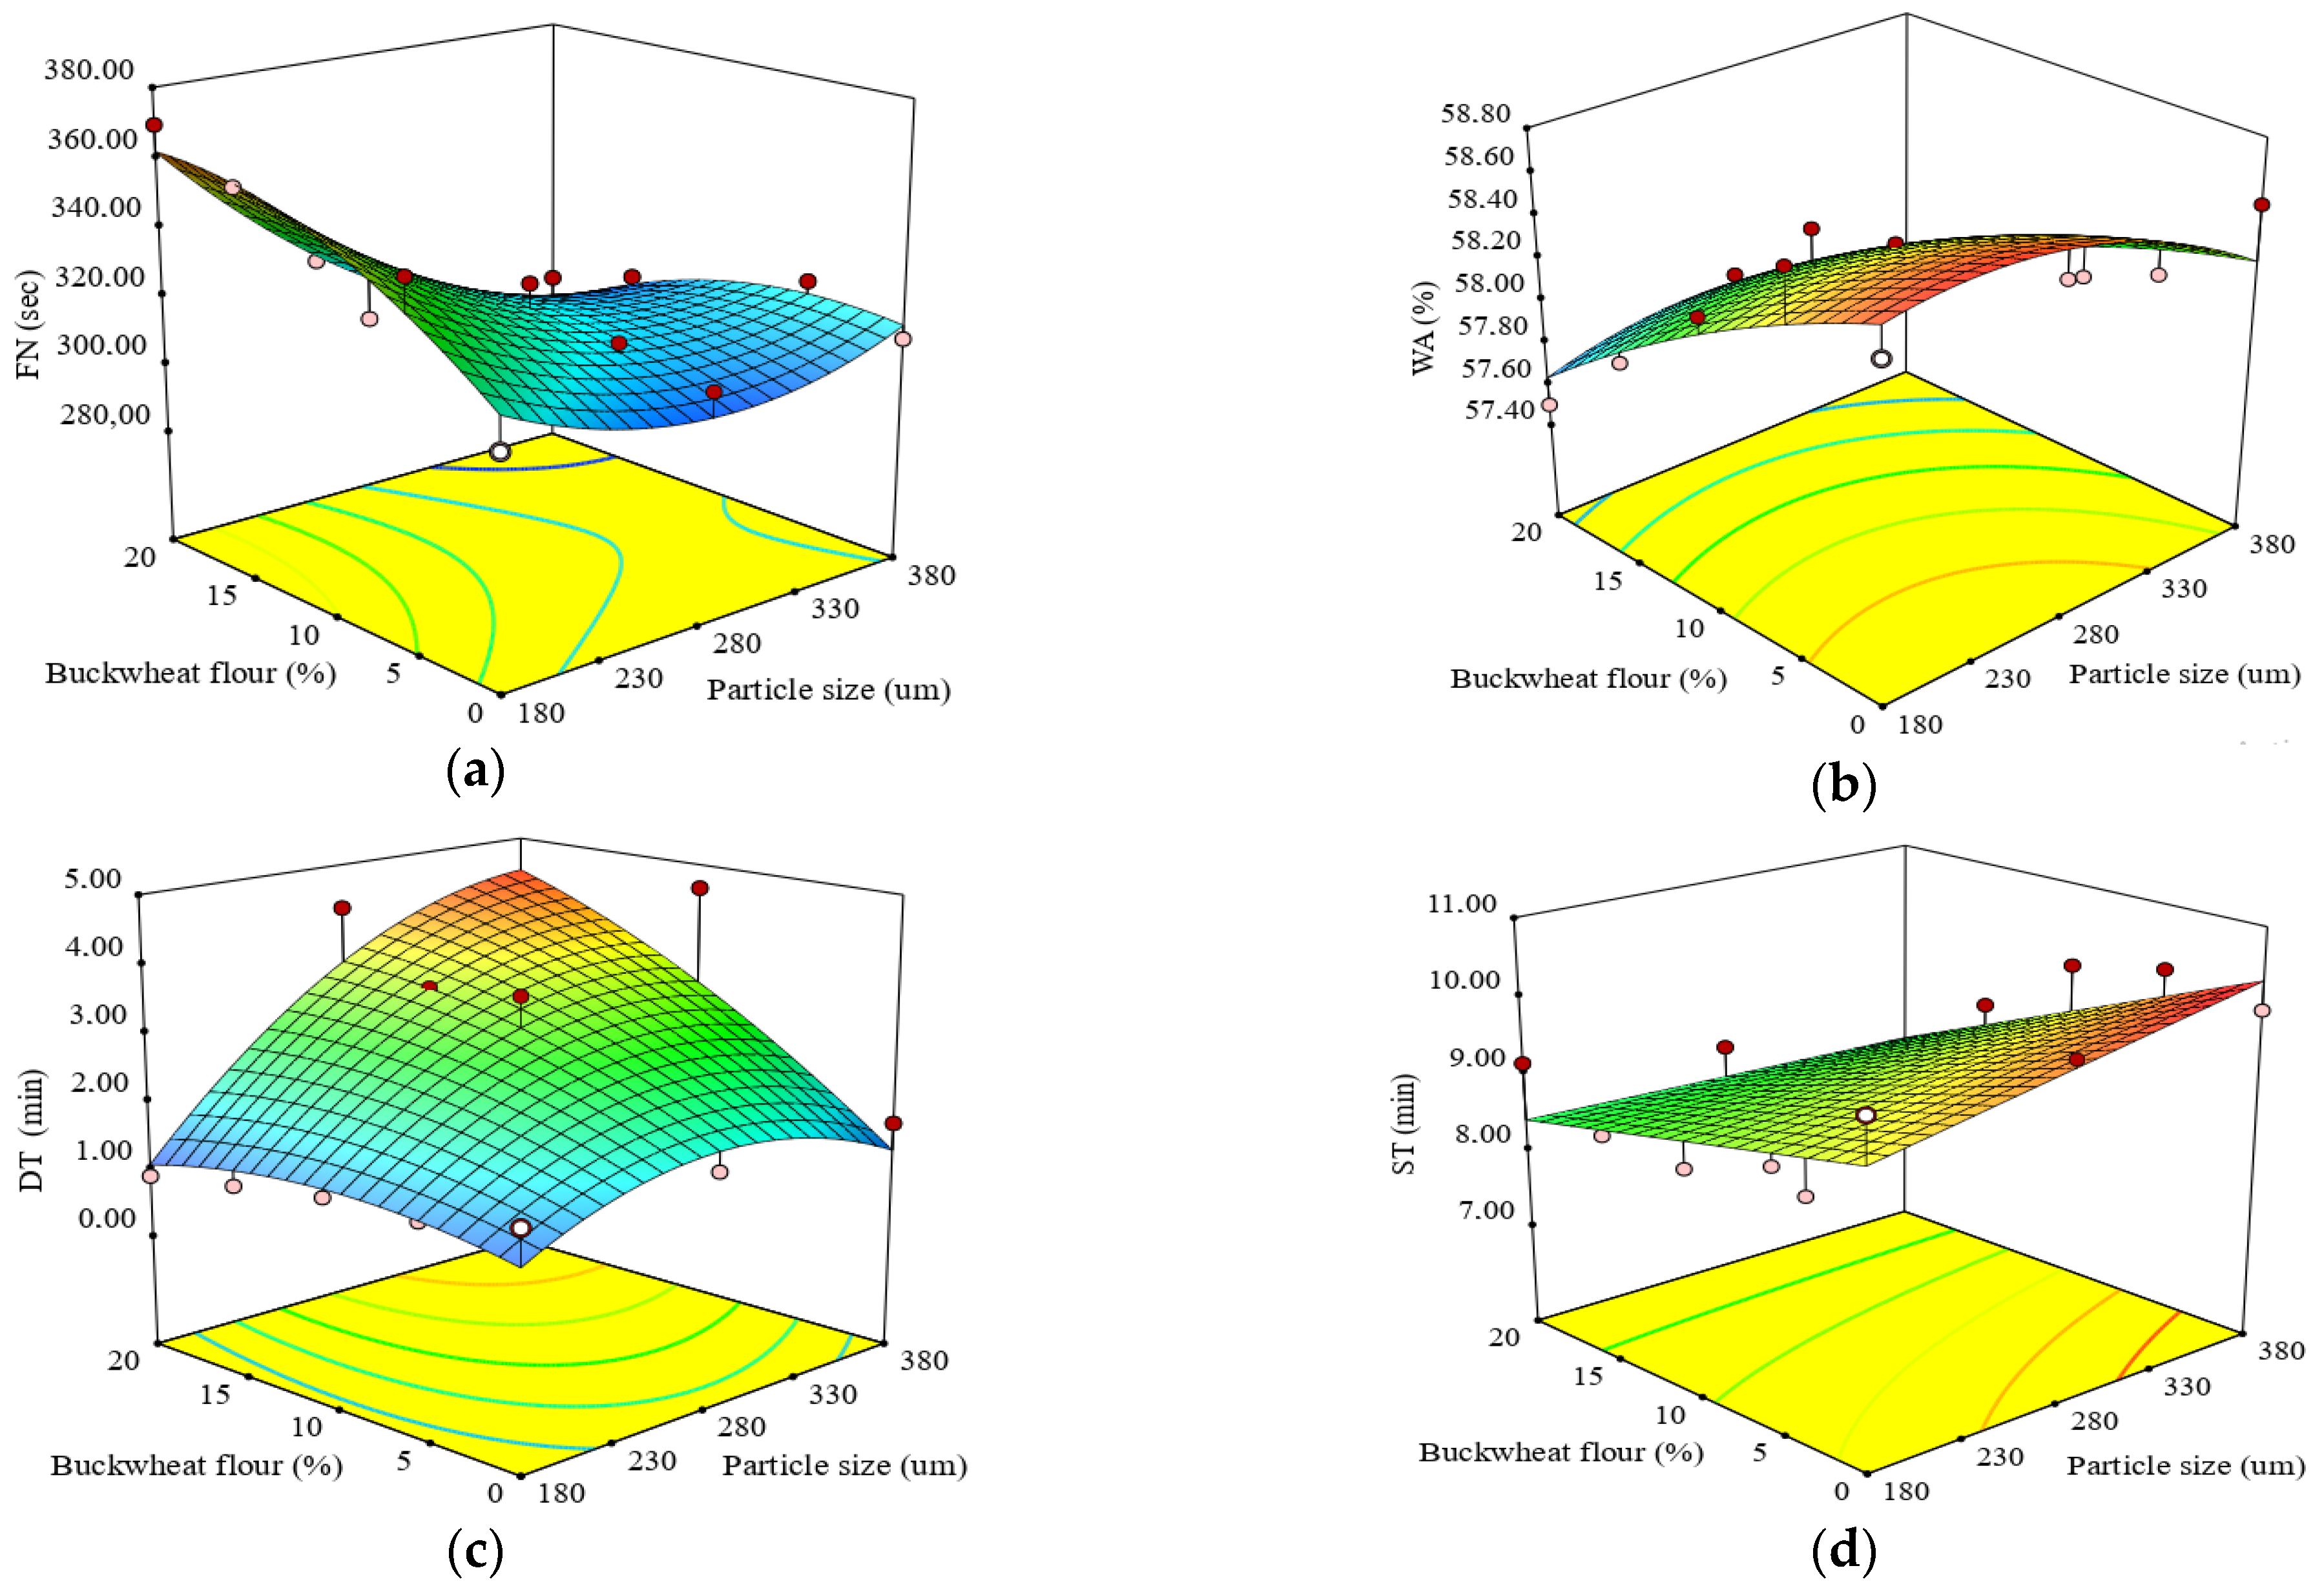
Table 3). The effect of factors, BF milling fractions, and BF addition level is presented in
Figure 1a, showing that, with the increase of particle size and BF addition, the FN index decrease. This tendency suggested a rise in the α-amylase activity because an inversely correlation exists between the FN index and α-amylase activity in flour [
56]. Consequently, buckwheat milling fractions can be used as an ingredient to adjust the α-amylase activity of wheat flour.
3.5. Dough Rheological Properties Evaluation Using Mixolab Test
When some part of wheat flour is replaced with different buckwheat milling fractions, various physical and chemical changes in composite flours can occur, modifying the performance during processing. Therefore, the Mixolab test was used to observe dough rheological properties of wheat flour enriched with different buckwheat milling fractions at different levels. The Mixolab presents the advantage measure dough behavior during mixing and heating in a single test, simulating the mixing and baking processes, and offer the possibility to monitor both the protein and starch behavior during processing. The protein characteristics of dough are expressed as WA, DT, ST, C2 torque, and C1–2. The starch behavior during heating is expressed as torques C3, C4, C5, and C3-2, C3-4, C5-4, quantifying the changes in dough structure caused by temperature rise and mechanical forces of mixing.
3.5.1. Water Absorption Evaluation during Mixing
The substitution of wheat flour with BF determined changes in dough consistency and stability, which are mainly associated with the formation of the aggregates as a result of hydrogen bonding or proteins linking through disulfide or dityrosine bonds [
31]. The changes in dough consistency due to added BF milling fractions in wheat flour can be related to the water quantity resulted from BF milling fractions and its addition level. Water absorption capacity has an essential role in influencing the baking process affecting the volume efficiency of the baked goods. Besides, this parameter offers an indication of the potential for the protein molecules in the sample to absorb the added water. Thus, as reported by Liu et al. (2019) [
20], water absorption is considered to be an indicator of baking quality. For the formulated samples, water absorption (WA) values ranged from 57.5 to 58.7%. The predictive model for WA indicated that particle size and BF level had a significant (
p < 0.05) effect on WA (
Table 3). The negative coefficient of particle size and BF level showed that WA increased significantly (
p < 0.05) when the BF level and particle size decreased.
Figure 1b may notice that PS and the addition level of buckwheat flour have a negative effect on water absorption (WA), which indicated that WA decreased as the addition and particle size of BF increased. Nedeljković et al. (2014) [
7] and Gavurníková S. (2011) [
57] also reported a negative relationship between the water absorption and the BF milling fractions. In this study, the medium fraction, followed by large particles, needed more water to swell the starch than the small particle size, a finding that can be associated with WAC values (
Table 2). This tendency can be related to several factors, especially fractions of chemical composition. As Sapirstein et al. (2018) [
58] stated, damaged starch represents one of the major factors that contribute to the water absorption alongside the proteins and starch. At the same time, an increase in WA with a decrease of milling fractions was reported in previous studies [
28,
29,
31,
32] on the impact of substituting wheat flour with different fraction sizes of non-gluten flours, revealing that the small particle size raised the WA values.
3.5.2. Dough Development Time Evaluation
The effect of buckwheat milling fractions addition on dough development time (DT) is presented in the quadratic regression model shown in
Table 3. The buckwheat flour (BF) addition level influenced the gluten network of the dough and significantly modified the dough development time depending on fraction sizes. The quadratic model was found to be adequate to predict DT, depending on the studied factors, particle size and BF addition level (
Table 3). Describing the goodness of fit of the models, the quadratic determination coefficient (
R2) was 0.75, which confirms the suitability of the model, showing that the model explained 75% of data variation. DT of buckwheat-wheat flour ranged between 0.9 to 4.65 min and it was affected (
p < 0.05) by the particle size, BF addition level, and the interaction between fraction size and BF addition level. A higher increase in the DT was observed with a particle size increase compared to the BF level increase (
Table 3). Thus, DT increased notably as the particle size increased (
Figure 1c), showing that it took a long time from the time the water was added to the time when the dough reached the optimal consistency (C1 torque =1.1 N⋅m). An increase of DT of about 2.1–2.7 times in the buckwheat-wheat flour with the largest fraction and about 2.1–2.5 times in the medium fraction as the BF addition level increased by over 10% was obtained beside the wheat dough used as control. This fact may be due to the rise in water when the BF addition was high, thus requiring mixing. Larger and medium particle sizes rich in some compounds such as dietary fibers and proteins, respectively, required a longer time for hydration, which implies a higher DT. With the addition of gluten-free flour, the gluten network is affected and leads to a rise in DT. As the DT value quantifies the dough strength, a higher value indicated stronger dough. Increased DT was also found by Sedej et al. (2011) [
22] and Nikolic et al. (2011) [
59] when different levels of buckwheat flour were used to supplement wheat flour, but without taking into account different particle sizes.
3.5.3. Dough Stability Evaluation
The 2FI predictive model results from the regression analysis showed that both PS and the addition level of BF had a remarkable influence (
p < 0.05) and fitted well the experimental data for dough ST (
R2 = 0.51) (
Table 3). From the addition level effect point of view on dough ST, a significant decrease (
p < 0.05) was observed, while fraction size did not significantly influence ST, which varied from 7.05 to 10.17 min. The response surface plot showed that ST decreased when addition BF increased, depending on the fraction size (
Figure 1d). Dough ST increased with particle size rise. This behavior may be associated with the composition of particle size fractions. Probably, at a particular ratio of fiber and gluten, gluten–fiber interactions can occur, enhancing dough stability. This result is consistent with the report by Han et al. (2013) [
49], which showed that ST increased when a certain fraction of tartary buckwheat flour was added in wheat flour compared to other milling fractions due to gluten–fiber interactions that increase dough stability. However, the decrease in dough ST with the addition of BF can be explained by the gluten dilution when wheat flour was supplemented with gluten-free flour, indicating a rising degree of softening. The weakening of the gluten network was probably related to the dissimilarity between the proteins of buckwheat and the wheat proteins. Additionally, the buckwheat grain protein consists mainly of albumin and glutelins [
60] and it cannot form structures such as wheat protein. Mohamed et al. (2014) [
61] reported similar findings regarding the incompatibility between the protein spectrum of pulses and the semolina gluten protein. Similar changes in dough ST when whole buckwheat flour supplemented wheat flour in different amounts were reported by Stefan et al. (2018) [
62] and Sedej et al. (2011) [
22], revealing decreases in ST with supplementation increase.
3.5.4. Protein Weakening Evaluation during Heating
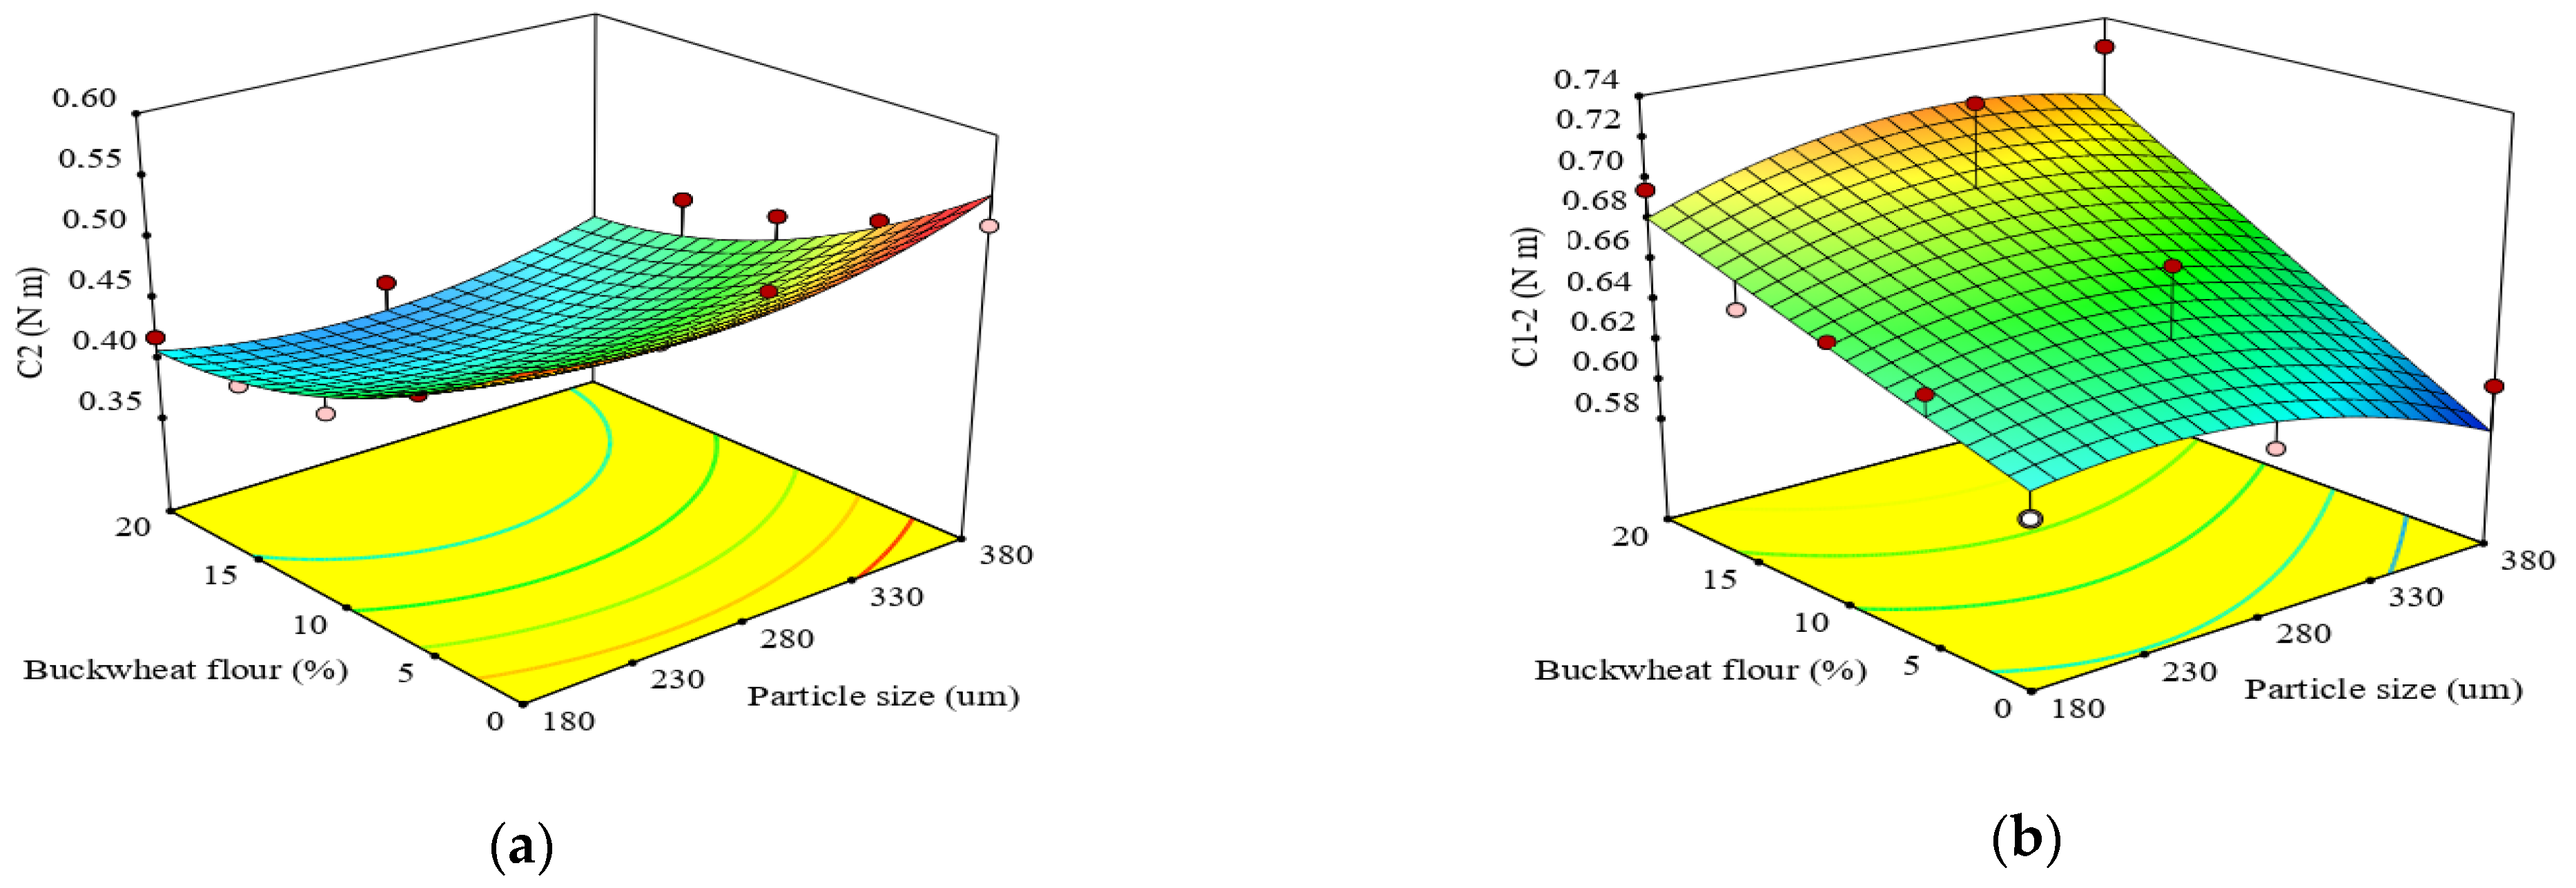
In the heating stage, the mechanical shear stress and heating constraint led to the destabilization of proteins when the dough consistency decreased and C2 torque to the minimum value. For C2, the quadratic model was found to fit well with the experimental data, showing a high
R2 value (0.86) (
Table 3). The C2 torque was influenced (
p < 0.05) by the level of BF added in wheat flour, while the particle sizes had a non-significant influence (
p > 0.05). It was found that the BF level had a highly significant negative effect (
p < 0.01) on C2, showing a decrease in C2 torque with the increase in the BF level added in wheat flour (
Figure 2a). This behavior was probably due to the gluten dilution effect by the addition of gluten-free buckwheat flour, which caused the formation of a weaker protein network. It is well known that buckwheat flour proteins do not have structure forming ability compared to wheat flour proteins. From
Figure 2a, a decrease of C2 as the fraction of BF decreased can be seen, and in the medium fractions this fact was most evident, which can be correlated with either a release of water molecules in dough or to the presence of high proteins and the BF interfering with the protein unfolding [
32]. The presence of a high protein in the medium fraction compared, to large and small particles, was noticed (
Table 2). C2 torque reduction for small particle sizes may be correlated with the lower water availability in the dough because of high carbohydrates contents from this particle (
Table 2). Lower C2 torque denotes too weak of gluten network and lower resistance of gluten with rising temperature.
The difference between the C1 and C2 torques (C1-2), which represents the rate of protein thermal weakening, showed that the quadratic model was adequate (
Table 3) for the prediction of the effects of factors on C1-2. The BF addition level influenced (
p < 0.05) the parameter C1-2, while the milling fractions did not affect the C1-2 torque, as is shown by the ANOVA results (
Table 3). It can be observed from the response surface plot (
Figure 2b) that the BF level added to obtain composite flour had a positive influence on the C1-2, revealing an increase in C1-2 as the BF level increased, whereas from the fraction size effect point of view on C1-2, a decrease was observed. This variation can be explained by the changes in protein network structure due to the kneading and temperature effects. Buckwheat presents relatively small starch granules, which can occur in aggregates and singly with the same range of diameter (3–8 μm) [
53]. In this case, probably the presence of enzymatic attacking points is favored by the proteins, which become less compact in the heating, increasing in the speed of protein weakening, causing a decrease of C1-2.
3.5.5. Starch Gelatinization Evaluation
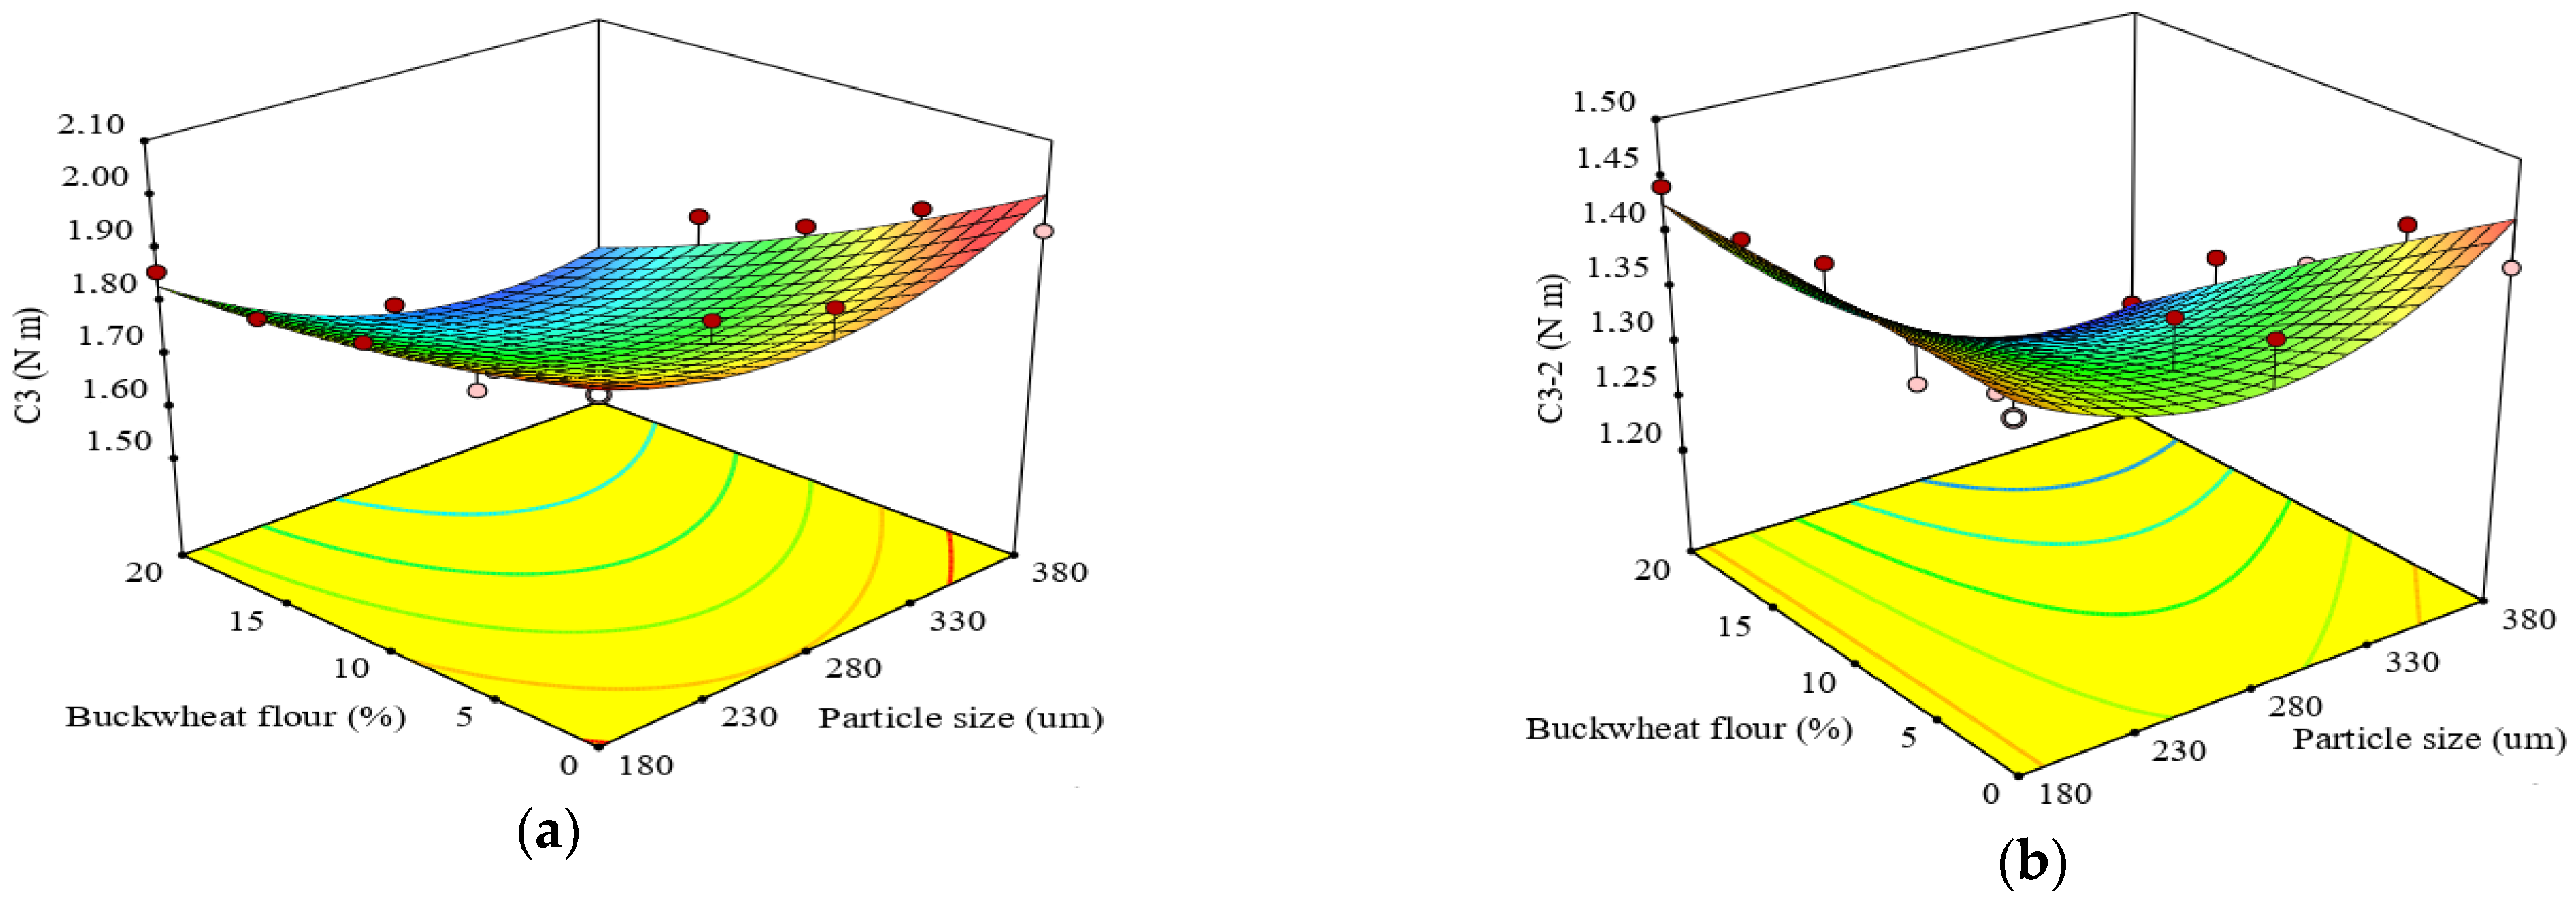
When the dough is heated above 60 °C, the starch granules are quickly broken, making them to raise the water absorption and swelling capacity, conducting to leaching of the amylose molecules that increase the viscosity and therefore the torque. The torque represented by C3 indicates peak viscosity and quantifies the degree of starch gelatinization. The effect of milling fractions and the level of BF added in wheat flour on the maximum viscosity of hot gel at 90 °C, measured by the C3 torque, showed that the quadratic model obtained was found to fit well the experimental data of C3 (
R2 = 0.87) (
Table 3). C3 was significantly (
p < 0.05) influenced by the linear term of the BF addition level in wheat flour, the interaction between factors, and the quadratic term of particle size. The addition of BF caused a decrease of C3 torque in composite flour and might be because buckwheat amylose forms with lipids complex compounds [
54]. Thus, these complexes can decrease the swelling power and solubility of buckwheat starch, thus affecting C3 torque. Moreover, nonstarch components (lipids, proteins, and dietary fibers) present in BF milling fractions could restrict swelling and gelatinization during cooking, in addition to a diluting effect due to the interaction with starch polymers (lipids and proteins), and to the competition for water (proteins and dietary fiber) [
32] interfering with starch swelling [
63]. The greater negative effect on C3 was given by the BF addition level, showing a decrease of C3 as the BF amount added in wheat flour increased. The lower swelling and gelatinization of starch granules was probably explained by the morphological characteristics of buckwheat starch, which restricted water quantity in the composite flour dough could decrease the peak of C3 torque. These results were in accordance with those reported by Filipčev et al. (2015) [
64]. As can be seen from
Figure 3a, C3 decreased with BF supplementation, and when the BF addition in wheat flour is 20%, the C3 torque decreased at 1.60 N⋅m for the large particle size value. These changes, most likely, are related to the higher enzyme activity and the amylose-lipid complexes formed during the heating of starch slurries. Qian et al. (1998) [
54] related that to the small granule of buckwheat-starch and their pores, and this starch is more susceptible to fungal α-amylase than wheat starch. The viscosity of the gel formed is largely influenced by granule shape and swelling power, amylopectin-amylose entanglement, and amylose and amylopectin granular interaction [
65]. The differences among the assessed fraction sizes might be due to the particle microstructural and chemical features of the buckwheat-starch that governs water absorption and swelling.
The difference between C3 and C2 torques (C3–2) is significantly (
p < 0.01) affected by the milling fractions and BF addition levels. The quadratic regression model represented well the experimental data of C3-2 and the
R2 value (0.86), confirming that this model is suitable. The increase in the amount and the BF milling fractions led to C3-2 (
Figure 3b) decrease, the interaction between milling fractions and the BF amount being more pronounced (
Table 3). α-amylase activity along with the composition of the BF milling fractions from the composite flour could explain these changes.
3.5.6. Cooking Stability Evaluation
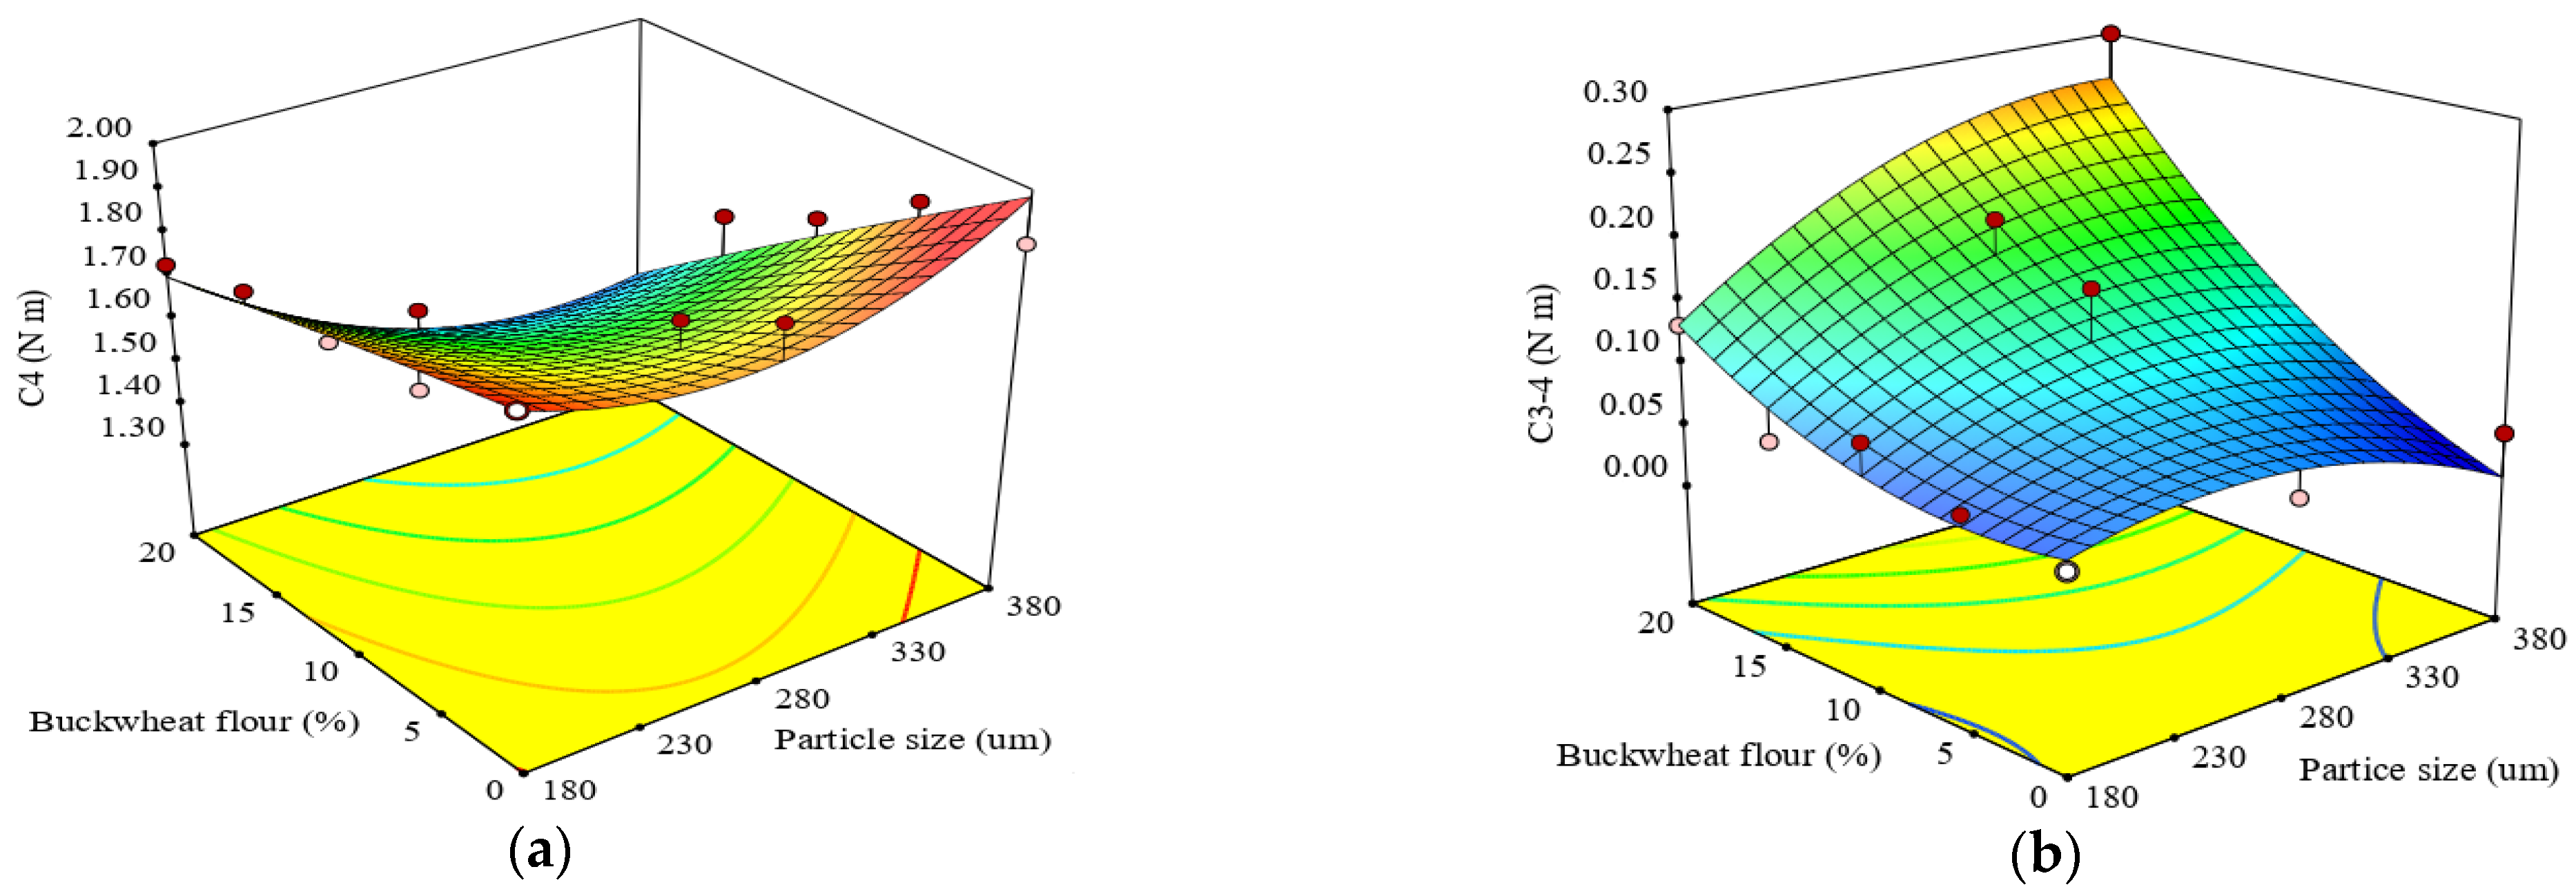
The cooking stability is measured by the minimum torque C4 obtained due to the rupturing of the swollen starch granules, thereby causing a decrease in the consistency of the hot-formed starch gel. The quadratic regression model for C4 torque was found to be significant and the
R2 value of 0.87 confirmed the suitability of the model (
Table 3). The ANOVA results revealed that there was a significant effect (
p < 0.0001) of the BF level added to wheat flour, and of the interaction (
p < 0.05) between particle size and BF level on C4. The combined effect of factors on C4 torque is noticed in the response surface plot (
Figure 4a). It can be observed that, with the addition of BF, the C4 torque decreased. Consequently, the cooking stability is diminished as a result of the paste resistance to disintegrate when the temperature is raised. The C4 torque indicated lower values for all samples formulated compared to the control, exhibiting a low resistance of starch against the enzymatic hydrolysis by amylase. The results obtained are in line with those reported by Filipčev et al. (2015) [
64], which found a decrease in hot gel stability for buckwheat supplemented doughs. The lowest C4 value was achieved for a large fraction at a higher level of 20% BF. The C4 torque decrease when the amount of BF in composite flour increased might be correlated with the fraction composition, more likely because of the soluble fiber that can bind water by hydrogen bonds, causing a decrease in available water for the starch granules [
31]. These results may be related to the protein denaturation from BF, which according to Janssen et al. (2017) [
66] shows a minor and a major denaturation peak at about 80 °C and about 102 °C. The protein denaturation will change the dough network, thus determining a decrease in viscosity.
The difference between C3 and C4 torques peak values (C3-4) reflects the hot-gel stability or cooking stability of dough. C3-4 was influenced (
p < 0.05) by BF addition in composite flour and the interaction between fraction size and BF level. The quadratic regression model obtained fitted well to the experimental data of C3-4 with a high coefficient of determination (
R2 = 0.86) (
Table 3). The simultaneous effect of particle size and addition level on C3-4 is shown in
Figure 4b, revealing their capacity to increase the C3-4. This increase of C3-4 may be attributed to the compounds from BF fractions, which changed the α-amylase starch interaction modifying the α-amylase hydrolytic activity on starch.
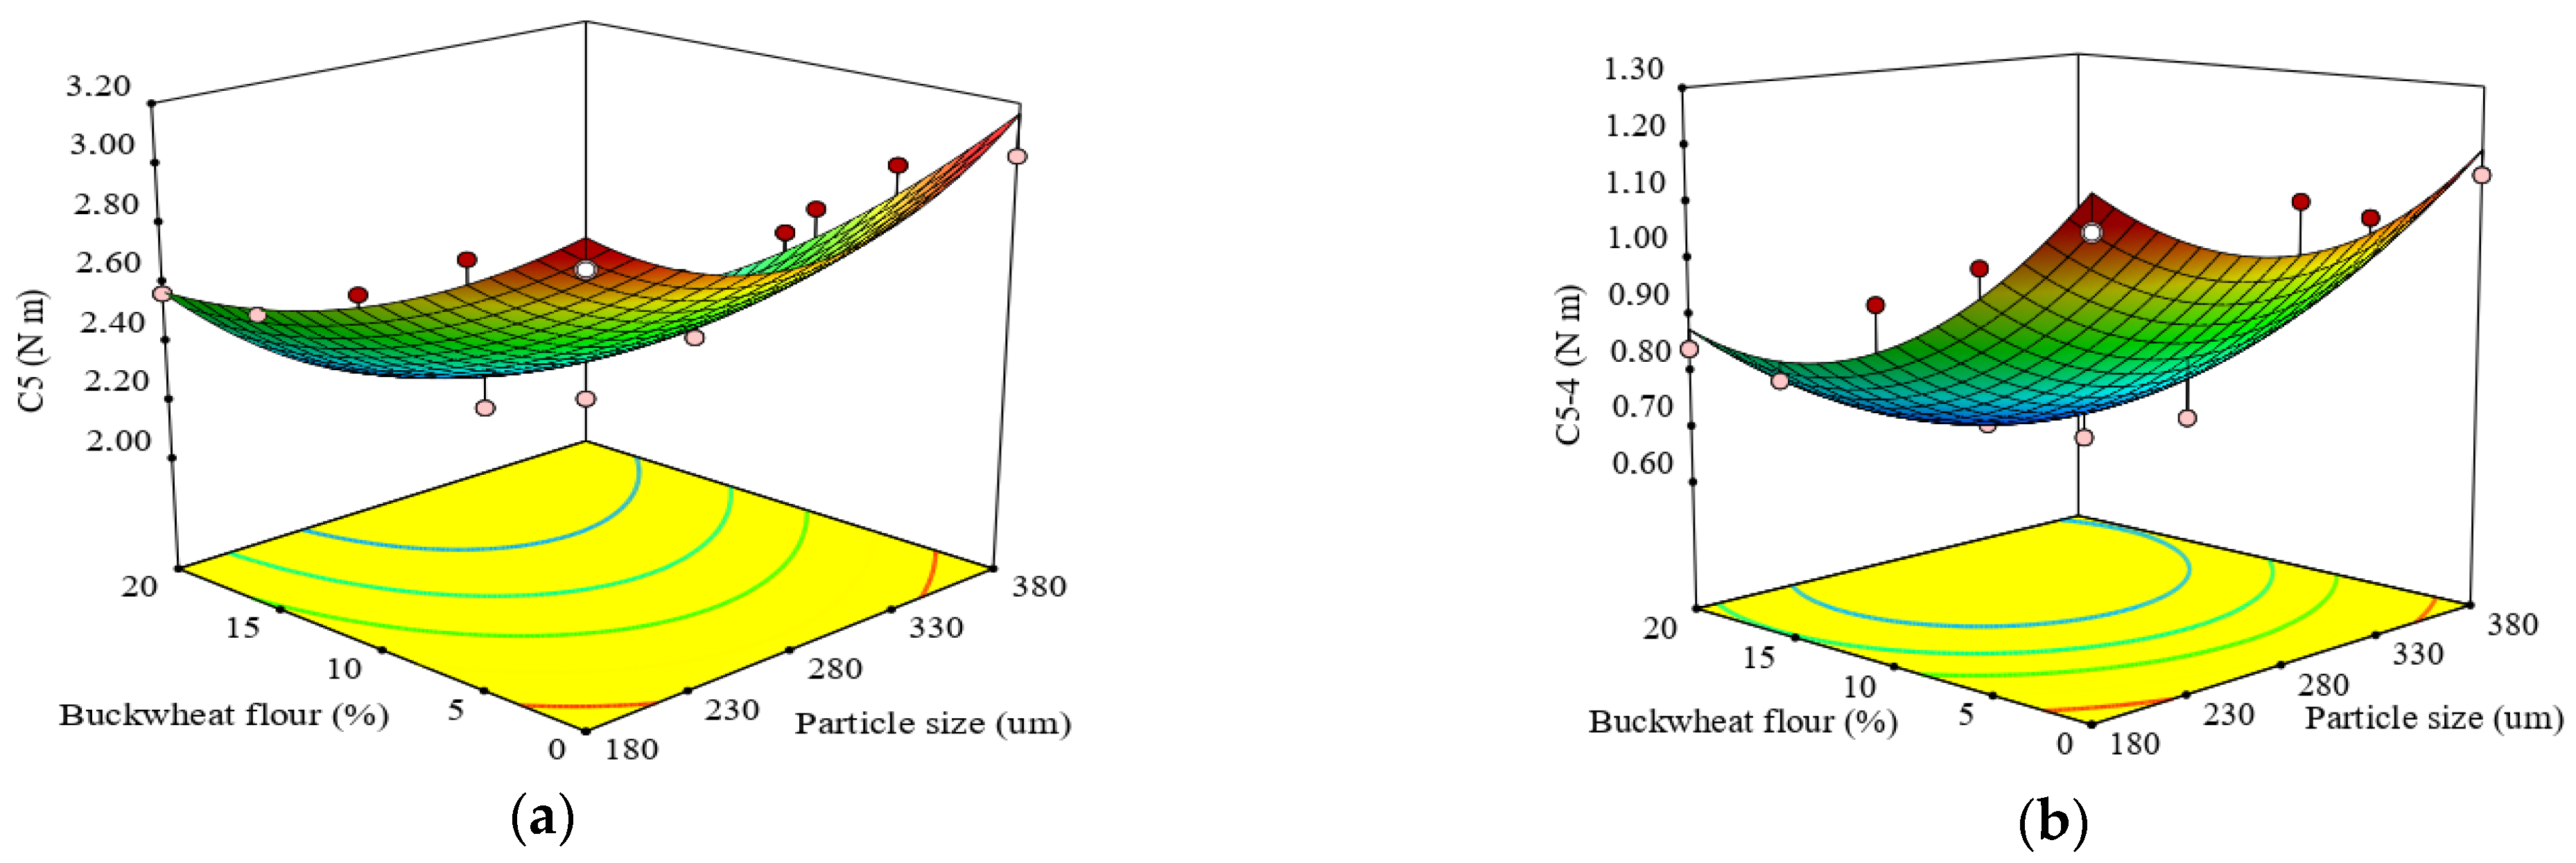
3.5.7. Starch Retrogradation Evaluation
The decrease in temperature during the cooling stage to 50 °C resulted in a final viscosity associated with a higher dough resistance, and consequently with the C5 torque, which reflects starch retrogradation. This is the process in which the leached amylose chains undergo recrystallization, conditioned by the ratio of amylose and amylopectin from starch [
67,
68], because amylose recrystallizes with a high speed compared to the amylopectin. Evaluation of C5 torque and C5–4 is used to characterize starch retrogradation. The quadratic regression model achieved for C5 torque was statistically significant (
p < 0.001) and was a very good one, with a high value (0.92) of
R2, which showed that only 8% of the total variation was unexplained by the model (
Table 3). Both studied factors influenced (
p < 0.05) the C5 torque. With the rise of fractions and the level of BF added in wheat flour, the C5 values decreased, indicating a low starch retrogradation and recrystallization. This result can be associated with the particular structure of starch and the granules of buckwheat presenting a low tendency toward retrogradation. Moreover, the high amounts of phenolic compounds can contribute to retrogradation lowering. The graphical representation of the effect of milling fractions and the level of buckwheat flour added on the C5 torque is presented in
Figure 5a. From the response surface plot, it can be observed that, as the fraction size and the BF addition increased, the C5 torque decreased, suggesting that fraction size composition affected α-amylase activity in buckwheat-wheat flours, a lower C5 value being caused by the high activity. However, lower starch gels, which have low C5 torque, are usually linked to lower amylose content. The initial retrogradation is mostly attributed to the re-association of amylose, and to the long-term retrogradation associated with the development of gel structure and crystallinity, e.g., during staling of bread, being due to the recrystallization of amylopectin side chains [
69]. As reported in some studies [
31,
70], the structure reorganization of starch may be favorable for the hardening of bakery goods during storage.
The difference between C5 and C4 torques (C5–4) indicates starch retrogradation capacity, influenced by different factors such as the botanical source of the starch, amylose/amylopectin ratio and average chain length of amylose and amylopectin [
71]. The quadratic model, which was obtained for the C5–4, was found to have statistical significance (
p < 0.05) with a high
R2 (0.88), which confirms the adequacy of the model (
Table 3). C5–4 was affected (
p < 0.0001) by the addition of BF in wheat flour, but the fraction size had a non-significant influence (
p > 0.05).
The level of BF in the composition of dough decreases the C5–4 torque in comparison to wheat flour dough (
Figure 5b). This decrease could be attributed to the higher lipid content of buckwheat flour, different structure of amylose and amylopectin fraction of buckwheat starch compared to wheat starch, and lipid-amylose complex-forming ability [
22]. Amylose molecules cannot reassociate and recrystallize in a free manner as in systems with low lipid content. This could have a positive effect on bread staling made from buckwheat flour, once the starch retrogradation is one of the key-bread staling factors. These results are in agreement with those reported in other studies [
22,
72].
3.6. Optimization of Buckwheat-Wheat Composite Flour
The models fitted in this study for dough rheological proprieties were used for simultaneous optimization by using numerical optimization and desirability function approaches. The numerical optimization allowed for the establishment of promising composite flour formulation, which was then compared to the control sample. The results highlighted that the optimal values of factors to achieve the most appropriate composite flour would be 10.75% buckwheat flour that were 280 ìm in particle size. Based on this optimal formulation, the predicted values for the evaluated responses, in terms of the FN index and Mixolab parameters, are shown in
Table 4. The results revealed that the optimal values for WA, ST and C2 torque were slightly smaller than the values of the control sample, with no statistical difference.
These results suggested that, during the first stage of bread making, the dough resulting from the optimization process could retain a CO
2 similar to the wheat dough. The high rise of DT indicated an increase in the gluten network strength compared to the control, suggesting that the optimal dough can sustain the mechanical treatment for a longer period during the bread-making process, and these were findings that were in line with those previously reported [
31,
32].
In respect to starch behavior, a decrease in the C2, C3–2, C4, C5, and C5–4 Mixolab parameters was obtained, which highlighted that the optimal buckwheat-wheat composite flour may be appropriate for bread making. The baked goods that can be obtained from this composite flour will present a longer shelf-life in the absence of problems related to staling.


