Article

Calibration of High-Impact Short-Range Quantitative Precipitation Forecast through Frequency-Matching Techniques

1
Hong Kong Observatory, Hong Kong 999077, China
2
Earth System Science Programme and Graduate Division of Earth and Atmospheric Sciences, The Chinese University of Hong Kong, Hong Kong 999077, China
3
Institute of Environment, Energy and Sustainability, The Chinese University of Hong Kong, Hong Kong 999077, China
4
State Key Laboratory of Agrobiotechnology, The Chinese University of Hong Kong, Hong Kong 999077, China
*
Authors to whom correspondence should be addressed.
Atmosphere 2021, 12(2), 247; https://doi.org/10.3390/atmos12020247
Submission received: 30 November 2020 / Revised: 9 February 2021 / Accepted: 9 February 2021 / Published: 12 February 2021
(This article belongs to the Section Meteorology)

Abstract

:
Short-lived and intense rainfall is common in Hong Kong during the wet season and often causes disruption to daily lives. As global numerical weather prediction (NWP) models are progressively improved, representation of sub-synoptic or mesoscale systems associated with intense rainfall is better parametrized and resolved than ever before, but their quantitative precipitation forecasts (QPFs) still tend to underestimate the magnitude of intense rainfall. This study calibrated model QPFs over the region of Hong Kong by two frequency-matching methods. In both methods, conversion schemes between the direct model output (DMO) and calibrated forecasts were first established by matching the cumulative distribution to that of the observed data. The “Adaptive Table” method updated the conversion scheme whenever the latest observation fell out of its expected range in the existing scheme, whereas the “Sliding Window” method reconstructed the conversion scheme using data from the most recent two years. The calibration methods had been verified against actual rainfall events with different thresholds, and it was found that both methods could improve model performance for moderate and heavy rainfall in short-range forecasts with similar effectiveness. They were also able to reduce the systematic bias of precipitation forecasts for significant rainfall throughout the verification period.

1. Introduction

Hong Kong receives abundant amounts of rainfall in the wet season due to the influence of the southwest monsoon, monsoon troughs and tropical cyclones [1]. Based on climatological data for 1981–2010 from the Hong Kong Observatory [2,3], about 80% of annual rainfall was recorded between May and September, and there are approximately seven days a year on average when Hong Kong experiences rainfall of 30 mm within an hour. As Hong Kong is densely populated and many buildings are situated on or near slopes, short-lived and intense rainfall can cause disruptions to daily lives and even pose threats to lives and properties. Accurate and timely quantitative precipitation forecast (QPF) guidance is essential to the reduction of socioeconomic losses and helpful for the general public to plan their activities or take precautions.
Numerical weather prediction (NWP) models provide essential input to weather forecasting generally up to a medium range, but it remains a challenge to predict precipitation quantitatively at a specific time and location due to its intermittent nature, high variability, and dependence on spatiotemporal scales [4]. The forecast uncertainty of intense rainfall in numerical models is particularly high, because convective cells are short-lived and rely heavily on the performance of cumulus parametrization in the models [5]. The related processes depend not only on the synoptic situation, but also sub-grid-scale processes such as the phase change of water and convective transport of heat and moisture, which are often not explicitly resolved by NWP models [6]. As a result, intense precipitation events are usually studied within a small area in the context of short-range forecasts.
Short-range QPF often involves nowcasting methods. For example, the Hong Kong Observatory developed a radar-based precipitation nowcasting system named Short-range Warning of Intense Rainstorms in Localized Systems (SWIRLS) in 1999, which predicts the movement and intensity of mesoscale systems in the next few hours [7]. The algorithm of SWIRLS has evolved throughout the year, with the latest version adopting semi-Lagrangian advection and variational optical flow [8], and now operates up to 9 forecast hours. In recent years, Shi et al. [9] have pioneered the development of radar-based precipitation nowcasting through deep-learning methods and found that using a convolutional Long Short-Term Memory (LSTM) method outcompetes the original optical flow method. Shi et al. [10] further proposed a method called Trajectory Gated Recurrent Units (TrajGRU) and replaced the original loss function to assign a higher weighting to intense precipitation events, so that the movement of the rain bands is taken into consideration with a higher impact-based significance. Their techniques are now widely applied in the field of radar-based short-range QPF [11,12].
Although nowcasting techniques were proven useful in capturing events of intense precipitation, these methods are only limited to a short forecast period and the methodologies do not take into account the physics of precipitation processes. To provide reliable QPF guidance with sufficient time to respond to intense rainfall, the use of NWP models is inevitable. The Hong Kong Observatory has attempted to blend radar-based products with the use of regional NWP models to produce short-range QPF up to 15 forecast hours at 2 km resolution, and the model is run every hour. This better represents the physics of mesoscale systems to optimize short-range forecasts, by avoiding model spin-up in early forecast hours of NWPs and poor extrapolation of radar echoes in later forecast hours when radar-based methods are used [13,14]. A mesoscale non-hydrostatic model was also developed as a reference to short-range QPF up to 72 h, running every 3 h [14].
Global NWP models are still currently the major references for assessing day-to-day weather conditions including heavy rainfall episodes, as skills of short-range forecasting tools decrease with increasing forecast range. Since most global NWPs are hydrostatic and the horizontal resolution is generally limited to around 10 km or above [15], mesoscale activities with violent updrafts and downdrafts are not well-represented under the assumption of hydrostatic balance, and their horizontal extents of several tens of kilometers are not well-resolved by models. Previous verification efforts found global models such as the European Centre for Medium-Range Weather Forecasts (ECMWF) and National Centers for Environmental Prediction (NCEP) have a tendency to underestimate heavy rainfall [16,17]. Correcting model biases would improve the predictability of heavy rainfall events and is therefore highly valuable to operational weather forecasting.
Calibration is a class of most direct and essential methods to post-process model QPFs. Various methods of calibration have been developed to correct model biases, some of which involve the use of ensemble forecasts. Dong [18] compared ECMWF ensemble forecasts with the climatological distribution of precipitation of the simulated climate to deduce the extremity of daily precipitation for calibration against the true distribution of precipitation. A Bayesian approach has also been adopted in various research to assign higher weights for more reliable ensemble members [19] and the family of logistic regression methods calibrates ensemble members to give probabilities of the target events through one or more predictors [20,21]. Calibration can also be applied to individual members of the ensemble forecast or the deterministic forecast. Voisin et al. [22] calibrated each ensemble member against a network of rain gauges through various downscaling techniques and also the analogue method, which compares the current model forecast with a range of previous forecasts for phenomenologically similar previous events, diagnosing differences with actual precipitation to derive a better estimate of a future event. Zhu and Luo [23] studied QPFs from NCEP ensemble over the continental United States and applied a frequency-matching method by weighing the cumulative distribution functions of precipitation over a specified number of days using a decaying average, in effect adjusting the frequency biases in the calibration with emphasis to more recent data. The calibration of model outputs against climatological data through cumulative distribution functions is also referred to as quantile mapping [24] and the graphical representation is known as the Q-Q plot [25].
This study focuses on the calibration of QPF through frequency-matching, and the Adaptive Table method applied in this study is inspired and modified from a statistical post-processing method developed by the Japan Meteorological Agency (JMA) [26]. In the method adopted by JMA, 3 h QPFs averaged over 20 km × 20 km grids were used as the predictand and Kalman filter was first applied, with 9 associated atmospheric elements that might affect the intensity of precipitation, such as different components of winds at 850 hPa and orographic precipitation index. The filter considered the previous performance of the model and the correlation of QPF with the atmospheric elements to reduce the root-mean-square error of the forecast. After that, the filtered output was further corrected by a conversion table that relates the cumulative distribution functions of historically forecasted and observed QPF to minimize the frequency biases of the model. The Adaptive Table method in this study is mainly developed upon the tabulation step of the methodology of JMA and will be further discussed in the next section. Another method adopted in this study, the Sliding Window method, also took into account the previous performance of deterministic models and was calibrated against the cumulative distribution functions for a fixed time window.

2. Data and Methodology

Owing to the fact that intense rainfall in Hong Kong is mostly brought about by severe convections and tropical cyclones, and global NWP models are relatively weak in convective parameterization, the purpose of this study is to provide a more accurate short-range QPF guidance based on global models by correcting the systematic underestimation of significant rainfall over the region of Hong Kong. Moreover, the stochastic nature of heavy convective precipitation in the tropics makes it difficult even for mesoscale models to pinpoint each event, hence the frequency-matching methods chosen below would indicate the appropriate order of magnitude once those events took place, rather than to improve the predictability of each event, due to model constraints. In the calibration, 6 h model QPFs from the ECMWF and JMA were used for the experiment. The lead times of the 6 h QPF were defined to start at 00, 06, 12 and 18 h local time (UTC + 8) to meet operational needs. The 18 and 00 h forecasts were based on 00 Z (UTC) model runs and the 06 and 12 h forecasts were based on 12 Z model runs. 6 h accumulated precipitation at lead times of 6, 12, 18, 24 and 30 h were re-calibrated for every start time. Since the temporal resolution from the original model guidance is 3 h starting at 08 or 20 h local time, QPFs were interpolated to match with the local 6 h QPF. Model QPF from the beginning of 2012 to the end of 2017 had been extracted. Data of the first two years formed the training set to establish the initial conversion schemes between the model QPF and the observed precipitation. Data of the remaining four years constituted the verification set for the two calibration methods. In operation, the Hong Kong Observatory verifies precipitation forecasts through the precipitation averaged over seven specific rain-gauge stations in Hong Kong (Figure 1) to represent the intensity of precipitation over the territory [27], which is denoted by forecast verification (FCV) precipitation hereafter. The Direct Model Output (DMO) QPF is defined as the average of the interpolated precipitation of the seven locations, and these DMO values are calibrated against the total FCV precipitation within the concerned 6 h forecast period.

2.1. The f-t Conversion

The two different methods of calibration applied to DMO forecasts share the same concept of frequency-matching: the QPFs should be adjusted to the values of past observations of the same cumulative frequencies. Both conversion schemes utilized past forecast ( F ) and observation ( T ) data to construct a conversion table with pairs of DMO values ( f i ) and calibrated values ( t i ), where i = 0, 1, 2, …, n. Table 1 shows an example of such f-t conversion table. The two calibration schemes differ in the initialization and the update of such conversion table.
Here, we first describe the general initialization and usage of the conversion table that both schemes have in common. During the initialization, in the training set, all 6 h model QPFs available at lead times 6, 12, 18, 24 and 30 h from a specific model were used to construct the initial cumulative distribution of forecast precipitation of that model, while all 6 h accumulated FCV precipitation records were extracted for the cumulative distribution of observed precipitation. To avoid the possibility that zero-forecast precipitation would correspond to a non-zero calibrated precipitation or vice versa, the conversion table must start from ( f 0 , t 0 ) = ( 0 , 0 ) . Both ti and fi values were arranged in ascending order and joined in the f-t conversion table, so that the cumulative frequency of fi and ti within the time window would match (in the Adaptive Table method, this f-t table was further processed and replaced by sampling itself at selected values, which will be described in greater detail in the next subsection).
When carrying out a calibration using the f-t conversion table, it would be highly likely that a DMO value f does not fall upon any value of f i , therefore, a multiplication factor M was introduced such that the calibrated forecast t = f × M . The calibrated value t is based on the linear interpolation of M from ( f i , t i ) and ( f i + 1 , t i + 1 ) pairs with respect to f , where f i f f i + 1 . If f > f n , then ( f , t ) is extrapolated based on the ratio of f n and t n . In summary, M is defined as follows:
= { f f 1 × t 1 f 1   ,     for   0 f < f 1 t i f i + ( t i + 1 f i + 1 t i f i ) × f f i f i + 1 f i   ,     for   f i f f i + 1 < f n t n f n   ,     for   f f n
After the initial f-t conversion schemes were established, the experiment ran through the verification set chronologically. The calibration was dynamical as the conversion schemes were updated whenever new pairs of forecast and observed precipitation become available, so that the schemes can better reflect recent model performances. The two methods of updating the conversion schemes are described in the following subsections.

2.2. The Adaptive Table Method

The Adaptive Table method [26] adjusts the conversion table whenever the newly available pair of observation T new and forecast F new does not fall on or between pairs of ( f i , t i ) and ( f i + 1 , t i + 1 ) . The values of t i are fixed throughout the experiment in this method and their counterparts f i are allowed to fluctuate. The set of t i was selected as follows: every 0.1 mm from 0 to 0.5 mm, every 0.5 mm from 0.5 to 5 mm, every 1 mm from 5 to 10 mm, every 5 mm from 10 to 20 mm and every 10 mm from 20 to 60 mm. Observed rainfall of over 60 mm in 6 h is extreme and cumulative statistics may not be representative, hence extrapolation by M = t n / f n , as mentioned in the previous subsection, was applied when t i > 60 . To start with a f-t table with such t i values, the f i values are obtained by simple linear interpolation at those t i values between the f-t pairs from the full f-t table containing all the sorted forecast and observation values in the training set. In the update, for each calibrated value t i lower (higher) than T new , but with the corresponding DMO value f i higher (lower) than F new , the corresponding DMO value f i is decreased (increased) by the adaptation speed parameter α . If we denote ( f i , t i ) at time τ to be ( f i τ , t i τ ) , the adaptation can be mathematically expressed as:
f i τ + 1 = { f i τ × ( 1 + α )   ,     if   t i τ > T new   and   f i τ   < F new . f i τ × ( 1 α )   ,     if   t i τ < T new   and   f i τ   > F new . f i τ   ,     otherwise .
The conversion table is brought closer to the latest ( F new ,   T new ) pairs, so that it can adapt to recent model changes in precipitation bias. The update of the conversion table is based on the 6 h accumulated precipitation at lead time of 12 h (T + 12), as the models take several forecast hours to spin up fine-resolution features from the initial conditions [27]. In case the T + 12 QPF is not available due to the missing outputs from the model runs, T + 18 will be used instead. The adaptation speed parameter, α , controls how fast the conversion table adapts to model changes. The values of α have to be selected with care as it is the core to determine how well the calibration scheme accommodates itself towards the change of model behavior. If α is too small, the adaptation is basically inert, however, if α is too large, the values of f i will be unstable, especially when a miss or false alarm triggers adaptation of a reasonably large domain of t i . Li et al. [27] suggested that α = 1 % would be an adequate adaptation parameter for short-range QPF in the region of Hong Kong and this value is applied in this study.

2.3. The Sliding Window Method

The Sliding Window method updates the conversion table using the most recent pool of data with a constant temporal span, i.e., a sliding window. In this study, the table is updated before every set of calibration is done, by reconstructing it with 6 h DMO QPFs ( F ) and FCVs ( T ) at all the 5 specified lead times from the most recent two years, i.e., using a two-year time window. Unlike the Adaptive Table method, the values of t i are not selected in advance. The duration of two years was chosen to cater for inter-annual variations. On the one hand, if the time window is too long, models would have already gone through a number of updates over a longer period. On the other hand, windows of shorter periods would provide insufficient data points for calibration, especially for high rainfall values. Calibration using a one-year time window would also be too dependent on the behavior and performance of the models in that year. The cumulative frequencies of DMO and observed values are directly matched to avoid arbitrariness of t i . In other words, the f-t table used in calibration is exactly the full f-t table constituting of all forecasts and observations in the past two years. As both DMO and observed precipitation are discrete datasets, the difference between t i and t i + 1 will be quite large over high rainfall intensities, so interpolation based on the multiplication factor is still necessary.

2.4. Verification Metrics

To determine the effectiveness of DMO and calibrated forecast, model performances on actual precipitation events with different intensities were evaluated. In particular, the effectiveness of calibration was verified with thresholds of 6 h accumulated precipitation above 10, 20 and 30 mm, respectively. Based on the 2 × 2 contingency table of observed and forecast events in Table 2, the verification metrics of Probability of Detection (POD), False Alarm Ratio (FAR), Critical Success Index (CSI) and Frequency Bias (FB) [28,29] are defined as:
POD = a a + c
FAR = b a + b
CSI = a a + b + c
FB = a + b a + c
Wilks [29] suggested several attributes to measure the quality of forecasts, such as accuracy, bias, reliability, resolution, discrimination and sharpness, and there are various classes of verification metrics to address these attributes. CSI is the percentage of hits among all predicted or observed events and would address accuracy. POD is the percentage of successfully forecasted events out of all the observed events and would address discrimination. Higher CSI and POD imply a better forecast, and CSI is a more essential metric for a successful forecast because a high CSI means both false alarms and misses are minimized in the denominator. In contrast, FAR indicates the percentage of an event not happening although the forecast predicted it to happen, so a lower value is preferred. It addresses reliability and resolution. FB is the ratio of the frequency of predicted events over that of observed events, indicating whether the forecast system has an overall bias of over- or under-estimating the frequency. The calibrated QPF is expected to have a FB close to 1 as the conversion table matches the frequency of observed events and forecast events. A Q-Q plot [25] will also be presented to show that the frequency-matching methods could successfully solve the problem of systematic bias, and a box-and-whisker plot of errors conditioned on observations will show the improvement of discrimination and accuracy over different rainfall intensities. The majority of the statistical analyses and visualization were performed with the package “ggplot2” in R, while some of the graphs were produced using Microsoft Excel and PowerPoint.

3. Results and Discussion

3.1. The Stability of the Calibration Methods

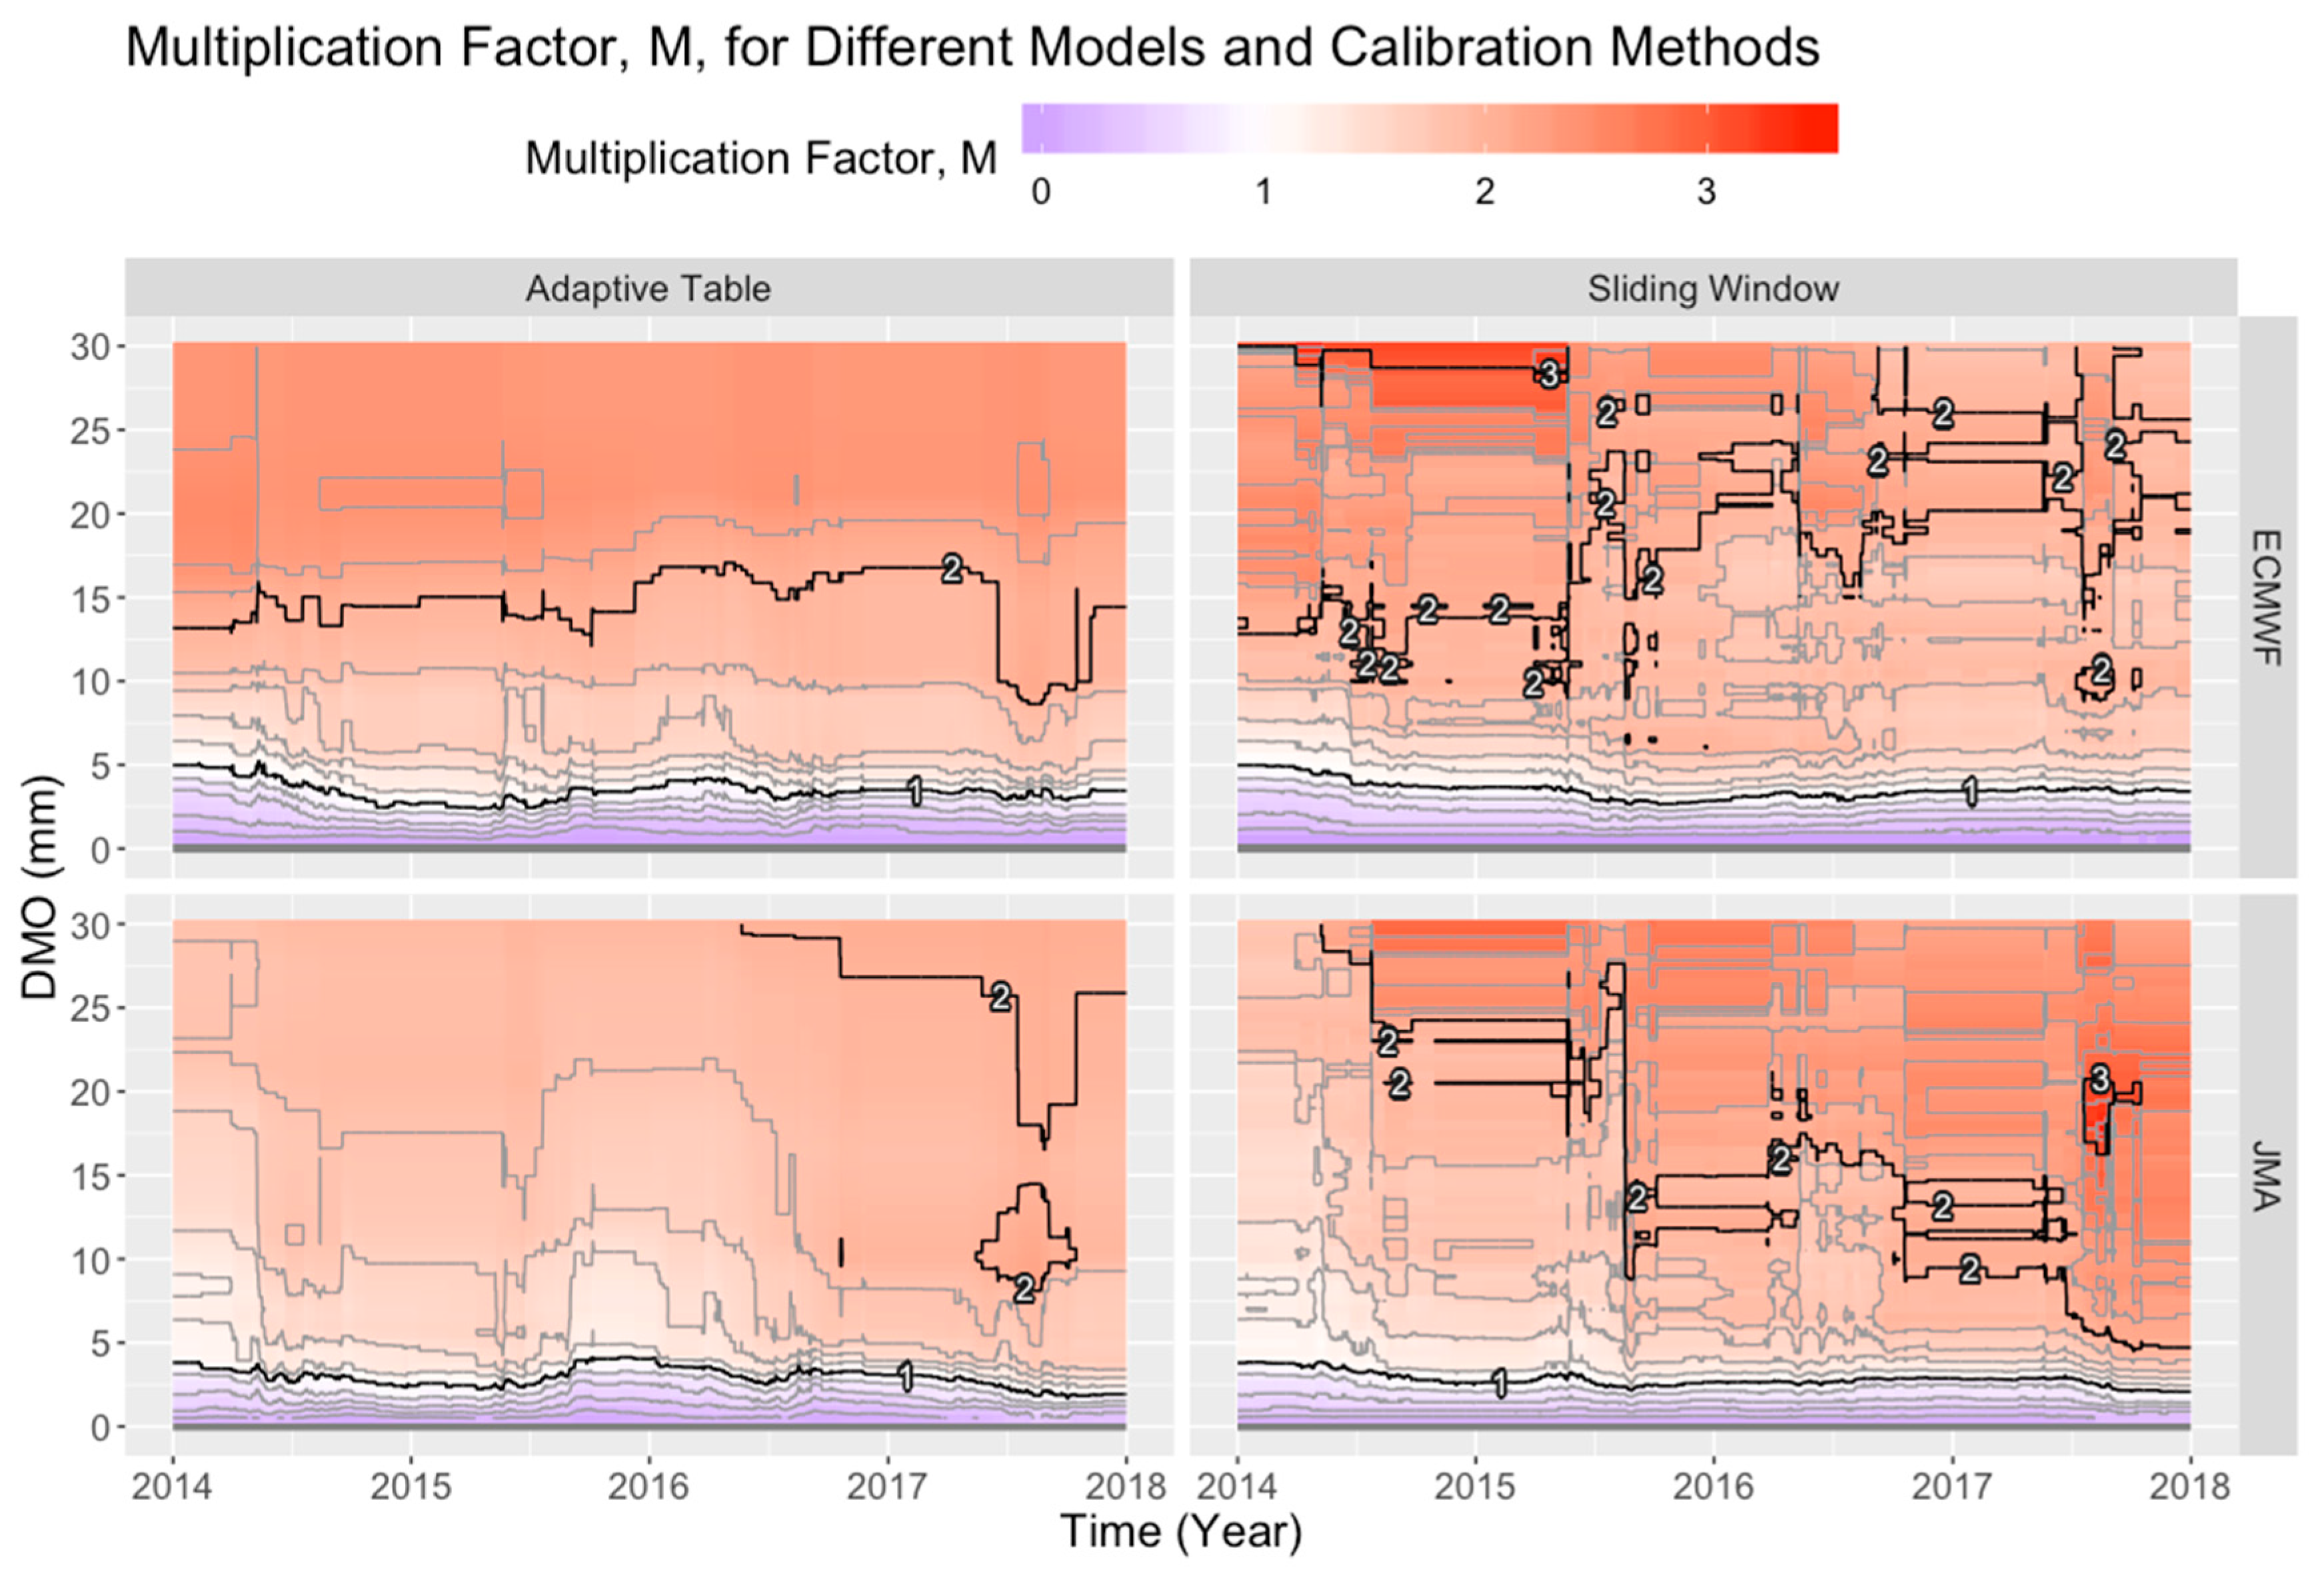
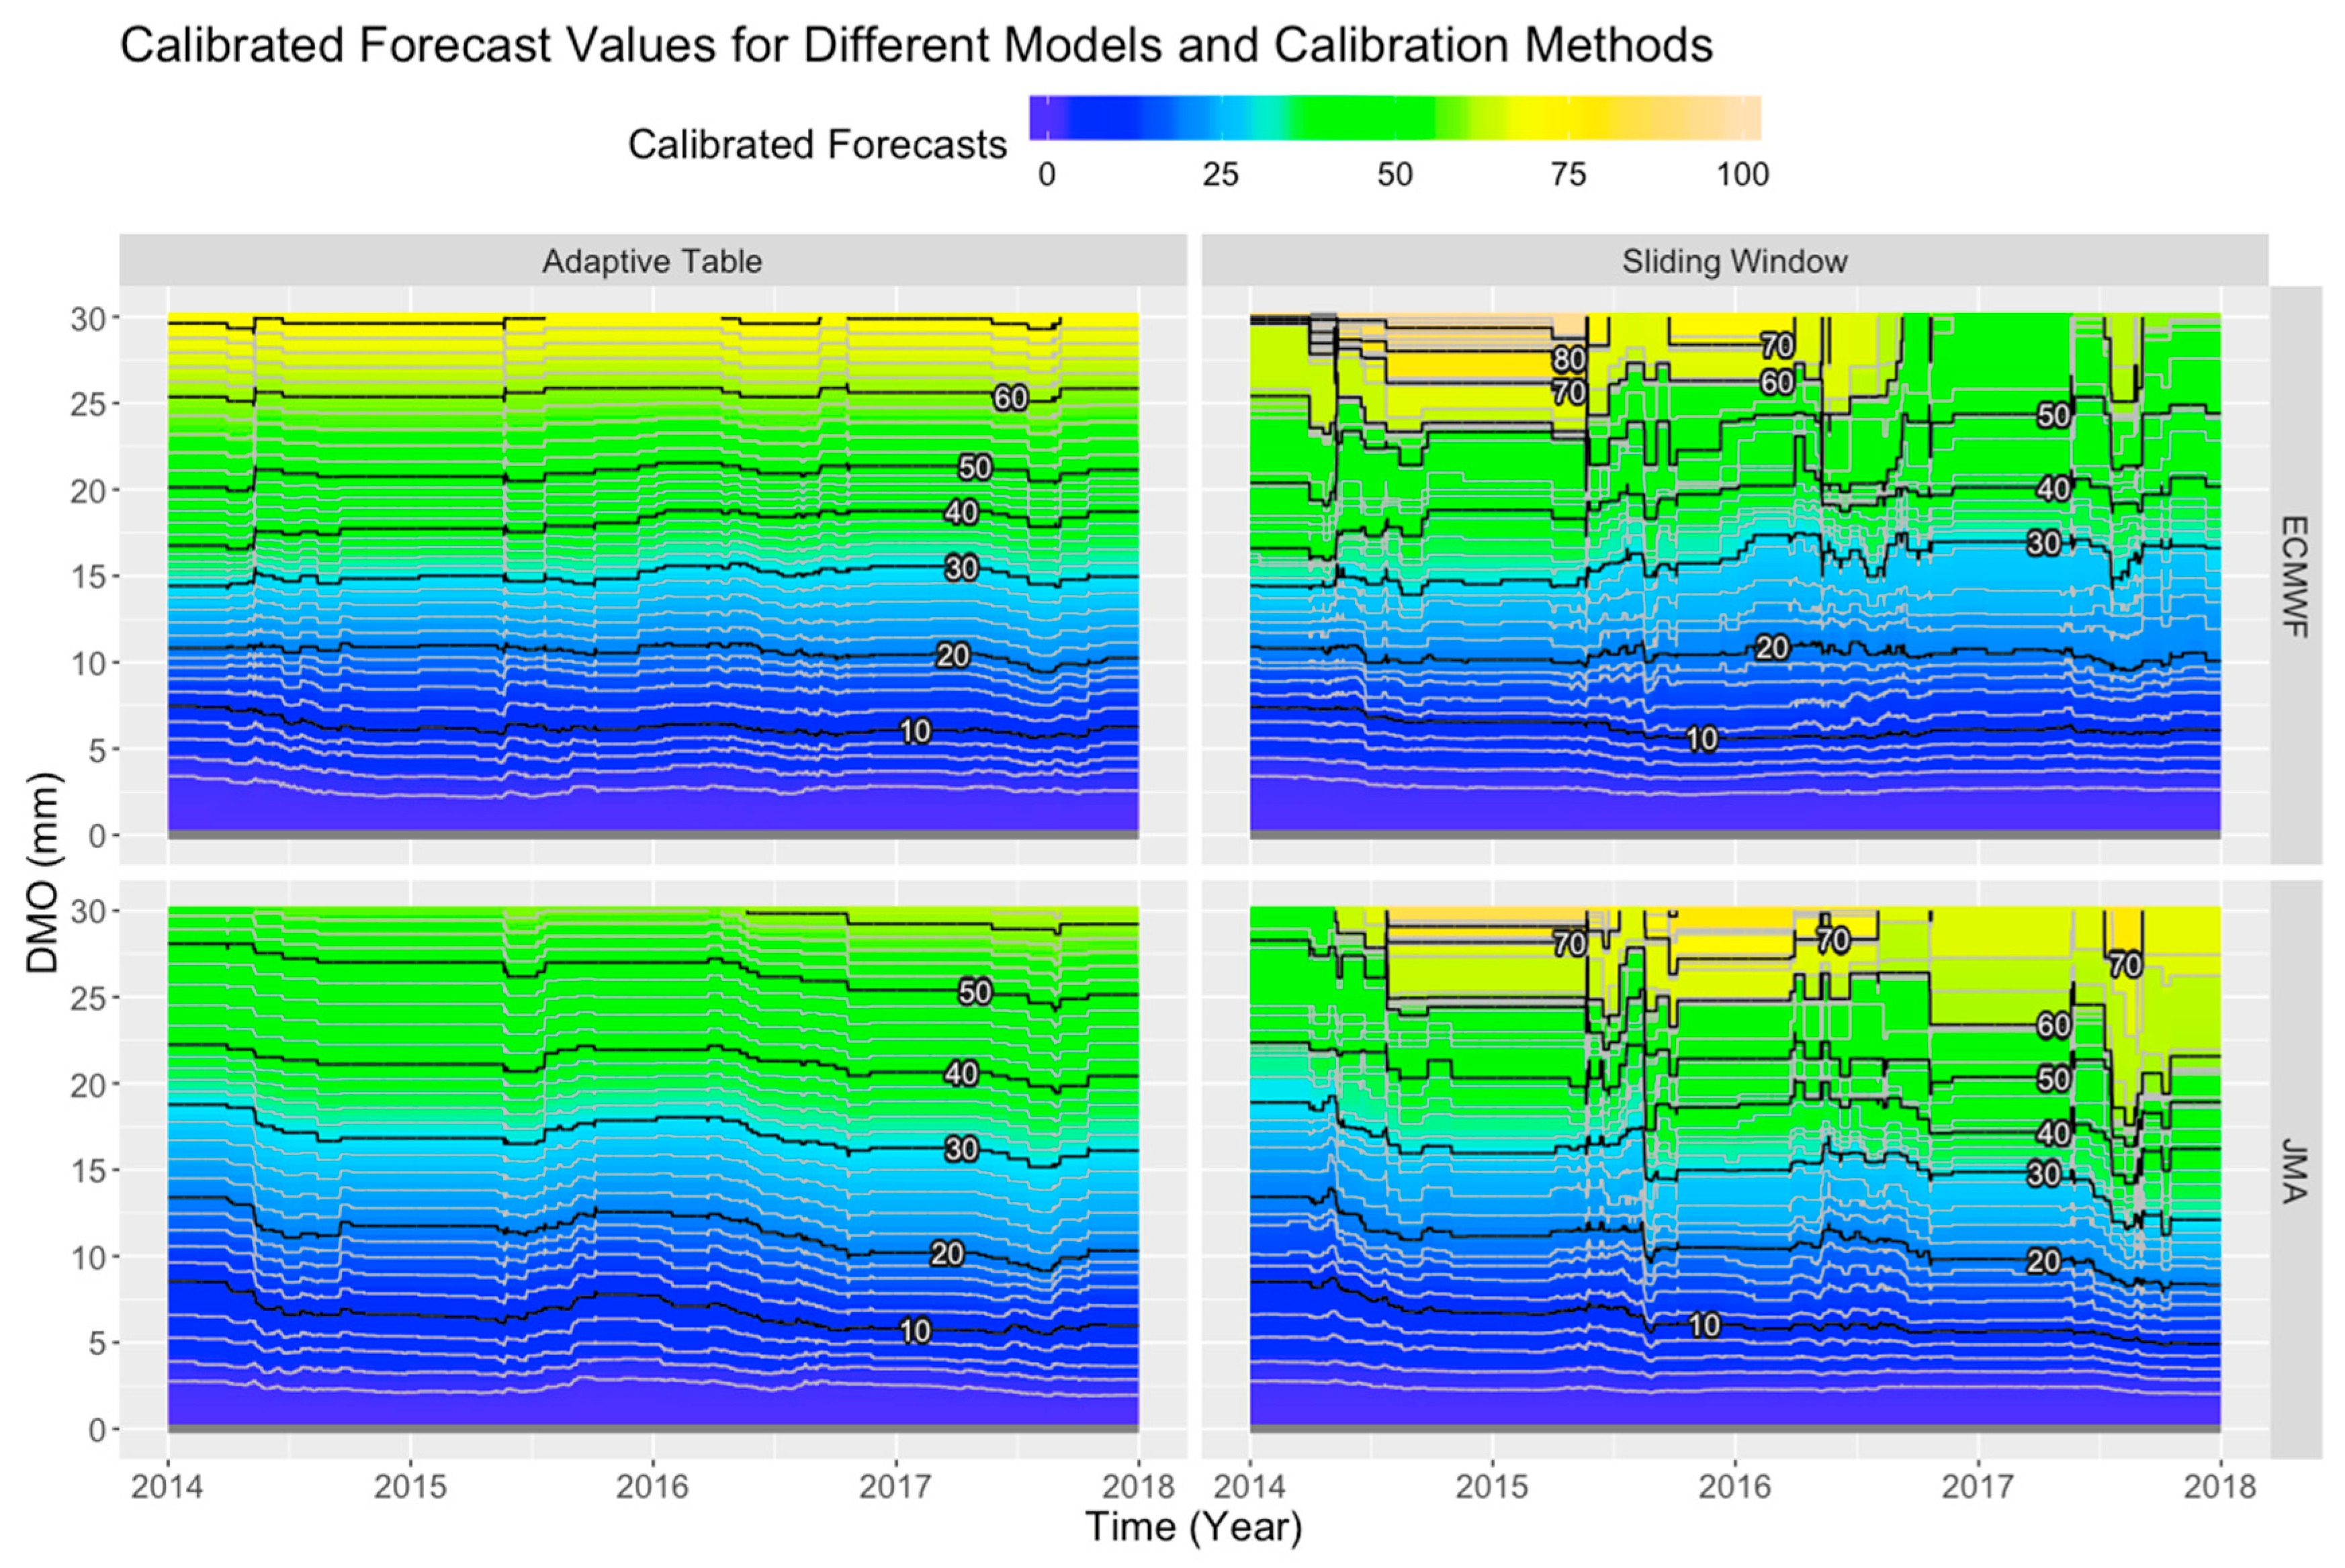
We first examine the stability of both calibration methods, i.e., whether the calibrated forecasts would fluctuate too much. The multiplication factor, M, along with the calibrated forecasts of ECMWF and JMA by both calibration methods across time are shown in Figure 2 and Figure 3. In Figure 2, the black contour lying over the white region represents a multiplication factor of 1, meaning that the DMO value remained unchanged during calibration, and it fluctuated between DMO values of about 2 to 5 mm. Below that value, the frequency was overestimated by the model and therefore the DMO forecasts were adjusted downwards, and vice versa. Looking across time for both figures, we see that both schemes tended to be more stable during the winter than the summer, as most of the extreme rainfall events occur in the summer. Events with observation ≥ 30 mm only occurred from mid-March to late October during the verification period, whereas events with lower intensity occurred over the whole course of the year, but with higher density around the summer.
The fluctuations in the Sliding Window method were found to be much greater than the other method, as depicted in Figure 2 and Figure 3. The Sliding Window calibration scheme would include or exclude extreme events whenever they enter or exit the sliding window from time to time and “fully adapt” to them all of a sudden, whereas the Adaptive Table scheme has an adaptation speed parameter α, which fixes the rate of change, disregarding the extent of over- or under-estimation. The discrepancy between the two calibration schemes became significant for JMA towards the end of the period, as seen in Figure 3, whereas the discrepancy for ECMWF was much less obvious.

3.2. The Behavior of Updates in the Sliding Window Method

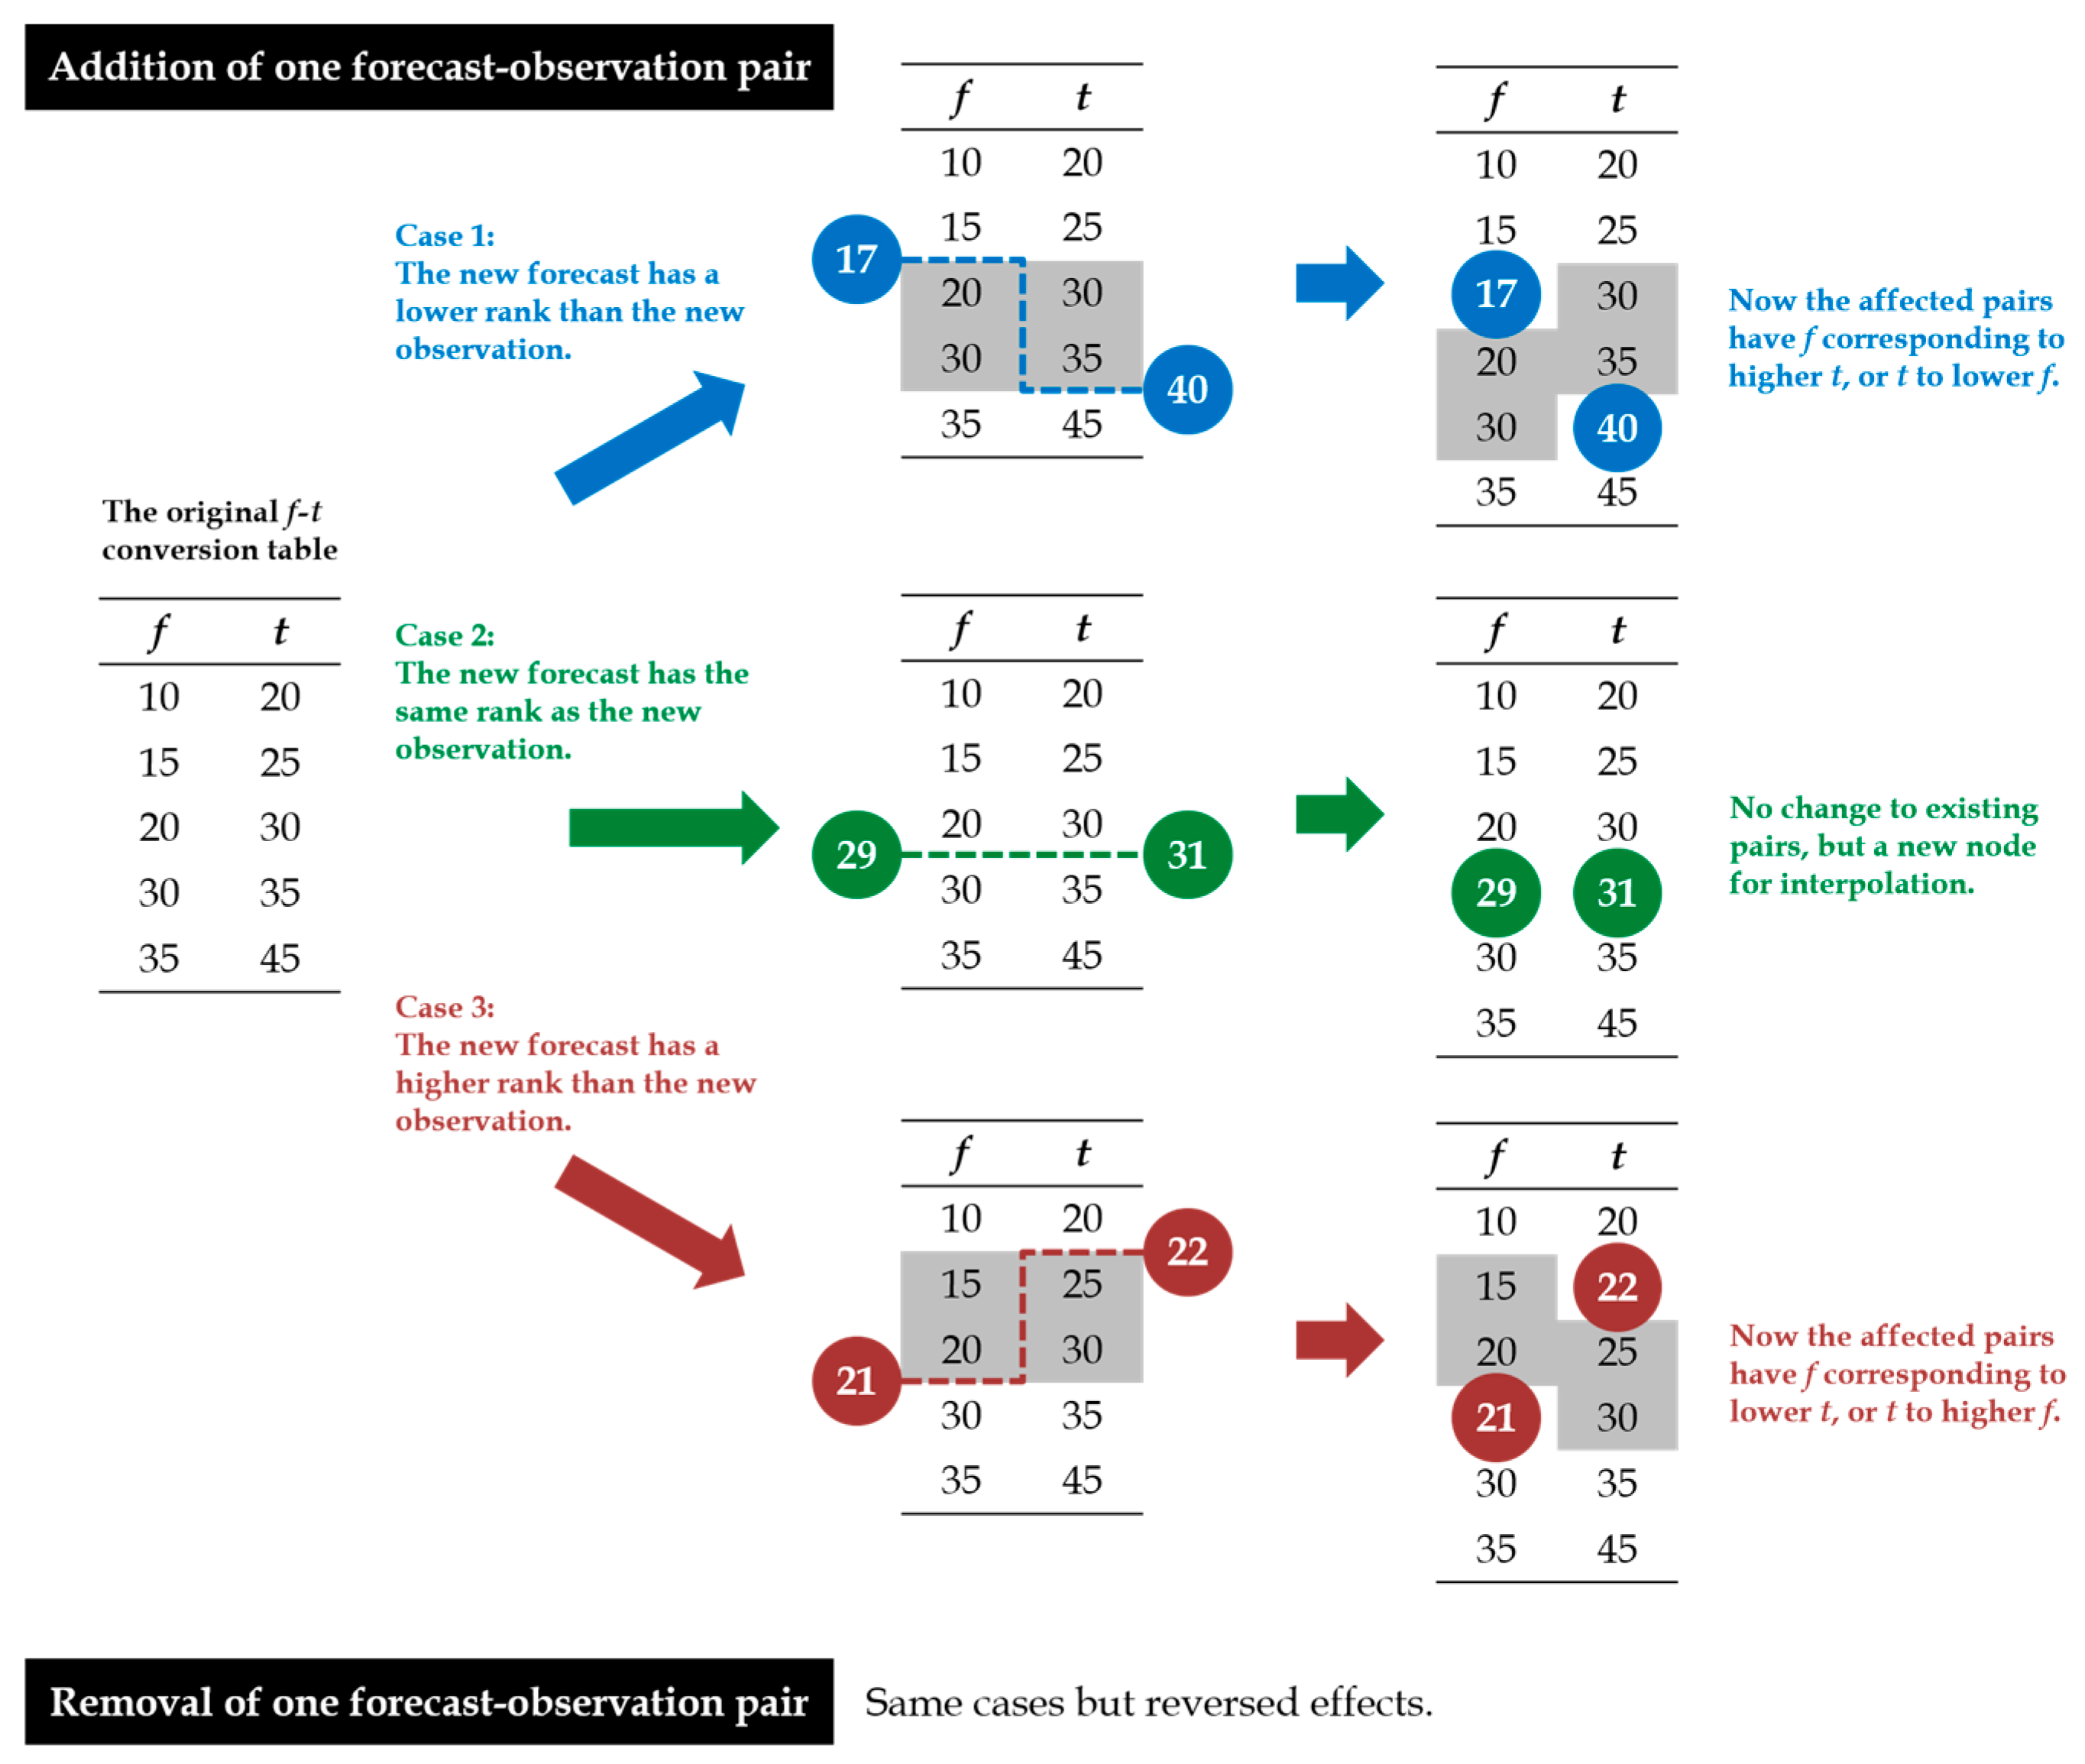
A more detailed discussion for the effects of update in the Sliding Window method is given here. As the data window slides through time as time proceeds, new forecast-observation pairs are included, and some old ones are excluded. For simplicity, let us first consider just an addition of one forecast–observation pair. Its effect on the f-t table could be categorized into 3 cases, as shown in Figure 4. In Case 1, the new forecast has a lower rank on the existing f list than the new observation does on the existing t list. In Case 3, it is the other way round, whereas in Case 2, both have the same rank. Note that the separation of these cases is based on the difference in ranks in f and t lists, but not whether the new forecast–observation pair itself is an under- or over-estimation. This is illustrated in the example of Case 3 in Figure 4. However, in general, the cases do imply whether the new forecast would be an under- or over-estimation after calibration with the existing f-t conversion table (for Case 2, ignoring the possibility of under- or over-estimation brought by interpolation between f-t pairs). In Case 1 (Case 3), the calibrated forecast would still be an underestimation (overestimation) under the existing conversion. After addition of the new pair and re-ranking of the f and t lists, the original f-t pairs of ranks between the new forecast and observation (shaded in grey in Figure 4, termed “affected pairs” hereafter) now have new partners and form new f-t pairs that relieve the under- or over-estimation reflected by the new forecast–observation pair. In Case 2, the re-ranking does not cause changes in the original f-t pairs, but the new forecast–observation pair serves as a new f-t pair, a new node for interpolation, so that the updated f-t table could bring future conversions closer to the new pair. For removal of an old forecast–observation pair, its effect would simply be the reverse of an addition of it.
In the Sliding Window method, the magnitude of change in calibrated values, instead of being invariant as in the Adaptive Table method, depends on the density of f and t values near the affected pairs. Inclusion or exclusion of a forecast–observation pair would cause a shift of ranks, and then new pairings of f and t would be established by matching their new ranks. The new counterparts for the f and t values in the affected pairs would be one rank higher or lower than their old counterparts or would be the newly included forecast or observation values. If the density were low, the rainfall amounts would differ a lot between neighboring values. In such case, the f-t conversion would change greatly over the range of the affected pairs, and, due to the interpolation of the multiplication factor, the effect on the actual calibration would spread to the f-t pair one rank upwards and downwards from the affected pairs. Since extreme values of rainfall always set over low-density regions of f and t, M fluctuates more significantly at high rainfall values. Smoothing of M could be a solution to increase the stability of M, but this would sacrifice the instant reflection of f-t correspondence at high rainfall values within the sliding window, which is the concern of this study. Also, the concept of gradual change in f-t correspondence has already been implemented in the Adaptive Table method through the adaptation speed parameter.
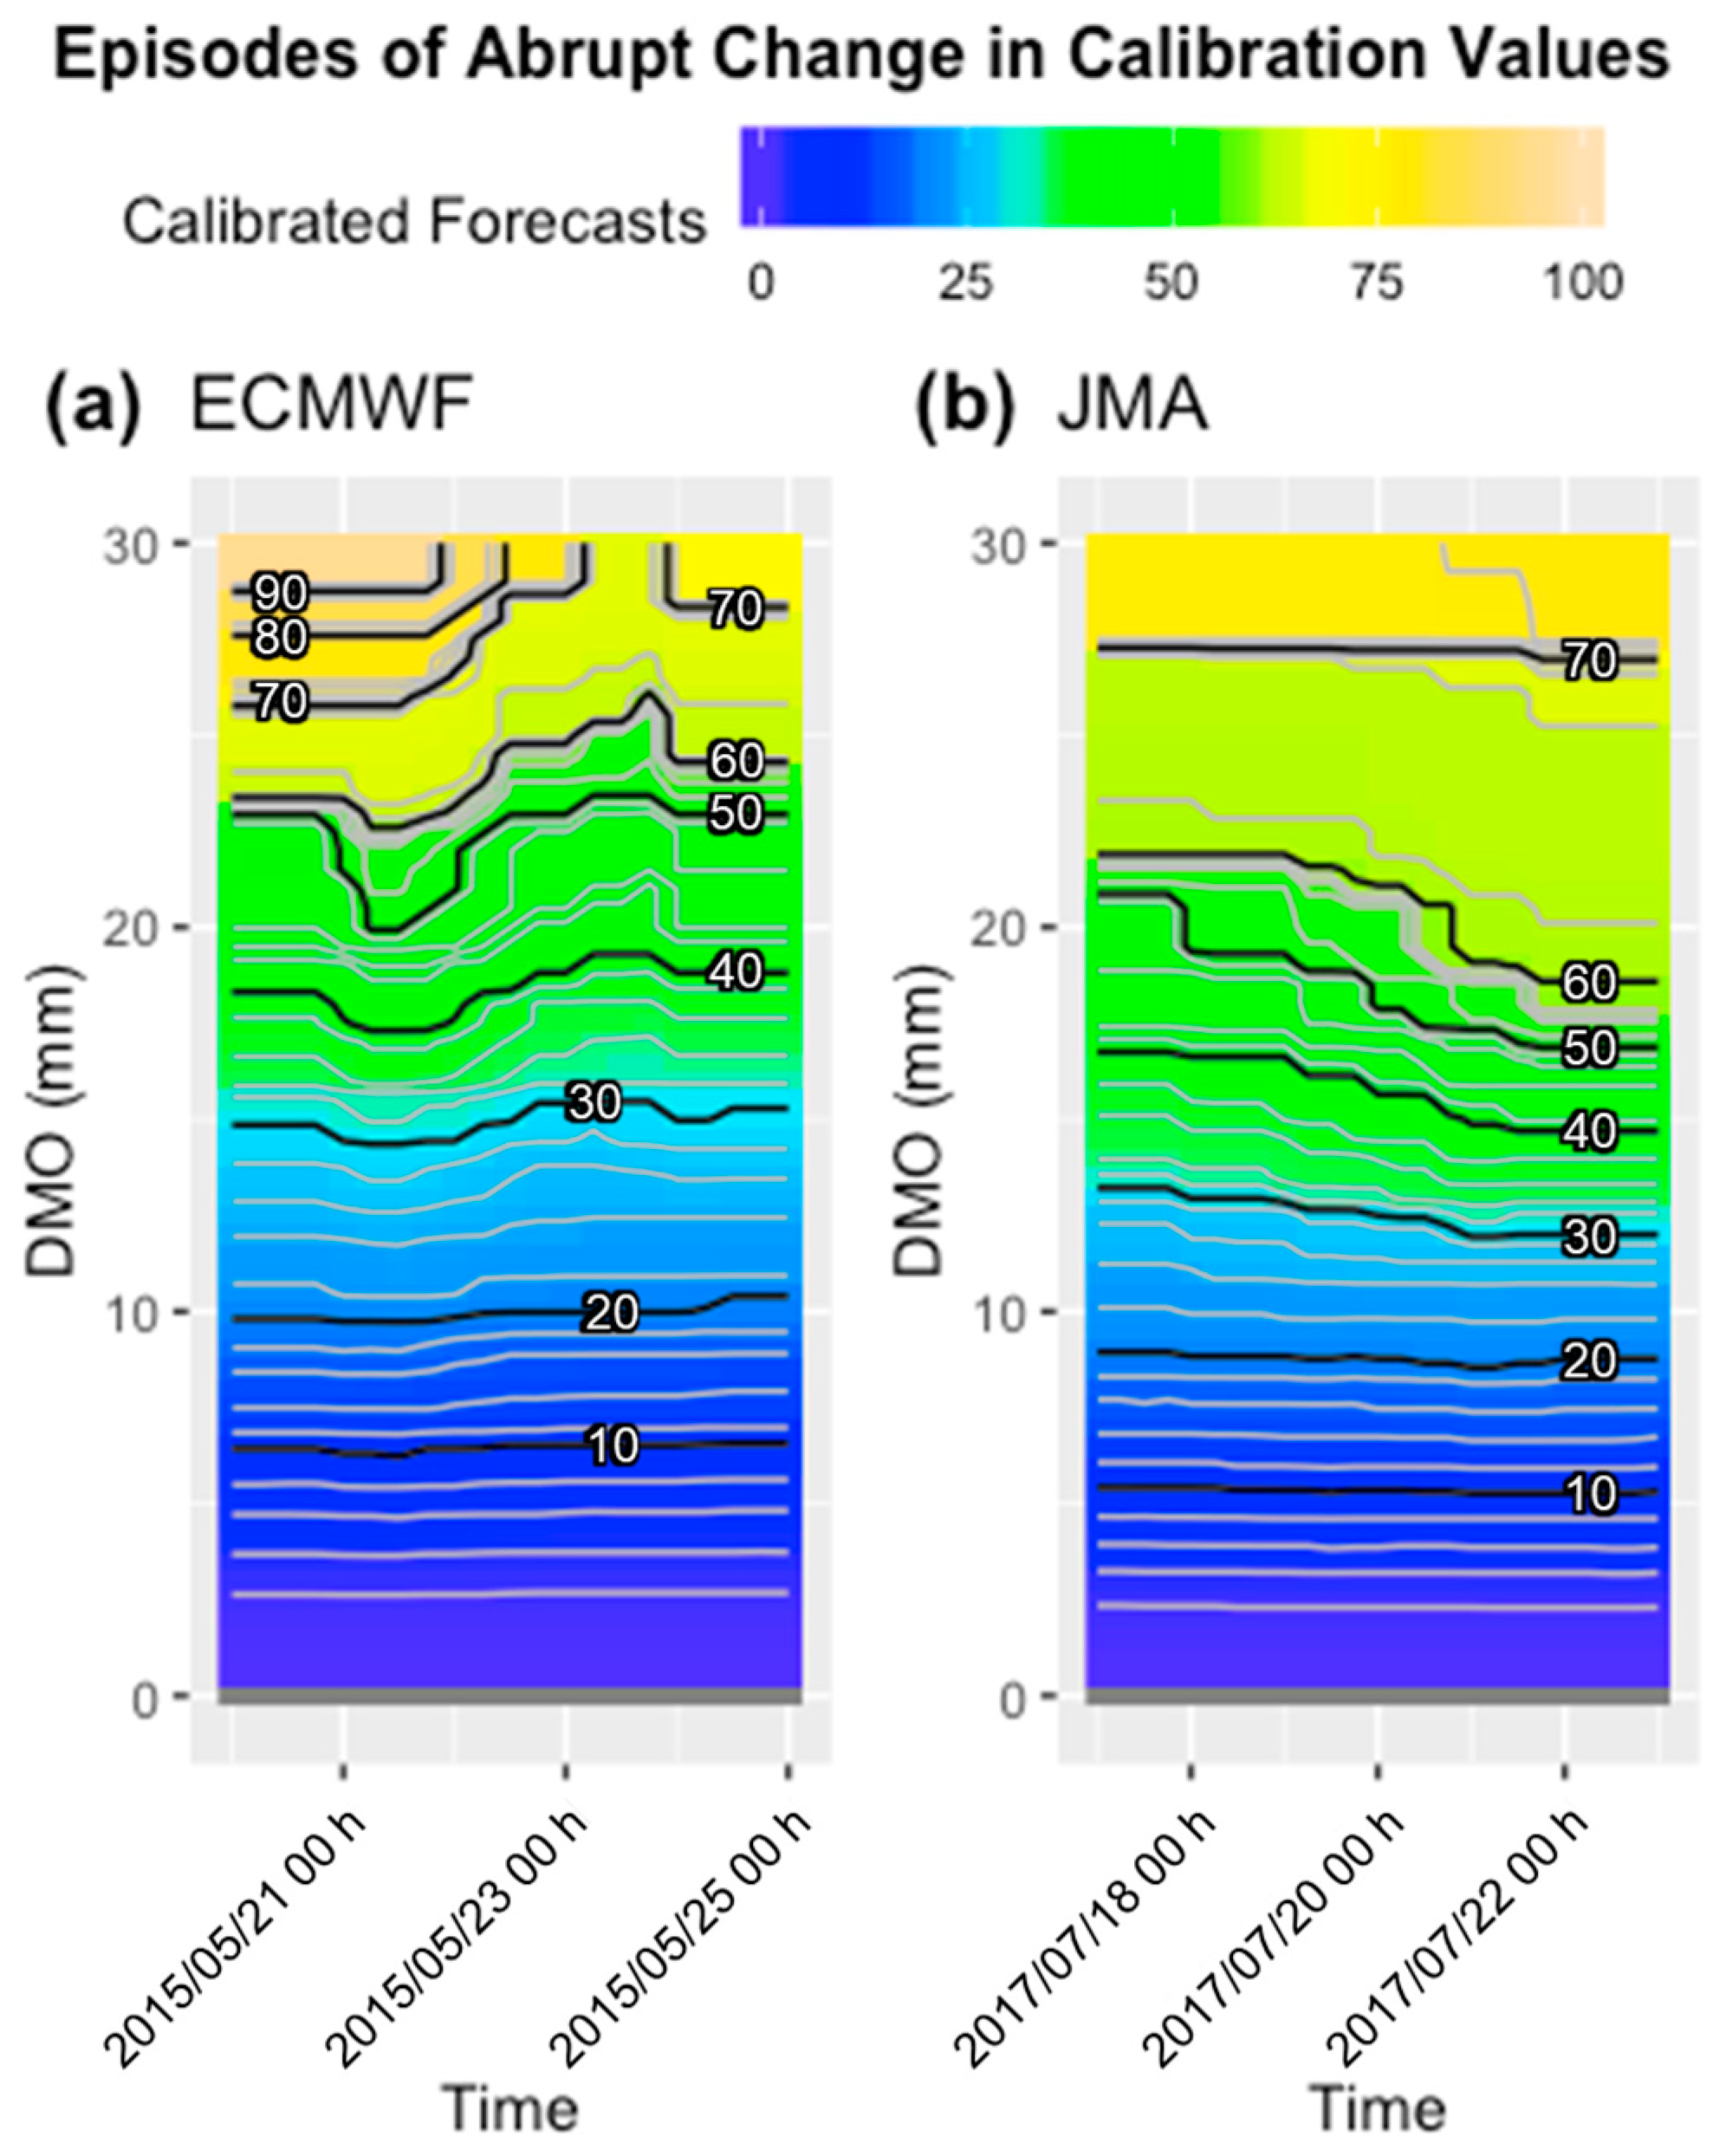
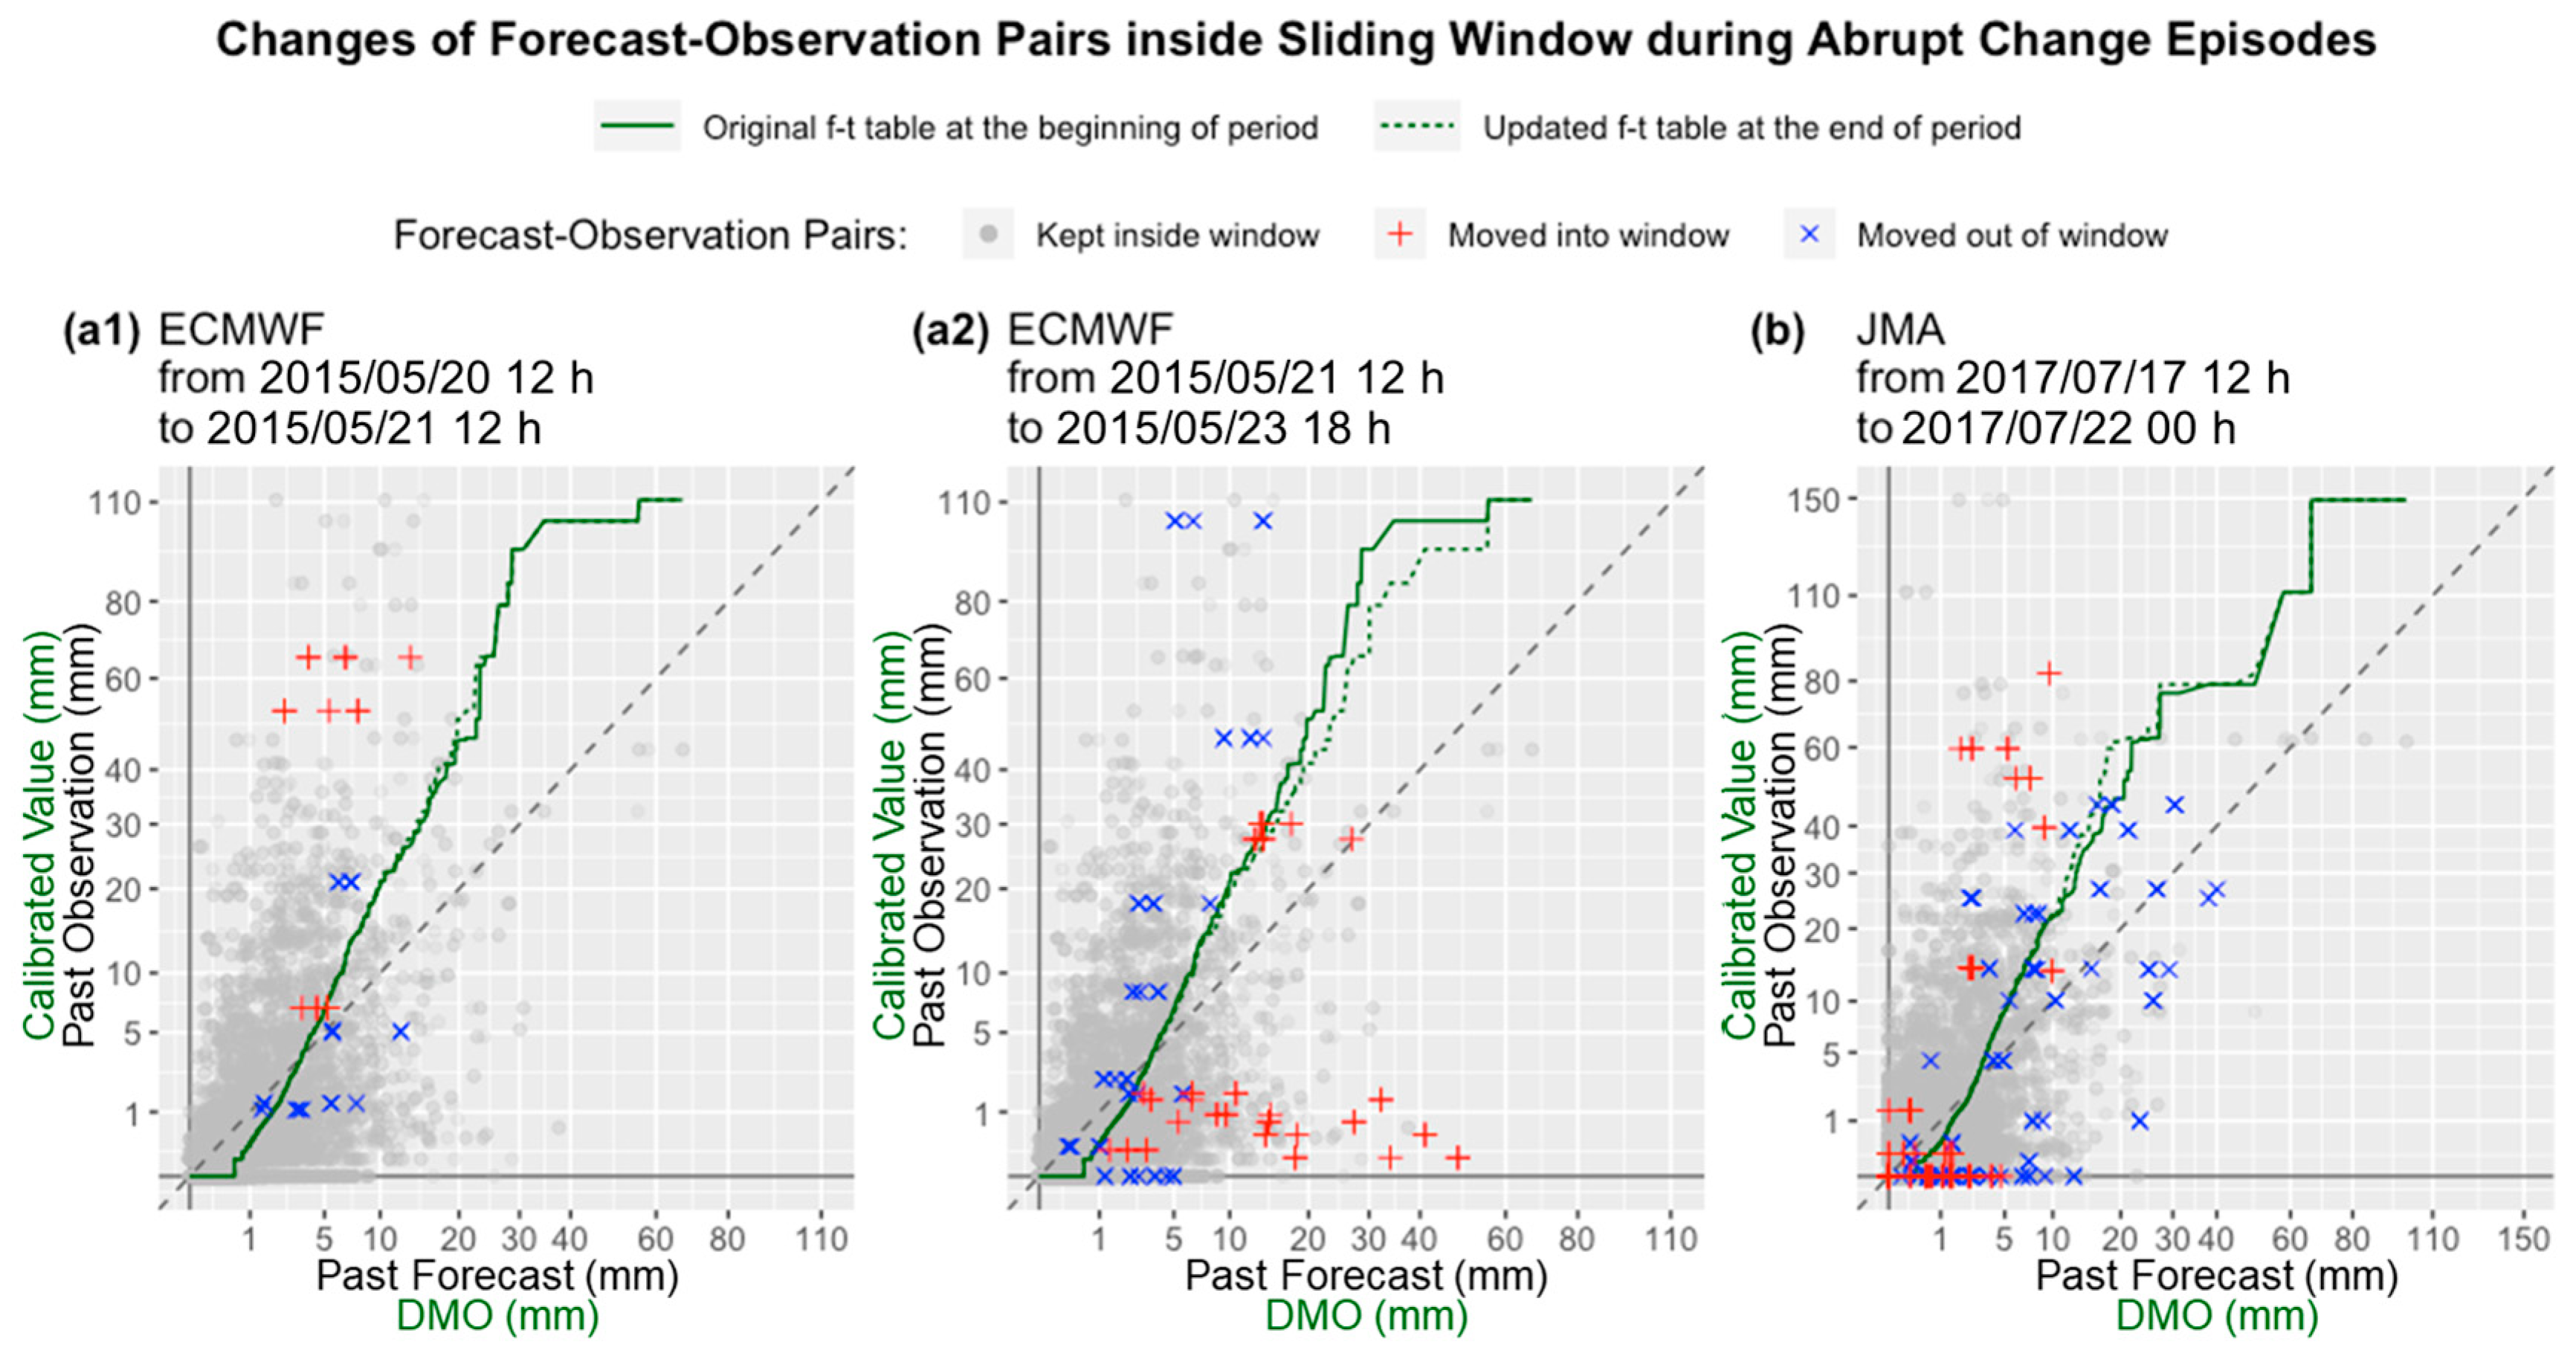
Over the whole course of this calibration experiment, the calibration values of the Sliding Window method for both ECWMF and JMA experienced several abrupt changes. Here, we investigate two episodes of such changes. Figure 5 shows the change in calibrated values against DMO and time during the episodes. Figure 6 shows the change in the f-t conversion table along with the forecast–observation pairs moved into, moved out of, or kept inside the sliding window meanwhile.
One episode is the calibration for ECMWF from 20 May 2015 12 h to 23 May 2015 18 h, as shown in Figure 5a, and is divided into two sub-periods in Figure 6a1,a2. The first sub-period corresponds to the increase in calibrated values between 20 May 12 h and 21 May 12 h (drop of contours), whereas the second one corresponds to the following decrease in calibrated values between 21 May 12 h and 23 May 18 h (rise of contours).
During the first sub-period, from Figure 6a1, we can see that almost all of the newly included pairs (red “+” markers) had their observations higher than the calibrated forecasts they would have under existing f-t conversion (the solid green line), meaning that they would still be underestimated even after the current calibration (Case 1 in Figure 4). On the other hand, the excluded pairs (blue “×” markers) had their observations more or less balanced on the two sides (reverse of both Case 1 and 3 in Figure 4). Therefore, calibrated values increase overall, as seen in Figure 5a, as the response. The minimum and maximum rainfall involved in the newly included or excluded pairs (red “+” or blue “×” markers) were about 1 mm, which was a forecast, and about 65 mm, which was an observation, respectively. Therefore, the change in calibrated values in Figure 5a during the first sub-period was confined to the region between around 1 mm of DMO (y-axis) and 65 mm of calibrated value (contours). Meanwhile, the contours of ≥70 mm remained unchanged, as none of the newly included or excluded pairs involved that range of intensity. It can also be seen that the drop in calibrated value contours of around 50 to 60 mm were greater. This could be related to the fact that f-t pairs were few over such a range of observed rainfall, as seen by the sparse grey dots in Figure 6a1, so a few new pairs of such observed rainfall intensity in the window would affect the calibrated values much greater than other ranges of them. In contrast, the change in calibrated value contours below around 20 mm were unobvious where the f-t pairs were densely situated.
During the decrease in calibrated values in the later sub-period, as shown in Figure 6a2, significant under-forecasts with observed rainfall as high as about 105 mm moved out of the window (blue “×” markers), and significant over-forecasts with forecast rainfall as high as about 50 mm moved into the window (red “+” markers). It means that the scheme has forgone the previous underestimation and discovered a more recent overestimation (reverse of Case 1, and Case 3 as is in Figure 4), pulling down the calibrated values over all ranges of rainfall during the update of the scheme over this sub-period. Again, the calibration over high rainfall intensities was more greatly affected, as the sample size was smaller.
Another episode is the calibration for JMA from 17 July 2017 12 h to 22 July 2017 00 h, as shown in Figure 5b and Figure 6b. The calibrated values experienced increases (drop of contours) during the episode. The newly included pairs over the range of 40–80 mm observation, where t values were sparse, were all under-forecasts (Case 1 in Figure 4). Other newly included pairs had their forecast and observation located among dense f and t values, leading to little effect. The excluded pairs over sparse ranges of f and t values were mostly over-estimation over the range of 15–40 mm forecast, corresponding to 25–80 mm t values in the original f-t conversion table (reverse of Case 3 in Figure 4). Therefore, the update caused a decline in calibrated value contours of 25–80 mm, which means an increase of calibrated values with respect to unchanged DMO over the corresponding range. In Figure 5b, the increase was the most obvious over the range of around 40–64 mm calibrated values, as we can see in Figure 6b, that, over that range of 40–64 mm observation values plus the corresponding range of around 17–27 mm forecast values obtained from the original f-t table, the number of newly included pairs plus excluded pairs together (red “+” and blue “×” markers together) was comparable to the number of the pairs kept inside the window (grey dots).

3.3. Performance of the Calibration Methods in Terms of Percentage Errors

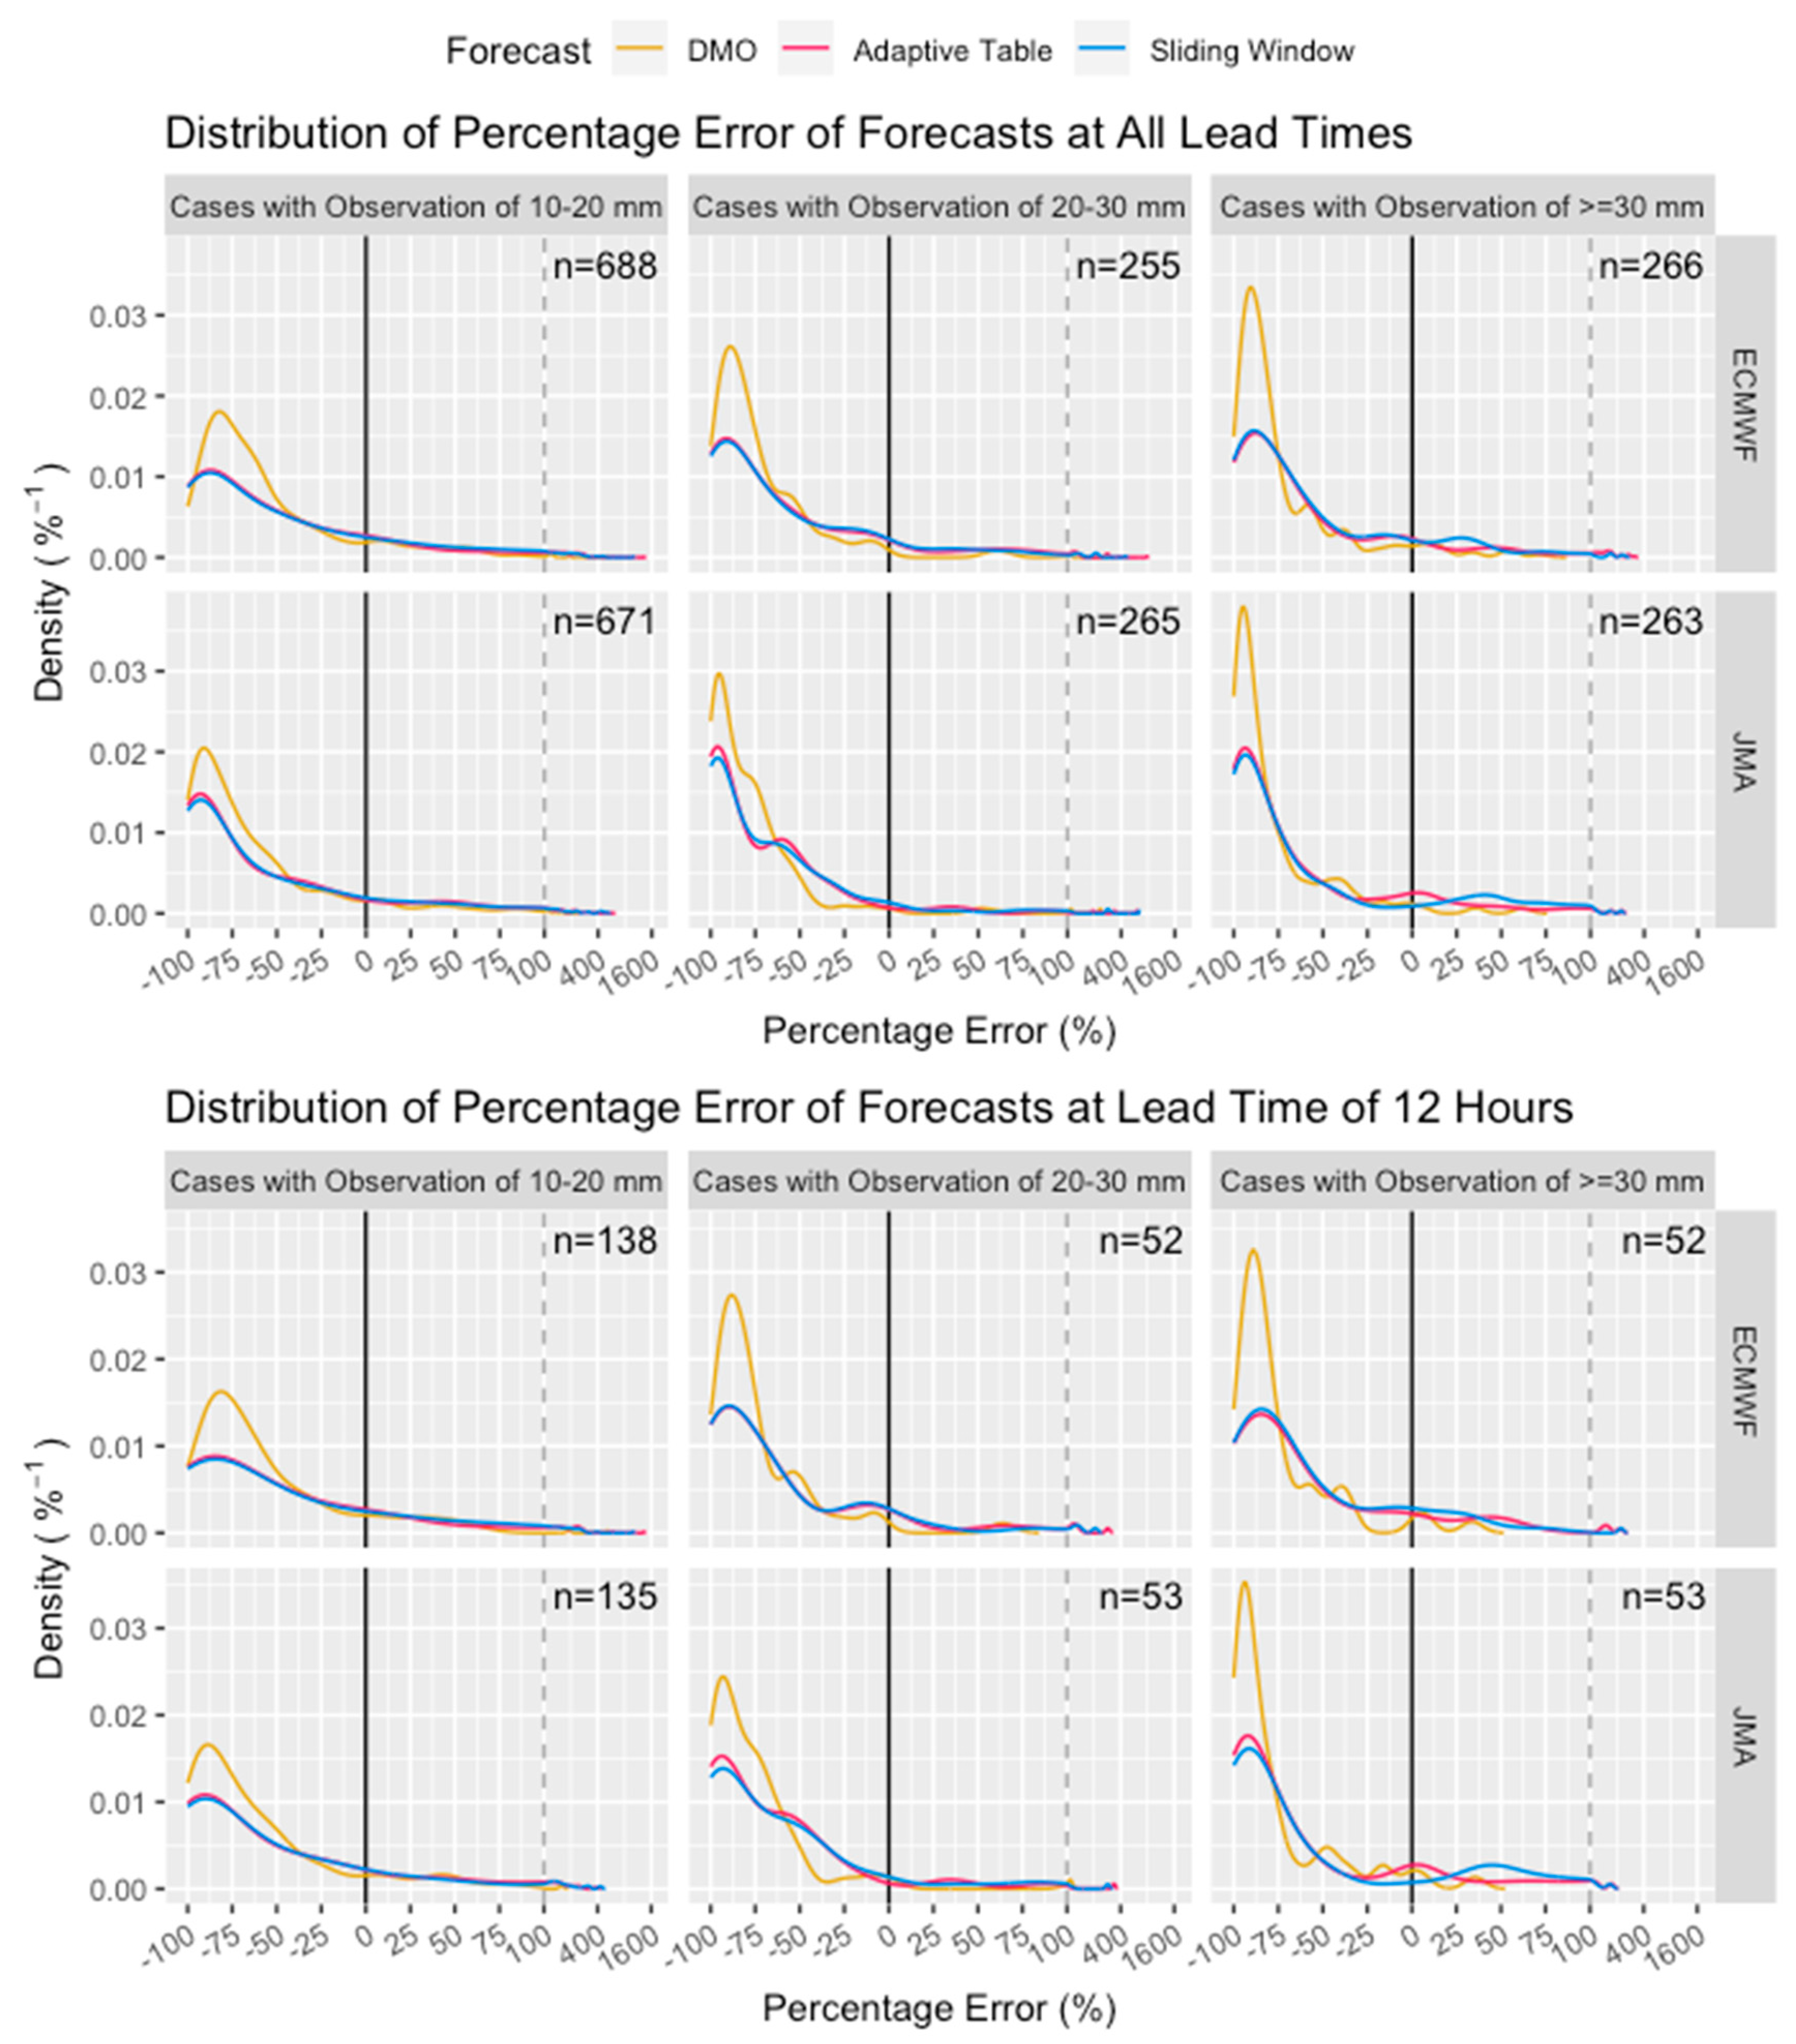
The calibrated forecasts of both calibration methods and models were verified. Figure 7 shows the density distribution of percentage errors of calibrated forecasts against the ground truth. As expected, there were significant underestimation biases over all three intensity categories of DMO from the two models. The bias increased with the rainfall intensity, while ECMWF had smaller biases than JMA in general. Both calibration methods were effective in reducing the underestimation peak, spreading it towards zero and positive errors, improving the accuracy of the forecasts. The reduction in the underestimation peak also increased with rainfall intensity. This means the methods managed to overcome the problem of underestimation and adjust DMO rainfall towards the expected amount of rainfall. Generally, the two calibration methods performed quite similarly, as it can be seen in Figure 7 that both curves have little separation. The Adaptive Table calibration gave higher density near-zero error and lower density over positive errors than the other, thus a better accuracy and an overall slightly better performance.
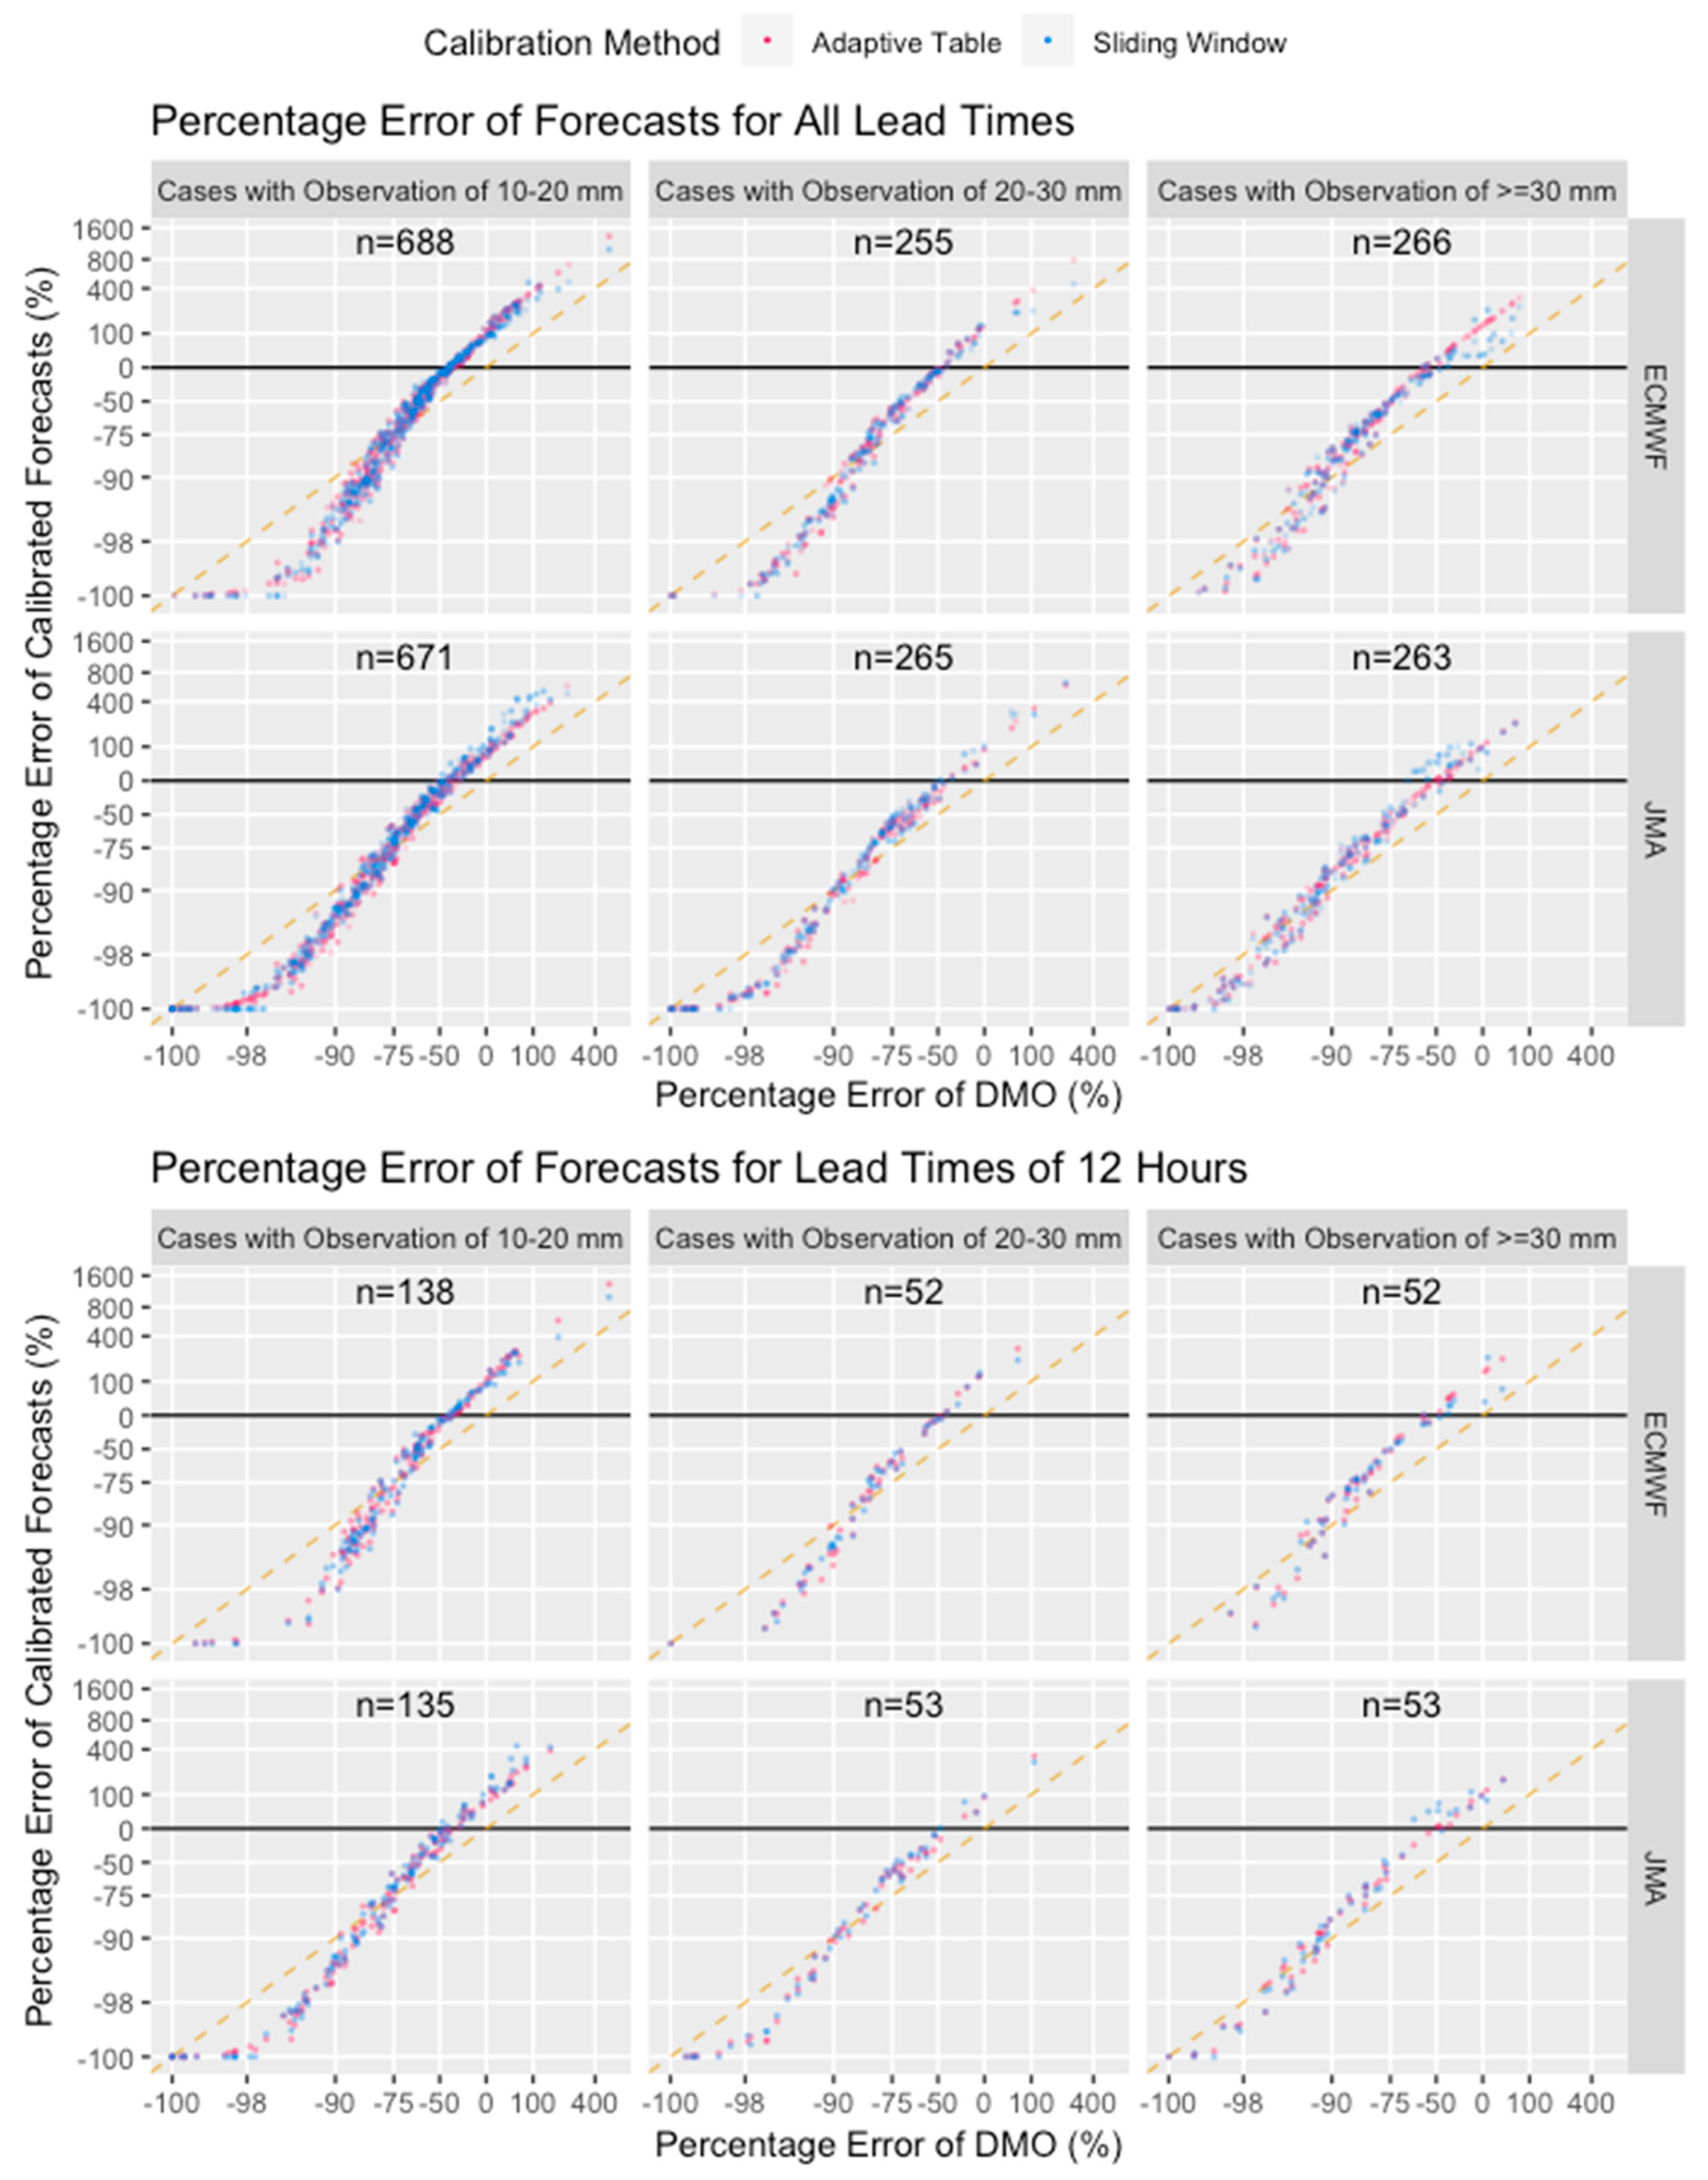
From Figure 8, we see that the percentage error of the calibrated forecasts was basically a function of the DMO percentage error, with little fluctuation due to the update of calibration schemes over time. Their relationship was virtually constant for all lead times over the whole period (only lead time of +12 h is shown in the figure), with such clear and obvious dependence of the percentage error of calibrated forecasts on their DMO counterpart as the calibration forecast generally stretches the forecast range. The performance of the calibrated forecasts ultimately depends on whether the models successfully capture the rainfall event. Such captured events are brought closer to the true amount of rainfall by the calibration schemes.
The calibration worked best when the DMO forecasts underestimated the actual rainfall by about half. The calibrated forecasts would then have nearly zero error. For cases with observations of 10–20 mm (20–30 mm, ≥30 mm), a DMO percentage error of around −75% (around −85%, around −95%) is the watershed of whether the forecasts were calibrated upwards or downwards. These percentages of different observation categories point to the same amount of rainfall, around 2 to 5 mm, which is where the contour of 1 lies in the graph of the multiplication factor (Figure 2). Note that the graph axis is in logarithmic scale, so the DMO range with worsened performance is actually small. For those worsened forecasts, their DMO were below 2 to 5 mm. In general, for such a small DMO, it could be said that the rain episode is not captured by the model to begin with. On the contrary, if a rain episode is successfully captured by the model, its DMO forecast would likely be greater than this intensity. It implies that calibration does improve such captured but underestimated rain episodes.
In general, the two calibration schemes showed little difference between themselves. There are only two observable differences among the two. For ECMWF cases with observation ≥ 30 mm, where the DMO percentage error was around zero, the Sliding Window method performed slightly better than the other with less overestimation. For JMA cases with observation ≥ 30 mm, where the DMO percentage error was around −50%, the Sliding Window method performed slightly worse than the other with more overestimation. Such discrepancies may be due to extreme rainfall cases, for which the sample size is small, and the calibration schemes fluctuate greater.

3.4. Performance of the Calibration Methods in Terms of Verification Metrics

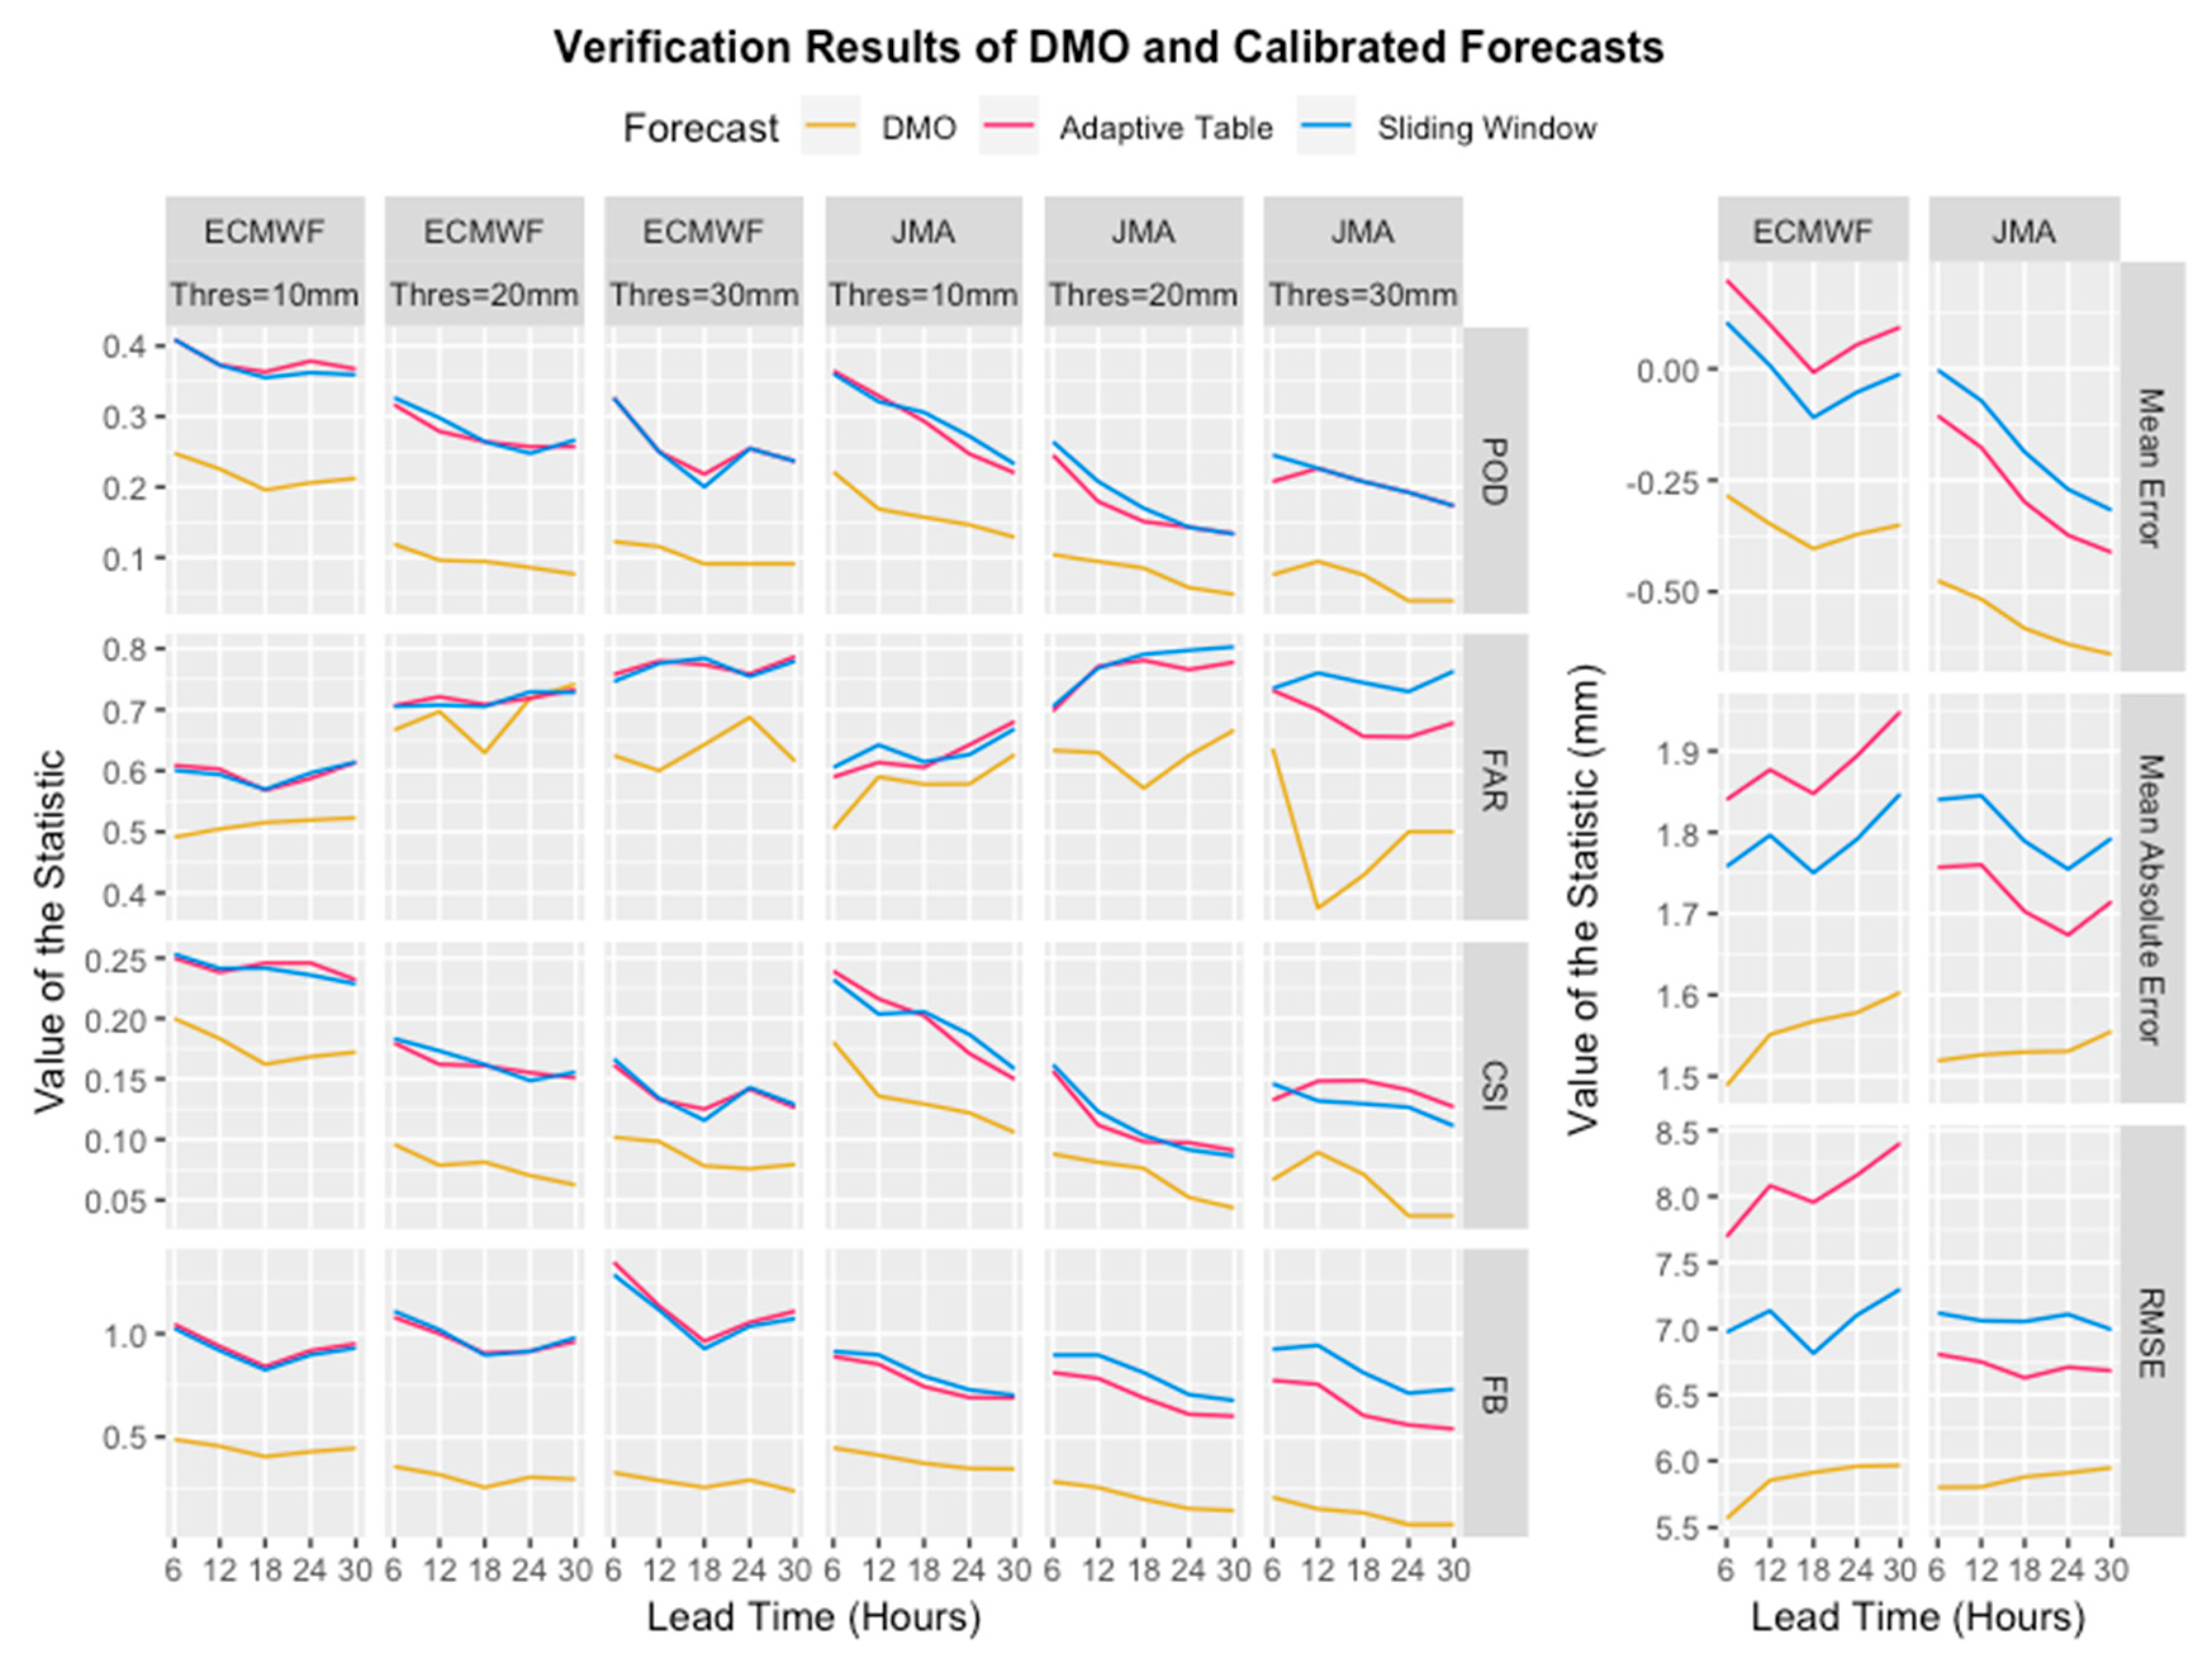
The performance of the calibration methods in terms of verification metrics is presented in Figure 9. Both calibration methods improved the forecasts in terms of all the metrics except the expected worsened FAR. Due to the nature of frequency-matching calibration, the forecasts over the intensity range of the thresholds of 10, 20 and 30 mm were calibrated upwards. As convective parameterization remained a challenging issue of model forecasts, models may not be able to capture the spatiotemporal occurrence of intense rainfall events accurately, so calibration would not improve the accuracy for those cases.
However, the POD, which is an indicator of how many over-threshold episodes were successfully forecasted, was greatly increased. POD is especially important from the operational perspective. Despite the fact that increasing it would likely simultaneously lead to an increase in FAR, a high POD while having an acceptable degree of over-warning (false alarms) is preferred over striking a perfect balance with misses, in order to avoid the socioeconomic losses caused by severe weather. The increased POD can serve as a great improvement in alerting forecasters for possible extreme rain episodes. Stretching the diminished range of rainfall in the model to the full range in reality can avoid the forecasters from having a false sense of weaker rainfall intensity during significant rainfall events.
It is known that POD can always be increased by over-warning the targeted event, so CSI was also considered, which is a comprehensive index considering all the hits, misses and false alarms. CSI did show improvement for all lead times and intensities, indicating that the gain in increased hits outbalanced the loss in increased false alarms.
FB also came much closer to 1, indicating that the forecasts were less biased to underestimation after calibration, which is what frequency-matching methods aim to do. Comparing between the two calibration methods, the Sliding Window method gave similar FB as the Adaptive Table method for ECMWF, but it gave better FB for JMA over all thresholds. On the other hand, the mean error of both models was calibrated nearer to zero by the Sliding Window method than the Adaptive Table method. These results could be due to the fact that the Adaptive Table method does not strictly follow the concept of frequency-matching in its update scheme with the introduction of a fixed adaptation speed parameter, whereas the Sliding Window method is always frequency-matching. Such better bias calibration of the Sliding Window method compared to the other is also seen in Figure 10, which shows the Q-Q plot of the observations against the DMO and the two calibrated forecasts over the verification period. For ECMWF forecasts, the Adaptive Table turned the underestimation bias of the DMO into overestimation bias, while the Sliding Window method calibrated it to nearly no bias. For JMA forecasts, the Adaptive Table calibrated forecasts still had a low bias for forecasts below 80 mm, whereas the Sliding Window followed quite tightly along the “no-bias” diagonal.
For mean absolute error (MAE) and root-mean-square error (RMSE) in Figure 9, while the Sliding Window method gave similar values for both models, the Adaptive Table method outperformed it for JMA but underperformed it for ECMWF. Both calibration methods gave worse MAE and RMSE than DMO, but this was expected, as the calibration stretched the range of rainfall intensity, thus increasing the variance of error in general. A possible reason why the Adaptive Table method gave smaller MAE and RMSE for JMA is that it did not stretch the range of rainfall intensity as extensively as the Sliding Window method did, which is especially obvious towards the end of period, as shown in Figure 3.
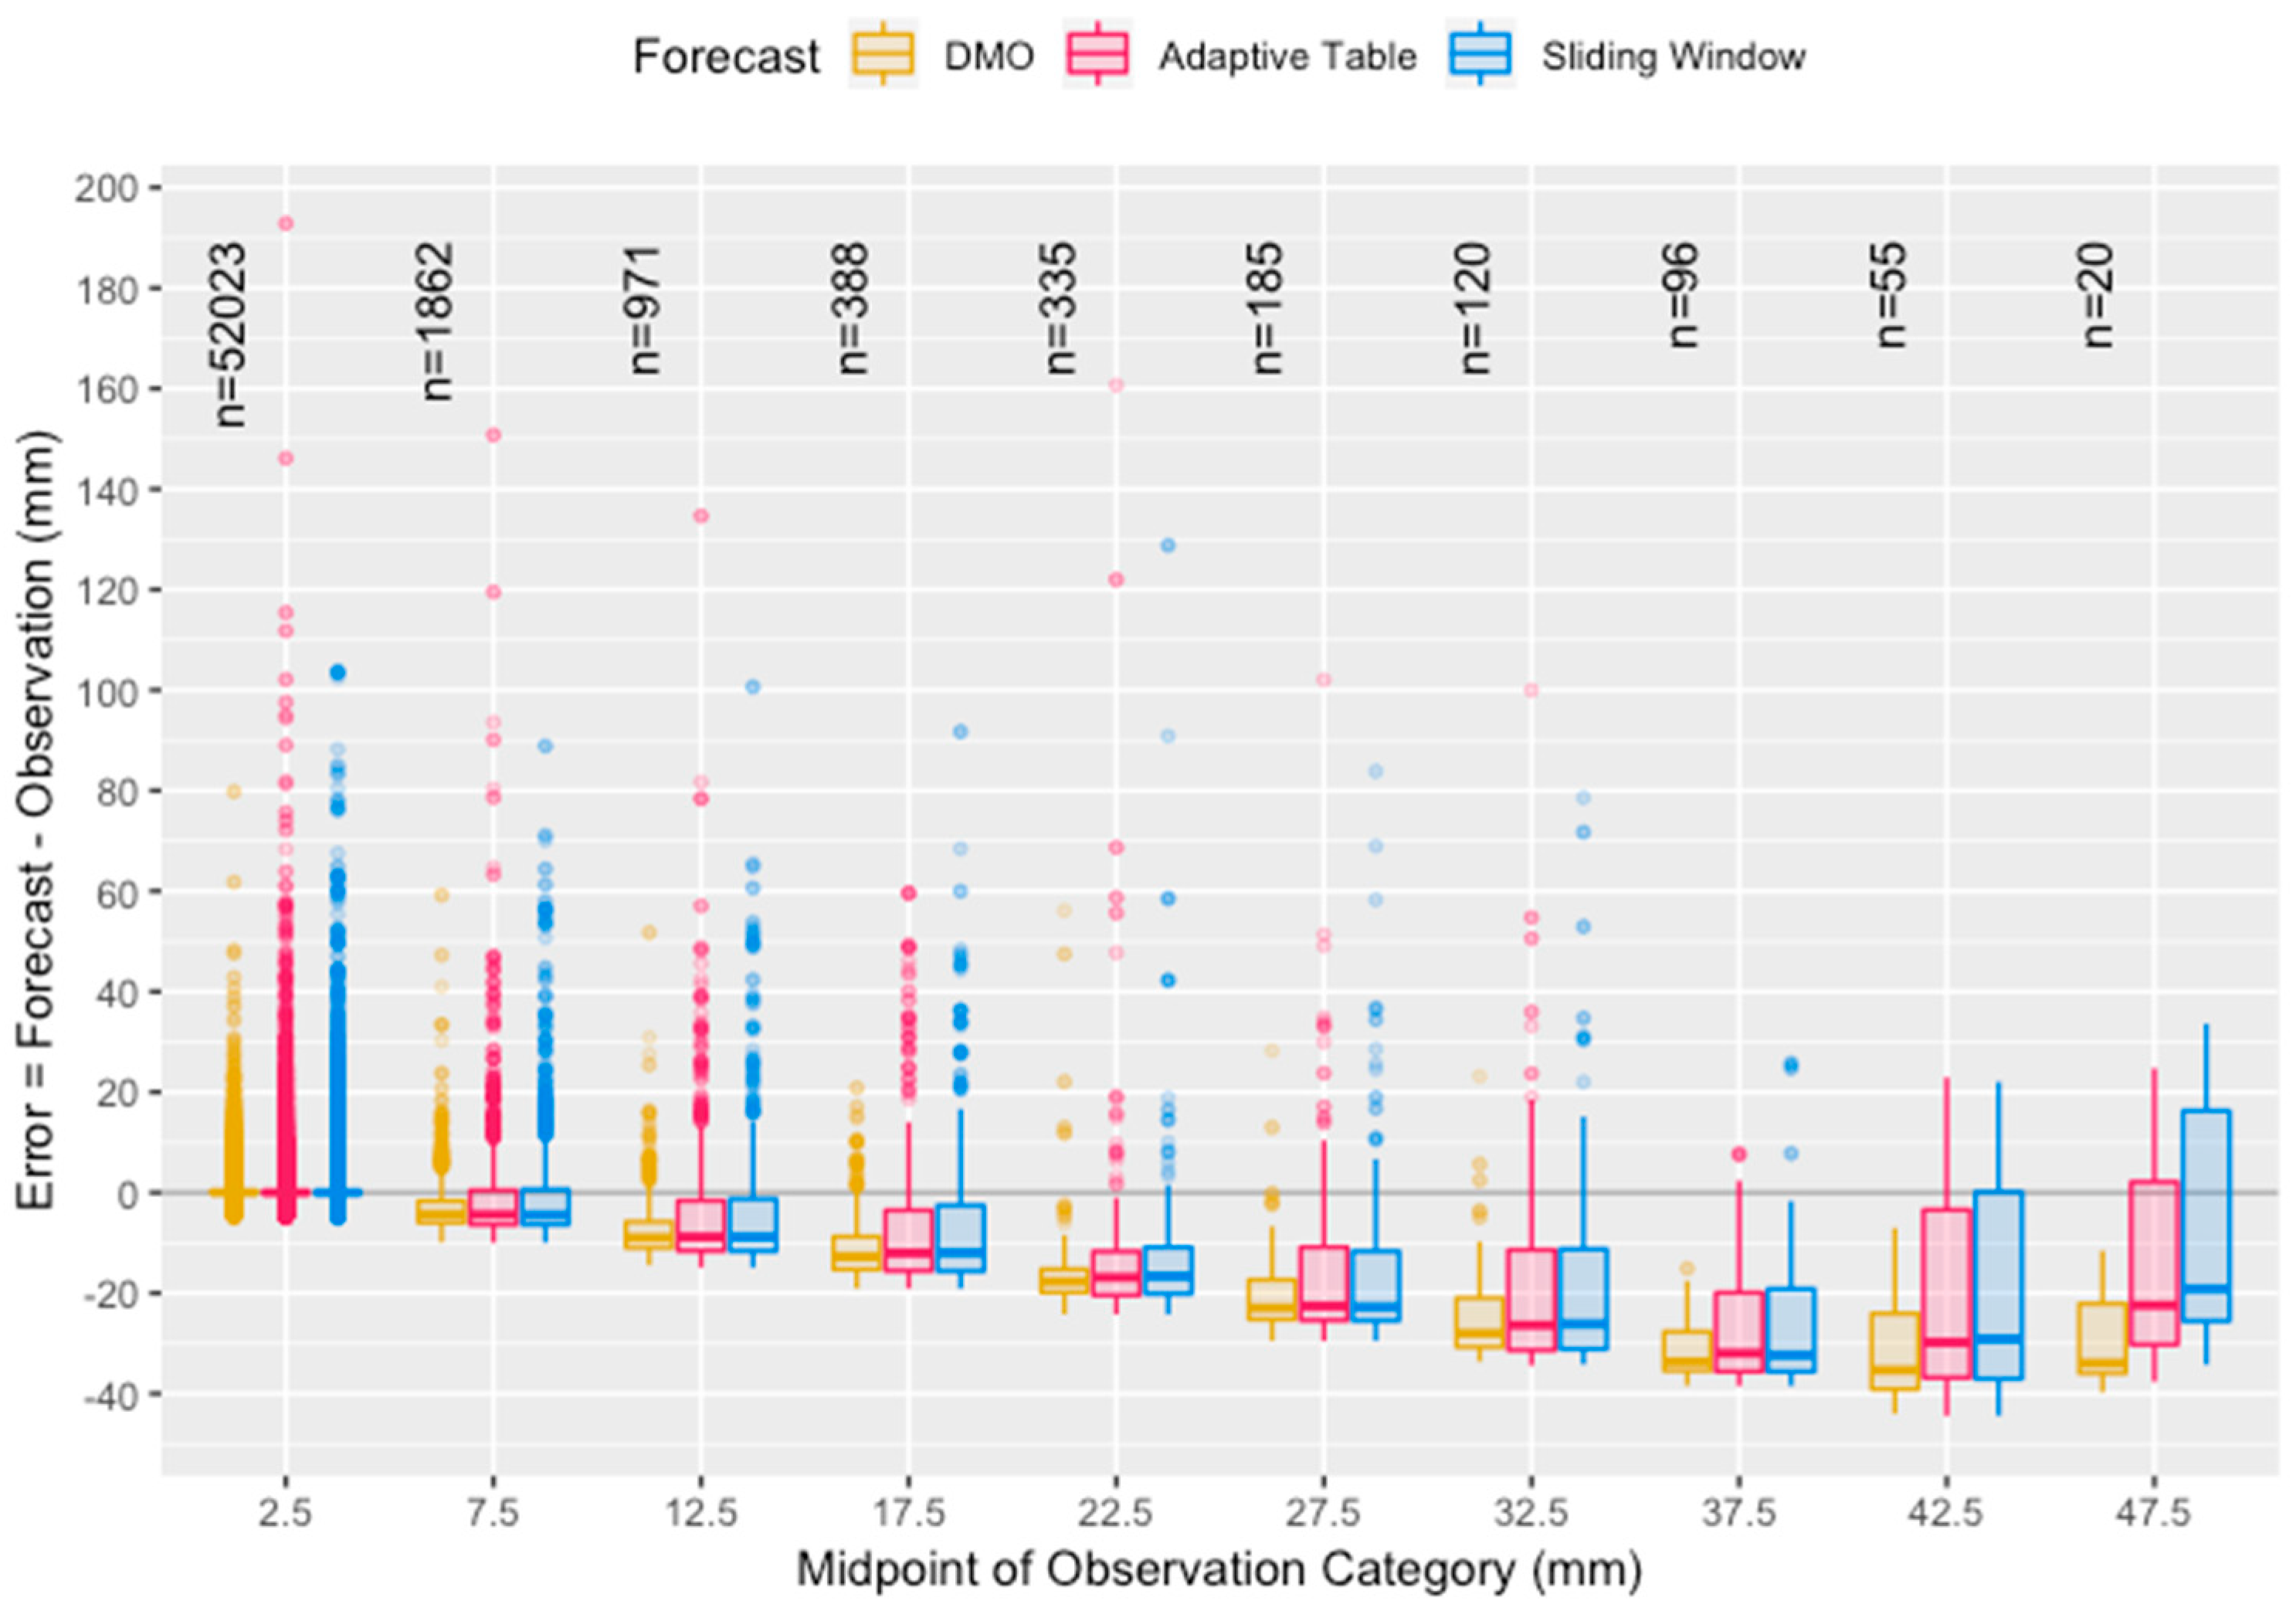
Inspired by conditional quantile plots in Wilks’ work [29], Figure 11 shows the box-and-whisker plot of the error distribution of the forecasts against observation categories. The performance of both calibration methods for ECMWF and JMA is similar. In general, the bias of underestimation increases with the observation intensity. After calibration, for all categories except the lowest one, the third quartile of error obviously gets a lot closer to zero, meaning that calibration is effective for DMO that adequately captures an event and does not fall far short of the observed intensity. The reduced absolute error also implies that calibrated forecasts are closer to their corresponding observation categories than their DMO counterparts, which indicates improved discrimination across categories of rainfall intensity.

4. Case Studies of Actual Rainfall Events

4.1. Failure due to Limitation of Global NWP Models

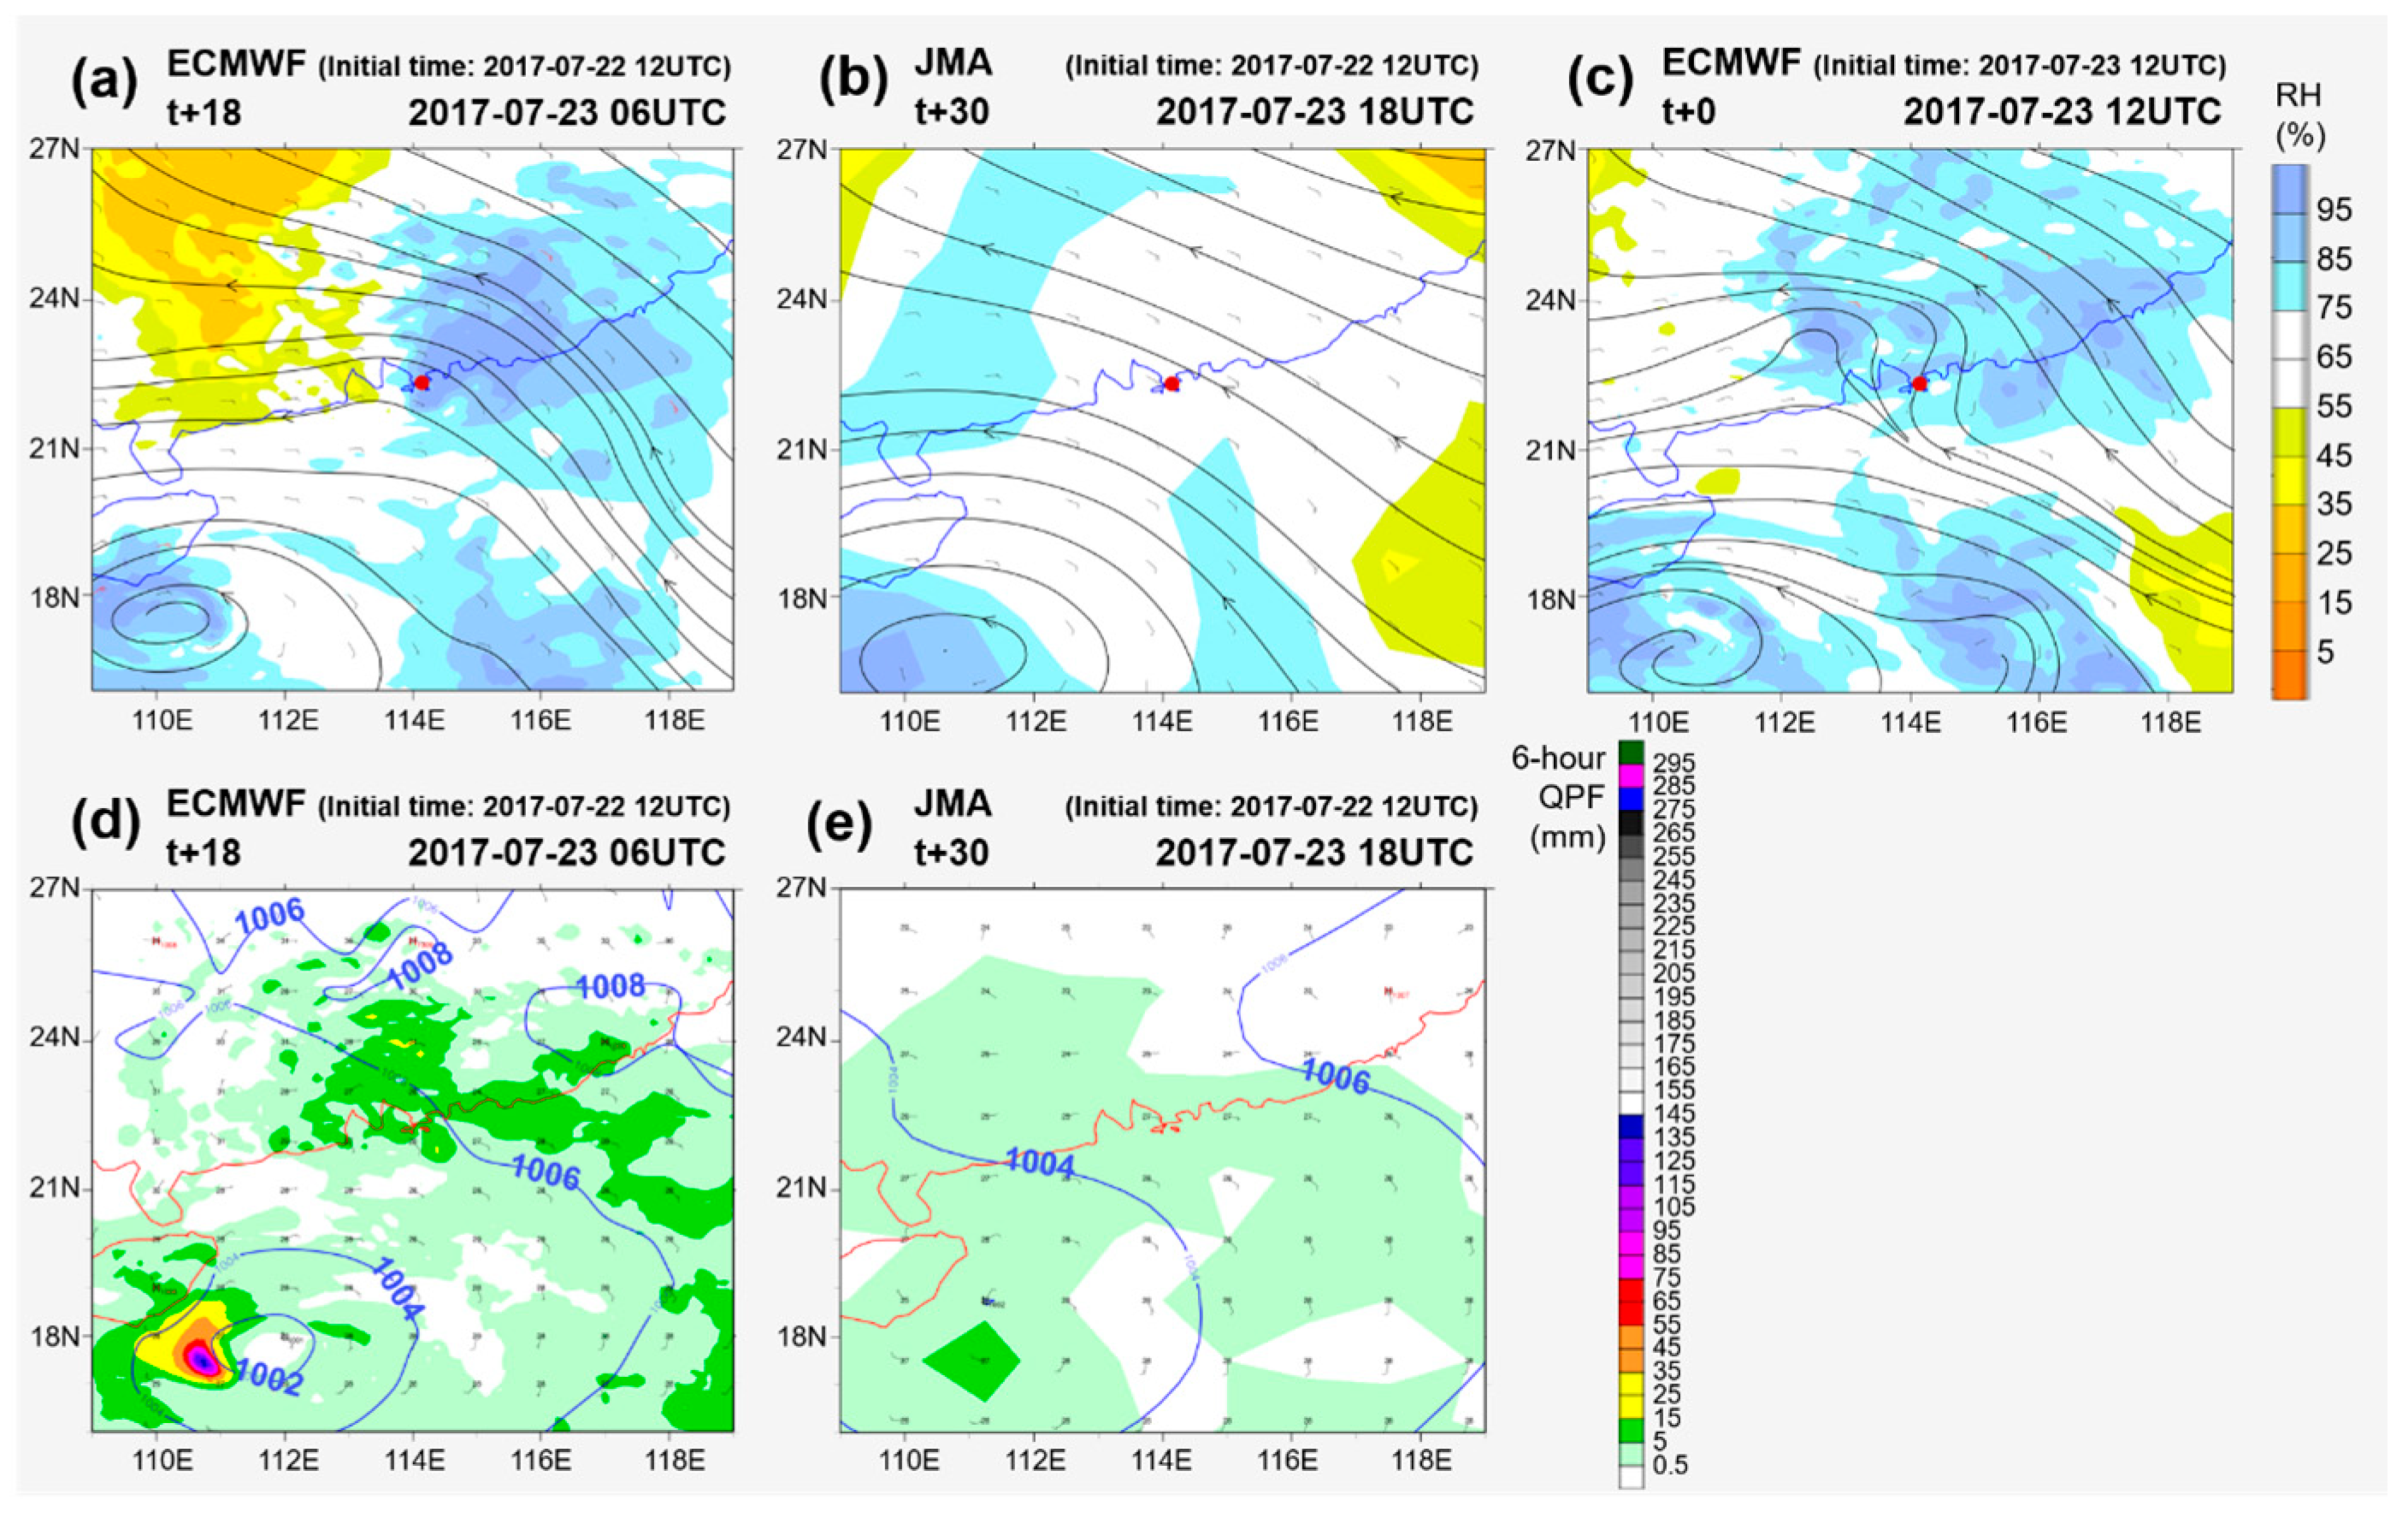
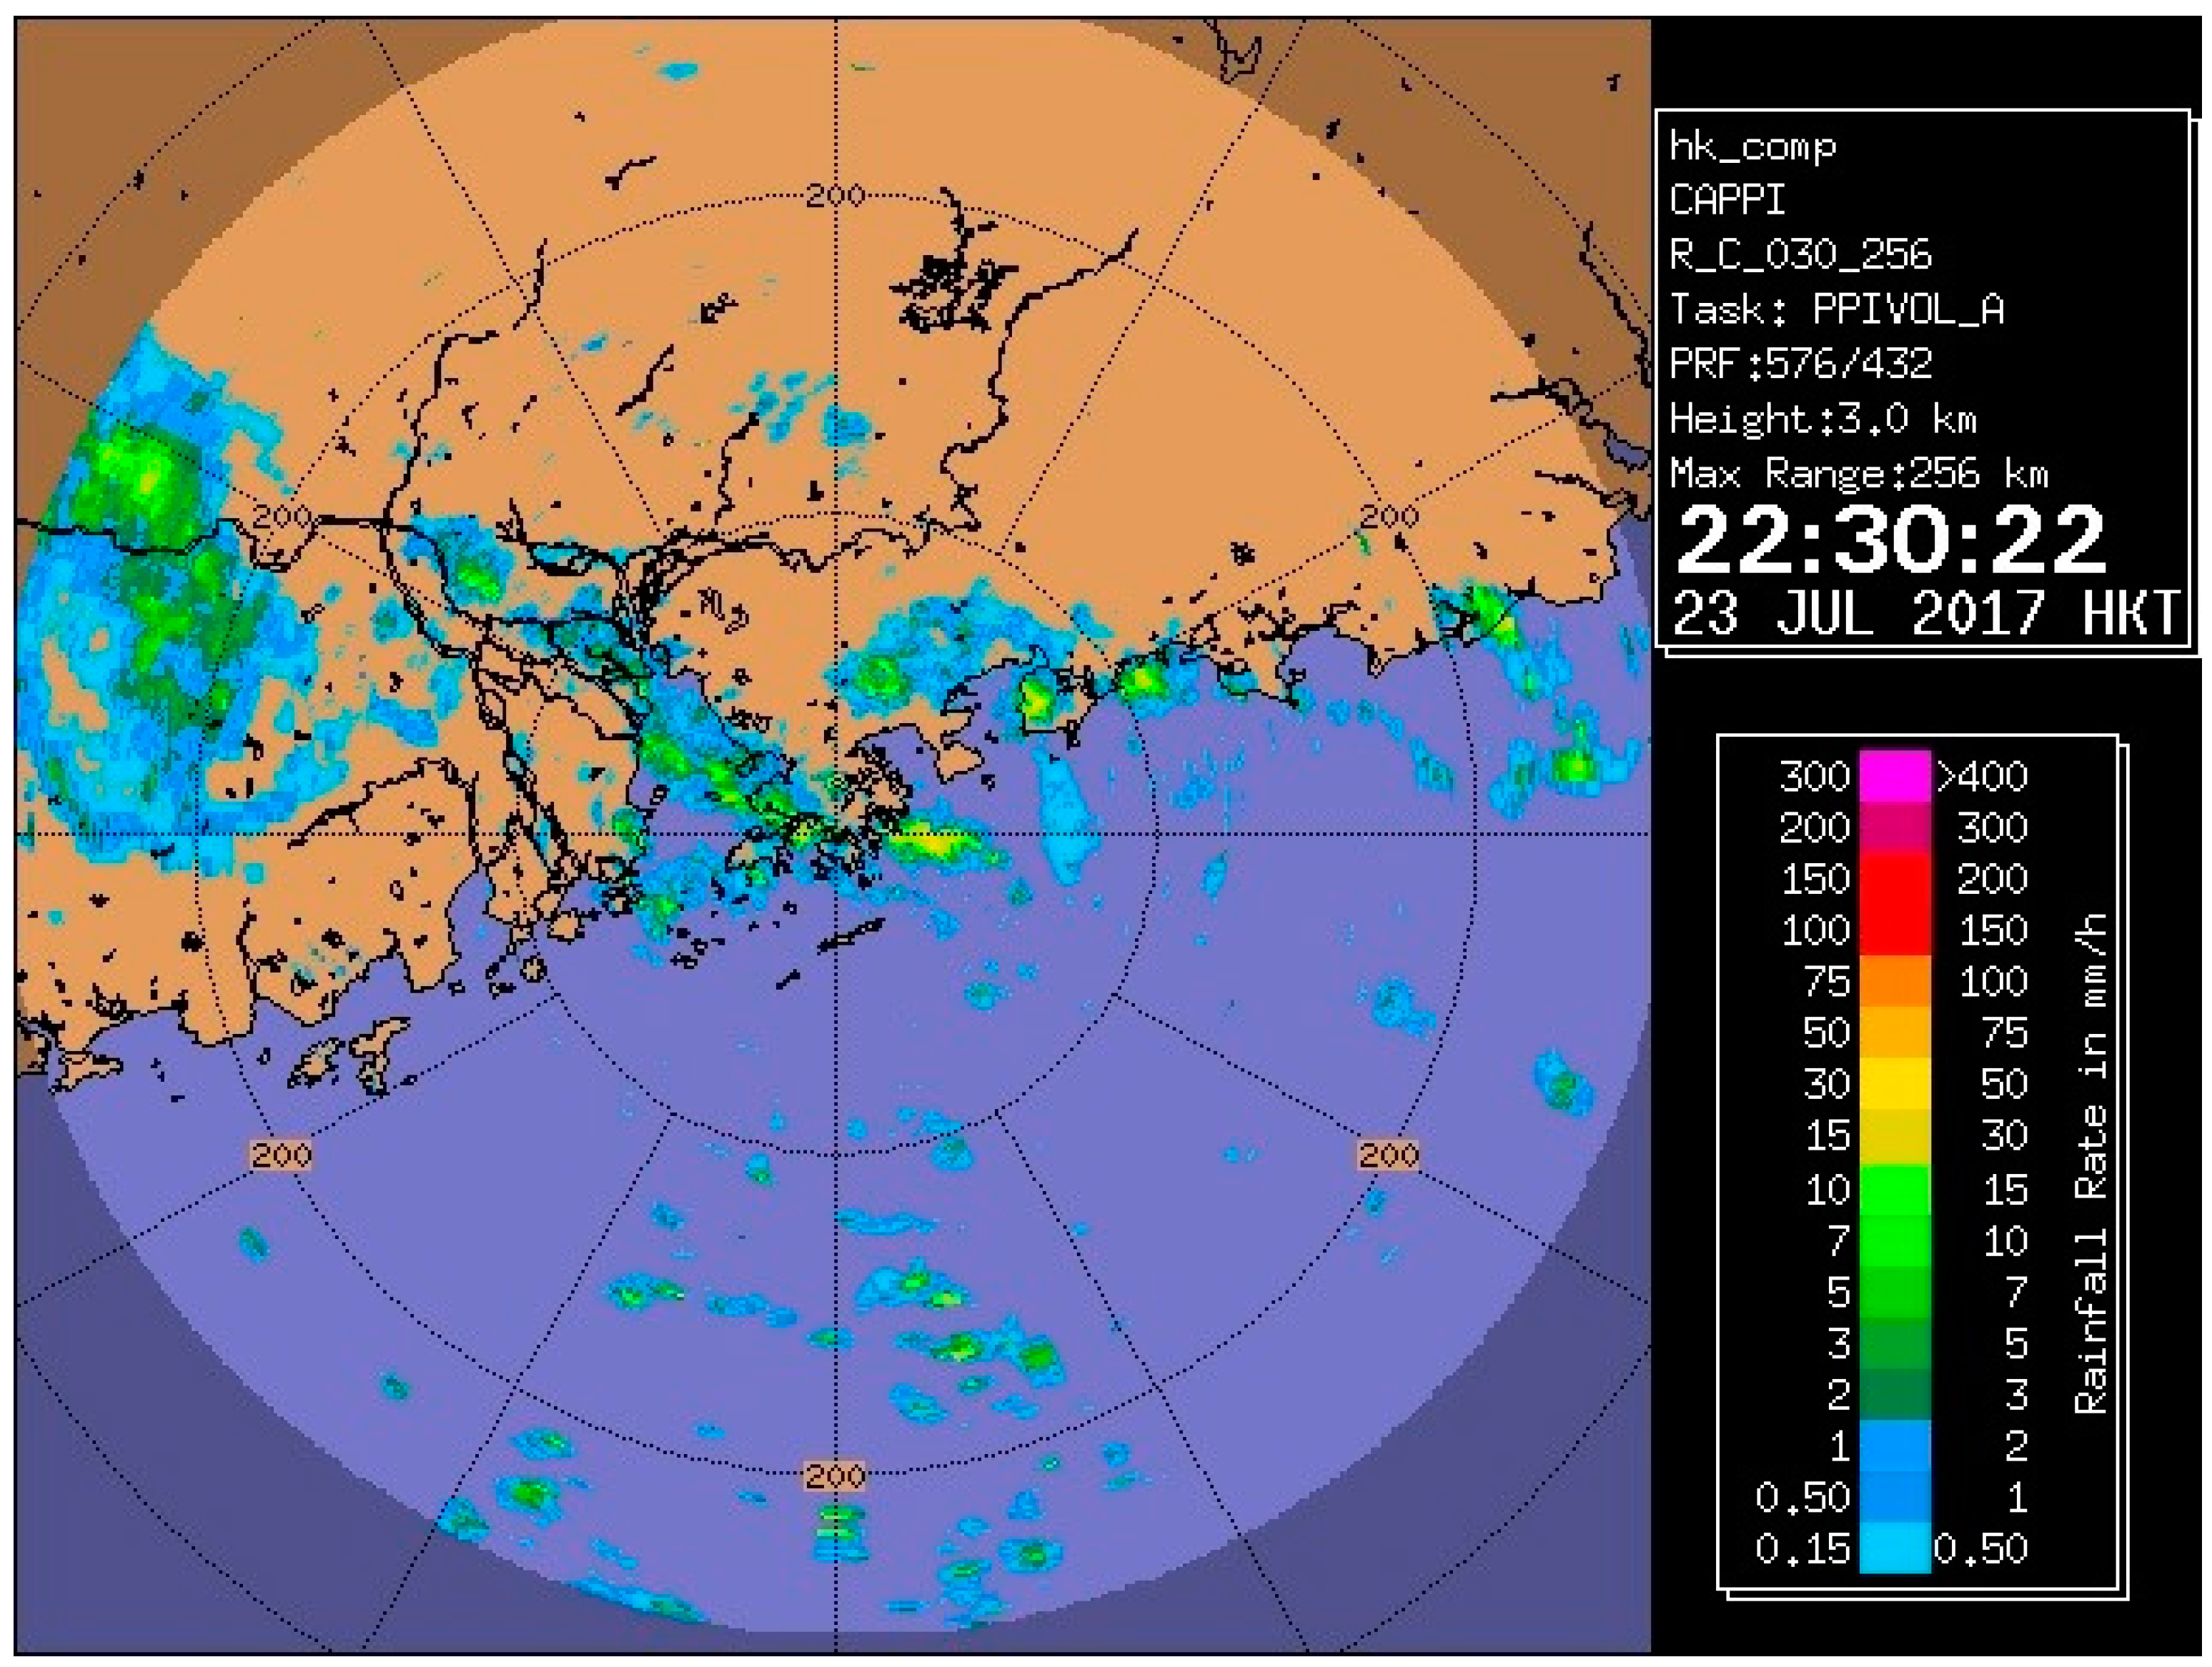
The following shows a typical example of underestimation of rainfall due to incapability of global NWP models in capturing the time of occurrence and intensity of the rain episode. As both calibration methods are based on frequency-matching for year-long statistics, an event that cannot be captured by models cannot be effectively calibrated as well. On 23 July 2017, following the departure of Tropical Cyclone Sonca towards Vietnam, Hong Kong was affected by moist low-level southeasterlies, under the confluence of an anticyclone near Taiwan and the tropical cyclone. At the same time, an inverted trough was being pushed northwestwards along the southern periphery of the 500 hPa subtropical ridge towards the Guangdong coast (Figure 12). Isolated intense radar echoes began to develop that night (Figure 13) and an Amber Rainstorm Warning Signal was issued at 22:30 h that day. As these echoes moved further northwestwards and weakened, the signal was cancelled at 00:45 h the next day.
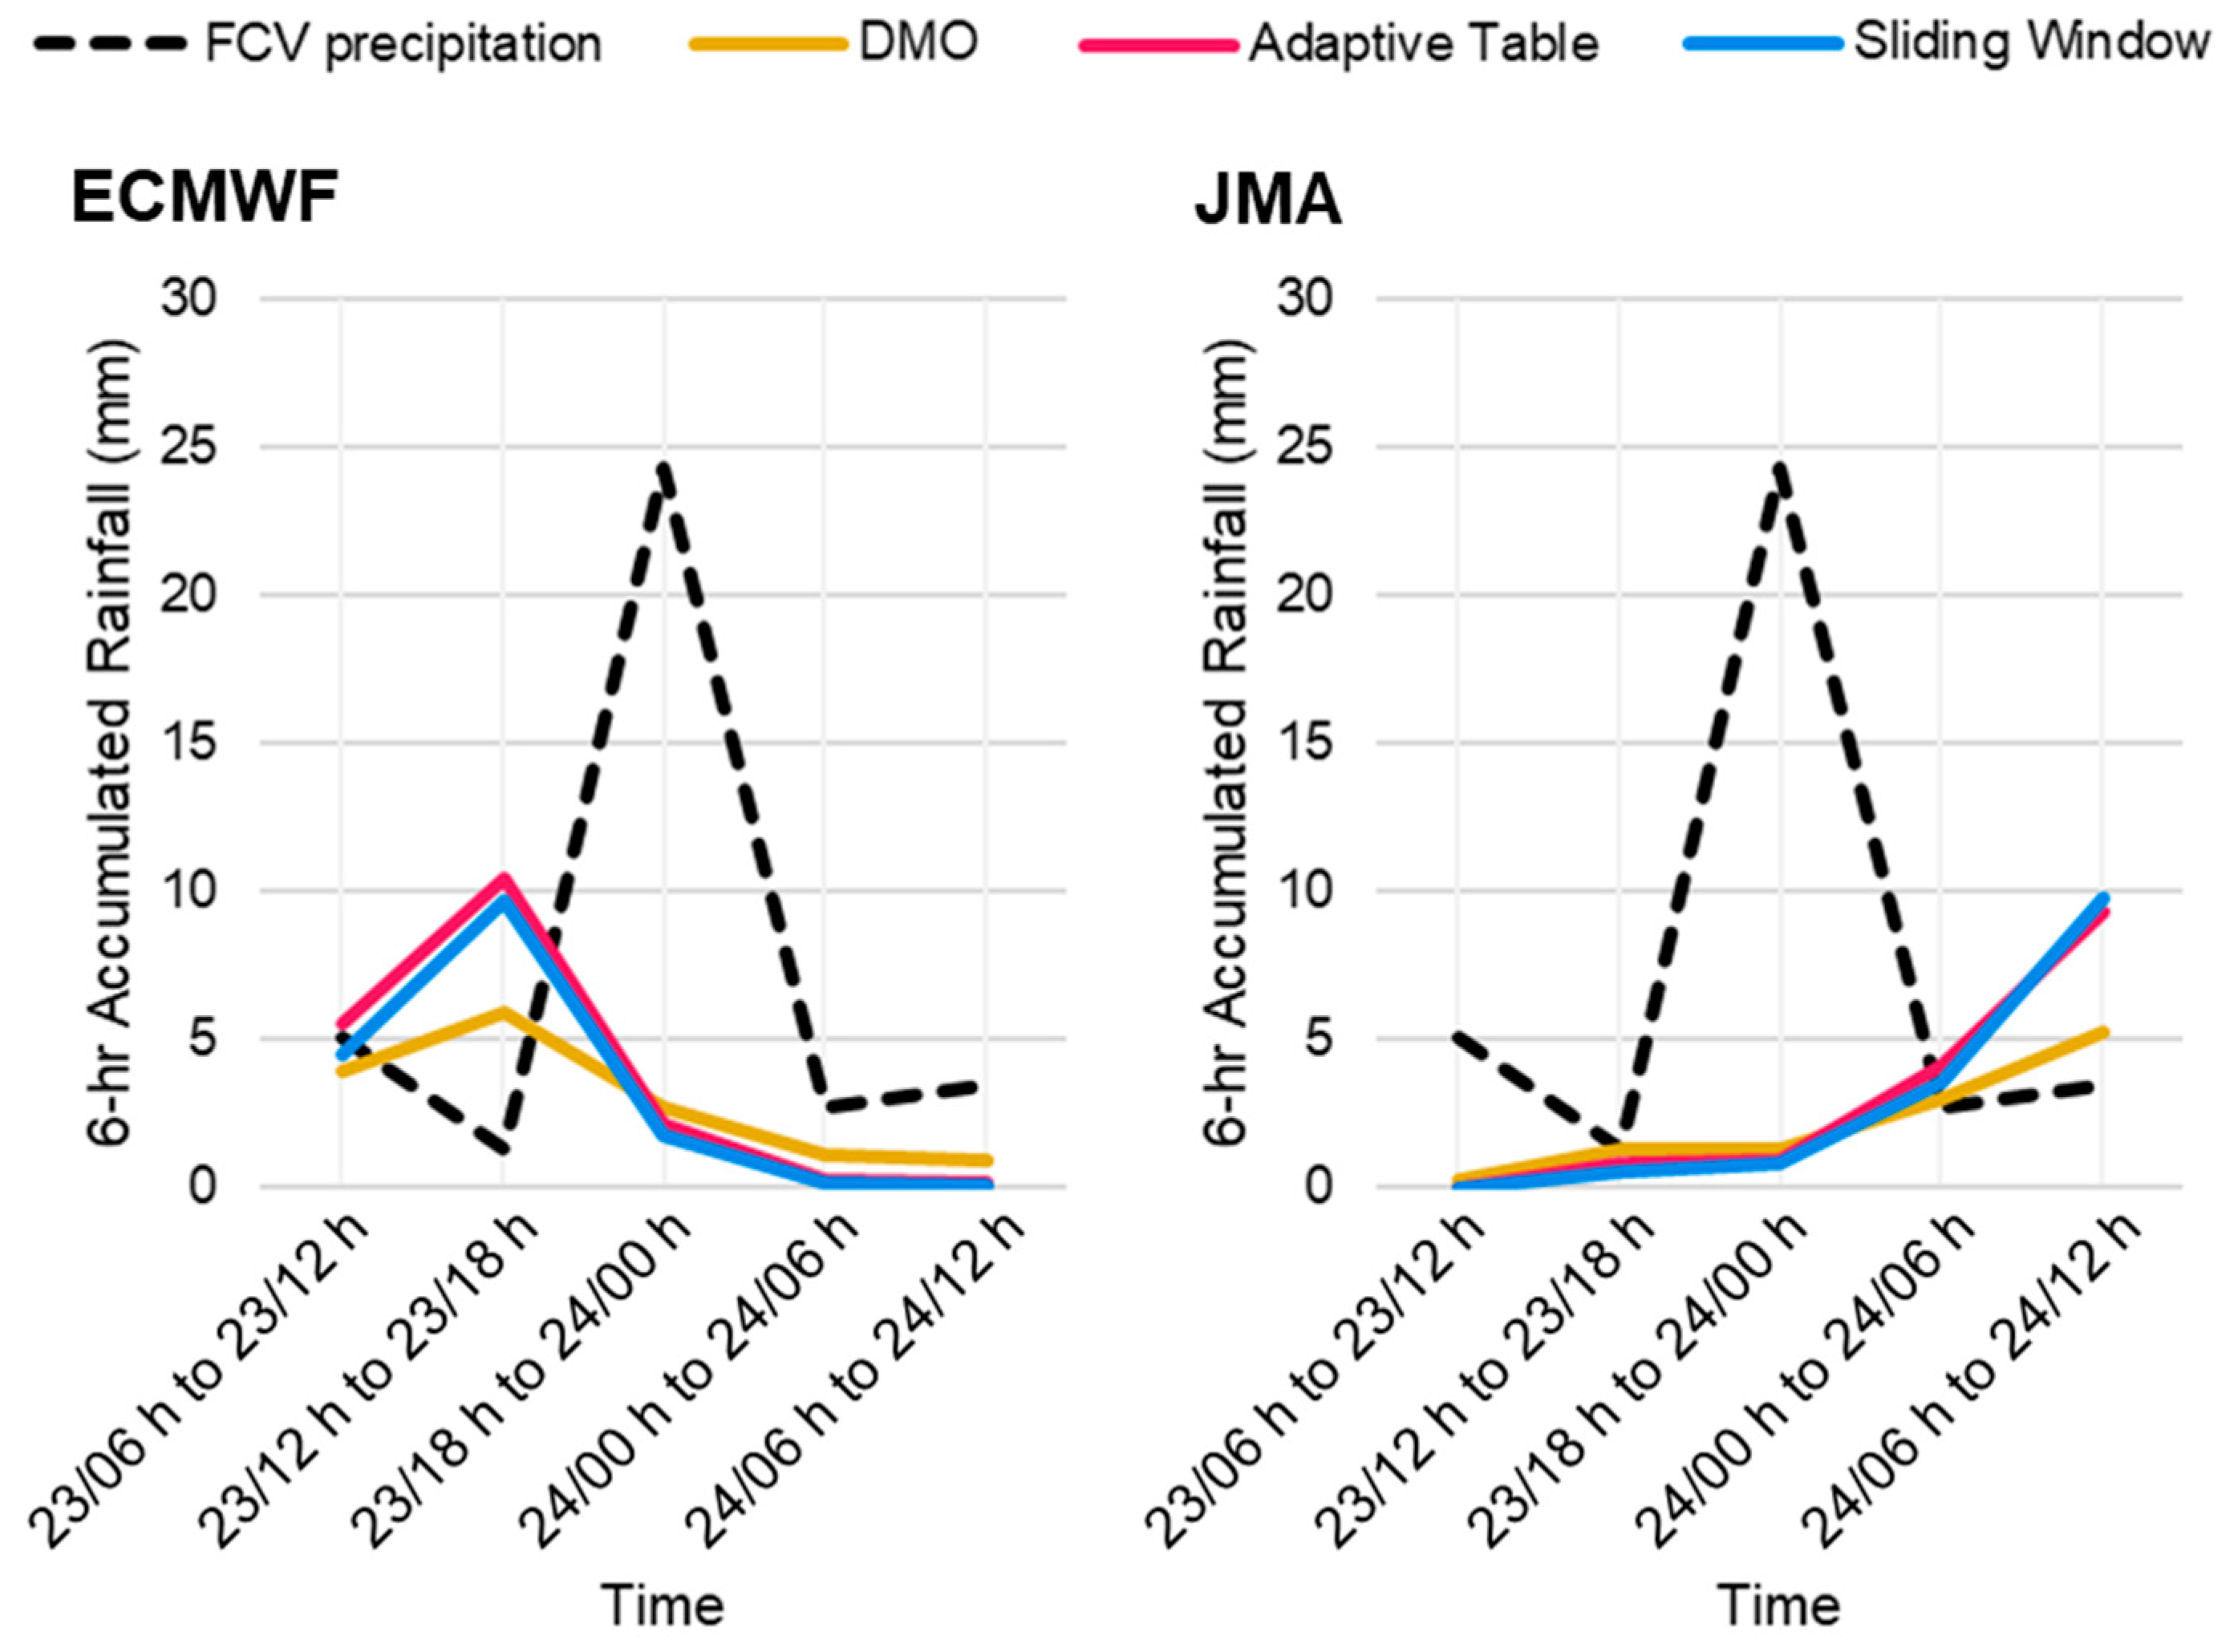
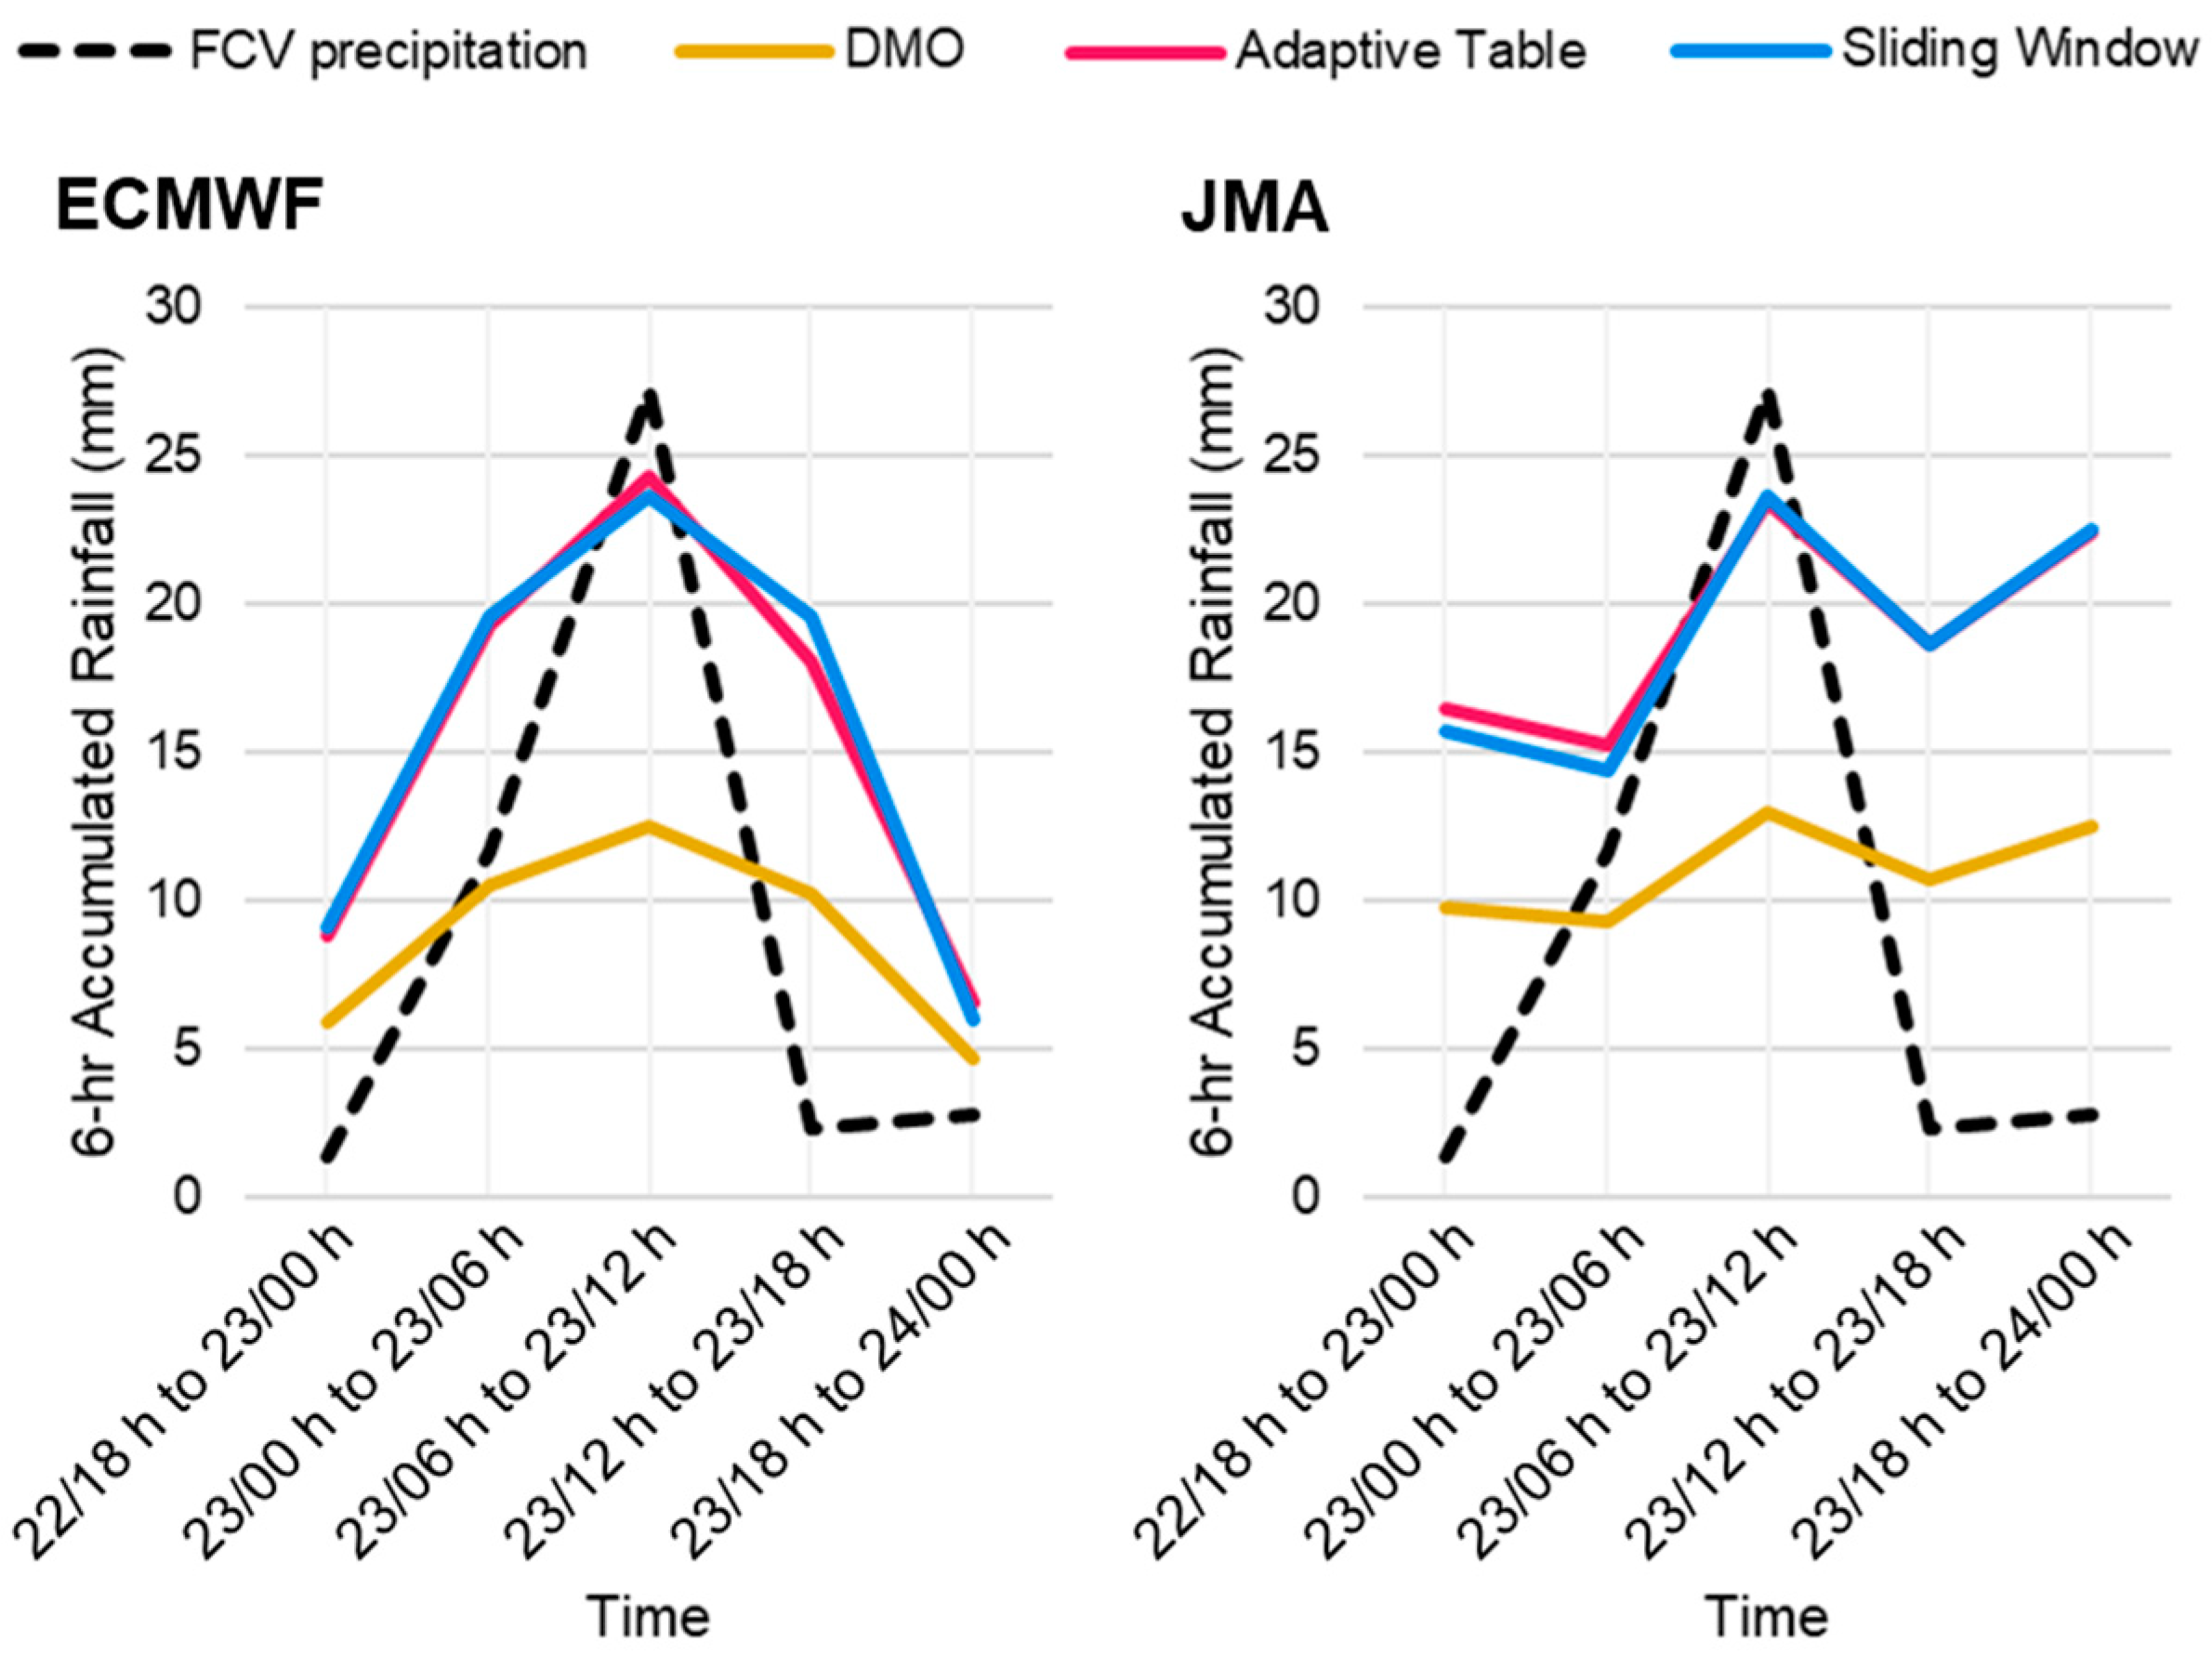
In the 6 h period from 18:00 h on 23 July to 00:00 h the next day, 24.3 mm of rainfall from FCV stations were recorded. ECMWF depicted a rain episode in the 6 h period before and JMA forecasted the rain episode would be 06:00–12:00 h the next day, and both models expected a DMO rainfall of 5–6 mm. The FCV, DMO and calibrated 6 h rainfall data are listed in Figure 14. In fact, a calibrated 6 h rainfall of about 10 mm would have sufficient indication for moderate or heavy showers, but the time of occurrence could be inaccurate even for a short-range forecast. Further looking into the respective forecasts by models, ECMWF expected the area of heavier rain would pass to the north of Hong Kong during the daytime of 23 July and a few millimeters of rainfall was still expected, and JMA expected a weak 500 hPa trough near Hong Kong in the morning of 24 July, expecting a later rain episode (Figure 12a–c). This would be an illustration that a spatio-temporal shift of rain band or failure of models to capture the associated synoptic systems would lead to poor calibration results, so the judgment of forecasters based on meteorological knowledge and experience would still be essential.

4.2. A Successful Example

One of the successful examples was the rain episode on the morning on 23 June 2015, in which over 30 mm of rainfall was recorded territory-wide from 00 to 12 h. For the synoptic pattern in this case, Tropical Cyclone Kujira already made landfall over Hainan Island and was about to enter the Gulf of Tonkin. With a deep layered subtropical ridge over the Western North Pacific and a ridge axis of about 22° N, Hong Kong was situated in an active confluence zone of southerlies between the two systems (Figure 15). Bands of north-to-south-oriented convective echoes developed over the northern part of the South China Sea and Guangdong crossed Hong Kong one after another (Figure 16), causing intermittent heavy showers over the entire morning. FCV and model forecasts are summarized in Figure 17.
Despite that both models forecast a longer rain episode than actual, they managed to capture the peak of heavy rainfall correctly and were able to suggest above 10 mm of DMO 6 h rainfall. Both models gave a similar pattern of 500 hPa flow, but both underestimated the amount of moisture (Figure 15). Since global NWP models have a tendency to underestimate heavy rainfall for reasons mentioned earlier, frequency-matching is useful in adjusting model QPF upwards to the same order of magnitude. If models manage to forecast the triggering systems correctly, then the calibration methods will be able to reflect the magnitude of rainfall to be anticipated and serve as a reference for forecasters to issue early alerts.

4.3. Diverged Performance with a Trough in Springtime

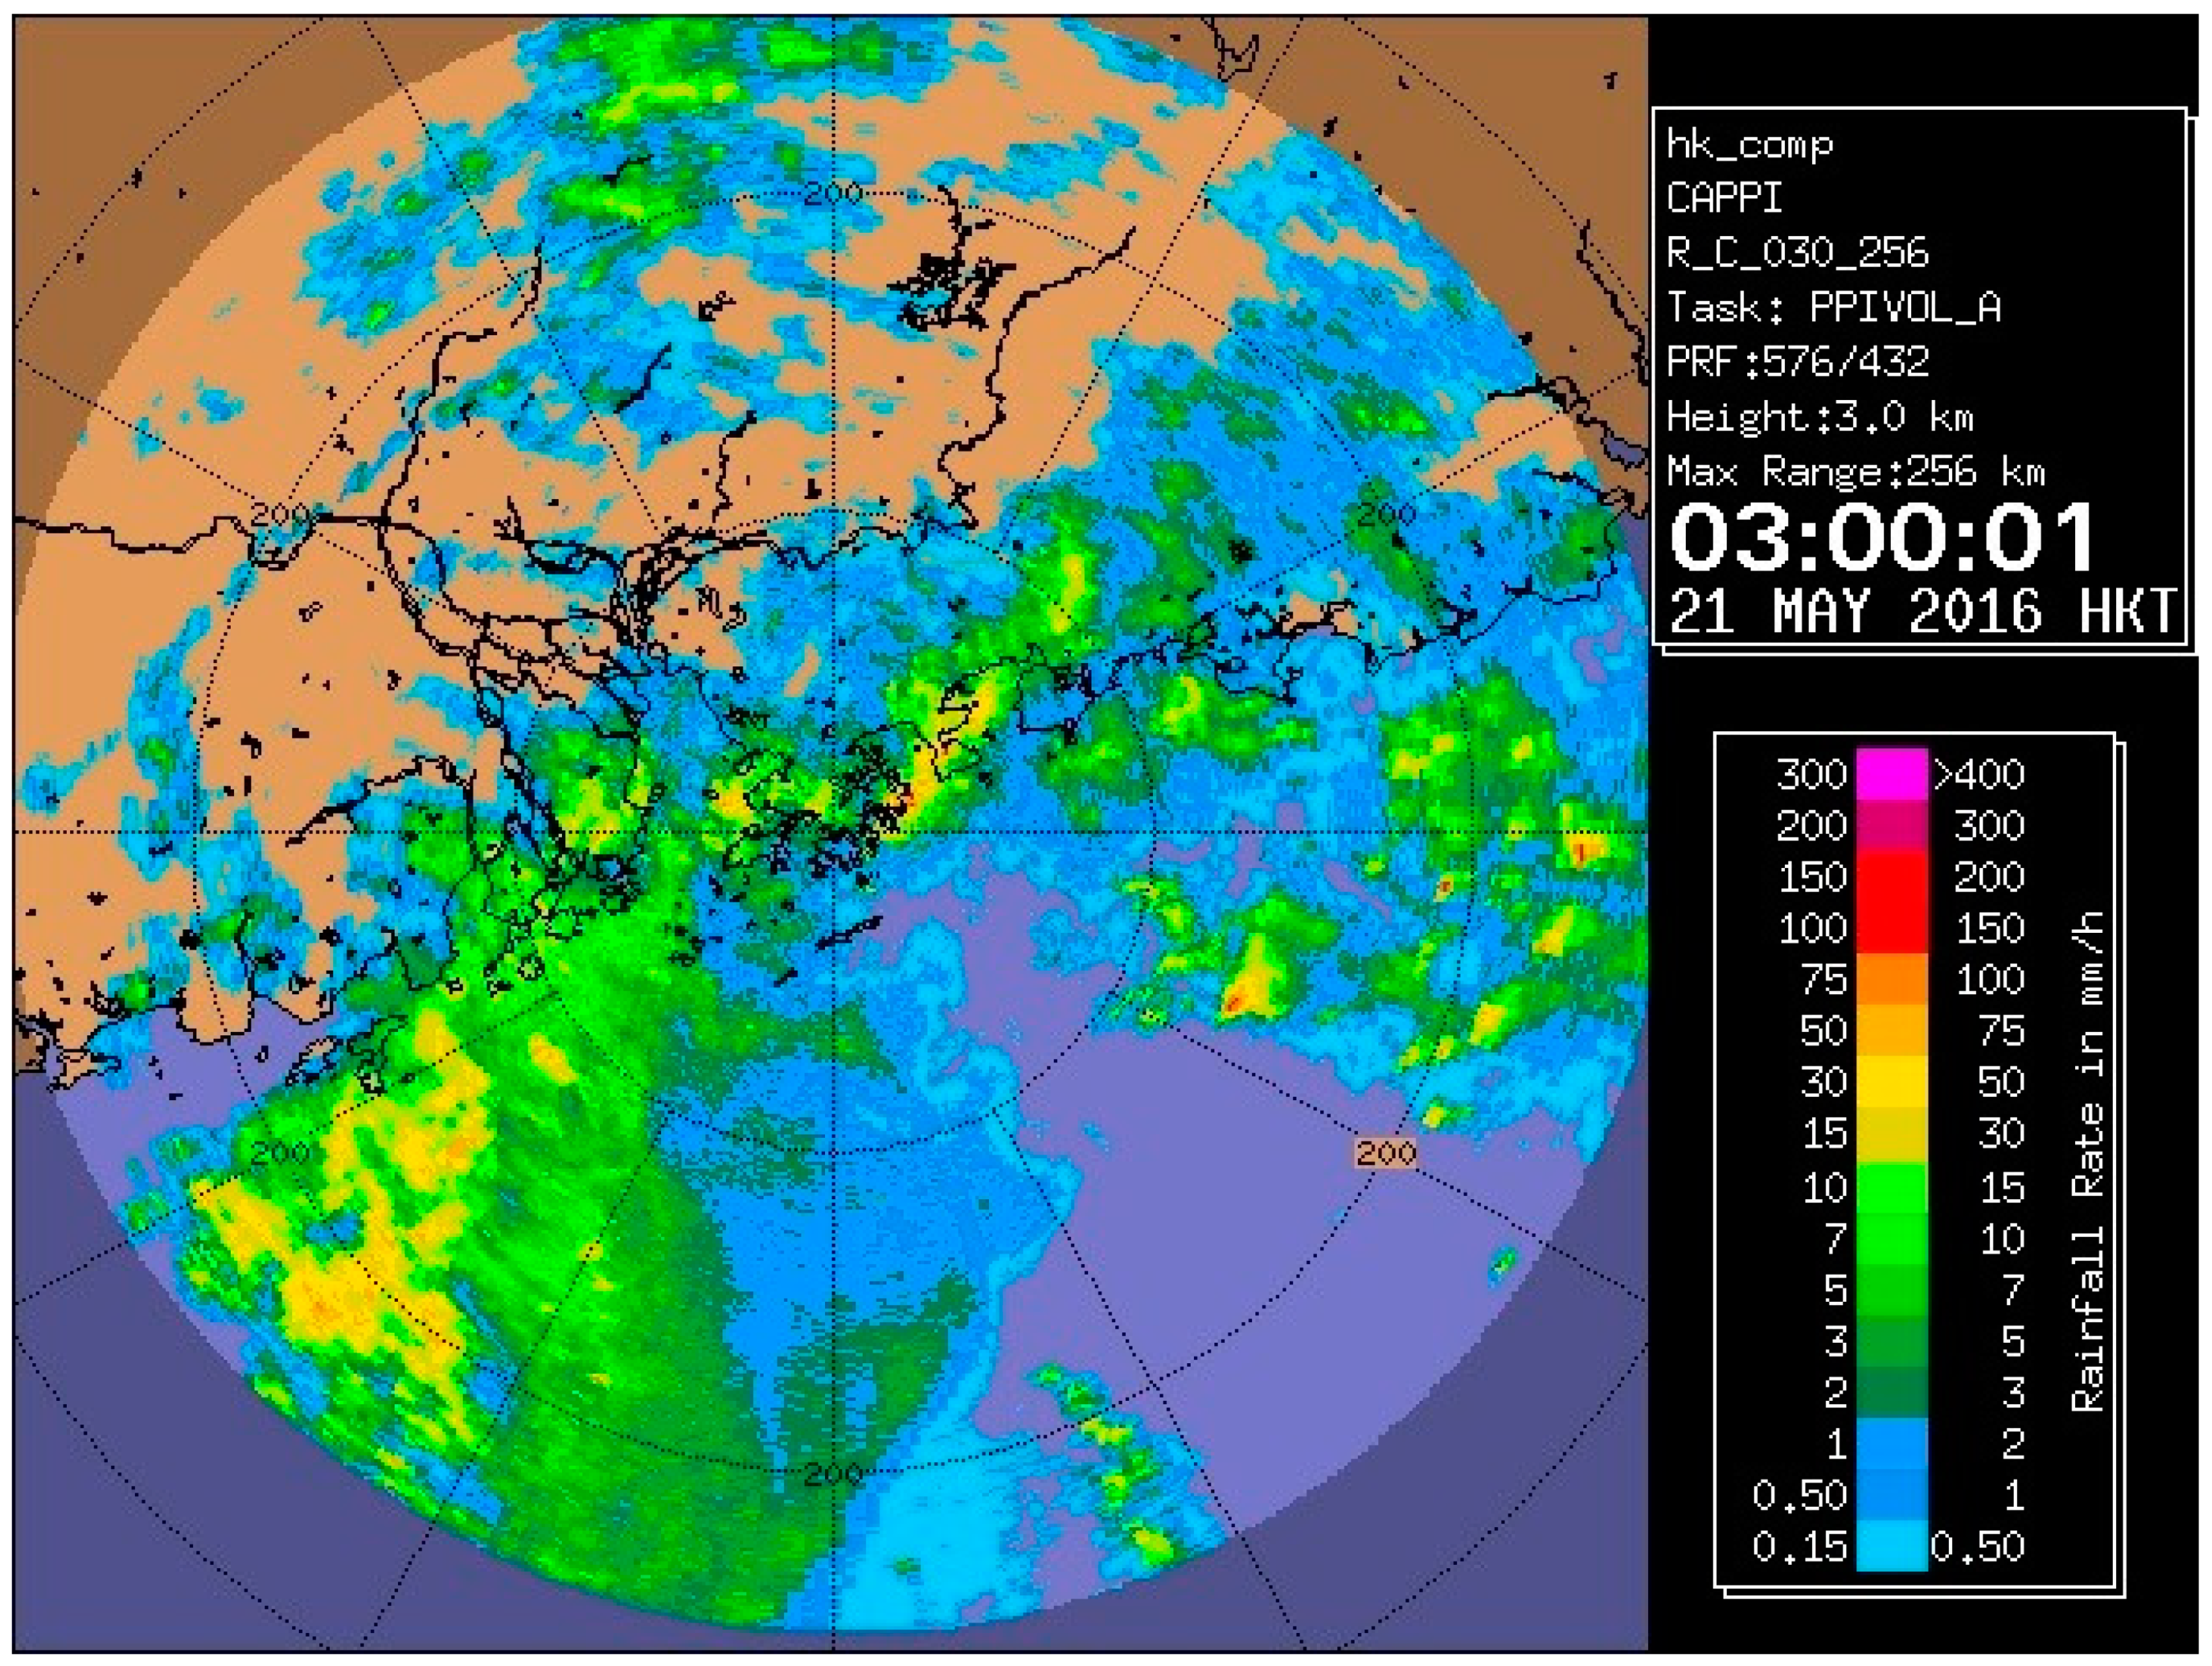
During springtime, trough of low pressure is a common weather pattern that favors heavy rainfall over south China, when weak cold air mass interacts with warmer air mass from the South China Sea. On 20–21 May 2016, an active trough of low pressure lingered near the Guangdong coast. Convections were enhanced by an 850 hPa southwesterly jet over Guangdong, which provided abundant moisture transport, and a 500–700 hPa low-latitude trough over southwestern China was migrating eastwards. An Amber Rainstorm Warning Signal was issued at 01:55 h following the active development zone shifted towards Hong Kong from the west (Figure 18). As major rain bands gradually shifted to the east, the signal was cancelled at 06:15 h. On that morning, over 70 mm rainfall was recorded overnight in the territory and more than 200 mm over northeastern Hong Kong.
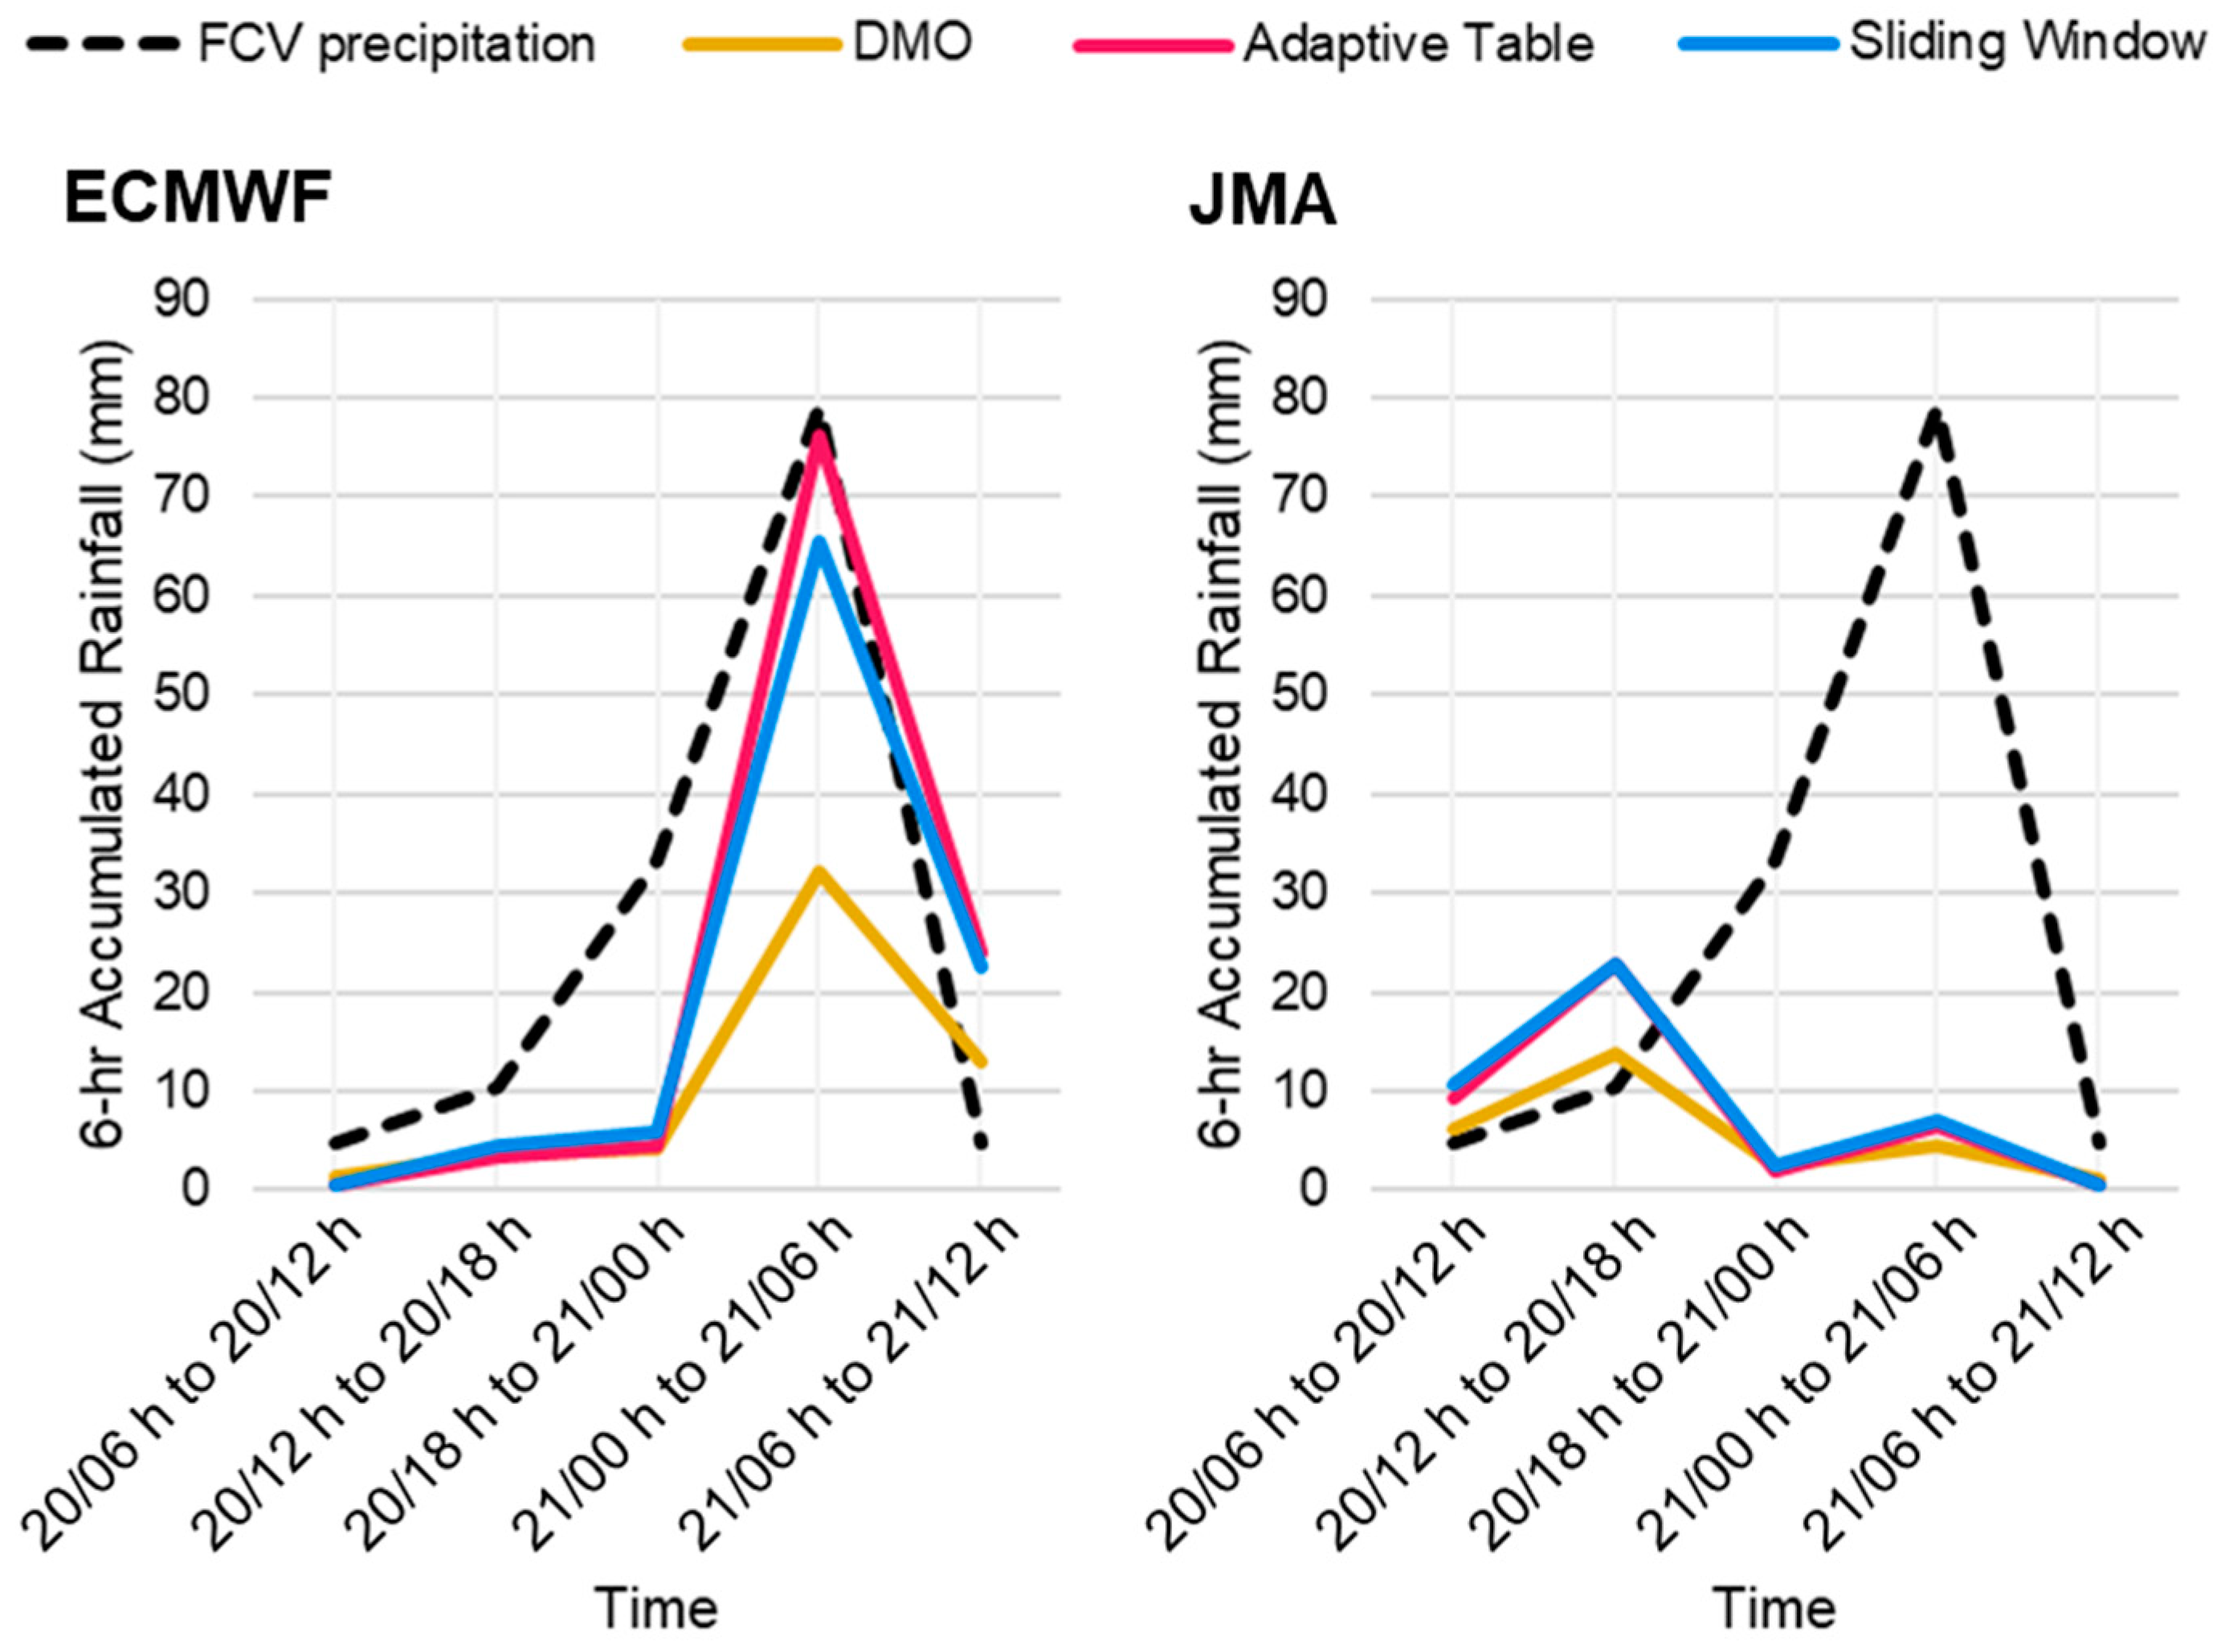
Both ECMWF and JMA managed to capture the associated synoptic features and expected a rain episode across both days. From Figure 19, ECMWF predicted the time of the peak rainfall correctly with very close magnitude after calibration, while JMA expected an earlier peak with less rainfall, but still suggested moderate rainfall. From Figure 20, it can be seen that JMA suggested the 850 hPa trough would be less active and more fast-moving, and the low- to mid-level troughs were less aligned, leading to a more relaxed surface trough; as for ECMWF, the alignment of low- to mid-level features were more favorable for convective activities and forecasted strong 850 hPa southwesterlies. In this case, the divergence of model forecast would lead to different results, so scrutinizing the actual observations and recent model performance would be essential to assess the likely timing and intensity of the rain episode.

5. Conclusions and Further Work

Intense rainfall events are often underestimated by global NWP models due to the low skills in convective parametrization and coarse resolution of grids with order of 10 km. This study introduced two frequency-matching methods to calibrate DMO QPFs from ECMWF and JMA against actual 6 h rainfall over Hong Kong. Forecast rainfalls were calibrated through establishing relations between the past forecast and observed rainfall, i.e., the f-t conversion, and the conversion tables would be updated after new observations were available. The Adaptive Table method updates the conversion table whenever the model QPF under- or over-estimates the observed rainfall with certain significance, and the Sliding Window method updates the table with forecasts and observations in the most recent two years, with a sliding time window.
The two global models captured rain episodes of 2–5 mm/6 h without significant bias, while overestimating light rainfall and underestimating intense rainfall. The bias of intense rainfall increased with rain intensity, and JMA in general showed a greater bias than ECMWF. Both frequency-matching methods managed to improve both the POD and CSI of intense rainfall events, providing more guidance and alerts from an operational perspective ahead of heavy rain, although FAR also increased as model QPFs were calibrated upwards, but actually over-warned some of the events. These methods redistributed intense rainfall events of significant underestimation towards zero bias and worked the best when the rainfall event was practically captured by the models and the intensity being underestimated by half. It was also found that the Adaptive Table method showed a higher density distribution near zero bias, and did not fluctuate as much as the Sliding Window method, because the latter would be affected by significant misses or false alarms of events exiting or entering the time window. On the other hand, the Sliding Window method more effectively reflected model performances in a fixed two-year timeframe.
The results of calibration should be interpreted with caution as frequency-matching methods can only fine-tune the QPF of rainfall events being captured by models, but do not cater for misses or false alarms of models due to model error propagation, resolution and parametrization. A better solution to address these problems would be an analogue forecast method or ingredient-based approach. Still, the frequency-matching methods presented could provide a better reference of the order of magnitude of the precipitation events based on recent model performance. The two calibration methods can be generically applied to regions with different climatological characteristics by constructing their corresponding set of f-t conversion tables. For places with sparse distribution of rain gauges, rain gauge measurements can be replaced by radar quantitative precipitation estimation (QPE) to establish the relation. From a grid-based perspective, the frequency-matching approach would also help us understand the biases of a grand ensemble of model deterministic and ensemble QPF against observations or QPE and find more objective indications of intense rainfall events.

Author Contributions

M.-L.C. conducted the literature review, provided case studies from a forecaster’s perspective, and wrote the majority of this paper. Y.-C.W. and A.P.K.T. undertook the verification and analysis of results, and the respective graphical representations. W.-C.W. and W.-K.W. conceptualized the calibration methods, supplied the dataset, reviewed the manuscript, and supervised this project. All authors have read and agreed to the published version of the manuscript.

Funding

This study was supported by the Vice-Chancellor Discretionary Fund (Project ID: 4930744) from The Chinese University of Hong Kong (CUHK) given to the Institute of Environment, Energy and Sustainability.

Institutional Review Board Statement

Not applicable.

Informed Consent Statement

Not applicable.

Data Availability Statement

Not applicable.

Conflicts of Interest

The authors declare no conflict of interest.

References

  1. Li, P.W.; Lai, E.S.T. Short-range quantitative precipitation forecasting in Hong Kong. J. Hydrol. 2004, 288, 189–209. [Google Scholar] [CrossRef]
  2. Climate of Hong Kong. Available online: https://www.weather.gov.hk/en/cis/climahk.htm (accessed on 6 February 2021).
  3. Climate Change in Hong Kong. Available online: https://www.hko.gov.hk/en/climate_change/obs_hk_rainfall.htm (accessed on 6 February 2021).
  4. Sun, Y.; Stein, M.L. A stochastic space-time model for intermittent precipitation occurrences. Ann. Appl. Stat. 2015, 9, 2110–2132. [Google Scholar] [CrossRef]
  5. Rezacova, D.; Zacharov, P.; Sokol, Z. Uncertainty in the area-related QPF for heavy convective precipitation. Atmos. Res. 2009, 93, 238–246. [Google Scholar] [CrossRef]
  6. Damrath, U.; Doms, G.; Fruhwald, D.; Heise, E.; Richter, B.; Steppeler, J. Operational quantitative precipitation forecasting at the German Weather Service. J. Hydrol. 2000, 239, 260–285. [Google Scholar] [CrossRef]
  7. Li, P.W.; Lai, E.S.T. Applications of radar-based nowcasting techniques for mesoscale weather forecasting in Hong Kong. Meteor. Appl. 2004, 11, 253–264. [Google Scholar] [CrossRef] [Green Version]
  8. Woo, W.C.; Wong, W.K. Operational application of optical flow techniques to radar-based rainfall nowcasting. Atmosphere 2017, 8, 48. [Google Scholar] [CrossRef] [Green Version]
  9. Shi, X.; Chen, Z.; Wang, H.; Yeung, D.Y.; Wong, W.K.; Woo, W.C. Convolutional LSTM Network: A Machine Learning Approach for Precipitation Nowcasting. In Proceedings of the 29th Conference on Neural Information Processing Systems (NIPS 2015), Montreal, QC, Canada, 10 December 2015; Cortes, C., Lawrence, N.D., Lee, D.D., Sugiyama, M., Garnett, R., Eds.; Available online: https://arxiv.org/abs/1506.04214 (accessed on 11 February 2021).
  10. Shi, X.; Gao, Z.; Lausen, L.; Wang, H.; Yeung, D.Y.; Wong, W.K.; Woo, W.C. Deep Learning for Precipitation Nowcasting: A Benchmark and a New Model. In Proceedings of the 30th Conference on Neural Information Processing Systems (NIPS 2017), Long Beach, CA, USA, 5 December 2017; Guyon, I., Luxburg, U.V., Bengio, S., Wallach, H., Fergus, R., Vishwanathan, S., Garnett, R., Eds.; [Google Scholar]
  11. Nguyen, M.; Nguyen, P.; Vo, T.; Hoang, L. Deep Neural Networks with Residual Connections for Precipitation Forecasting. In Proceedings of the CIKM ‘17: 2017 ACM International Conference on Information and Knowledge Management, Singapore, 6–10 November 2017; Association for Computing Machinery: New York, NY, USA, 2017. [Google Scholar]
  12. Wu, K.; Shen, Y.; Wang, S. 3D Convolutional Neural Network for Regional Precipitation Nowcasting. J. Image Signal Process. 2018, 7, 200–212. [Google Scholar] [CrossRef]
  13. Li, P.W.; Wong, W.K.; Lai, E.S.T. RAPIDS—A New Rainstorm Nowcasting System in Hong Kong. In Proceedings of the WMO/WWRP International Symposium on Nowcasting and Very-short-range Forecasting, Toulouse, France, 5–9 September 2005; The Hong Kong Observatory: Hong Kong, China, 2005. [Google Scholar]
  14. Wong, W.K.; Chan, P.W.; Ng, C.K. Aviation Applications of a New Generation of Mesoscale Numerical Weather Prediction System of the Hong Kong Observatory. In Proceedings of the 24th Conference on Weather and Forecasting/20th Conference on Numerical Weather Prediction, American Meteorological Society, Seattle, WA, USA, 24–27 January 2011; The Hong Kong Observatory: Hong Kong, China, 2011. [Google Scholar]
  15. Yessad, K.; Wedi, N.P. The Hydrostatic and Nonhydrostatic Global Model IFS/ARPEGE: Deep-Layer Model Formulation and Testing. In ECMWF Technical Memorandum; European Centre for Medium-Range Weather Forecasts (ECMWF): Reading, UK, 2011. [Google Scholar]
  16. Brown, J.D.; Seo, D.; Du, J. Verification of Precipitation Forecasts from NCEP’s Short-Range Ensemble Forecast (SREF) System with Reference to Ensemble Streamflow Prediction Using Lumped Hydrologic Models. J. Hydrometeor. 2012, 13, 808–836. [Google Scholar] [CrossRef]
  17. Manzato, A.; Pucillo, A.; Cicogna, A. Improving ECMWF-based 6-hours maximum rain using instability indices and neural networks. Atmos. Res. 2019, 217, 184–197. [Google Scholar] [CrossRef]
  18. Dong, Q. Calibration and Quantitative Forecast of Extreme Daily Precipitation Using the Extreme Forecast Index (EFI). J. Geosci. Environ. Prot. 2018, 6, 143–164. [Google Scholar] [CrossRef]
  19. Raftery, A.E.; Gneiting, T.; Balabdaoui, F.; Polakowski, M. Using Bayesian Model Averaging to Calibrate Forecast Ensembles. Mon. Wea. Rev. 2005, 133, 1155–1174. [Google Scholar] [CrossRef] [Green Version]
  20. Hamill, T.M.; Whitaker, J.S.; Wei, X. Ensemble Reforecasting: Improving Medium-Range Forecast Skill Using Retrospective Forecasts. Mon. Wea. Rev. 2015, 133, 1434–1447. [Google Scholar] [CrossRef] [Green Version]
  21. Messner, J.W.; Mayr, G.J.; Wilks, D.S.; Zeileis, A. Extending Extended Logistic Regression: Extended versus Separate versus Ordered versus Censored. Mon. Wea. Rev. 2014, 142, 3003–3014. [Google Scholar] [CrossRef]
  22. Voisin, N.; Schaake, J.C.; Lettenmeier, D.P. Calibration and downscaling methods for quantitative ensemble precipitation forecasts. Wea. Forecast. 2010, 25, 1603–1627. [Google Scholar] [CrossRef]
  23. Zhu, Y.; Luo, Y. Precipitation Calibration Based on the Frequency-Matching Method. Wea. Forecast. 2015, 30, 1109–1124. [Google Scholar] [CrossRef]
  24. Scheuerer, M.; Hamill, T.M. Statistical Postprocessing of Ensemble Precipitation Forecasts by Fitting Censored, Shifted Gamma Distributions. Mon. Wea. Rev. 2015, 143, 4578–4596. [Google Scholar] [CrossRef]
  25. Wilk, M.B.; Gnanadesikan, R. Probability plotting methods for the analysis for the analysis of data. Biometrika 1968, 55, 1–17. [Google Scholar] [CrossRef] [PubMed]
  26. Japan Meteorological Agency. Chapter 4: Application Products of NWP. In Outline of the Operational Numerical Weather Prediction at the Japan Meteorological Agency; Japan Meteorological Agency: Tokyo, Japan, 2013. [Google Scholar]
  27. Li, K.K.; Chan, K.L.; Woo, W.C.; Cheng, T.L. Improving Performances of Short-Range Quantitative Precipitation Forecast through Calibration of Numerical Prediction Models. In Proceedings of the 28th Guangdong-Hong Kong-Macao Seminar on Meteorological Science and Technology, Hong Kong, China, 13–15 January 2014; The Hong Kong Observatory: Hong Kong, China, 2014. [Google Scholar]
  28. Donaldson, R.J.; Dyer, R.M.; Kraus, M.J. An Objective Evaluator of Techniques for Predicting Severe Weather Events, Preprints. In Proceedings of the Ninth Conference on Severe Local Storms, Norman, Oklahoma, OK, USA, 21–23 October 1975; American Meteorological Society: Boston, MA, USA, 1975; pp. 321–326. [Google Scholar]
  29. Wilks, D.S. Statistical Methods in the Atmospheric Sciences, 4th ed.; Elsevier: Cambridge, MA, USA, 2019; pp. 369–483. [Google Scholar]
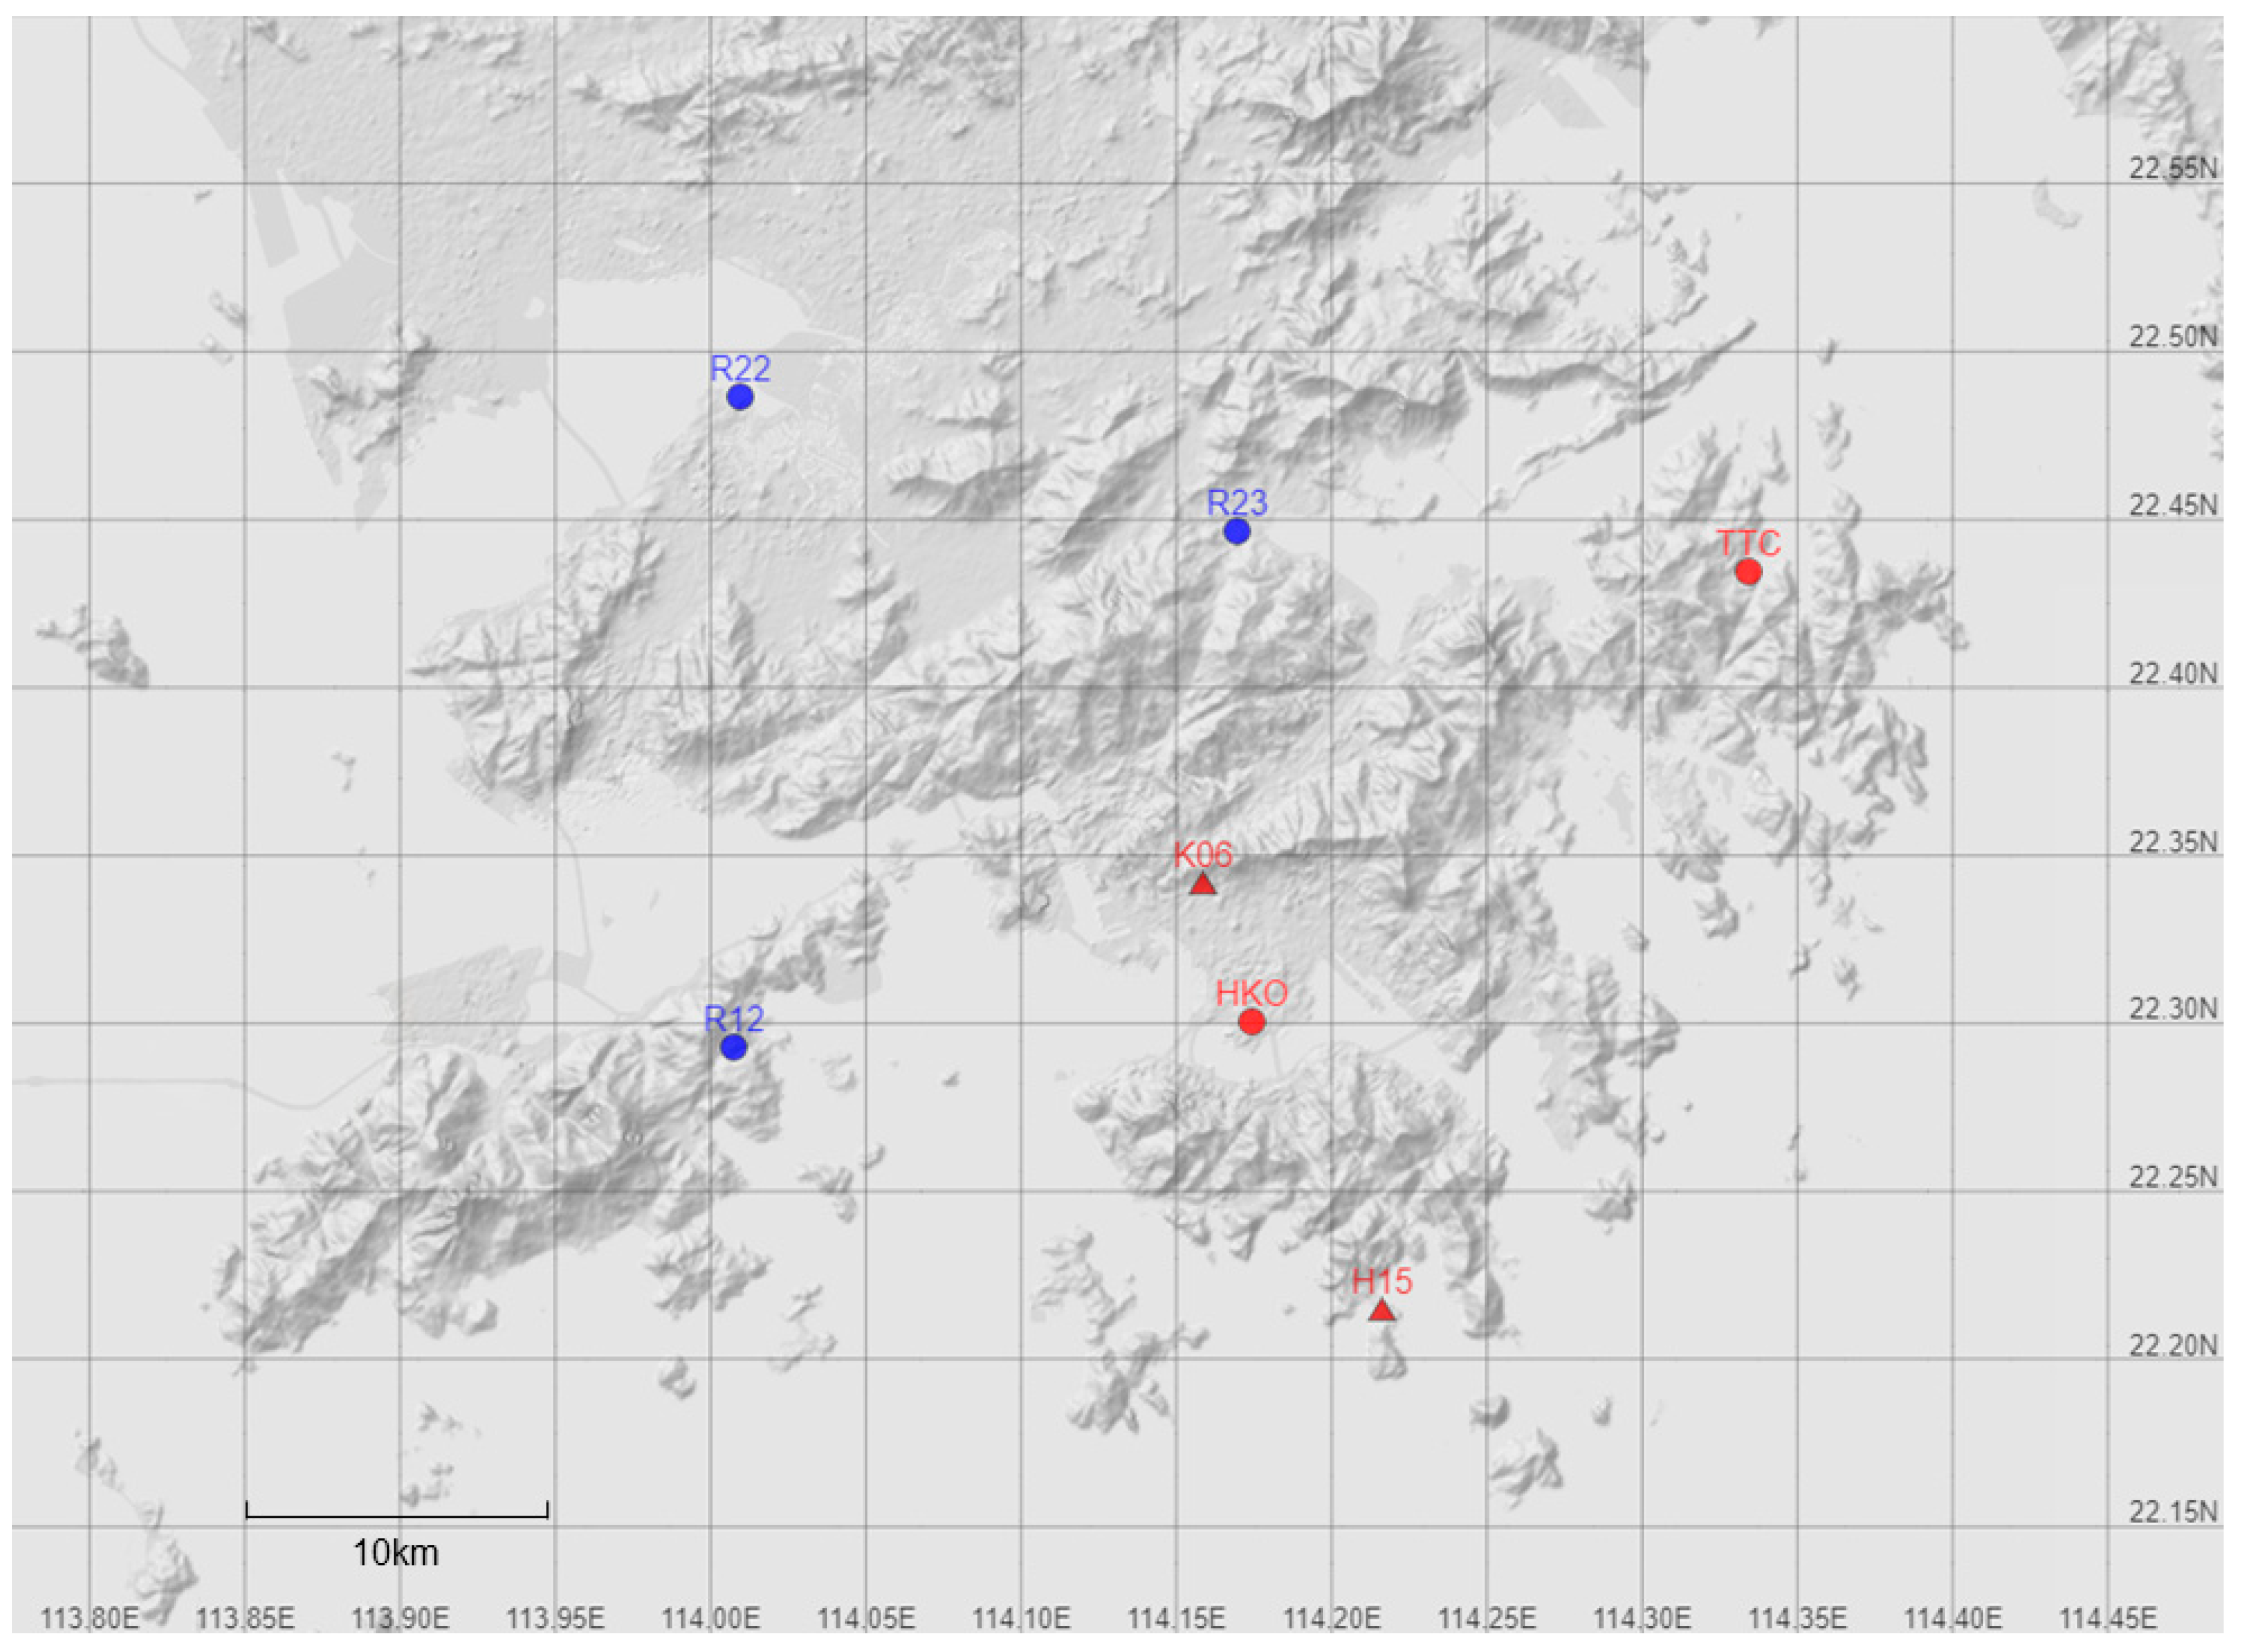
Figure 1. The locations of the rain gauges used for forecast verification (FCV).
Atmosphere 12 00247 g001
Figure 2. The multiplication factor, M, against Direct Model Output (DMO) and time, by calibration method and by model. Grey and black contours are in intervals of 0.2 and 1.0 respectively, starting from 0 at the bottom.
Atmosphere 12 00247 g002
Figure 3. Calibrated values that would be obtained given different DMO values at different times, by calibration method and by model. Grey and black contours are in intervals of 2 and 10 mm respectively, starting from 0 mm at the bottom.
Atmosphere 12 00247 g003
Figure 4. An illustration of the effects on the f-t conversion table considering just an addition or removal of one forecast–observation pair for the Sliding Window method. Values shaded in grey are original f-t pairs which get affected. A removal shares the same cases as an addition but with reversed effects.
Atmosphere 12 00247 g004
Figure 5. Calibrated values which would be obtained given different DMO values at different time by the Sliding Window method covering the two episodes of abrupt changes: (a) the ECMWF episode from 20 May 2015 12 h to 23 May 2015 18 h, and (b) the JMA episode from 17 July 2017 12 h to 22 July 2017 00 h. Grey and black contours are in intervals of 2 and 10 mm respectively, starting from 0 mm at the bottom.
Atmosphere 12 00247 g005
Figure 6. Changes of the forecast–observation pairs inside the sliding window when its head slides through time during the episodes of abrupt changes in calibrated values: (a) the ECMWF episode from 20 May 2015 12 h to 23 May 2015 18 h, subdivided into (a1) from 20 May 2015 12 h and (a2) from 21 May 2015 12 h to 23 May 2015 18 h, and (b) the JMA episode from 17 July 2017 12 h to 22 July 2017 00 h. The green lines connect f-t pairs (solid) at the beginning and (dotted) at the end of the period concerned respectively, so the y-coordinates would approximately be the calibrated forecast for the x-coordinates using the f-t conversion table at that time. Both axes are in square root scale.
Atmosphere 12 00247 g006
Figure 7. The density distribution of percentage errors of DMO and calibrated forecasts, by models and observation intensity categories, at (the upper 6 panels) all lead times, and (the lower 6 panels) specifically lead time of +12 h. The number n at the right-top corner of each panel denotes the number of cases, the difference of which across models is due to data availability. The scale of the horizontal axis is linear from −100 to 100, and logarithmic onwards.
Atmosphere 12 00247 g007
Figure 8. A scatterplot of the percentage error of forecasts calibrated with (red) Adaptive Table, and (blue) Sliding Window method, at (the upper 6 panels) all lead times, and (the lower 6 panels) specifically lead time of +12 h, against that of their corresponding DMO forecasts. The orange lines are y = x, as a reference of no calibrations to DMO forecasts. The number n at the top of each panel denotes the number of cases, the difference of which across models is due to data availability. The scales of both axes are logarithmic with a shift of −101.
Atmosphere 12 00247 g008
Figure 9. Verification results of DMO and calibrated forecasts: (The set of panels on the left) (rows) by using different metrics described in Section 2.4, (columns) for different models with different thresholds; (The set of panels on the right) (rows) by different error statistics, (columns) for different models.
Atmosphere 12 00247 g009
Figure 10. Q-Q plot of the observations against the DMO and the two calibrated forecasts over the verification period. The grey dashed line is y = x, indicating no bias.
Atmosphere 12 00247 g010
Figure 11. A box-and-whisker plot of the error distribution of the DMO and the two calibrated forecasts against observation categories of 5 mm range up to 50 mm for both ECMWF and JMA. Data with observations over 50 mm are not shown due to the small sample size of extreme events. The thicker horizontal line inside the box represents the median. The boxes enclose data between the first quartile (Q1) and the third quartile (Q3). The whiskers extend from the box to the furthest data within 1.5 times the inter-quartile range (IQR = Q3 − Q1). The dots represent outliers which are not reached by the boxes and whiskers. The number n states the number of events falling into the corresponding observation category.
Atmosphere 12 00247 g011
Figure 12. (a,b) The predicted 500 hPa moisture (Relative Humidity (RH) shaded) and wind fields (streamlines) of (a) ECMWF, (b) JMA with base time and forecast time stated in the figures. (c) Ground truth based on ECMWF analysis field of 23 July 12 Z (UTC). (d,e) The 6 h QPF (shaded) from (d) ECMWF and (e) JMA correspond to the mid-level patterns in (a) and (b), respectively. Lines represent isobars.
Atmosphere 12 00247 g012
Figure 13. Radar imagery at 22:30 h on 23 July 2017.
Atmosphere 12 00247 g013
Figure 14. T + 12 6 h FCV rainfall (as the observed truth), the DMO rainfall of ECMWF/JMA and those with frequency-matching methods applied, for 23–24 July 2017.
Atmosphere 12 00247 g014
Figure 15. (a,b) The predicted 500 hPa moisture (RH shaded) and wind fields (streamlines) of (a) ECMWF, (b) JMA for 23 June 2015 00 Z. (c) Ground truth of the same time based on ECMWF analysis field.
Atmosphere 12 00247 g015
Figure 16. Radar imagery at 09:00 h on 23 June 2015.
Atmosphere 12 00247 g016
Figure 17. T + 12 6 h FCV rainfall (as the observed truth), the DMO rainfall of ECMWF/JMA and those with frequency-matching methods applied, for 22–24 June 2015.
Atmosphere 12 00247 g017
Figure 18. Radar imagery at 03:00 h on 21 May 2016.
Atmosphere 12 00247 g018
Figure 19. T + 12 6 h FCV rainfall (as the observed truth), the DMO rainfall of ECMWF/JMA and those with frequency-matching methods applied, for 20–21 May 2016.
Atmosphere 12 00247 g019
Figure 20. (a,b) The predicted 850 hPa moisture and wind fields of (a) ECMWF, (b) JMA for 20 May 2016 18 Z. (c) Ground truth of the same time based on ECMWF T + 6 h forecast. ECMWF indicated a deeper vortex over Guangdong and stronger southwesterly flow as a result of alignment of features.
Atmosphere 12 00247 g020
Table 1. An example of the f-t conversion table (this is the f-t table of the Adaptive Table method for ECMWF as on 1 January 2014 00 h, the start of the verification period).
f
(Sorted Past Forecasts, DMO)
(mm)
t
(Sorted Past Observations, Calibrated Value)
(mm)
0.00.0
0.80.1
1.00.2
1.20.3
1.30.4
1.50.5
2.31.0
3.01.5
3.42.0
3.82.5
4.03.0
4.23.5
4.54.0
4.74.5
5.05.0
5.66.0
6.07.0
6.68.0
6.99.0
7.510.0
9.415.0
10.820.0
14.430.0
16.740.0
20.150.0
25.460.0
Table 2. A 2 × 2 contingency table of observed and forecast events.
Event Observed
YesNo
Event ForecastYesab
Nocd
Publisher’s Note: MDPI stays neutral with regard to jurisdictional claims in published maps and institutional affiliations.