Article

A Comparative Electrochemical and Morphological Investigation on the Behavior of NiCr and CoCr Dental Alloys at Various Temperatures

by
Florentina Golgovici
1,
Mariana Prodana
1,
Florentina Gina Ionascu
1 and
Ioana Demetrescu
1,2,*
1
Department of General Chemistry, Faculty of Applied Chemistry and Materials Science, University Politehnica of Bucharest, Spl. Independentei 313, 060042 Bucharest, Romania
2
Academy of Romanian Scientists, 3 Ilfov, 050044 Bucharest, Romania
*
Author to whom correspondence should be addressed.
Metals 2021, 11(2), 256; https://doi.org/10.3390/met11020256
Submission received: 11 December 2020 / Revised: 25 January 2021 / Accepted: 29 January 2021 / Published: 3 February 2021
(This article belongs to the Section Metallic Functional Materials)

Abstract

:
The purpose of our study is to compare the behavior of two reprocessed dental alloys (NiCr and CoCr) at different temperatures considering the idea that food and drinks in the oral cavity create various compositions at different pH levels; the novelty is the investigation of temperature effect on corrosion parameters and ion release of dental alloys. Electrochemical stability was studied together with morphology, elemental composition and ions release determination. The results obtained are in good concordance: electrochemistry studies reveal that the corrosion rate is increasing by increasing the temperature. From SEM coupled with EDS, the oxide film formed on the surface of the alloys is stable at low temperatures and a trend to break after 310K. ICP-MS results evidence that in accordance with increasing temperature, the quantities of ions released from the alloys immersed in artificial saliva also increase, though they still remain small, less than 20 ppm.

1. Introduction

In the long history of dental biomaterials, precious and nonprecious metals and alloys with Au, Ag, Ti, Fe, Cr, Co, Al, have been frequently selected due to their numerous favorable, chemical, biological physical features as well as mechanical properties [1,2,3,4]. These materials have significant mechanical properties, such as stiffness strength and corrosion resistance and are more easily used and cheaper to elaborate; processed CoCr and NiCr alloys are still frequently investigated and used in dental laboratories as convenient choices for restorative dental works such as crow, bridge, and denture bases [5,6,7,8,9]. Extended use of metals as regenerative biomaterials starting the end of the last century has led to a strong development of titanium and titanium alloys materials introducing intensive binary and ternary alloys with Al, Nb, V, and Zr as selected alloys [10,11,12]. Due to an easier processing method in common dental restorative works, NiCr and CoCr alloys remain widely used.
The main aim of the above cited papers was to determine the corrosion behavior of dental alloys in various media, starting from the idea that food and drinks in the oral cavity introduce various compositions establishing different pH levels ranging from acid to basic values [6]. Corrosion of dental alloys in the intra-oral cavity is leading not only to the deterioration of restorative works, but also involves a release of ions that is related to their biocompatibility [13]. In the literature, there are few data [14] about corrosion resistance properties of Co-Cr alloys which have been enhanced at various temperatures compared to those relating to Ni-Cr alloys; however, the results are incomplete and need extensive investigations especially nowadays when discussion about their toxicological risks are more aggressive. Considering that commercial dental alloys are the subject of a reprocessing treatment as a step-in denture restorative works fabrication, corrosion before and after such procedures has been widely investigated [15,16,17]. Based on experimental data, it was established that thermal reprocessing effects lead to the enhancement of commonly used dental commercial alloys and their demerits regarding corrosion and biocompatibility [17]. As an example, recasting of alloys increased cytotoxicity level including ion release from NiCr and CoCr alloys; CoCr alloys were more adversely affected by the recasting than the NiCr alloys [18]. Regarding electrochemical stability after reprocessing in various environments, a decrease in corrosion rate common for both types of alloys NiCr and CoCr, respectively, was observed. It is important to mention as a demerit for the use that Nickel is the common sensitizer amongst all metals [19,20]. Due to the toxicity of cobalt and the allergic reactions caused by Ni [21], the necessity to eliminate CoCr and NiCr from dentistry has arisen [22]. The prevalence of nickel allergy has been estimated up to 28.5% of the general population and cannot be considered as low potential risk [23,24,25]. Toxicological risks of the cobalt–chromium alloys used in dentistry are a part of new EU Medical Devices Regulation (MDR) (2017/745) which will be applied in May 2021 [26]. With the new regulation, Co metal will be considered carcinogenic, mutagenic, and a substance toxic to reproduction [27]. The novelty of the present work is related to the investigation of temperature effect on corrosion and ion release of reprocessed NiCr and CoCr dental alloys. The selected temperature range of study between 290 and 330 K includes the frequent temperatures temporarily existing in the oral cavity [28].
We do believe that the large use of restorative works in dentistry and the dynamic change of temperature in the oral cavity due to food and drinks consumed lead to a need of gain more knowledge about the behavior of such alloys at different temperatures. The increase in dental health problems related to electrochemical dealloying supports [29] the need of such a complete study. The alternative of less incriminated metals is good to promote [30]. Based on an electrochemical stability research at various temperatures, together with a morphology, elemental composition and ions release determination, a helpful conclusion in properly selecting alloys as a function of exploitation conditions and preserving metallic dental works could be established and proposed.
Simultaneously with the trend to eliminate CoCr and NiCr use due to toxicological risks evidenced in EU regulations which has a relatively slow rate, more evaluation of their ion release seems to be worthy of investigation more recently [31]. Examples include alternative strategies to reduce heavy metals risk for dental health improving the CoCr alloys’ quality by changing their composition [30], coating their surface [32] and new advanced technologies in obtaining CoCr for dentistry [33], as an expression of Health Research and Development [34].

2. Materials and Methods

2.1. Materials

For this research, one type of NiCr alloy and one type of CoCr alloy were used: NiCr alloys was from DFS Company from Germany and CoCr alloy was provided from Bego Company, Germany. Both alloys are commercial alloys used in dental medicine with a composition presented in Table 1.
Before electrochemical measurement, both types of studied alloy were subjected to thermal reprocessing. Samples of cylindrical shape purchased from the two companies, with a diameter of 0.8 cm and height of 2 cm, were casted according to manufacturer’s recommendations using a laboratory lost wax technique. A centrifugal casting induction foundry machine and ceramic crucibles were used to melt and cast the samples. [36,37]. The samples obtained had a disc shape with a diameter of 2 cm. The weight of the samples was 3.42 ± 0.15 g. The number of each sample used for all experiments is 5. Then, all the samples were wet grinded with SiC paper of 350, 800 and 1200 grits. After polishing, the NiCr and CoCr alloys were washed with water and ultrasonicated for 10 min in acetone to remove impurities on the surface because of polishing and drying at room temperature. As always, the surface exposed to electrochemical testing was 1 cm2.
Testing electrolyte was artificial Fusayama–Meyer saliva with the following composition: KCl (0.4 g/L, NaCl (0.4 g/L), CaCl2 × 2H2O (0.906 g/L), NaH2PO4 × 2H2O (0.690 g/L), Na2S × 9H2O (0.005 g/L) and urea (1 g/L). The pH of such solution is 5.8 [38]. Each time, a volume of 20 mL electrolyte was used.
The morphology of the samples, by SEM analysis, before the electrochemical testing is shown in Figure 1. Secondary electron images were acquired at different magnifications: 30× and 1k×. The surface of the samples is smooth and homogeneous. There is no well-defined structure that is visible on the surface before the electrochemical procedure. The surface of both alloys looks “clean”.

2.2. The Electrochemical Procedures

The electrochemical tests have been open circuit potential determination, Tafel procedure and electrochemical impedance spectroscopy (EIS). The electrochemical measurements were performed on AutoLab PGSTAT 12 EcoChemie potentiostat/galvanostat (Radiometer Analytical SAS, Lyon, France), at various temperatures ranging from 290 K until 330 K. The potentiodynamic polarization tests have been performed starting from cathodic region with very low scan rate of 2 mV/s [22]. EIS characterization was carried out within 105 Hz and 10−2 Hz frequency range, with an ac voltage amplitude of 10 mV at open circuit potential. The impedances were represented as Nyquist and Bode spectra.
All electrochemical experiments were performed with a classical electrochemical three-electrodes cell (Metrohm, Bucharest, Romania) as follows: a Pt plate for counter electrode Ag/AgCl, KCl system as reference electrode and working electrode.

2.3. Surface Analysis and Ion Release

The surface morphology of NiCr and CoCr alloy after potentiodynamic polarization in artificial saliva at different temperatures was studied by scanning electron microscopy (SEM, model Quanta 650 FEG from FEI company) (Hillsboro, OR, USA) at a pressure of 0.7 torrs at 10 and/or 15 kV. EDS analyses were performed to identify the elemental composition of the samples.
To get information about the hydrophilic/hydrophobic properties of the studied alloy, the static contact angles were measured. These measurements were performed using a contact angle CAM 100 equipment (KSV Instruments Ltd, Helsinki, Finland) and the same solution as for electrochemical measurements. Five measurements on five different areas of the same specimen were made [39].
Ions release was quantified using inductively coupled plasma mass spectrometry (ICP-MS), work that has been carried out under constant temperature and humidity conditions of an ELAN DRC-e ICP-MS equipment from Perkin Elmer Company (Waltham, MA, USA). The conditions were ensured by working in an atmosphere free from contaminants of clean class ISO class 7 enclosures.
For electrochemical tests, but also for EDS and ICP-MS measurements, statistical analyzes were performed.

3. Results and Discussion

3.1. Electrochemichal Characterization

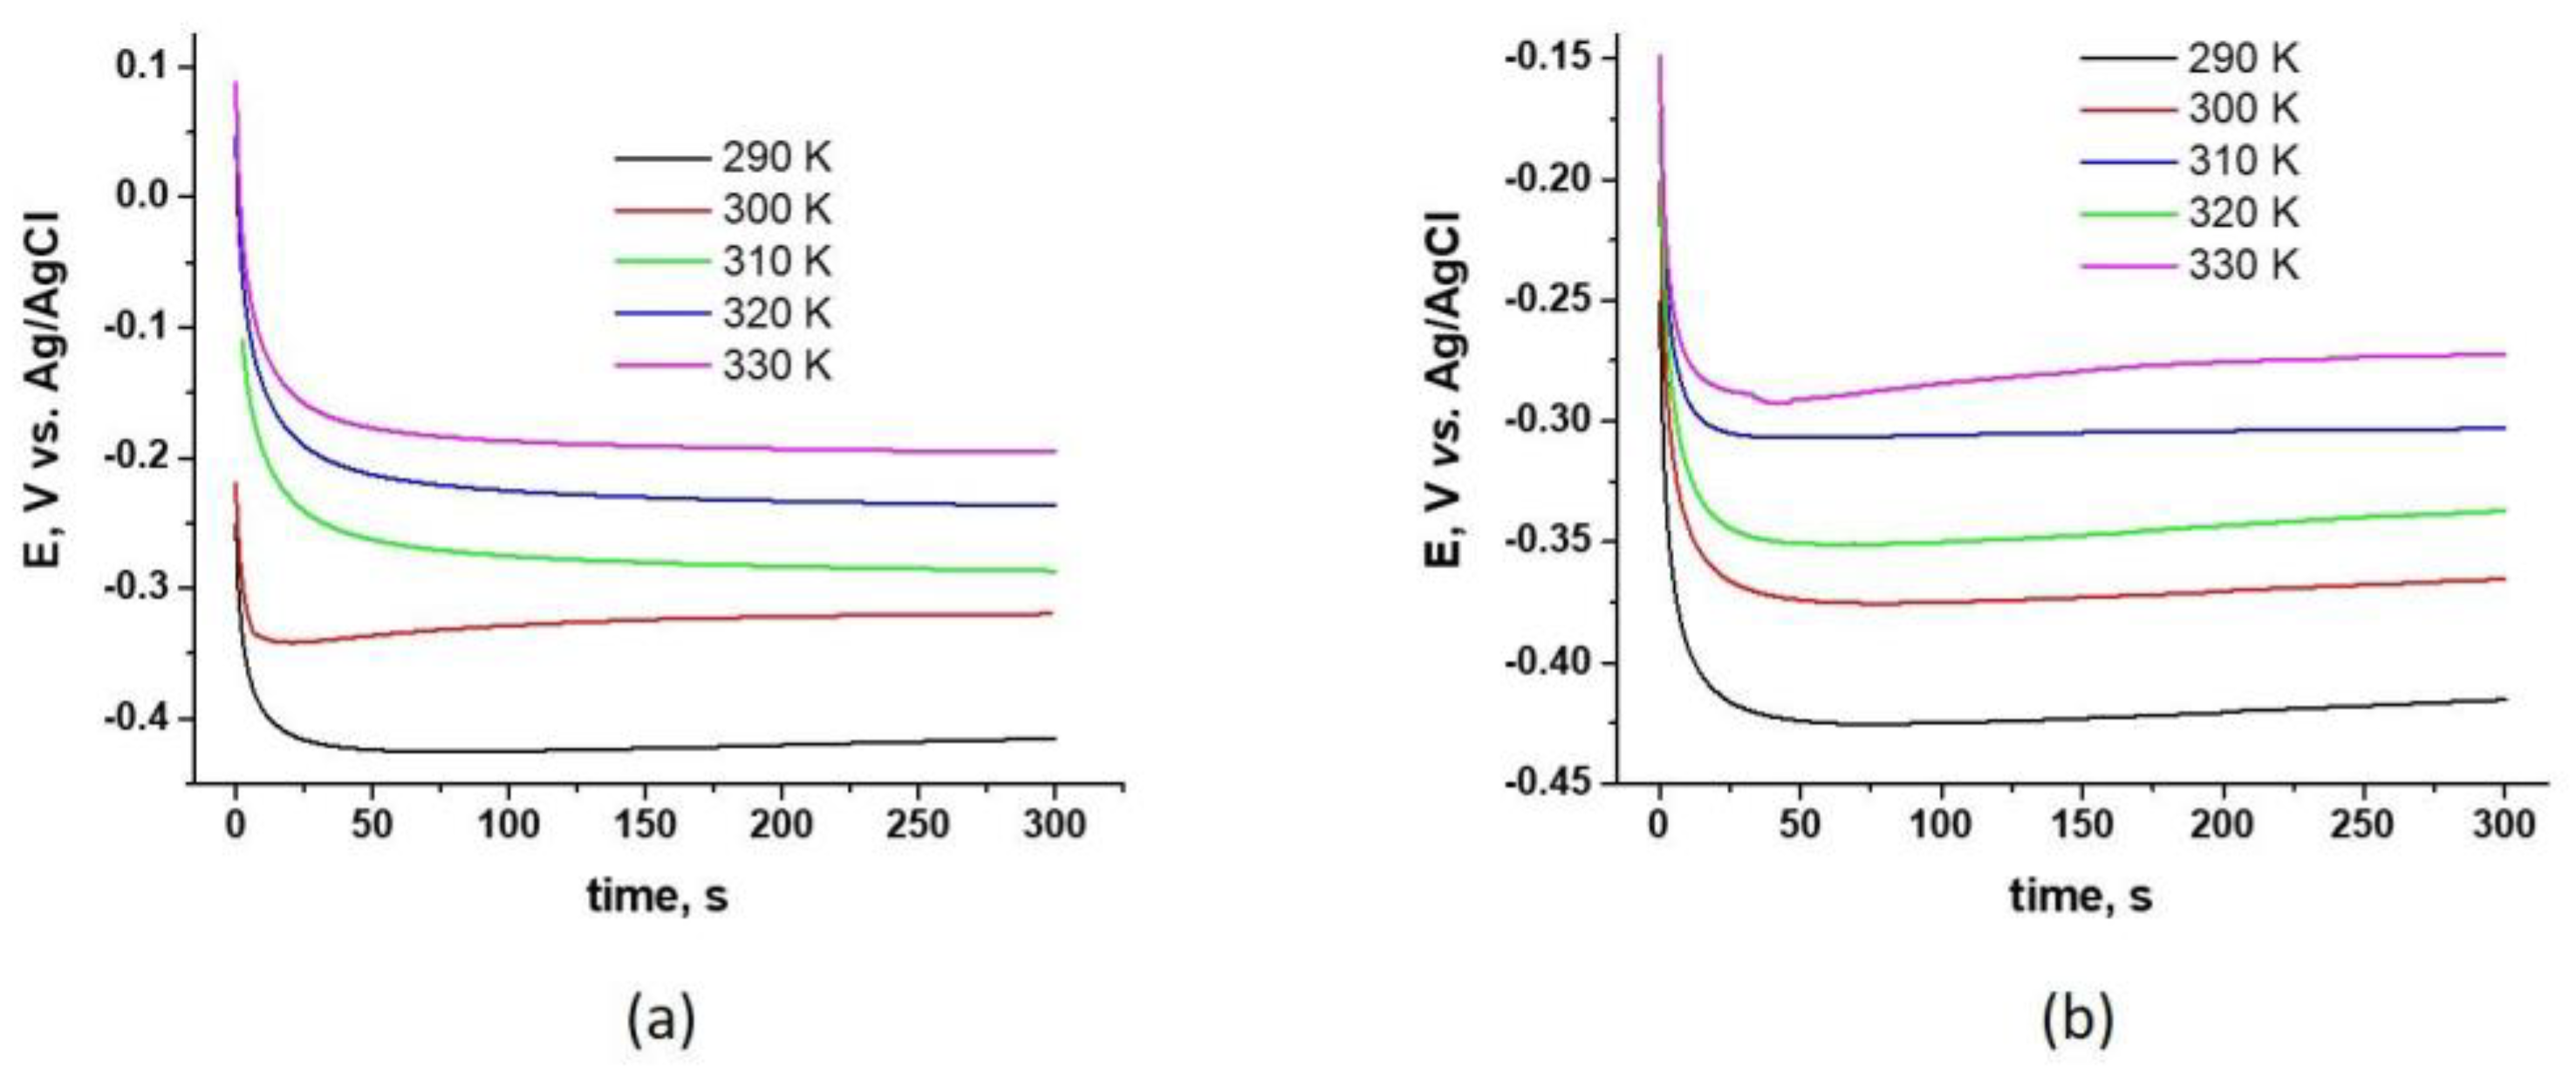
3.1.1. Open Circuit Potential Tests

Open circuit potential (OCP) measurements were made for 10 min for NiCr as well as for CoCr alloy. As we can see in Figure 2, in the first seconds of immersion in artificial saliva the potential values shift rapidly towards electronegative values. This first stage is followed by a much slower movement towards electronegative values, ending with a plateau. As can be observed from Figure 2, for both studied alloys, the stable value of the reached potential has increasingly electropositive values as the temperature of the artificial saliva increases.
It is important to mention that such aspects of potential variation in time for both dental alloys represent a trend to stable state in short terms with the formation of specific oxide films [40]. In the case of CoCr, the mixture of oxides is of all present elements meaning Co, Cr, Mo, Mn, W and Ga. In the case of NiCr alloy, the film contains oxides of Ni, Cr, Mo, Si and Fe.

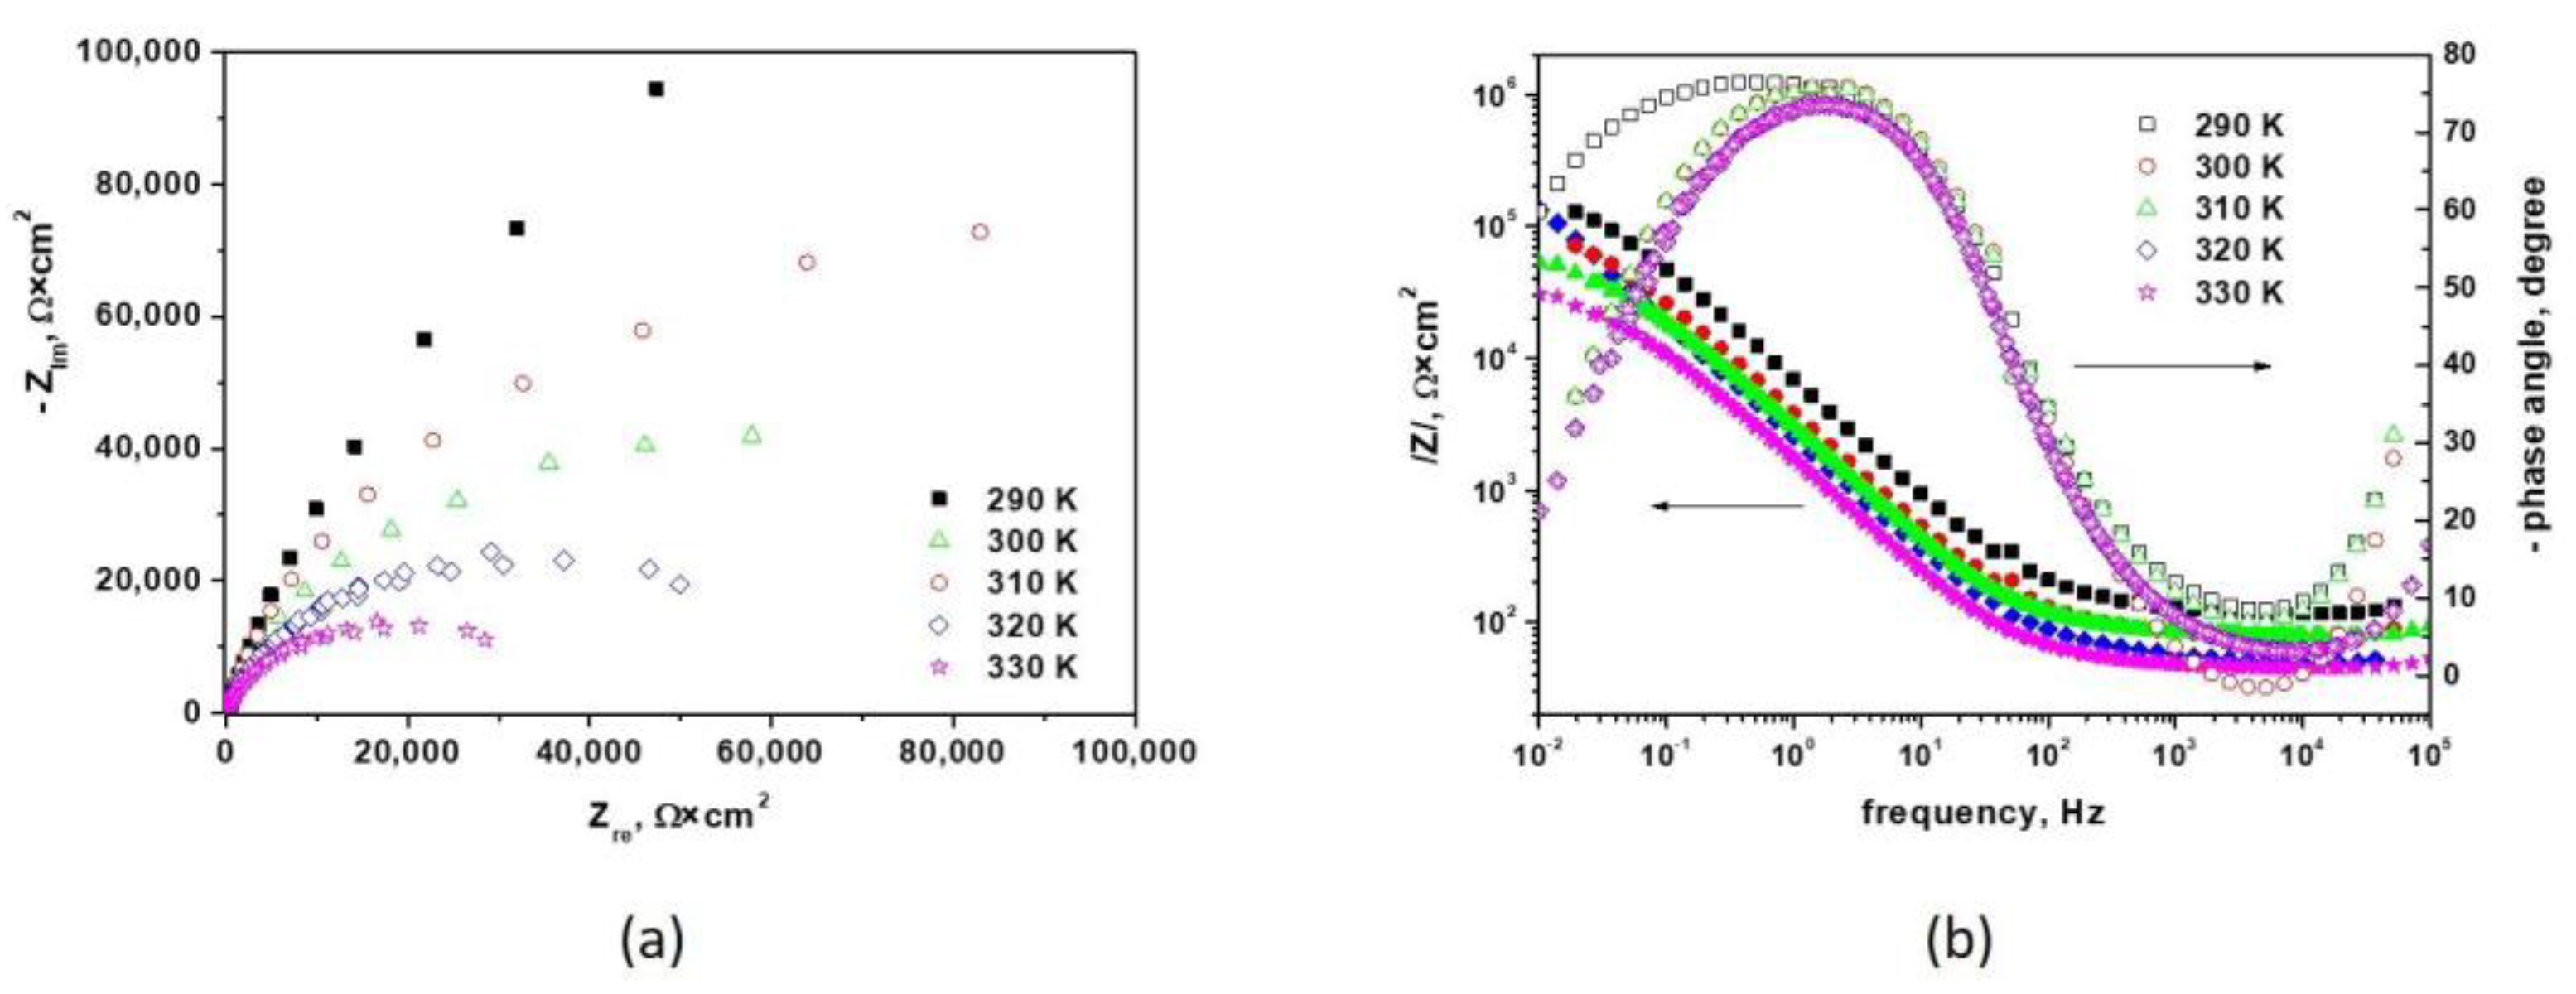
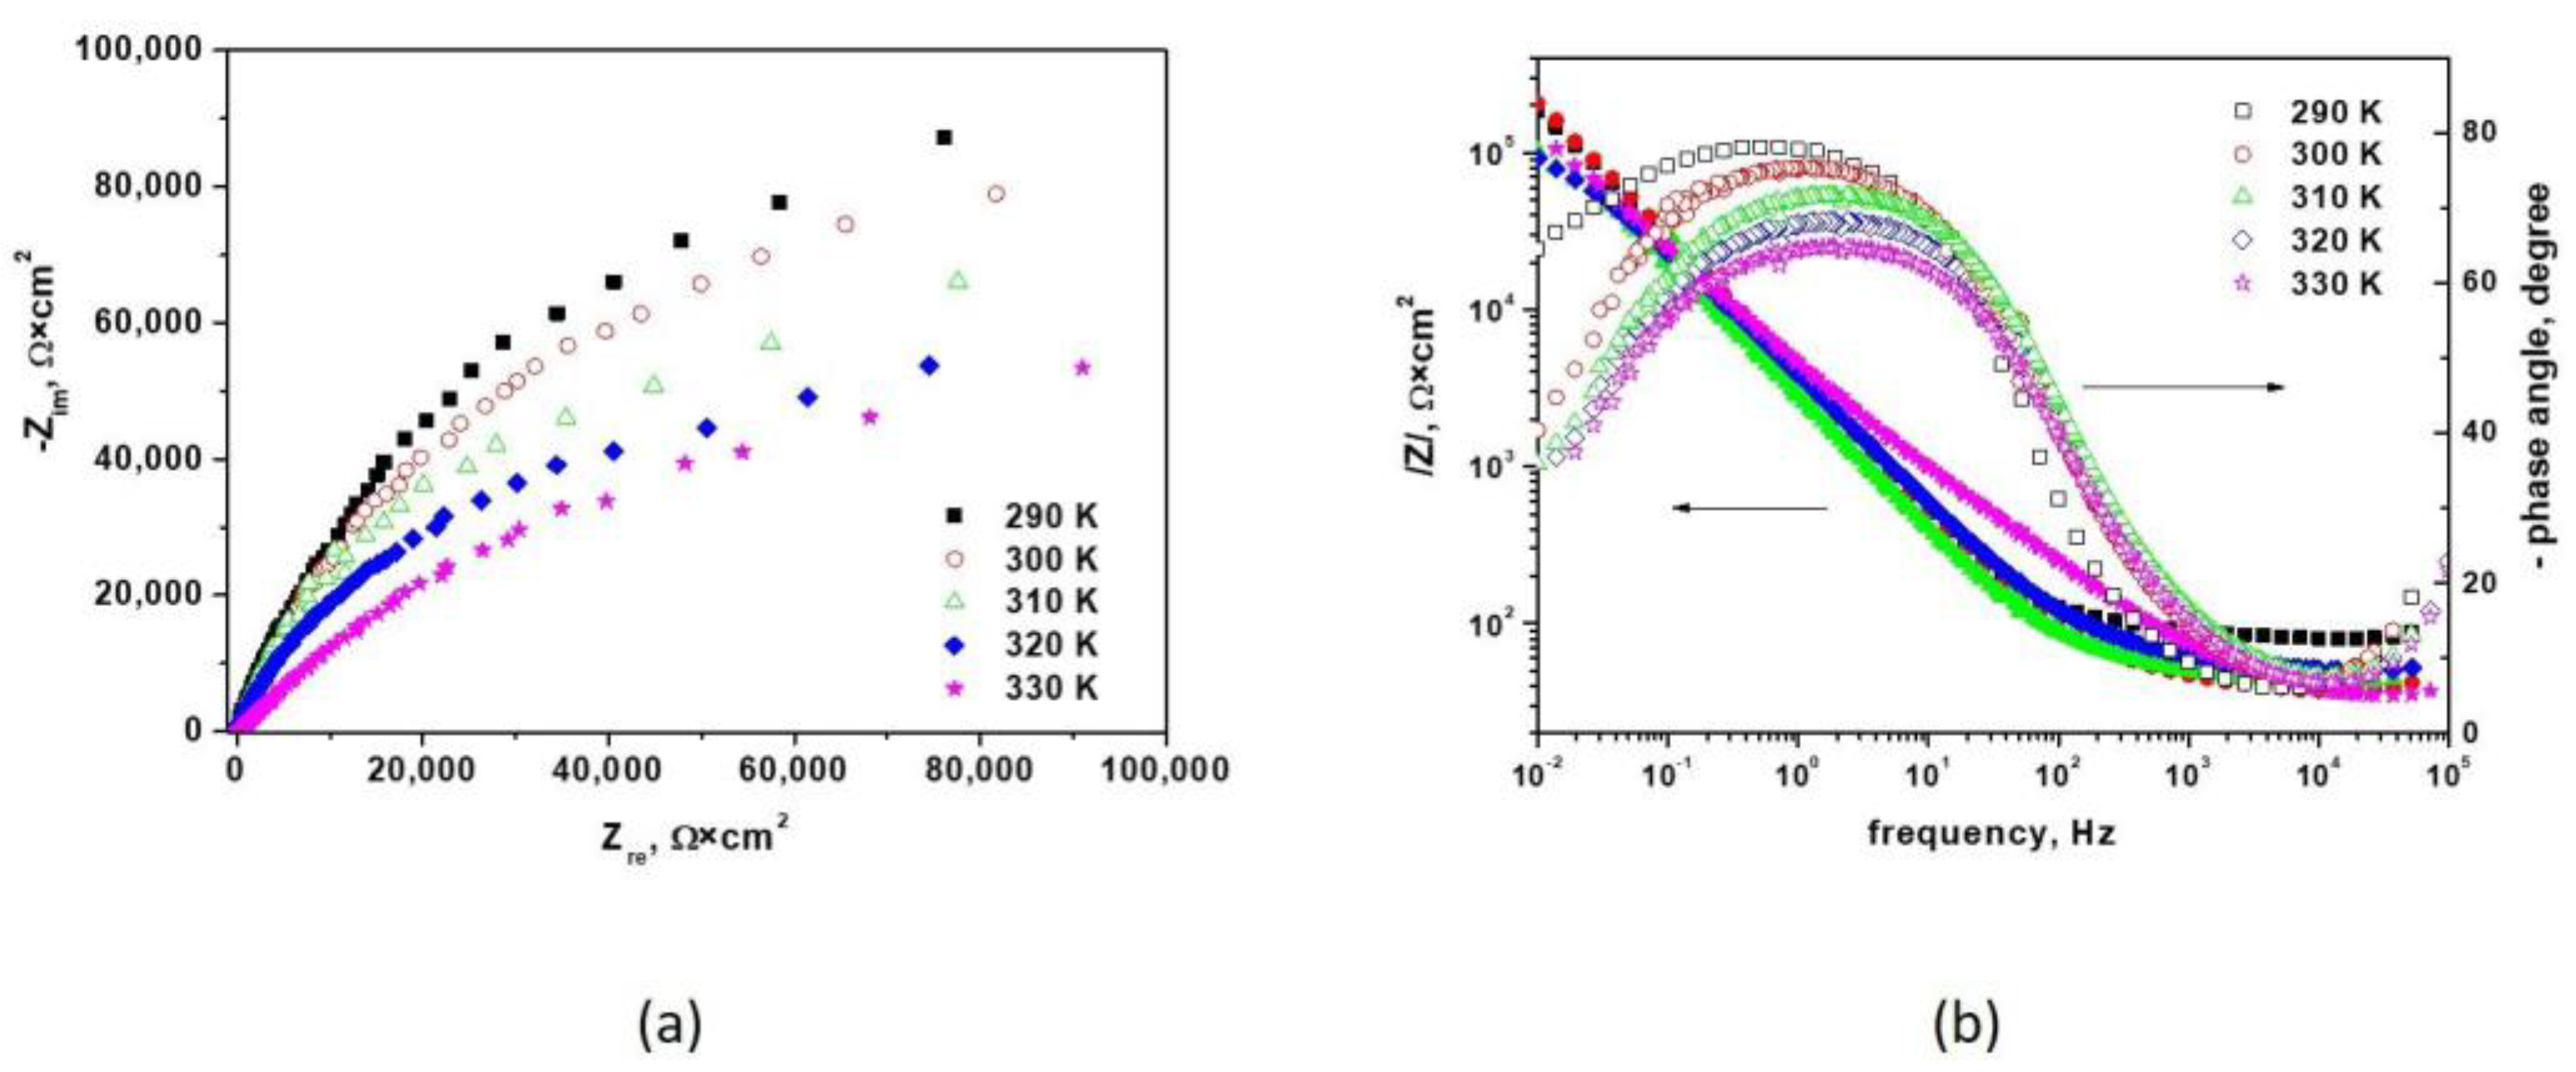
3.1.2. Electrochemical Impedance Spectroscopy Measurements

The NiCr and CoCr alloys behavior was also studied by electrochemical impedance measurements at open circuit potential after 10 min of immersion in Fusayama–Meyer artificial saliva. Electrochemical impedance spectroscopy (EIS) tests for NiCr alloy in artificial saliva have led to the recording of the spectra presented in the Nyquist and Bode diagrams as we can see from Figure 3. As we can see from the Nyquist diagrams (Figure 3a), a single open capacitive appears. The diameters of semicircles decrease with temperature increase, indicating a decrease in polarization resistance value, which leads to an increase in the corrosion rate. The Bode diagram (Figure 3b) reveals the presence of one single time constant corresponding to the capacitive semicircles from the Nyquist diagrams. As we can observe, the maximum phase angle moves to higher frequencies and decreases slightly once the temperature of artificial saliva increases. The decrease in the maximum phase angle values from −75° to −70°, indicate the corrosion of NiCr alloy.
Electrochemical impedance spectroscopy (EIS) tests were also made for CoCr studied alloy in artificial saliva. In Figure 4, Nyquist and Bode diagrams are presented and in this case, a single open capacitive semicircle can be seen in the Nyquist diagram (Figure 4a), the diameter of which decreases as the temperature of the saliva increases. This indicates a decrease in polarization resistance value, which leads to an increase in the corrosion rate. Correspondingly, on the Bode diagram (Figure 4b), the presence of one single time constants can be observed. The maximum phase angle moves to higher frequencies and decreases slightly once the temperature of artificial saliva increases. The decrease in the maximum phase angle values from −81° to −62° is more pronounced than in the case of NiCr alloy.

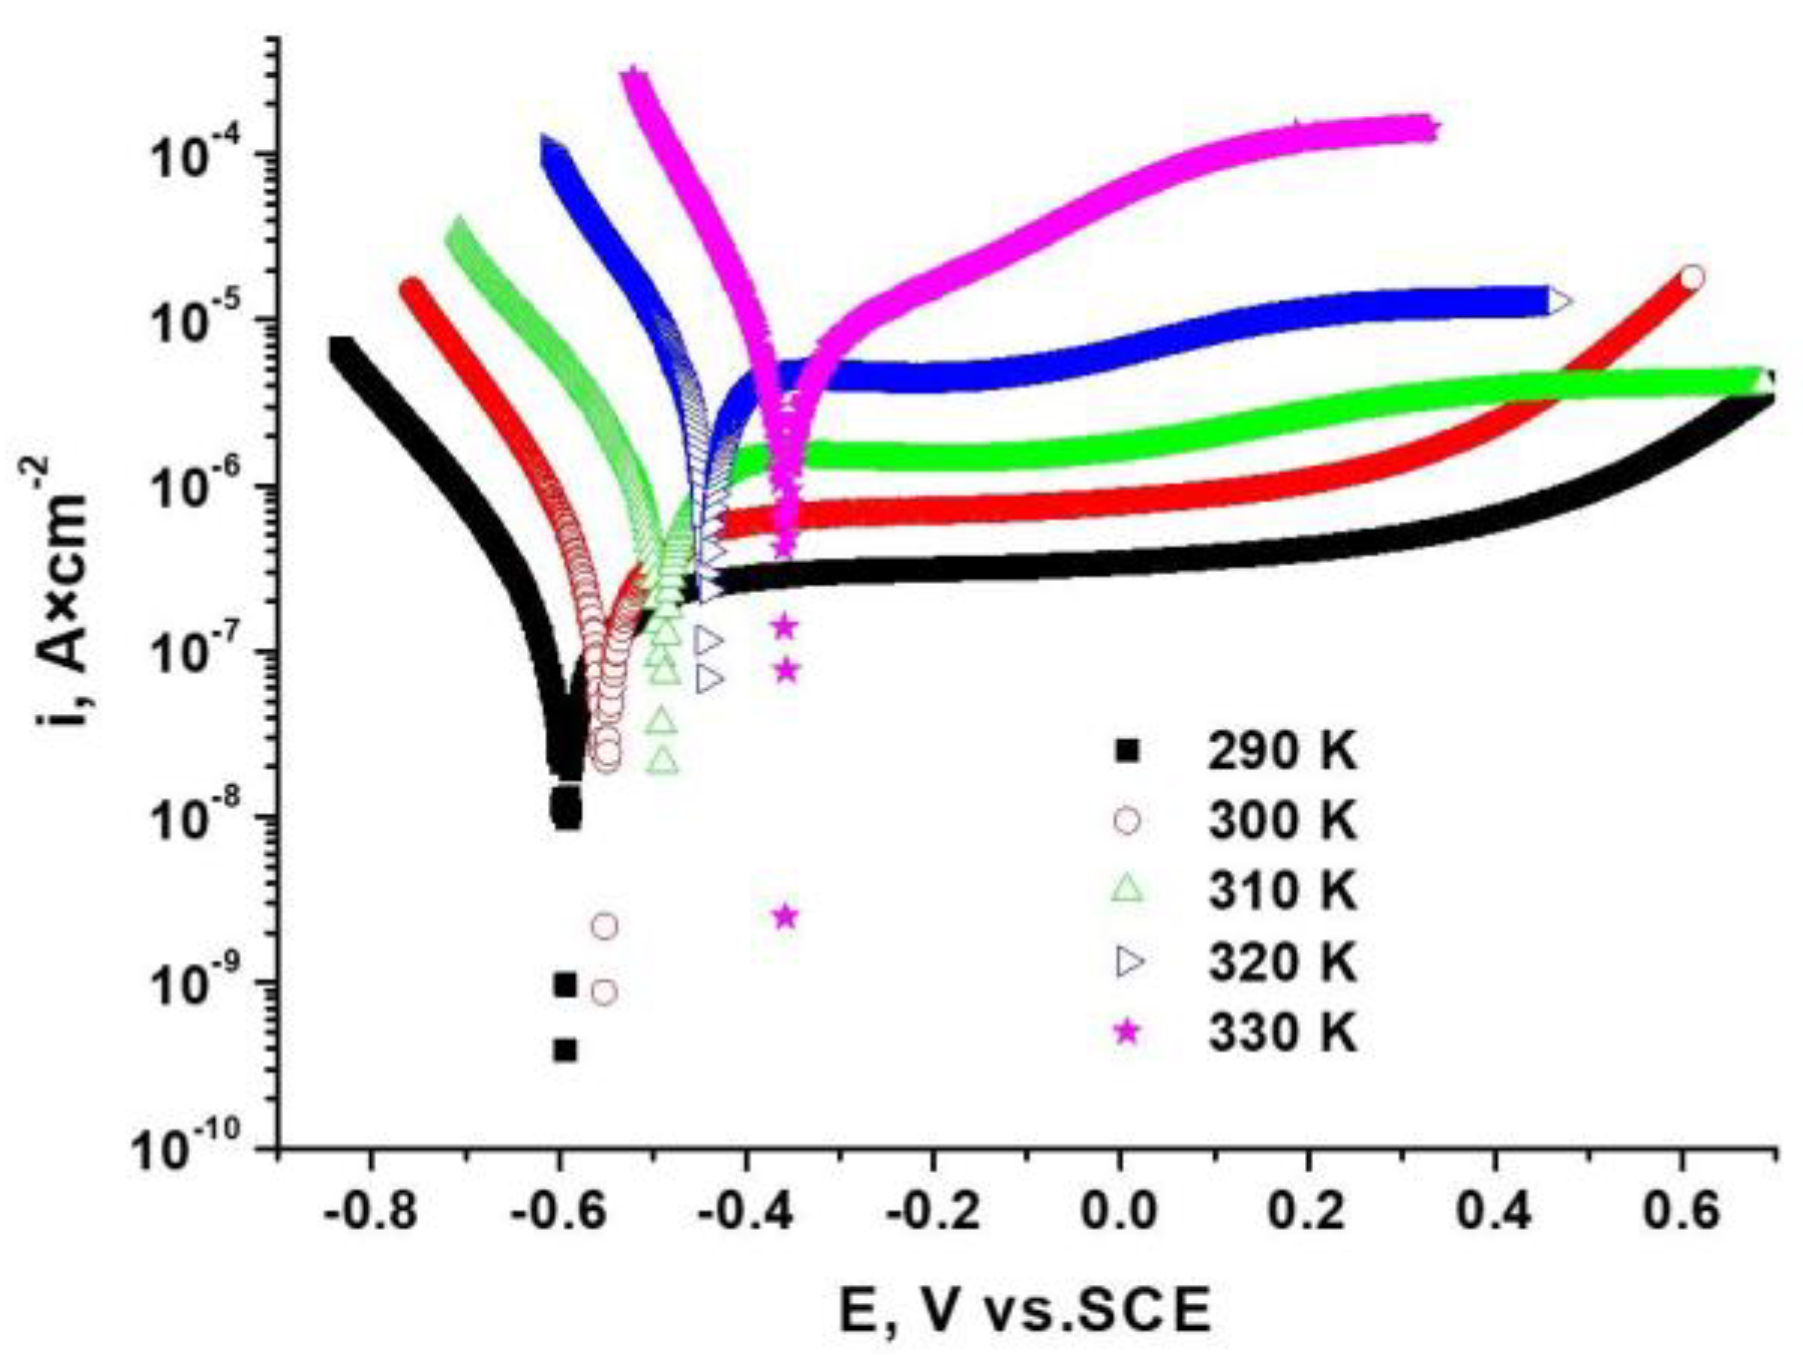
3.1.3. Potentiodynamic Tests

The next step was to record the polarization curves for both studied alloys. First, the NiCr alloy behavior in Fusayama–Meyer artificial saliva at different temperatures using the potentiodynamic polarization method was studied. The increase in the corrosion current density values, once the temperature of the electrolyte increase, can be observed. In addition, a shift of corrosion potential towards electropositive values with increase in the temperature can be seen from Figure 5.
The same type of behavior can be seen in Figure 6 for the CoCr studied alloy. The increase in temperature leads to an increase in the corrosion current density, indicating a more accelerated corrosion of this artificial saliva alloy. For these alloys, a passive region was observed. The decrease in the passive range occurs with the increase in the electrolyte temperature.
Corrosion kinetic parameters obtained from these polarization curves shown in Figure 4 and Figure 5 were calculated using two methods: Tafel slopes extrapolation and polarization resistance. The values obtained for the corrosion potential (Ecorr), corrosion current density (icorr), the anodic (Ba) and cathodic (Bc) slope, polarization resistance (RP) are shown in Table 2. The results showed similar values for the corrosion current density, regarding the method used for the analysis. Statistical analyses were performed for all parameters and they are presented as mean ±1 standard deviation.
The two methods yielded similar values of corrosion current density. The polarization resistance decreases for the studied alloys with the increase in the temperature of the electrolyte, indicating an increase in the corrosion rate of each of the biomaterials in Fusayama–Meyer artificial saliva.
The obtained results are in accordance with the data from the literature, according to which the CoCr-type alloys have a better corrosion behavior than the NiCr-type alloys [16,41]. The presence of chromium, tungsten, and molybdenum leads to passivation, which leads to improved corrosion performance of alloys containing these elements [42].
It is well known that Cr improves the corrosion resistance of alloys in a corrosive environment due to the formation of a Cr-rich, passive oxide film Cr2O3 formed on the alloy surface. The Cr content determines passive film stability. A higher content of Cr2O3 and MoO3 in the passive film leads to a significant resistance to metal ion transfer through the passive film. The uniform distribution of Cr is important for better corrosion resistance compared with Cr2O3. Regarding the oxide of nickel which is more porous and has less protective ability against corrosion, it is important to mention that the film zones, rich in NiO, will act as weak regions for localized corrosion, causing dissolution of Ni-rich phases [43].

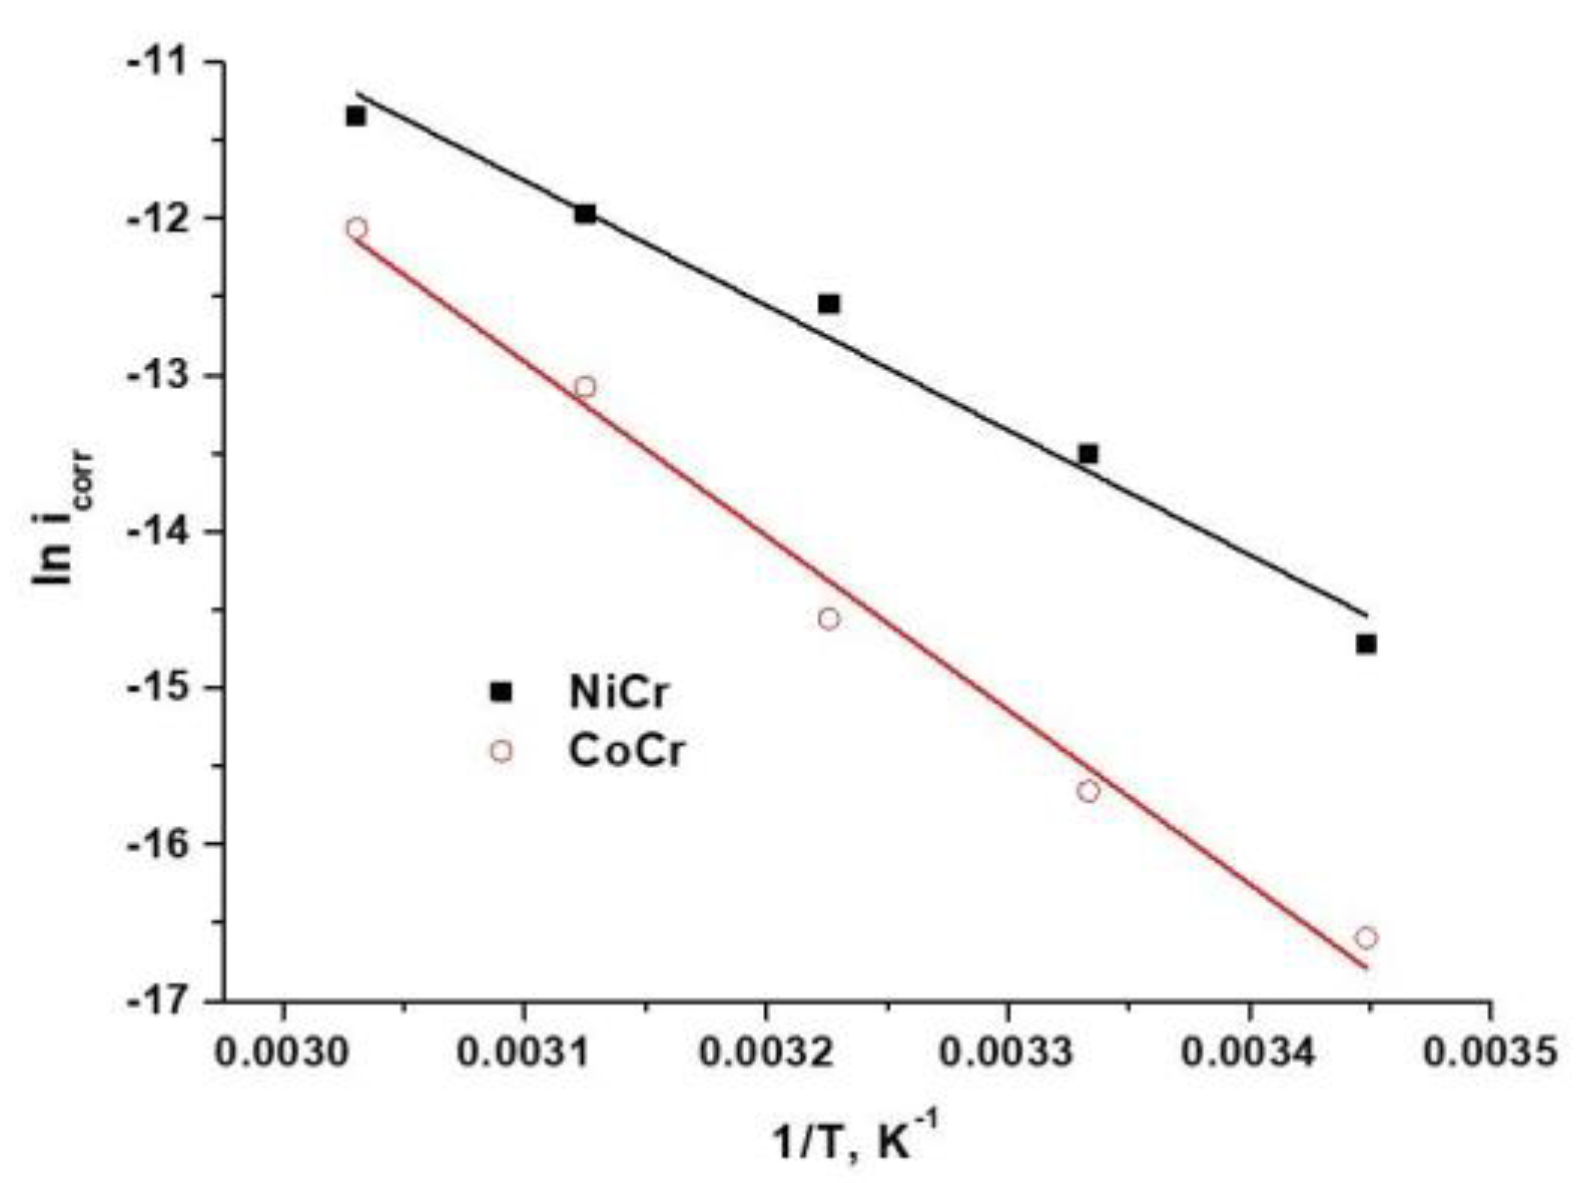
3.1.4. Calculation of the Kinetic Corrosion Parameters from Activation Energies

Usually, the rate of most chemical reactions increases with increasing temperature. In the case of electrochemical reactions, the increase in temperature favors the kinetics of the corrosion reactions, more precisely the speed of the anodic dissolution reaction of the metal increases. The value of the activation energy of the corrosion processes can be obtained from the Arrhenius-type graphs [44], which follow the following equation:
i c o r = A e E a R T
where Ea is the process activation energy expressed in J/mol, R is the universal gas constant (8.314 J/(mol K)), T is the temperature in K, and A is a constant also called pre-exponential factor. If the Arrhenius equation is logarithmic, the following expression is obtained:
ln i c o r = l n A   E a R T
Thus, the value of the activation energy can be determined from Figure 7 and the obtained values are shown in Table 3.
The activation energy of an electrochemical process refers to the energy level that an electron must reach to pass through the electrode/electrolyte interface. Thus, a low value of the activation energy indicates a high corrosion rate. Moreover, the Arrhenius equation shows that the higher the value of the activation energy, the greater the dependence of corrosion rate as a function of temperature.
As can be seen from the slopes of the lines shown in Figure 6, but also from the activation energy values (Table 3), the highest activation energy value is recorded in the case of CoCr alloy.
Obtaining the highest values in the case of CoCr alloy was expected because the values for the corrosion current density are the lowest at the different temperatures studied. Thus, the data previously obtained from the polarization curves are reconfirmed.
Arrhenius’ theory bears some resemblance to the theory of collision activation [45]. The reaction takes place when the molecules collide with each other. The increasing rate of reaction at higher temperatures represent, in collision theory, the chance of more frequent active collisions. The mathematical form of the transition state theory can be written:
i c o r = R T N h e Δ H R T e Δ S R
where ΔH is the enthalpy of the activation process, ΔS is the entropy of the activation process, N is Avogadro’s number (6.022 × 10²³ mol−1 molecules) and h is Plank’s constant (6.626 × 10⁻³⁴J s mol−1). If the equation is rearranged in the form:
ln ( i c o r T ) = ln ( R N h ) + Δ S R Δ H R T
A linear dependence can be obtained from which the values of enthalpies and entropies of the activation process are calculated (Figure 8).
The values obtained for the three parameters (activation energy, enthalpy, and entropy) for the two biomaterials studied in artificial saliva are presented in Table 3.
The enthalpy and entropy values of the activation process for both studied alloys are presented in Table 3. The lowest enthalpy value (ΔH) is obtained for NiCr alloy. This observation indicates that the corrosion reaction in Fusayama–Meyer artificial saliva of NiCr alloy requires a lower energy value to occur compared to the corrosion processes of the other alloy. It can be said that the transition state is obtained faster in case of NiCr alloy corrosion. The positive values obtained for the enthalpies of the studied corrosion processes indicate that the dissolutions of the studied biomaterials are endothermic processes.

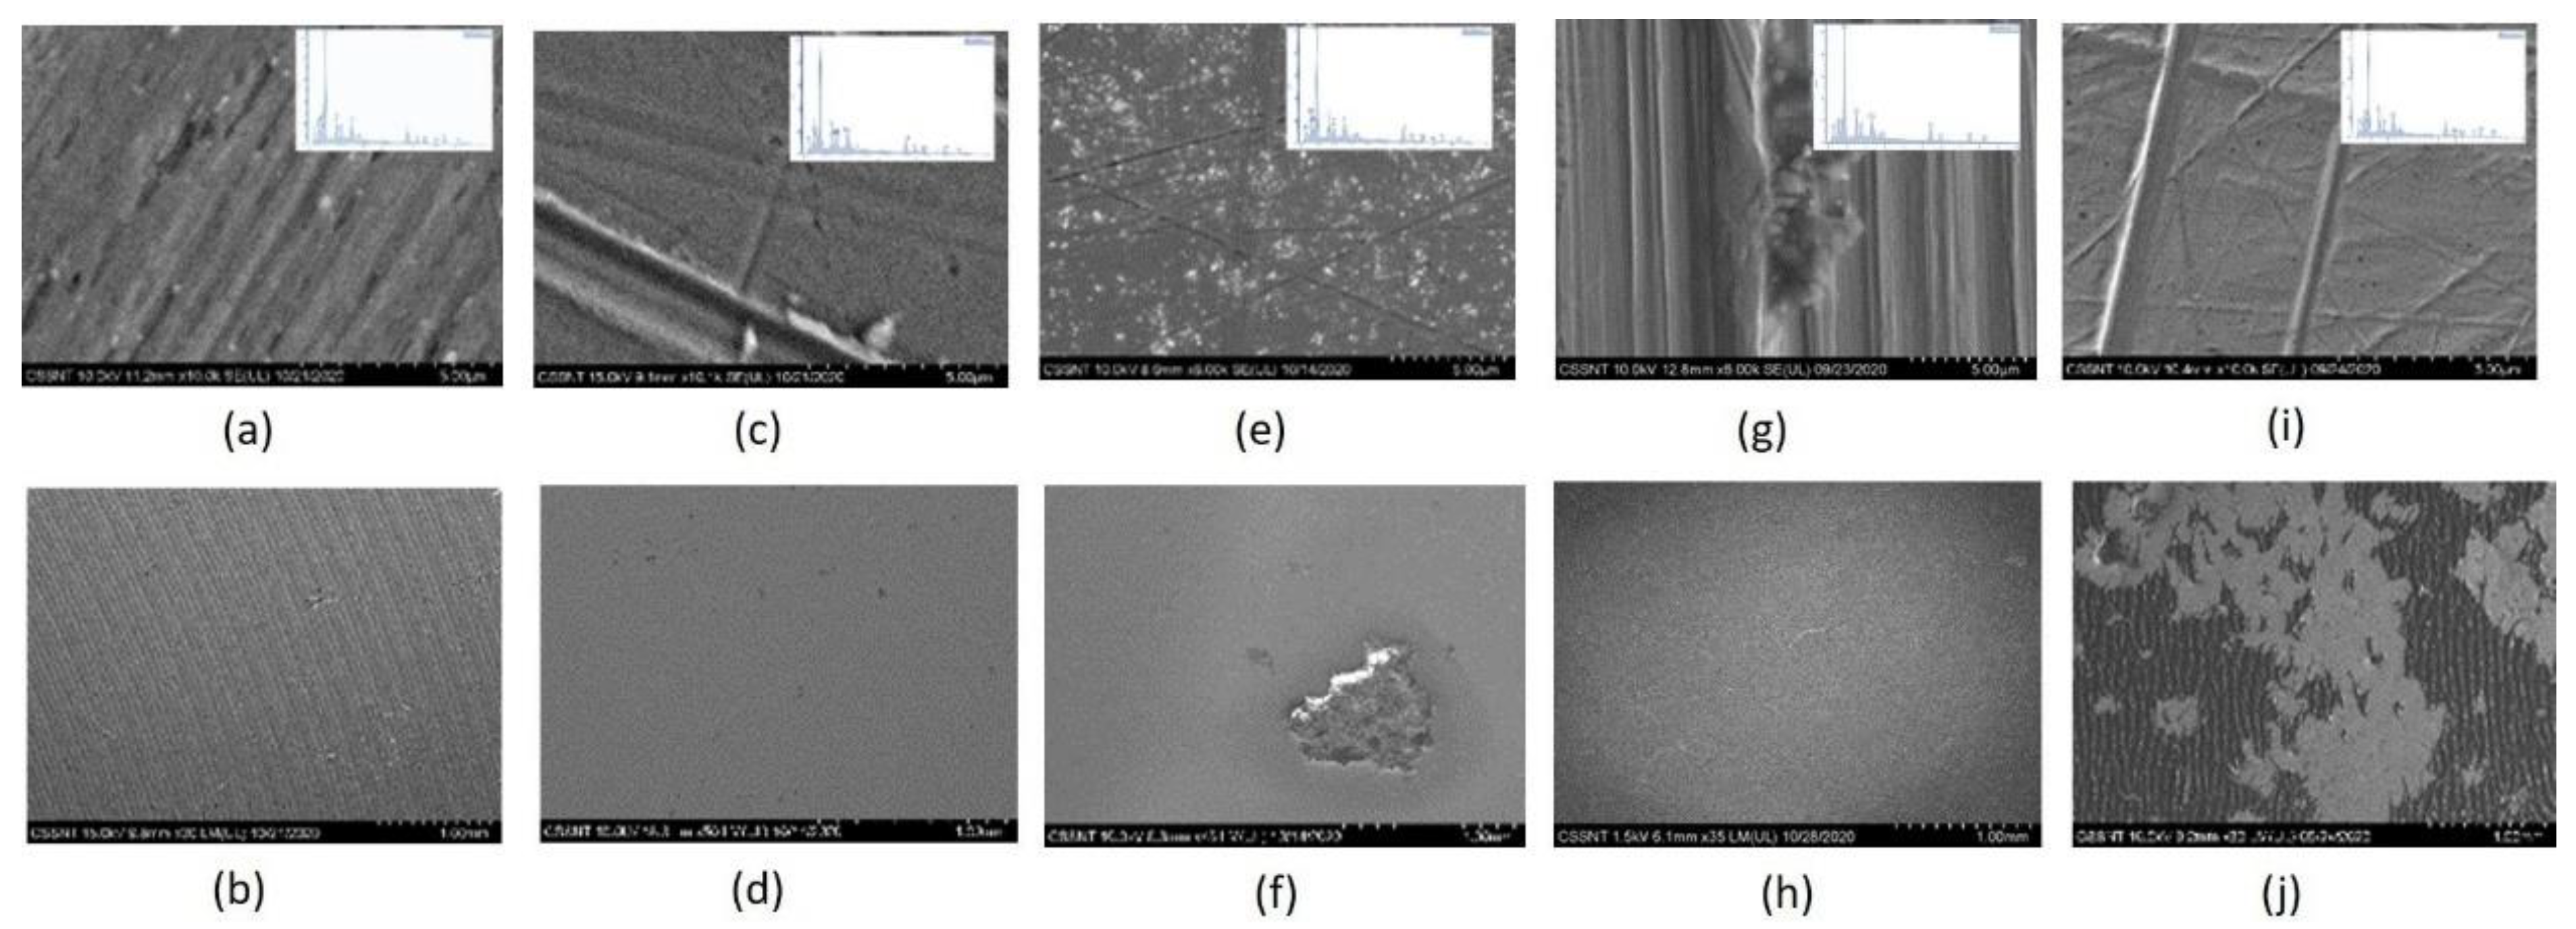
3.2. Surface Characterization

SEM analysis highlighted the morphology of the studied samples. The central part of the sample analyzed at SEM for a small magnification (35 x) was further enlarged to record the morphology of that sample at large magnification (10 kx).
According to representative SEM images presented as examples in Figure 9 and Figure 10 at different temperatures for NiCr and CoCr alloys in connection with the surface elemental analysis, it is possible to see that at low temperatures, oxide films are more uniform but at higher temperatures, the films become thinner and more susceptible to breakdown.
From SEM analysis, we can observe the morphology of the samples. On the surface of both alloys, at higher magnification some layers are visible. Before the electrochemical studies, the surface of the samples was smooth, without significative structures on the surface. After the electrochemical procedure, on the surface of both alloys, different porous structures appear, a fact that is more visible at higher magnification (10 kx). This is because oxide layers appear, a fact that is highlighted by EDS.
At higher temperature, it is possible to observe some pits. It is well known that the appearance of pits is the first step of a localized corrosion named pitting corrosion which is based also on anionic penetration, usually chloride. As the chloride ions are present in the electrolyte, it is reasonable to believe that the next steps of such type of corrosion are going to take place with pits propagation and oxide breakdown.
By EDS, the spectra for the alloys immersed at different temperatures in artificial saliva were obtained. These spectra look almost similar at different temperatures; some oxygen peaks appear beside the elements from the alloy composition. These are a result of an oxide layer formed on the surface of both alloys. By increasing temperature, after 320 K the oxide layer starts to break, some pits appear, and corrosion is more highlighted. For all the samples, at different temperatures, peaks specific to the alloying elements appear in spectra (Ni, Cr, Fe, Mo, Si for NiCr alloy and Co, Cr, Mo, W, Ga, Mn for CoCr alloy). Elemental analysis (Atomic %), evidenced the presence of O besides Ni, Cr, Fe, Mo for NiCr alloy (Figure 11) and for CoCr alloy (Figure 12).
The results of SEM/EDS analyses reveal a heterogeneous morphology. It is known from the literature [43], that the presence of chromium as an alloying element determines the appearance of a primary Cr2O3 passive film which is dominantly responsible for the alloy passivation.
It seems that the increase in temperature determines the intensification of the dissolution process, which initially begins with only a few active centers. At low temperatures, although active centers of dissolution are present on the surface, the existence in the alloys composition of the Mo and W makes them act in the pits (active centers), reducing alloy corrosion rate and generating a heterogeneous surface [46,47,48].

3.3. Contact Angle Evaluation

The wettability tests have shown a slight increase in the value of the contact angle of the thermally reprocessed alloy samples. Thus, in the case of NiCr alloy, values of 82.5 ± 0.7 were obtained for the thermally reprocessed samples, compared to 75.4 ± 0.5 for the unprocessed alloy. For the CoCr alloy the increase was from 71.8 ± 0.8 (value obtained for the non-heat-treated sample) to 77.5 ± 0.9. Contact angle measurement tests were performed using the same electrolyte as the electrochemical tests.
The above values are all in the hydrophilic domain sustaining a better cell adhesion and proliferation around restorative work with such alloys [49].

3.4. Ion Release by ICP-MS Measurenments

Inductively coupled plasma mass spectrometry was performed to evaluate the Ni, Cr, Mo, Si, Fe for NiCr alloy and Co, Cr, W, Mo, Mn, Si and Ga ion release for CoCr alloy from the samples at 290, 300, 310, 320 and 330 K.
For the elemental analyses, a multi-element standard reference solution of 10 μg/mL was added as external standard. The concentration of ion release was studied in artificial saliva at different temperatures.
From Table 4, for NiCr sample it is shown that the concentration (ion release quantities) is in the domain of ppm (0–15 ppm). The tendency of the graph is that with the increase in the temperature, the ion release concentration is increasing with the increase in the temperature. The higher concentration is for Mo at 330 K and the smallest is for Mo at 290 K.
When the temperature increases, the quantities of the elements also increasw (Table 5) for CoCr sample. The ion release is in the domain of 0–19 ppm. The higher ion release value is for Mo at 330 K and the smallest is for W at 290, 300, 310, 320 K (being constant over this temperature range). The two tested alloys release some elements such as Ni, Co, Cr, Mo. As can be seen from this study, the amounts released are well below those taken as part of the diet. However, it should be emphasized that there is no information on long-term exposure to low doses of these elements.
The ion release data are in perfect accordance with the results obtained by electrochemical studies. Considering that the risk heavy metals pose in dental health is not well understood, especially for rare disease [50], such factors could lead to a decrease in the alloys’ quality by changing their composition [51] or coating their surface. Such strategies have been performed and tested but still have room for better selection in tissue as the metallic ion involves a cumulative process. In a time with very aggressive bacteria, antibacterial coatings for dental alloys could be highlighted as well [52].

4. Conclusions

The electrochemical results indicate an increase in the corrosion rate of each of the biomaterials in Fusayama–Meyer artificial saliva with the increase in the temperature. The SEM coupled with EDS measurements evidenced the same behavior; the temperature favors the occurrence of corrosion phenomena, because of which the oxide films on the surface of the metallic biomaterial tend to break after the temperature of 310 K. ICP-MS results reveal that with an increase in the temperature, the quantities of the ions released from both dental alloys also increase, still remaining on the order of a few tens of ppm, in perfect accordance with the results obtained by electrochemical studies.

Author Contributions

Conceptualization, F.G. and I.D.; methodology, M.P. and I.D.; validation, F.G., M.P. and F.G.I.; formal analysis, F.G.I. and M.P.; investigation, F.G. and M.P.; writing—original draft preparation, F.G., M.P. and F.G.I.; writing—review and editing, F.G. and I.D.; supervision, I.D. All authors have read and agreed to the published version of the manuscript.

Funding

This research received no external funding.

Data Availability Statement

The data presented in this study are available upon request.

Conflicts of Interest

The authors declare no conflict of interest.

References

  1. Chen, P.; Liu, H.; Niinomi, M.; Horita, Z.; Fujii, H.; Hanawa, T. Fatigue property and cytocompatibility of a biomedical Co-Cr-Mo alloy subjected to a high-pressure torsion and a subsequent short time annealing. Mater. Trans. 2020, 61, 361–367. [Google Scholar] [CrossRef]
  2. German, R.M. Precious-metal dental casting alloys. Int. Met. Rev. 1982, 27, 260–288. [Google Scholar] [CrossRef]
  3. Iacoban, S.; Bolat, G.; Munteanu, C.; Cailean, D.; Trinca, L.; Mareci, D. A comparative study on the corrosion behaviour of CoCr and NiCr dental alloys in saline medium. Rev. Roum. Chim. 2015, 60, 949–955. [Google Scholar]
  4. Mareci, D.; Nemtoi, G.H.; Aelenei, N.; Bocanu, C. The electrochemical behavior of various non-precious Ni and Co Based Alloys in Artificial Saliva. Eur. Cell. Mater. 2005, 10, 1–7. [Google Scholar] [PubMed]
  5. Ramírez-Ledesma, L.; Roncagliolo, P.; Alvarez-Perez, M.A.; Lopez, H.F.; Juárez-Islas, J.A. Corrosion assessment of an implantable dental Co-Cr alloy in artificial saliva and biocompatibility behavior. J. Mater. Eng. Perform. 2020, 29, 1657–1670. [Google Scholar] [CrossRef]
  6. Turdean, G.L.; Craciun, A.; Popa, D.; Constantiniuc, M. Study of electrochemical corrosion of biocompatible Co–Cr and Ni–Cr dental alloys in artificial saliva. Influence of pH of the solution. Mat. Chem. Phys. 2019, 233, 390–398. [Google Scholar] [CrossRef]
  7. Galateanu, B.; Golgovici, F.; Hudita, A.; Stan, M.; Dinescu, S.; Costache, M.; Demetrescu, I.; Popescu, A. About electrochemical stability and biocompatibility of two types of CoCr commercial dental alloys. Mater. Corros. 2016, 67, 1096–1104. [Google Scholar] [CrossRef]
  8. Han, W.; Fang, F. Investigation of electrochemical properties of electropolishing Co–Cr dental alloy. J. Appl Electrochem. 2020, 50, 367–381. [Google Scholar] [CrossRef]
  9. Kajima, N.Y.; Takaichi, A.; Kittikundecha, N.; Nakamoto, T.; Kimura, T.; Nomura, N.; Kawasaki, A.; Hanawa, T.; Takahashi, H.; Wakabayashi, N. Effect of Heat-Treatment Temperature on Microstructures and Mechanical Properties of Co-Cr–Mo Alloys and Fabricated by Selective Laser Melting. Mat. Sci. Eng. A 2018, 726, 21–31. [Google Scholar] [CrossRef]
  10. Standard Specification for Wrought Titanium 6Al 4V ELI Alloy for Surgical Implants; ASTM Designation F136-82; ASTM: Philadelphia, PA, USA, 1994; pp. 19–20.
  11. Mazare, A.; Dilea, M.; Ionita, D.; Demetrescu, I. Electrochemical behavior in simulated body fluid of TiO2 nanotubes on TiAlNb alloy elaborated in various anodizing electrolyte. Surf. Interface Anal. 2014, 46, 186–192. [Google Scholar] [CrossRef]
  12. Ionita, D.; Pirvu, C.; Stoian, A.B.; Demetrescu, I. The trends of TiZr alloy research as a viable alternative for Ti and Ti16 Zr roxolid dental implants. Coatings 2020, 10, 422. [Google Scholar] [CrossRef]
  13. Reclaru, L.; Unger, R.E.; Kirkpatrick, C.J.; Susz, C.; Eschler, P.-Y.; Zuercher, M.-H.; Antoniac, I.; Lüthy, H. Ni–Cr based dental alloys; Ni release, corrosion and biological evaluation. Mater. Sci. Eng. C 2012, 32, 1452–1460. [Google Scholar] [CrossRef] [PubMed]
  14. Nuoh, T.; Andre Mars, J.; Thovhogi, N.; Gihwala, D.; Baleg, A.A.; Maaza, M. Influence of temperature and pH on corrosion resistance of Ni-Cr and Co-Cr dental alloys on oral environmen. J. Dent. Oral Health 2015, 22, 1–9. [Google Scholar]
  15. Souza, J.; Apaza-Bedoya, K.; Benfatti, C.; Silva, F.; Henriques, B. A comprehensive review on the corrosion pathways of titanium dental implants and their biological adverse effects. Metals 2020, 10, 1272. [Google Scholar] [CrossRef]
  16. Ammer, M.A.; Khamis, E.; Al-Motlag, A. Electrochemical behavior of recasting Ni-Cr and Co-Cr non-precious dental alloys. Corros. Sci. 2004, 46, 2825–2836. [Google Scholar] [CrossRef]
  17. Scharf, B.; Clement, C.C.; Zolla, V.; Perino, G.; Yan, B.; Elci, S.G.; Purdue, E.; Goldring, S.R.; Macaluso, F.; Cobelli, N.; et al. Molecular analysis of chromium and cobalt-related toxicity. Sci. Rep. 2015, 4, 5729. [Google Scholar] [CrossRef] [PubMed] [Green Version]
  18. Mercieca, S.; Caligari Conti, M.; Buhagiar, J.; Camilleri, J. Assessment of corrosion resistance of cast cobalt- and nickel-chromium dental alloys in acidic environments. J. Appl. Biomater. Funct. Mater. 2018, 16, 47–54. [Google Scholar] [CrossRef] [PubMed] [Green Version]
  19. Al-Hiyasat, A.; Darmani, H. The effects of recasting on the cytotoxicity of base metal alloys. J. Prosthet. Dent. 2005, 93, 158–163. [Google Scholar] [CrossRef]
  20. Syed, M.; Chopra, R.; Sachdev, V. Allergic reactions to dental materials-A systematic review. J. Clin. Diagn. Res. 2015, 9, ZE04–ZE09. [Google Scholar] [CrossRef]
  21. Olms, C.; Yahiaoui-Doktor, M.; Remmerbach, T.W. Contact allergies to dental materials. Swiss Dent. J. 2019, 129, 571–579. [Google Scholar]
  22. Al-Imam, H.; Benetti, A.R.; Øzhayat, E.B.; Pedersen, A.M.L.; Johansen, J.D.; Thyssen, J.; Jellesen, M.S.; Gotfredsen, K. Cobalt release and complications resulting from the use of dental prostheses. Contact Dermat. 2016, 75, 377–383. [Google Scholar] [CrossRef] [PubMed]
  23. Noble, J.; Ahing, S.I.; Karaiskos, N.E.; Wiltshire, W.A. Nickel allergy and orthodontics, a review and report of two cases. Br. Dent. J. 2008, 204, 297–300. [Google Scholar] [CrossRef] [PubMed]
  24. Zigante, M.; Rincic Mlinaric, M.; Kastelan, M.; Perkovic, V.; Trinajstic Zrinski, M.; Spalj, S. Symptoms of titanium and nickel allergic sensitization in orthodontic treatment. Prog. Orthod. 2020, 21, 17. [Google Scholar] [CrossRef] [PubMed]
  25. Hostýnek, J.; Reagan, K.; Maibach, H. Nickel allergic hypersensitivity: Prevalence and Incidence by country, gender, age, and occupation. In Nickel and the Skin; Taylor & Fancisc: Oxfordshire, UK, 2019; pp. 39–82. [Google Scholar]
  26. Regulation (EU) 2017/745 of the European Parliament and of the Council of 5 April 2017 on Medical Devices. Available online: http://data.europa.eu/eli/reg/2017/745/ (accessed on 6 January 2021).
  27. Vaicelyte, A.; Janssen, C.; Le Borgne, M.; Grosgogeat, B. Cobalt–Chromium Dental Alloys: Metal Exposures, Toxicological Risks, CMR Classification, and EU Regulatory Framework. Crystals 2020, 10, 1151. [Google Scholar] [CrossRef]
  28. Moreto, J.A.; Costa, R.A.; Rodrigues da Silva, L.R.; Rossi, A.; da Silva, L.A.; Alves, A.V. Effect of temperature, electrolyte composition and immersion time on the electrochemical corrosion behavior of CoCrMo implant alloy exposed to physiological serum and Hank’s solution. Mat. Res. 2018, 21, 1–9. [Google Scholar] [CrossRef] [Green Version]
  29. Dong, H.; Ju, X.; Qian, L.; Zhou, Z. Effect of ceramic conversion treatments on the surface damage and nickel ion release of NiTi alloys under fretting corrosion conditions. J. Mater. Sci. Mater. Med. 2008, 19, 937–946. [Google Scholar] [CrossRef] [PubMed]
  30. Sonofuchi, K.; Hagiwara, Y.; Koizumi, Y.; Chiba, A.; Kawano, M.; Nakayama, M.; Ogasawara, K.; Yabe, Y.; Itoi, E. Quantitative in vivo biocompatibility of new ultralow-nickel cobalt-chromium-molybdenum alloys. J. Orthop. Res. 2016, 34, 1505–1513. [Google Scholar] [CrossRef]
  31. Padrós, R.; Giner-Tarrid, L.; Herrero-Climent, M.; Punset, M.; Francisco Gil, F.J. Corrosion resistance and ion release of dental prosthesis of CoCr obtained by CAD-CAM Milling, Casting and Laser Sintering. Metals 2020, 10, 827. [Google Scholar] [CrossRef]
  32. Hamza, G.E.; Sallam, H.; Eldwakhly, E. Effect of surface treatment of milled cobalt–chromium alloy on shear bond strength to porcelain. J. Arab Soc. Med. Res. 2019, 14, 113–123. [Google Scholar] [CrossRef]
  33. Padrós, R.; Punset, M.; Molmeneu, M.; Velasco, A.B.; Herrero-Climent, M.; Rupérez, E.; Gil, F.J. Mechanical properties of CoCr dental-prosthesis restorations made by three manufacturing processes. Influence of the microstructure and topography. Metals 2020, 10, 788. [Google Scholar] [CrossRef]
  34. Sarangi, D.; Mohapatra, U. Alloys used in fixed prosthodontics: An overview. Indian J. Public Health Res. Dev. 2019, 10, 171. [Google Scholar] [CrossRef]
  35. Golgovici, F.; Ionascu, F.G. Electrochemical behavior of NiCr based alloys in human and artificial saliva. UPB Sci. Bull. Series B 2017, 79, 157–166. [Google Scholar]
  36. Bauer, J.; Costa, J.F.; Carvalho, C.N.; Grande, R.H.; Loguercio, A.D.; Reis, A. Characterization of two Ni-Cr dental alloys and the influence of casting mode on mechanical properties. J. Prosthodont. Res. 2012, 56, 264–271. [Google Scholar] [CrossRef] [PubMed]
  37. Szala, M.; Beer-Lech, K.; Gancarczyk, K.; Baran Kilic, O.; Pędrak, P.; Ozer, A.; Skic, A. Microstructural characterisation of Co-Cr-Mo casting dental alloys. Adv. Sci. Technol. Res. J. 2017, 11, 76–82. [Google Scholar] [CrossRef] [Green Version]
  38. Rao, S.; Chowdhary, R. Evaluation on the corrosion of the three Ni-Cr alloys with different composition. Int. J. Dent. 2011, 2011, 397029. [Google Scholar] [CrossRef] [PubMed] [Green Version]
  39. Kozbial, A.; Li, Z.; Conaway, C.; McGinley, R.; Dhingra, S.; Vahdat, V.; Zhou, F.; D’Urso, B.; Liu, H.; Li, L. Study on the surface energy of graphene by contact angle measurements. Langmuir 2014, 30, 8598–8606. [Google Scholar] [CrossRef] [PubMed]
  40. Lu, C.; Zheng, Y.; Zhong, Q. Corrosion of dental alloys in artificial saliva with Streptococcus mutans. PLoS ONE 2017, 12, e0174440. [Google Scholar] [CrossRef] [PubMed]
  41. Yfantis, C.; Yfantis, D.; Anastassopoulou, J.; Theophanides, T. Analytical and electrochemical evaluation of the in vitro corrosion behavior of nickel-chrome and cobalt-chrome alloys for metal-ceramic restorations. Eur. J. Prosthodont. Rest. Dent. 2007, 15, 33–40. [Google Scholar]
  42. Lloyd, A.C.; Noel, J.J.; McIntyre, S.; Shoesmith, D.W. Cr, Mo and W alloying additions in Ni alloys and their effect on passivity. Electrochim. Acta 2004, 49, 3015–3027. [Google Scholar] [CrossRef]
  43. Silva, J.; Sousa, L.; Nakazato, R.; Codaro, E.; Felipe, H. Electrochemical and microstructural study of Ni-Cr-Mo alloys used in dental prostheses. Mater. Sci. Appl. 2011, 2, 42–48. [Google Scholar] [CrossRef]
  44. Musa, A.; Mohamad, A.B.; Kadhum, A.A.H.; Chee, E.P. Galvanic corrosion of aluminum alloy (Al2024) and copper in 1.0 m nitric acid. Int. J. Electrochem. Sci. 2011, 6, 5052–5065. [Google Scholar]
  45. Vallance, C. An introduction to Chemical Kinetics; Morgan & Claypool Publishers: Bristol, UK, 2017. [Google Scholar]
  46. Viennot, S.; Dalard, F.; Lissac, M.; Grosgogeat, B. Corrosion resistance of cobalt-chromium and palladium-silver alloys used in fixed prosthetic restorations. Eur. J. Oral Sci. 2005, 113, 90–95. [Google Scholar] [CrossRef] [PubMed]
  47. Giacomelli, F.C.; Giacomelli, C.; Spinelli, A. Behavior of a Co-Cr-Mo biomaterial in simulated body fluid solutions studied by electrochemical and surface analysis techniques. J. Braz. Chem. Soc. 2004, 15, 54–547. [Google Scholar] [CrossRef]
  48. Geurtsen, W. Biocompatibility of dental casting alloys. Crit. Rev. Oral Biol. Med. 2002, 13, 71–84. [Google Scholar] [CrossRef] [PubMed] [Green Version]
  49. Paterlini, T.T.; Nogueira, L.F.B.; Tovani, C.B.; Cruz, M.A.E.; Derradi, R.; Ramos, A.P. The role played by modified bioinspired surfaces in interfacial properties of biomaterials. Biophys Rev. 2017, 9, 683–698. [Google Scholar] [CrossRef] [PubMed] [Green Version]
  50. Chaturvedi, T.P. Allergy related to dental implant and its clinical significance. Clin. Cosmet. Investig. Dent. 2013, 5, 57–61. [Google Scholar] [CrossRef] [PubMed] [Green Version]
  51. Drob, S.I.; Vasilescu, C.; Andrei, M.; Calderon Moreno, J.M.; Demetrescu, I. Microstructural, mechanical and anticorrosion characterisation of new CoCrNbMoZr alloy. Mater. Corros. 2015, 67, 739–747. [Google Scholar] [CrossRef]
  52. Zhang, E. A new antibacterial Co-Cr-Mo-Cu alloy: Preparation, biocorrosion, mechanical and antibacterial property. Mat. Sci. Eng. C 2016, 69, 134–143. [Google Scholar] [CrossRef]
Figure 1. SEM micrographs for NiCr alloy (a) and (b) and for CoCr alloy (c) and (d) at two different magnifications (30× and 1k×).
Metals 11 00256 g001
Figure 2. Open circuit potential behavior at different temperatures of electrolyte for: (a) NiCr alloy; (b) CoCr alloy.
Metals 11 00256 g002
Figure 3. Nyquist (a) and Bode (b) diagrams for NiCr alloy immersed in artificial saliva at different temperatures.
Metals 11 00256 g003
Figure 4. Nyquist (a) and Bode (b) diagrams for CoCr alloy immersed in artificial saliva at different temperatures.
Metals 11 00256 g004
Figure 5. Polarization curves for NiCr alloy at different temperatures of artificial saliva.
Metals 11 00256 g005
Figure 6. Polarization curves for CoCr alloy at different temperatures of artificial saliva.
Metals 11 00256 g006
Figure 7. Arrhenius plots in artificial saliva for the two studied alloys.
Metals 11 00256 g007
Figure 8. Plots of the transition state in artificial saliva for the two studied alloys in artificial saliva.
Metals 11 00256 g008
Figure 9. SEM micrographs and EDS analysis (inset) for NiCr alloy at two different magnification (35 x and 10 kx) (a) and (b) 290 K, (c) and (d) 300 K, (e) and (f) 310 K, (g) and (h) 320 K, (i) and (j) 330 K.
Metals 11 00256 g009
Figure 10. SEM micrographs and EDS analysis (inset) for CoCr alloy at two different magnification (35 x and 10 kx) (a) and (b) 290 K, (c) and (d) 300 K, (e) and (f) 310 K, (g) and (h) 320 K, (i) and (j) 330 K.
Metals 11 00256 g010
Figure 11. Elemental analysis for NiCr alloys after exposure in artificial saliva at different temperatures.
Metals 11 00256 g011
Figure 12. Elemental analysis for CoCr alloys after exposure in artificial saliva at different temperatures.
Metals 11 00256 g012
Table 1. Composition of NiCr and CoCr alloys [35].
AlloyCo%Ni%Cr%Mo%W%Ga%Si%Fe%Mn%
CoCr60.2-254.86.22.9<1-<1
NiCr-6224.510.3--1.71.5-
Table 2. Kinetic corrosion parameters of NiCr and CoCr alloys at different temperatures of Fusayama–Meyer artificial saliva.
AlloyT, KTafel MethodPolarization Resistance Method
Ecorr, mVicorr,
μA × cm−2
Kg,
G × m−2h−1
P,
mm × year−1
Ba,
mV
−Bc, mVRP,
icorr,
μA × cm−2
NiCr290−5780.4070.00460.00491209857.880.405
±0.02±0.01±0.0001±0.0001±0.2±0.1±0.07±0.01
300−5281.3640.01550.01641239117.611.289
±0.02±0.01±0.0001±0.0001±0.2±0.1±0.001±0.01
310−3853.5620.04070.0429114887.153.016
±0.015±0.01±0.0002±0.0003±0.2±0.1±0.005±0.01
320−3266.3510.07260.0766116893.646.011
±0.01±0.02±0.0005±0.0006±0.1±0.1±0.005±0.02
330−25511.870.13570.143292971.7511.689
±0.01±0.04±0.001±0.001±0.1±0.1±0.002±0.03
CoCr290−5840.0620.00080.000812093348.830.065
±0.02±0.01±0.0001±0.0001±0.2±0.1±0.06±0.01
300−5380.1580.00190.002110498157.610.139
±0.02±0.01±0.0001±0.0002±0.1±0.1±0.05±0.01
310−4760.4770.00600.006211511054.520.448
±0.01±0.01±0.0001±0.0002±0.1±0.2±0.004±0.02
320−4252.0970.02640.027211010811.782.008
±0.01±0.02±0.0005±0.0005±0.2±0.1±0.0008±0.02
330−3505.7720.07270.074994763.495.221
±0.01±0.03±0.001±0.0007±0.1±0.1±0.001±0.03
Table 3. Kinetic corrosion parameters obtained from the Arrhenius equation and the transition state equation for NiCr and CoCr alloys at different temperatures of artificial saliva.
AlloyArrhenius Equation Transition State Equation
Ea, kJ mol−1ΔH, kJ mol−1ΔS, J mol−1K−1
NiCr66.2363.66−145.81
CoCr92.4589.88−74.13
Table 4. Ions release for NiCr alloy at 290, 300, 310, 320 and 330 (K).
Ions Release (ppm)Temperature (K)
290300310320330
Ni5.65 ± 0.026.25 ± 0.017.24 ± 0.027.39 ± 0.0112.79 ± 0.01
Cr5.25 ± 0.035.34 ± 0.029.31 ± 0.029.37 ± 0.029.74 ± 0.02
Mo0 ± 0.010 ± 0.018.83 ± 0.019.11 ± 0.0114.54 ± 0.01
Si0.65 ± 0.010.76 ± 0.011.76 ± 0.022.15 ± 0.013.93 ± 0.01
Fe6.4 ± 0.026.86 ± 0.017.25 ± 0.027.27 ± 0.027.77 ± 0.02
Table 5. Ions release for CoCr alloy at 290, 300, 310, 320 and 330 K.
Elements (ppm)Temperature (K)
290300310320330
Co7.23 ± 0.017.27 ± 0.028 ± 0.0138 ± 0.028.45 ± 0.02
Cr4.33 ± 0.025.75 ± 0.015.82 ± 0.016.93 ± 0.0110.69 ± 0.03
W0 ± 0.010 ± 0.010 ± 0.010 ± 0.015 ± 0.02
Mo7.07 ± 0.0112.62 ± 0.0113.52 ± 0.0314.65 ± 0.0218.34 ± 0.03
Mn3.85 ± 0.025.12 ± 0.026.12 ± 0.016.66 ± 0.017.64 ± 0.02
Si4.1 ± 0.025.33 ± 0.016.11 ± 0.017.54 ± 0.0211.1 ± 0.03
Ga5.98 ± 0.017.29 ± 0.028.24 ± 0.029.29 ± 0.0212.47 ± 0.01
Publisher’s Note: MDPI stays neutral with regard to jurisdictional claims in published maps and institutional affiliations.

