Abstract
B cells and tertiary lymphoid structures (TLS) are reported to be important in survival in cancer. Pancreatic Cancer (PDAC) is one of the most lethal cancer types, and currently, it is the seventh leading cause of cancer-related death worldwide. A better understanding of tumor biology is pivotal to improve clinical outcome. The desmoplastic stroma is a complex system in which crosstalk takes place between cancer-associated fibroblasts, immune cells and cancer cells. Indirect and direct cellular interactions within the tumor microenvironment (TME) drive key processes such as tumor progression, metastasis formation and treatment resistance. In order to understand the aggressiveness of PDAC and its resistance to therapeutics, the TME needs to be further unraveled. There are some limited data about the influence of nerve fibers on cancer progression. Here we show that small nerve fibers are located at lymphoid aggregates in PDAC. This unravels future pathways and has potential to improve clinical outcome by a rational development of new therapeutic strategies.
1. Introduction
The incidence of Pancreatic Ductal Adenocarcinoma (PDAC) almost equals the mortality rate illustrating the aggressiveness of PDAC [1]. In order to understand the resistance to therapeutics the components within the cancer stroma need to be further unraveled. PDAC arises in a tumor microenvironment (TME) that is characterized by extensive communication between tumor cells and non-malignant cells. Specifically, stromal components have been mechanistically implied in immune evasion in the context of cancer therapy, including immunotherapy [2,3]. The role of nerve fibers within the cancer-associated stroma has not been fully investigated. The aim of this study is to define the role of small nerve fibers in the cancer stroma and their spatial arrangement to immune cells. We hypothesized that small nerve fibers are one of the key components in cancer progression.
Recent publications show that B cells play an important role in the survival of cancer patients and response to immunotherapy [4,5,6,7,8], and this is not limited to T cells only [9,10,11]. Furthermore, B cells play an important role in the tumor formation of PDAC [12]. Tertiary lymphoid structures (TLS) have been recognized as ectopic lymphoid organs that reside in inflamed tissue and also in cancer [13,14]. These structures show differences in the maturation stage and sometimes result in the formation of a germinal center [14,15,16]. The different maturation stages of TLS show expression of different cells: early TLS without the formation of a germinal center, primary follicle-TLS with CD21 positive follicular dendritic cells without the formation of a germinal center and secondary follicle-TLS with the presence of a germinal center (also CD23-positive) [17]. TLS presence is described in multiple cancer types and is variably present in cancer types and patients and is a favorable prognostic factor [18,19].
2. Methods
2.1. Ethics Statement
All experiments were conducted in accordance with the Declaration of Helsinki and the International Ethical Guidelines for Biomedical Research Involving Human Subjects. Pathology blocks from the University Hospital of Aachen (RWTH Aachen) were retrieved (institutional ethics EK 106/18). Written human patient consent was not necessary, because this study was based on retrospective chart review and archived pathology material. Nevertheless, most patients had signed informed consent; in some cases, informed consent was waived due to the lack of risk for the patient and the fact that those patients were unable to provide informed consent. Images from tissue specimens are entirely unidentifiable, and no details on individuals are reported within the manuscript.
2.1.1. Patient Cohort
Histological slides from 166 patients with PDAC were selected and used to cut tissue sections for the immunostaining Protein Gene Product 9.5 (PGP9.5).
Of the 188 patients included in the cohort, 15 were excluded due to in-hospital mortality, 3 due to a loss to follow up and 4 due to poor-quality pathology slides. Analysis was performed on 166 cases. Clinical data for this cohort are listed in Table 1.

Table 1.
Results from univariate and multivariate Cox regression analysis adjusted for age, gender and BMI of prognostic factors associated with overall survival.
2.1.2. Pathological Examination
The clinic-pathological parameters, including tumor size, differentiation, positive lymph node status and R0/R1, were carefully reviewed in the original report. All PDAC lesions were pathologically examined and classified according to World Health Organization (WHO) classification using the 8th edition of the Tumor Nodes Metastasis (TNM) Classification for Malignant Tumors.
2.2. Nerve Fiber Density (NFD)
Immunohistochemistry was performed on formalin-fixed, paraffin-embedded tissue sections. Sections (2.5 μm thick) were cut, deparaffinized in xylene and rehydrated in graded alcohols. Slides were boiled in citrate buffer (pH 6.0) at 95–100 °C for 5 min and were cooled for 20 min and endogenous peroxide in methanol for 10 min. Sections were incubated with rabbit anti-human PGP 9.5 (DAKO 1:100) overnight at 4 °C.
A single digital image was uploaded in Qupath 0.1.6, which is a flexible software platform suitable for a range of digital pathology applications. Nerve fiber density (NFD) was evaluated by counting the number of nerve fascicles with diameters of <100 μm in 20 continuous fields at × 200 magnification.
Nerve fiber density results were grouped into 3 categories: (1) negative, no nerve fibers, (2) weak expression, 1–10 nerve fibers and (3) moderate/strong expression >10 nerve fibers, according to the existing literature on breast cancer [20].
2.3. Tumor Cellularity (TC)
Every immunostained slide was scanned, and with whole slide imaging, the tumor glands, normal pancreatic tissue and atrophic pancreatic tissue were manually annotated in QuPath 0.1.6 by a senior pathologist [18]. The stromal area was measured by the following formula: total tissue-(normal tissue + atrophic pancreas + tumor) = stroma surface. Tumor cellularity was measured as (tumor surface/(tumor surface + stroma surface).
2.4. Phenotyping of Immune Cells
Based on H&E, the predominant type of immune cells was judged manually by the PhD student and the senior pathologist. The H&E slide and the slide used for immunostaining were cut directly after each other. The dominant type of immune cells was determined and manually scored into three categories: (1) lymphocyte-predominant, (2) neutrophil-predominant or (3) no immune cells.
2.5. Single Immunohistochemistry
To further define the type of immune cell, we performed immunohistochemistry on 10 patients with histologically confirmed lymphoid aggregates on H&E staining and a high NFD based on the PGP9.5 staining. We used CD20 (B cells), CD4, CD8 (T cell markers) and FOXP3 (which can be expressed by T cells), according to previous literature that CD20+ B cells were located in the TLS and were colocalized with CD4+, CD8+ and FOXP3+ T cells [6]. To illustrate the presence of follicular dendritic cells, we also stained for CD21. These stainings were compared to the H&E routine staining and PGP9.5 nerve fiber staining.
Sections were stained with mouse or rabbit anti-human monoclonal antibodies against CD20 (Dako, L26, 1:200), CD21 (DAKO, 1:25), CD23 (Leica, CD23-1B12, 1:50), CD4 (DAKO, 4B12 1:50), CD8 (DAKO, C8/144B, 1:50) and FOXP3 (DAKO, PCH101, 1:50). All sections were counterstained with hematoxylin, dehydrated and mounted. All sections were cover-slipped using Vectashield Hardset 1500 mounting medium with DAPI, and slides were scanned and digitalized using the Roche Ventana scanner. Immunohistochemistry staining was interpreted in conjunction with H&E-stained sections.
2.6. Multiplex Immunofluorescence Assay and Analysis
For immunofluorescence multiplex staining, we followed the staining method for the following markers: CD20 (Dako, L26, 1:500) with subsequent visualization using fluorescein Cy3 (1:100); FOXP3 (DAKO, PCH101, 1:300) with subsequent visualization using fluorescein FITC (1:100); PGP9.5 (DAKO 1:300) with subsequent visualization using fluorescein TEX RED (1:100) and nuclei visualized with DAPI.
The slides were scanned using the TissueFAXS slide scanner (supplier TissueGnostics). For each marker, the mean fluorescent intensity per case was then determined as a base point from which positive cells could be established. For multispectral analysis, each of the individually stained sections was used to establish the spectral library of the fluorophores. The senior pathologist selected the Region of Interest (ROI) at 20× magnification. See Figure 1 for an overview of the immunostainins performed.
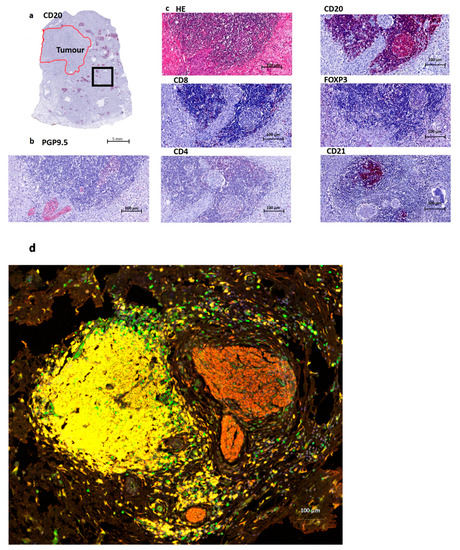
Figure 1.
Overview of a tertiary lymphoid structure (TLS) in Pancreatic Cancer. (a). Overview of a CD20 staining (B cells) in a Pancreatic Ductal Adenocarcinoma (PDAC) patient. The red annotated area indicates the tumor region, and the black box indicates the area of magnification for Figure 1b–d. (b). Nerve fiber staining PGP9.5, which is a pan-neuronal marker. This image shows the presence of nerve fibers at the edge of a lymphoid aggregate. (c). Routine HE staining containing B cells (CD20), T cells (here mostly CD8 and CD4) and follicular dendritic cells (CD21). Treg cells (FOXP3) are mostly absent, just as CD4 in this image. CD8 shows a few positive cells at the border of this structure. (d) Multiplex imaging: T cells (FOXP3 green), B cells (CD20 yellow), Nerves (PGP9.5 red) and nucleus (DAPI blue).
2.7. Lymphoid Aggregate Count Using Machine Learning
By using the annotations on the immunostained slide (PGP9.5), the distance from each immune cell to the tumor gland was measured, see Figure 2. The spatial arrangement of the immune cells was determined by a semi-automated machine learning workflow, which comprised cell segmentation, feature computation and stroma- and immune cell identification. To facilitate high throughput of thousands of immune cells on multiple images, QuPath enables interactive training of cell classification, after which the classifier can be saved and run over multiple slides. The senior pathologist trained a cell detection classifier to recognize immune cells and fibroblasts in a certain Region of Interest (ROI). This ROI was annotated by the senior pathologist and contained tumor glands and stroma only; including normal tissue and/or atrophic tissue was avoided in order to achieve the best detection results. Application of this workflow resulted in both fine-grained cell-by-cell analysis and overall summary scores of the spatial arrangements of the immune cells within the ROI in relation to the annotated tumor glands. The results are visualized via color-coded markup images.
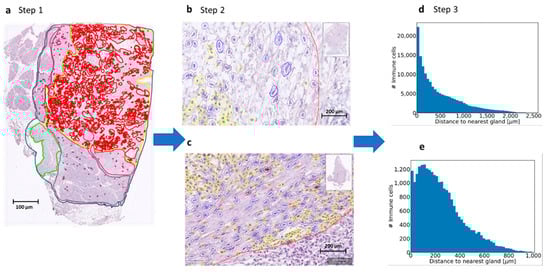
Figure 2.
Process using machine learning to determine immune cell spatiality. (a). Step 1. Defining the Region of Interest (ROI) (yellow line). Every scanned slide was annotated in: total tissue (dark blue), normal pancreas (purple), atrophic pancreas (pink), normal duodenum (green) and tumor (red). For the machine learning classifier, a Region of Interest (ROI) was also annotated (yellow). In this area, only the cell detection classifier was used to detect the stromal cells in fibroblasts and immune cells. (b,c). Step 2. The cell classifier was trained by the pathologist to recognize fibroblasts (blue annotations) and immune cells (yellow annotations). The tumor glands were all annotated manually gland by gland and are shown in red annotation. (d,e). Step 3. Measurement of distance of immune cell to tumor gland. From each slide, a plot was made with the number of immune cells (y-axis) and the distance to the nearest tumor gland (x-axis). These plots were used to measure the mean distance from the immune cell to the tumor gland in micrometers. Some slides showed immune cells at a greater distance from the tumor and some slides showed immune cells nearby the tumor. With this technique, we could identify immune cell aggregates, so groups of immune cells were located close to each other.
To obtain estimates for immune cell densities, a kernel-density estimate using Gaussian kernels as implemented in the gaussian_kde class from SciPy was applied. First, kernels were fitted from immune cell positions and calculated for points on a 100 × 100 grid for each slide. The results are displayed as a heat map together with the slides tumor annotations (see Figure 3). From this heat map, regions of high immune cell density can be identified manually that correspond to a lymphoid aggregate.
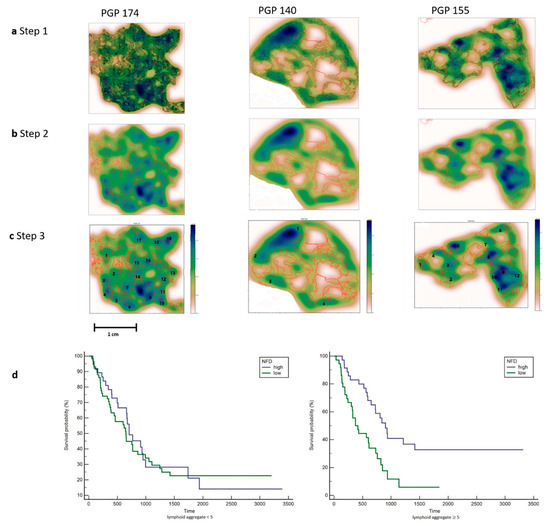
Figure 3.
Counting the number of lymphoid aggregates in patients with Pancreatic Cancer. (a). Step 1. All immune cells are plotted using the x and y coordinates. Tumor glands are annotated in red. Three patients are shown with a different distribution pattern of the immune cells. PGP 174 is immune-cell-rich and shows aggregates at the edge and in between the tumor glands. PGP 140 only shows a few immune cell aggregates at the edge of the tumor. PGP 155 shows a few immune cell aggregates mainly located at the edge of the tumor. (b). Step 2. A heat map was created by using a 2D Kernel Density. The color blue was used because of the already red annotations for tumor glands. Dark blue areas show a high density of immune cells. (c). Step 3. The heat map clusters with a dark blue and light blue color were interpreted as lymphoid aggregates and counted manually. Each number corresponds with a lymphoid aggregate, images with many lymphoid aggregates (PGP 174) and only few lymphoid aggregates (PGP140) are shown. (d). Left: Kaplan–Meier plot for patients with less than 5 lymphoid aggregates show no significance in survival. Right: Kaplan–Meier plot for patients with 5 or more Lymphoid Aggregates and a high NFD show a significantly better survival.
2.8. Statistics
Continuous variables were summarized by means and corresponding standard deviations (SD). Categorical data were presented by frequencies and percentages. Cox regression models were used to analyze the joint relation between clinical variables (coded by 0 and 1 for binary variables) on overall mortality. All exploratory variables were studied in a univariate Cox regression model adjusted for age, gender and BMI. Exploratory variables were assessed as relevant to be mutually included in our final model if the p-value was below 0.05. Relevant variables were studied further for pairwise interaction. In doing so, we used again the significance margin of 5%. Then a multivariate Cox regression model adjusted for age, gender and BMI with backward selection was fitted to the previously identified variables and interactions. During this final step, the significance level for removing a variable or interaction from the model was set to 0.05. For the final Cox model, graphical and numerical methods according to Lin et al. were performed to establish the validity of the proportionality assumption [21]. No deviation from the model assumption could be observed. We report our results by hazard ratios, corresponding 95% confidence limits and p-values, where a p-value of less than or equal to 0.05 could be interpreted as statistically significant test results. Forest plots were chosen for graphical visualization, and Kaplan–Meier plots for comparison of subgroups. All analyses were performed using SAS® statistical software, V9.4 (SAS Institute, Cary, NC, USA).
3. Results
3.1. High Nerve Fiber Density Is Associated with a Better Survival in Pancreatic Cancer
To gain deeper insight into the influence of nerve fibers on survival we used the neuronal immunohistochemistry staining PGP9.5 on our cohort of patients with pancreatic cancer (n = 166). A multivariate Cox regression model adjusting for age, gender and BMI revealed high Nerve Fiber Density (NFD) (more than 10 positive nerve fibers with diameters of <100 μm in 20 continuous fields at × 200 magnification) to be associated significantly with prolonged overall survival (HR 1.676 (95%CI 1.126, 2.495) for low vs. high NFD, p-value 0.0109) as compared to low NFD. We have used small nerve fiber innervation of the blood vessels in the normal tissue as an internal positive control in case of a low-NFD tumor (see Supplementary Figures S1 and S2).
3.2. The Lymphozcyte Predominant Immunophenotype Mainly in a Low Cellular Tumor
To further understand to what extent immune cells and nerve fibers may interact, each routine H&E slide was scored manually into a lymphocyte-predominant, neutrophil-predominant or immune-cell-depleted phenotype [22]. The scoring was done by a senior pathologist and the Ph.D. and based on the most dominant immune cell on one tumor slide only by viewing the histology on HE staining. In this evaluation, the abundant stromal phenotype, i.e., a low cellular tumor, was associated with the lymphocyte-predominant phenotype. High tumor cellularity was significantly associated with poor survival (HR 4.287 (95%CI 1.460, 12.589), p-value 0.0081 for one unit increase). All results are summarized in Table 1.
3.3. Immune Cells Located at the Nerve Fibers Are Mainly B Cells
Single immunohistochemistry was used to define which immune cells are co-localized with the nerve fibers. The immune cells that presented in the direct surroundings of the nerve fibers were mainly CD20-positive. The definition of TLS differs based on the maturation stage, but it is commonly accepted that TLS are composed of a B cell zone and a T cell zone and may show the presence of a germinal center. To evaluate the maturity of the TLS, we used CD21 to define follicular dendritic cells. In our cohort, we found clusters of B lymphocytes with and without a T cell zone and follicular dendritic cells corresponding to different maturation stages of TLS. Multiplex immunofluorescence shows the architecture of a TLS in Pancreatic Cancer (see Figure 1), and this image provides an overview of the distribution of the immune cell aggregates at the edge of the tumor.
3.4. Machine Learning for Quantification of Lymphoid Aggregates
To gain insight into the spatial arrangements of the immune cells, we used machine learning to further measure the distance from the immune cells to the tumor glands. The slides were first scanned, and annotations were made in QuPath 0.1.6. A cell detection classifier was trained to recognize immune cells within a region of interest and to separate the immune cells from fibroblasts (see Figure 2). To obtain estimates for immune cell densities, a kernel-density was applied. The results are displayed as a heat map together with the slides tumor annotations (see Figure 3). To examine the predictive power of the number of lymphoid aggregates (LA) in combination with nerve fiber density and tumor cellularity on overall survival, an additional exploratory Cox regression model with LA, NFD and TC, as well as the interaction between LA and NFD or TC respectively was evaluated. As the interaction between LA and TC was non-significant at a 5% level, the interaction was removed from the model. Thus, the exploratory model contains LA, NFD, TC and the interaction between LA and NFD as explanatory factors. The significant NFD*LA interaction (p-value 0.0220) suggests that the effect of NFD is different by LA. For LA, number greater or equal to 5 mortality is significantly lower in patients with high NFD compared to patients with low NFD (20% (n = 14) vs. 10% (n = 7); HR 0.388 (95%CI 0.218, 0.689)), whereas for LA number less than 5, no significant difference between patients with high or low NFD could be shown (14% (n = 13) vs. 19% (n = 18); HR 0.959 (95%CI 0.573, 1.604)), which is also apparent in the corresponding Kaplan–Meier plot (See Figure 3).
4. Discussion
PDAC is known for its significant cancer-associated stroma or so-called tumor microenvironment. The large stromal component is a significant area of investigation and is held responsible for poor treatment response. In this study, we show that nerve fibers also play a role in the TME. Nerves are emerging regulators of cancer initiation, progression, and metastasis [23]. Previous data described by Renz et al. suggest that cholinergic signaling by the parasympathetic nerves can suppress the growth of pancreatic cancer cells, where the sympathetic nerves stimulate the growth of pancreatic cells. Therefore, in pancreatic cancer cells, there is a balance of neural influence [24]. Immune cells also play a role in nerves in cancer and are a potential target. There are many levels of neuroimmune interactions, including regulation of inflammation, that play a role in cancer growth and dissemination [25].
Neural invasion by tumor cells is one of the most striking characteristics of PDAC and is a sign of aggressive behavior. Surprisingly, in this study, we found that a high NFD is associated with better survival in patients with PDAC. We observed perineural tumor invasion of the bigger nerve trunks, and staining was positive in PGP9.5, but these nerves were not counted due to exclusion based on their size. The smaller nerve fibers were not associated with tumor invasion, and these nerve fibers were included in the counting method for NFD. Therefore, NFD is determined as the number of small nerve fibers, not to be confused by nerves, invaded by tumor cells. We found that these small nerve fibers are located around lymphoid aggregates and predict a better survival in patients with five or more lymphoid aggregates and a high NFD. The definition of TLS differs in the literature depending on the maturation stage. The presence or absence of a germinal center shows different maturation stages of the TLS [15]. Mature TLS show the presence of germinal centers with the expression of CD21 and CD23. With the use of machine learning, we could only be certain of the presence of lymphoid aggregates and to specify these aggregates as real TLS, further immunohistochemistry is needed.
PDAC is known for its tumor microenvironment, and here, cross-talk takes place between tumor and host. The immune environment is influenced by the tumor and the host. The immune system is known to have a crucial role in cancer, and this is possibly regulated by genetic and morphological features of the tumor. It is known that PDAC patients with higher levels of CD4+ and CD8+ T cells have a better survival [26]. Surrounding stromal cells support tumor budding of the cancer cells and promote aggressive behavior; it is described that this phenotype contains a depletion of TILs [27]. The presence of tumor-infiltrating lymphocytes (TILs) is a predictor of a better prognosis. In breast and ovarian cancer, a major component of TILs is the tumor-infiltrating lymphocytic B cells (TIL-B) [28]. In our study, we show many B-cells at the edge of the tumor. Previous literature has shown that B cells and tertiary lymphoid structures promote immunotherapy response in melanoma and sarcoma [4,5,6] and are of main importance for better survival. The role of nerve fibers in the co-localization with these lymphoid aggregates has the potential to discover new pathways for a better survival and it paves the way for new possible targets for (combination) therapy. We expect that these data may be broadly applicable to other malignancies.
Supplementary Materials
The following are available online at https://www.mdpi.com/2077-0383/10/3/490/s1. Figure S1. Kaplan-Meier plot of the survival probabilities of patients with high and low NFD. Figure S2. Forest plot of hazard ratios and corresponding 95% confidence limits.
Author Contributions
L.R.H., U.P.N. designed the study. L.R.H., X.T., G.J.W., J.N.K., J.M.N., G.v.d.K., M.R.A. were responsible for data analysis and interpretation. X.T., L.R.H. annotated all tumor samples manually. J.N.K., J.M.N., J.P.M.C. designed and implemented the algorithm. G.J.W., N.H. performed statistical analysis and interpretation. L.R.H., G.J.W., U.P.N., S.S. contributed to the first drafted initial manuscript. N.T.G., D.H.W.L. provided tumor blocks and histology expertise. T.L., S.W.M.O.D., U.P.N., S.L. provided infrastructure and supervised the study. D.P.M., J.B. revised the manuscript. All authors contributed to the data analysis and to writing the manuscript. All authors have read and agreed to the published version of the manuscript.
Funding
This research was funded by China Scholarship Council CSC Grant No:201806210074 (X.T.).
Institutional Review Board Statement
University Hospital of Aachen (RWTH Aachen) institutional ethics EK 106/18.
Informed Consent Statement
Written human patient consent was not necessary, because this study was based on retrospective chart review and archived pathology material. Nevertheless, most patients had signed informed consent; in some cases, informed consent was waived due to the lack of risk for the patient and the fact that those patients were unable to provide informed consent. Images from tissue specimens are entirely unidentifiable, and no details on individuals are reported within the manuscript.
Data Availability Statement
The data that support the findings of this study are available on request from the corresponding author, (L.R.H.).
Code Availability
Source codes are available at https://github.com/janniehues/PGP-pancreas/.
Conflicts of Interest
X.T. was funded by China Scholarship Council (CSC Grant No:201806210074). All other authors have nothing to disclose.”
References
- Bray, F.; Ferlay, J.; Soerjomataram, I.; Siegel, R.L.; Torre, L.A.; Jemal, A. Global cancer statistics 2018: GLOBOCAN estimates of incidence and mortality worldwide for 36 cancers in 185 countries. CA Cancer J. Clin. 2018, 68, 394–424. [Google Scholar] [CrossRef] [PubMed]
- Chen, D.S.; Mellman, I. Elements of cancer immunity and the cancer–immune set point. Nature 2017, 541, 321–330. [Google Scholar] [CrossRef]
- Feig, C.; Jones, J.O.; Kraman, M.; Wells, R.J.B.; Deonarine, A.; Chan, D.S.; Connell, C.M.; Roberts, E.W.; Zhao, Q.; Caballero, O.L.; et al. Targeting CXCL12 from FAP-expressing carcinoma-associated fibroblasts synergizes with anti-PD-L1 immunotherapy in pancreatic cancer. Proc. Natl. Acad. Sci. USA 2013, 110, 20212–20217. [Google Scholar] [CrossRef]
- Petitprez, F.; De Reyniès, A.; Keung, E.Z.; Chen, T.W.-W.; Sun, C.-M.; Calderaro, J.; Jeng, Y.-M.; Hsiao, L.-P.; Lacroix, L.; Bougoüin, A.; et al. B cells are associated with survival and immunotherapy response in sarcoma. Nature 2020, 577, 556–560. [Google Scholar] [CrossRef]
- Helmink, B.A.; Reddy, S.M.; Gao, J.; Zhang, S.; Basar, R.; Thakur, R.; Yizhak, K.; Sade-Feldman, M.; Blando, J.; Han, G.; et al. B cells and tertiary lymphoid structures promote immunotherapy response. Nature 2020, 577, 549–555. [Google Scholar] [CrossRef]
- Cabrita, R.; Lauss, M.; Sanna, A.; Donia, M.; Larsen, M.S.; Mitra, S.; Johansson, I.; Phung, B.; Harbst, K.; Vallon-Christersson, J.; et al. Tertiary lymphoid structures improve immunotherapy and survival in melanoma. Nature 2020, 577, 561–565. [Google Scholar] [CrossRef]
- Yuen, G.J.; Demissie, E.; Pillai, S. B Lymphocytes and Cancer: A Love–Hate Relationship. Trends Cancer 2016, 2, 747–757. [Google Scholar] [CrossRef]
- Germain, C.; Gnjatic, S.; Dieu-Nosjean, M.-C. Tertiary Lymphoid Structure-Associated B Cells are Key Players in Anti-Tumor Immunity. Front. Immunol. 2015, 6, 67. [Google Scholar] [CrossRef] [PubMed]
- Sarvaria, A.; Madrigal, J.A.; Saudemont, A. B cell regulation in cancer and anti-tumor immunity. Cell. Mol. Immunol. 2017, 14, 662–674. [Google Scholar] [CrossRef] [PubMed]
- Tsou, P.; Katayama, H.; Ostrin, E.J.; Hanash, S.M. The Emerging Role of B Cells in Tumor Immunity. Cancer Res. 2016, 76, 5597–5601. [Google Scholar] [CrossRef] [PubMed]
- Chen, P.-L.; Roh, W.; Reuben, A.; Cooper, Z.A.; Spencer, C.N.; Prieto, P.A.; Miller, J.P.; Bassett, R.L.; Gopalakrishnan, V.; Wani, K.; et al. Analysis of Immune Signatures in Longitudinal Tumor Samples Yields Insight into Biomarkers of Response and Mechanisms of Resistance to Immune Checkpoint Blockade. Cancer Discov. 2016, 6, 827–837. [Google Scholar] [CrossRef] [PubMed]
- Pylayeva-Gupta, Y.; Das, S.; Handler, J.S.; Hajdu, C.H.; Coffre, M.; Koralov, S.B.; Bar-Sagi, D. IL35-Producing B Cells Promote the Development of Pancreatic Neoplasia. Cancer Discov. 2016, 6, 247–255. [Google Scholar] [CrossRef] [PubMed]
- Carragher, D.M.; Rangel-Moreno, J.; Randall, T.D. Ectopic lymphoid tissues and local immunity. Semin. Immunol. 2008, 20, 26–42. [Google Scholar] [CrossRef] [PubMed]
- Colbeck, E.J.; Ager, A.; Gallimore, A.; Jones, G.W. Tertiary Lymphoid Structures in Cancer: Drivers of Antitumor Immunity, Immunosuppression, or Bystander Sentinels in Disease? Front. Immunol. 2017, 8, 1830. [Google Scholar] [CrossRef] [PubMed]
- Sautès-Fridman, C.; Petitprez, F.; Calderaro, J.; Fridman, W.H. Tertiary lymphoid structures in the era of cancer immunotherapy. Nat. Rev. Cancer 2019, 19, 307–325. [Google Scholar] [CrossRef] [PubMed]
- Dieu-Nosjean, M.-C.; Goc, J.; Giraldo, N.A.; Sautès-Fridman, C.; Fridman, W.H. Tertiary lymphoid structures in cancer and beyond. Trends Immunol. 2014, 35, 571–580. [Google Scholar] [CrossRef] [PubMed]
- Siliņa, K.; Soltermann, A.; Attar, F.M.; Casanova, R.; Uckeley, Z.M.; Thut, H.; Wandres, M.; Isajevs, S.; Cheng, P.F.; Curioni-Fontecedro, A.; et al. Germinal Centers Determine the Prognostic Relevance of Tertiary Lymphoid Structures and Are Impaired by Corticosteroids in Lung Squamous Cell Carcinoma. Cancer Res. 2018, 78, 1308–1320. [Google Scholar] [CrossRef]
- Hiraoka, N.; Ino, Y.; Yamazaki-Itoh, R.; Kanai, Y.; Kosuge, T.; Shimada, K. Intratumoral tertiary lymphoid organ is a favourable prognosticator in patients with pancreatic cancer. Br. J. Cancer 2015, 112, 1782–1790. [Google Scholar] [CrossRef]
- Fukunaga, A.; Miyamoto, M.; Cho, Y.; Murakami, S.; Kawarada, Y.; Oshikiri, T.; Kato, K.; Kurokawa, T.; Suzuoki, M.; Nakakubo, Y.; et al. CD8+ Tumor-Infiltrating Lymphocytes Together with CD4+ Tumor-Infiltrating Lymphocytes and Dendritic Cells Improve the Prognosis of Patients with Pancreatic Adenocarcinoma. Pancreas 2004, 28, e26–e31. [Google Scholar] [CrossRef]
- Zhao, Q.; Yang, Y.; Liang, X.; Du, G.; Liu, L.; Lu, L.; Dong, J.; Han, H.; Zhang, G. The clinicopathological significance of neurogenesis in breast cancer. BMC Cancer 2014, 14, 484. [Google Scholar] [CrossRef]
- Lin, D.Y.; Wei, L.J.; Ying, Z. Checking the Cox Model with Cumulative Sums of Martingale-Based Residuals. Biometrika 1993, 80, 557–572. [Google Scholar] [CrossRef]
- De Santiago, I.; Yau, C.; Heij, L.; Middleton, M.R.; Markowetz, F.; Grabsch, H.I.; Dustin, M.L.; Sivakumar, S. Immunophenotypes of pancreatic ductal adenocarcinoma: Meta-analysis of transcriptional subtypes. Int. J. Cancer 2019, 145, 1125–1137. [Google Scholar] [CrossRef] [PubMed]
- Faulkner, S.; Jobling, P.; March, B.; Jiang, C.C.; Hondermarck, H. Tumor Neurobiology and the War of Nerves in Cancer. Cancer Discov. 2019, 9, 702–710. [Google Scholar] [CrossRef] [PubMed]
- Renz, B.W.; Tanaka, T.; Sunagawa, M.; Takahashi, R.; Jiang, Z.; Macchini, M.; Dantes, Z.; Valenti, G.; White, R.A.; Middelhoff, M.A.; et al. Cholinergic Signaling via Muscarinic Receptors Directly and Indirectly Suppresses Pancreatic Tumorigenesis and Cancer Stemness. Cancer Discov. 2018, 8, 1458–1473. [Google Scholar] [CrossRef]
- Dantzer, R. Neuroimmune Interactions: From the Brain to the Immune System and Vice Versa. Physiol. Rev. 2018, 98, 477–504. [Google Scholar] [CrossRef]
- Balachandran, V.P.; Łuksza, M.; Zhao, J.N.; Makarov, V.; Moral, J.A.; Remark, R.; Herbst, B.; Askan, G.; Bhanot, U.; Senbabaoglu, Y.; et al. Identification of unique neoantigen qualities in long-term survivors of pancreatic cancer. Nature 2017, 551, 512–516. [Google Scholar] [CrossRef]
- Karamitopoulou, E. Tumour microenvironment of pancreatic cancer: Immune landscape is dictated by molecular and histopathological features. Br. J. Cancer 2019, 121, 5–14. [Google Scholar] [CrossRef]
- Roghanian, A.; Fraser, C.; Kleyman, M.; Chen, J. B Cells Promote Pancreatic Tumorigenesis. Cancer Discov. 2016, 6, 230–232. [Google Scholar] [CrossRef]
Publisher’s Note: MDPI stays neutral with regard to jurisdictional claims in published maps and institutional affiliations. |
© 2021 by the authors. Licensee MDPI, Basel, Switzerland. This article is an open access article distributed under the terms and conditions of the Creative Commons Attribution (CC BY) license (http://creativecommons.org/licenses/by/4.0/).