Review

Molecular and Metabolic Subtypes Correspondence for Pancreatic Ductal Adenocarcinoma Classification

by
Pilar Espiau-Romera
,
Sarah Courtois
,
Beatriz Parejo-Alonso
and
Patricia Sancho
*
Translational Research Unit, Hospital Universitario Miguel Servet, IIS Aragon, 50009 Zaragoza, Spain
*
Author to whom correspondence should be addressed.
J. Clin. Med. 2020, 9(12), 4128; https://doi.org/10.3390/jcm9124128
Submission received: 14 October 2020 / Revised: 14 December 2020 / Accepted: 17 December 2020 / Published: 21 December 2020
(This article belongs to the Special Issue Pancreatic Cancer: Challenges and Breakthroughs)

Abstract

:
Pancreatic ductal adenocarcinoma (PDAC), the most common form of pancreatic cancer, is an extremely lethal disease due to late diagnosis, aggressiveness and lack of effective therapies. Considering its intrinsic heterogeneity, patient stratification models based on transcriptomic and genomic signatures, with partially overlapping subgroups, have been established. Besides molecular alterations, PDAC tumours show a strong desmoplastic response, resulting in profound metabolic reprogramming involving increased glucose and amino acid consumption, as well as lipid scavenging and biosynthesis. Interestingly, recent works have also revealed the existence of metabolic subtypes with differential prognosis within PDAC, which correlated to defined molecular subclasses in patients: lipogenic subtype correlated with a classical/progenitor signature, while glycolytic tumours associated with the highly aggressive basal/squamous profile. Bioinformatic analyses have demonstrated that the representative genes of each metabolic subtype are up-regulated in PDAC samples and predict patient survival. This suggests a relationship between the genetic signature, metabolic profile, and aggressiveness of the tumour. Considering all this, defining metabolic subtypes represents a clear opportunity for patient stratification considering tumour functional behaviour independently of their mutational background.

Graphical Abstract

1. Introduction

Pancreatic ductal adenocarcinoma (PDAC) is considered one of the most aggressive solid malignancies. It represents the third cause of cancer-related deaths in industrialised countries today [1] and it is predicted to become the second by 2030 [2]. Despite progress in the understanding of the molecular and genetic basis of this disease, five-year survival rates have remained below 10% after diagnosis and one-year survival occurs in only 28% of cases [3].
The reasons for the poor prognosis of this disease include bad accessibility to the organ, absence of distinct symptoms and high rate of metastasis, occurring in about 50% of patients [4]. On the other hand, there are no reliable biomarkers approved for early diagnosis [5].
Currently, the only available curative option for PDAC patients is surgical resection followed by adjuvant chemotherapy [4]. However, this occurs in a minority of patients, since 80–90% of them are diagnosed with advanced disease when the tumour is not resectable [6,7]. In addition, the heterogeneity and plasticity of PDAC tumours lead to chemoresistance [8]. In fact, several phase III trials of chemotherapy agents or targeted therapies effective in other malignancies have failed to benefit unselected PDAC populations. In addition, with the exception of the rare subset of mismatch repair-deficient tumours, checkpoint inhibitors have failed to show efficacy in metastatic patients.
Under such circumstances, the solution possibly lies in early detection and proper classification of patients [4]. Patient stratification has become an invaluable tool for the clinical management of cancer patients, providing diagnostic and prognostic information and, crucially, guiding therapeutic decisions, especially when targeted therapies for a specific mutation or subgroup are available. In fact, stratification had a key role improving survival rates in diseases such as breast cancer. However, patient stratification based on histomorphological or molecular features in PDAC has proved challenging, severely delaying the identification of such targeted therapies. This, together with the undruggable nature of mutated K-RAS (although clinical trials are underway to inhibit the mutation K-RASG12C), limits PDAC treatment to ineffective conventional chemotherapy. Genomic studies have revealed subtypes of PDAC based on their molecular features, but diverse studies have reported different classification systems incompletely overlapping. Interestingly, increasing efforts are being made in different directions. In fact, recent data suggest that PDAC tumours could also be classified attending to their metabolic phenotype.
In this review, we describe and analyse the correspondence of most of the published molecular and metabolic signatures of PDAC and propose a modified metabolic signature that could stratify patients according to metabolic needs independently of the mutational load.

2. PDAC Mutational Profile

Many studies have been conducted on PDAC samples to determine molecular aberrations at DNA, RNA, protein and epigenetic levels [9]. In general terms, mutations in individual genes comprise 10 main pathways: DNA damage repair (TP53 or BRCA2), cell cycle regulation (Cyclin-Dependent Kinase Inhibitor 2A, CDKN2A), Transforming growth factor-beta (TGF-β) pathway (SMAD4), NOTCH and WNT signalling, chromatin regulation, Extracellular Signalling Regulated Kinases (ERK)-Mitogen-Activated Protein Kinases (MAPK) signalling (K-RAS, B-RAF), axonal guidance and RNA processing [10,11].
Altogether, K-RAS gain of function, accounting for up to 90% of PDAC cases, and inactivation of the tumour suppressor genes p16/CDKN2A, SMAD4 and TP53 contribute to PDAC formation, maintenance, progression and, ultimately, metastasis onset. Occasionally, the mutations occur in other components of the pathway in which they are involved [9,12,13]. In addition, genome-wide and exome-wide analyses have identified a long list of less frequent alterations in genes related to axon orientation or DNA damage repair, such as BRCA1 or BRCA2 [12,14,15]. Moreover, most PDACs show complex patterns of chromosomal rearrangement [16,17].
Some findings have suggested a linear pathway of evolution from normal cells to PDAC cells, in which not all mutations occur at the same time. Telomere shortening is considered the trigger of pancreatic tumorigenesis by inducing genetic instability, coupled with a mutation in the K-RAS gene. Surviving cells are then altered by loss of CDKN2A function. In third place, the tumour suppressor genes TP53 and SMAD4 are inactivated, leading to intermediate stages called pancreatic intraductal neoplasias (PanINs) and, ultimately, full-blown PDAC [10,18]. However, it seems that in some cases, CDKN2A, TP53 and SMAD4 mutations can occur in a single event, which is called “punctuated equilibrium” [11].

2.1. K-RAS

K-RAS is one of the three mutationally activated forms of the Ras protein, together with H-RAS and N-RAS. It is the most represented one among all cancers bearing RAS mutations, and the one exclusively mutated in PDAC. Moreover, it is known to be the main driver mutation for this disease, since K-RAS is mutated in >90% of the cases, thus making PDAC the most RAS-addicted of all cancer types [19]. However, K-RAS activation alone is not sufficient for PDAC development [20,21].
Ras proteins are small GTPases that act as signalling switches regulating cell proliferation, survival, differentiation and inflammation, by activating the MAPK module. In a normal scenario, Ras is found in its inactive form coupled to guanosine diphosphate (GDP) and, upon activation by diverse extracellular stimuli, Ras becomes active by coupling guanosine triphosphate (GTP), thus switching on downstream effectors such as ERKs, Jun Amino-Terminal Kinases (JNKs), Stress-Activated Protein Kinases (p38/SAPKs) and PI3K/PDK1/AKT, amongst others [22,23]. In PDAC and other cancers bearing oncogenic K-RAS mutations, this protein is constitutively active in a GTP-bound state. PDAC-associated K-RAS alterations mainly harbour missense mutations that depend on allele dosage for tumorigenesis and metastasis onset, and contribute to PDAC evolution from PanINs to final cancer formation with the loss of other key PDAC-driving players [24].

2.2. p16/CDKN2A

Along the evolutionary course of PDAC onset, K-RAS mutation is followed by the occurrence of genetic alterations in the tumour suppressor gene CDKN2A in 95% of PDAC patients [24]. Tumour suppressor genes are important to restrain aberrant cell proliferation in the context of oncogenic signalling and, to that end, these genes rely on different strategies such as cell cycle arrest, apoptosis or senescence induction. Specifically, the gene CDKN2A, encoding for P16INK4a and P14RF proteins, shows a dual mechanism: P16INK4a inhibits Cyclin Dependent Kinases (CDK) 2 and 4, thus preventing cell cycle to progress into S-phase, while P14RF triggers P53 by inhibiting its inhibitor, Mouse double minute 2 homolog (MDM2), thereby inducing growth arrest and apoptosis [25].

2.3. TP53

P53, the protein encoded by the TP53 gene, is known to be the “genome guardian” due to its essential role upon chromatin damage. Amongst its main functions, we find cell cycle blockade and activation of DNA repair enzymes. Ultimately, P53 may lead the cell to a senescence state and/or apoptosis when DNA damage is no longer reparable. Genetic inactivation of TP53 is present in up to 75% of all PDAC cases and appear in advanced PanINs after loss of CDKN2A. Loss of functional P53 leads to an uncontrolled state of proliferation [25]. Importantly, mutant P53 may contribute to metastatic progression of K-RAS-driving PDAC-bearing mice, highlighting a novel role of this transcription factor in late stages of PDAC beyond the malignant transformation of PanINs into PDAC [26,27].

2.4. SMAD4

SMAD4 serves as the central mediator of TGF-β pathway and it is known to be the fourth and, together with TP53, ultimate driver for PDAC initiation [28]. However, the role of SMAD4 in the pathogenesis of PDAC is complex and its final results are context-dependent. On the one hand, the TGF-β pathway is a well-accepted epithelial-to-mesenchymal transition (EMT) inducer [29], and also in PDAC [25], thus highlighting its pro-tumorigenic potential. Conversely, Smad4 signalling in the KPC (LSL-KrasG12D/+;LSL-Trp53R172H/+;Pdx-1-Cre) mouse PDAC model mediates a tumour suppressive process known as “lethal EMT”. In this scenario, Smad4 triggers apoptosis through repression of the gastrointestinal lineage-master regulator Klf5 and, consequently, inhibits PDAC progression induced by Klf5/Sox4. Consequently, the loss of SMAD4 tumour suppressive function may contribute to pancreatic oncogenesis through the TFG-β canonical pathway [30].

3. PDAC Molecular Signatures

Besides purely mutational analyses, a considerable number of genomic and transcriptomic studies in patient samples have identified the existence of PDAC subtypes with prognostic and biological relevance, as detailed below.
Collisson et al. [31] reported the first exhaustive transcriptomic analysis on clinical samples, and based their classification on gene expression and molecular profiling. PDAC tissues were classified into “classical”, “quasi-mesenchymal” and “exocrine-like” (Table 1), with different prognoses and responses to selected therapies. The classical subtype showed high expression of epithelial and adhesion-associated genes, such as the transcription factor GATA6, and favourable prognosis regarding survival after PDAC resection. On the other hand, the quasi-mesenchymal subtype exhibited high expression of mesenchymal-associated genes, was relatively less dependent on K-RAS than the classical one, and, importantly, was associated with poor prognosis. Finally, the exocrine-like subtype revealed high expression of digestive exocrine enzyme genes. However, the last subtype was not found in cancer cell lines, raising concerns about its specificity [32].
Moffitt et al. [33] performed transcriptional analysis to classify PDAC tumours into two subtypes within two different tissues (Table 1): tumour and stroma. Based on tumour cells, PDAC samples were classified into “classical” and “basal” subtypes. The classical group was enriched in SMAD4 and GATA6, while the basal subtype was molecularly similar to basal tumours in bladder and breast cancer. Although classical tumours showed better prognosis, patients with basal tumours responded better to adjuvant therapy. On the other hand, the stroma was divided into “normal” and “activated” subtypes. The normal stromal group showed high levels of markers for pancreatic stellate cells, smooth muscle actin, vimentin and desmin. However, the activated stromal subtype was defined by a complex set of genes associated with macrophages, tumour promotion and fibroblast activation; this described an activated pro-tumorigenic inflammatory stromal response with poor prognosis. Comparing their signature with Collisson’s [31], Moffitt et al. found an overlap between both classical subtypes, while genes in the quasi-mesenchymal subtype seemed a mixed selection of genes from basal and stromal subtypes (Table 2) [33].
Later, Bailey et al. [10] defined new molecular subtypes of PDAC based on comprehensive integrated genomic analysis and RNA expression profiles: “squamous”, “pancreatic progenitor”, “aberrantly differentiated endocrine exocrine” (ADEX) and “immunogenic” (Table 1). The squamous subtype was linked to hypermethylation and down-regulation of genes determining endodermal identity in pancreas, with poor prognosis in patients. It was also enriched in TP53 and KDM6A mutations and up-regulation of the transcriptional network TP63ΔN. PDAC progenitor-type tumours expressed genes involved in early development of the pancreas, such as PDX1. The ADEX class overexpressed transcriptional pathways present in K-RAS activation and in late stages of pancreatic development and differentiation. Lastly, the immunogenic subtype had pancreatic progenitor features, but it was related to acquired immune suppression pathways (CTLA4 and PD-1) and strong immune infiltration (B and T cells). When they compared their classification with earlier studies, three of their classes directly overlapped with Collisson’s groups [31]: Collisson’s classical, quasi-mesenchymal and exocrine-like subtypes matched Bailey’s pancreatic progenitor, squamous and ADEX groups, respectively (Table 2). In addition, 50% of the squamous subtype tumours were included in Moffitt’s basal subgroup [33].
In 2018, Zhao et al. [34] conducted a retrospective meta-analysis of complete transcriptome data from patients with PDAC (Table 1). They obtained six different subtypes grouped in tumour- (L1, L2 and L6) and stromal-specific (L3, L4 and L5) subtypes. L1, L2 and L6 were all enriched in metabolic genes, as detailed in Section 5. Besides metabolism, the subtypes were differentially enriched in other routes: L2 was related to cell proliferation and epithelium genes, such as CDKN2A; L3 had increased regulation of collagen and extracellular matrix (ECM)-associated genes; L4 had an immune profile; L5 was involved in neuroendocrine and insulin-related pathways; L6 showed activity of digestive enzymes. Each expression profile was related to clinical data: epithelium and proliferation in L2 showed the poorest prognosis, immune and neuroendocrine profiles at L4 and L5 showed the best outcomes. Considering the above stratifications of PDAC, Zhao et al. found that L1 and L6 were very similar to the classical Moffit’s subtype, while L2 approached their basal subtype (Table 2). L1, L2 and L6 were close to the activated subtype. In Bailey’s dataset, L1 and L4 approximated the immunogenic subtype, L2 the squamous, L3 the pancreatic progenitor and L6 resembled the ADEX subtype. Finally, L1 and L3 were similar to Collison’s classical subtype, L2 approached the quasi-mesenchymal and L6 related to the exocrine-like one.
Lomberk et al. [35] identified epigenomic landscapes of PDAC subtypes by performing an integrative analysis of genome-wide Chromatin Immunoprecipitation-sequencing (ChIP-seq) on multiple histone modifications, as well as RNA-sequencing (RNA-seq) and DNA methylation studies (Table 1). They reported two subtypes: “classical” and “basal”, which correlated with clinical parameters. Super enhancer mapping coupled with Transcription Factor (TF) binding motif and up-regulation analysis showed that classical tumours were related to TFs involved in development of the pancreas, metabolic regulators and K-RAS signalling, while basal tumours correlated with proliferative and EMT TF nodes. The basal samples were linked to a more aggressive phenotype than the classical ones.
Maurer et al. [36] used Laser Capture Microdissection (LCM) to separate stromal and epithelial compartments of PDAC bulk tumour samples, and confirmed using machine learning techniques that stromal contamination may interfere with PDAC classification (Table 1). In addition, they described two epithelial subtypes of PDAC that correlated with the classical and basal subtypes from Moffit et al., with the basal subtype having a poorer prognosis than the classical (Table 2). Moreover, they identified two stromal subtypes, an “immune-rich” group characterised by high immune and interleukin levels, and an “ECM-rich” group, associated with extracellular matrix pathways. The ECM-rich subtype appeared to have decreased survival compared with the immune-rich one. Finally, they found an association of the epithelial and stromal subtypes in which the basal epithelium subtype and the ECM-rich stroma were linked.
In 2020, Dijk et al. [37] conducted an unsupervised consensus clustering and identified four molecular subtypes: “secretory”, “epithelial”, “compound pancreatic” and “mesenchymal” (Table 1). The secretory subtype showed enrichment in endocrine and exocrine pathways of the pancreas. Tumours of the epithelial subtype were characterised by up-regulation of the MYC oncogene and high expression of mitochondrial components and ribosome signature. The mesenchymal subtype had high levels of K-RAS transcription and was enriched in pathways related to EMT, stromal signalling and TGF-β. The compound pancreatic subtype presented similar characteristics to the mesenchymal subtype but, in addition, was enriched in endocrine functions. The secretory and mesenchymal subtypes presented worse prognosis than the epithelial and compound pancreatic ones. Dijk et al. found an interconnection between these subtypes and those described by Collison, Bailey and Moffit (Table 2). For example, the secretory subtype correlated significantly with Collison’s exocrine-like, Bailey’s ADEX, and Moffit’s basal subtypes. The epithelial subtype shared characteristics with the Collison’s and Moffit’s classical subtypes, but also with the Bailey´s pancreatic progenitor and squamous subtypes. The compound pancreatic group was similar to Collison’s exocrine, Bailey’s ADEX and Moffit’s classical. Lastly, the mesenchymal subtype correlated with Collison’s quasi-mesenchymal, Bailey’s squamous and Moffit’s basal.
Chan-Seng-Yue et al. [38] performed whole genome sequencing and both bulk and single-cell RNAseq analyses on laser capture microdissected tumours from more than 200 late-stage patients. They identified three major subtypes: “classical”, “basal-like” and “hybrid” (Table 1). Although the classical and basal-like subtypes were fairly overlapped with the previous classifications by Moffit, Bailey and Collison (Table 2), they found that these subtypes could be subdivided into A and B subclasses with differences in their response to chemotherapy, aggressiveness and disease stage. For example, basal-like A tumours are highly chemoresistant and feature a high squamous signature enriched in metastatic tumours, while basal-like B tumours correspond to a low squamous signature present in resectable tumours. Importantly, they found that classical and basal-like programs co-exist within a tumour and demonstrated that molecular subtypes are linked to a specific copy number aberrations in genes such as mutant K-RAS (basal-like subtype) and GATA6 (classical subtype).
Finally, Nicolle et al. [39] proposed a molecular gradient classification to stablish a PDAC transcriptomic signature that could better represent the existence of intermediate cellular phenotypes between classical and basal-like subtypes (Table 1). In this study, they graded Patient-Derived Xenografts (PDXs) according to different molecular levels of differentiation and confirmed that the higher expression of genes linked to the classical PDAC subtype (GATA6) was correlated with increased differentiation of PDX samples, while lower expression of genes was linked to the basal-like subtype. They also found that the higher the differentiation of the tumour, the better the prognosis and response to chemotherapy.
Interestingly, although partial overlap amongst the different signatures and molecular subtypes can be found in these studies, recent works using single-cell transcriptomics demonstrated that several subtypes can co-exist within a tumour [38,40], further underlining the high level of heterogeneity present in PDAC tumours. Undoubtedly, more efforts in this direction are required to further dissect the complexity of these tumours, as well as to decipher the interplay of the different subpopulations during disease progression.

4. Metabolic Reprogramming in PDAC

At the histological level, one of the most notable characteristics of PDAC is its dense stroma, being up to 90% of the tumour volume. Its main features are extensive fibrosis, lack of vascularisation, hypoxia and immune infiltration. Hypoxia is associated with increased cancer cell proliferation, survival, EMT, invasiveness and metastasis [41].
The lack of vascularisation not only causes hypoxia in the tumour, but also causes metabolic stress due to nutrient deprivation. As a result, tumour cells undergo the so-called “metabolic reprogramming”, an updated hallmark of cancer [32,42]. Cancer cells increase nutrient acquisition along with enhanced flow through anabolic pathways. This leads to increased glycolysis and glucose transport, high glutamine consumption, lipid and amino acid biosynthesis and maintenance of redox homeostasis. In addition, recycling of cellular components also occurs through autophagy, which degrades macromolecular complexes and organelles into individual metabolites [41,43,44,45].

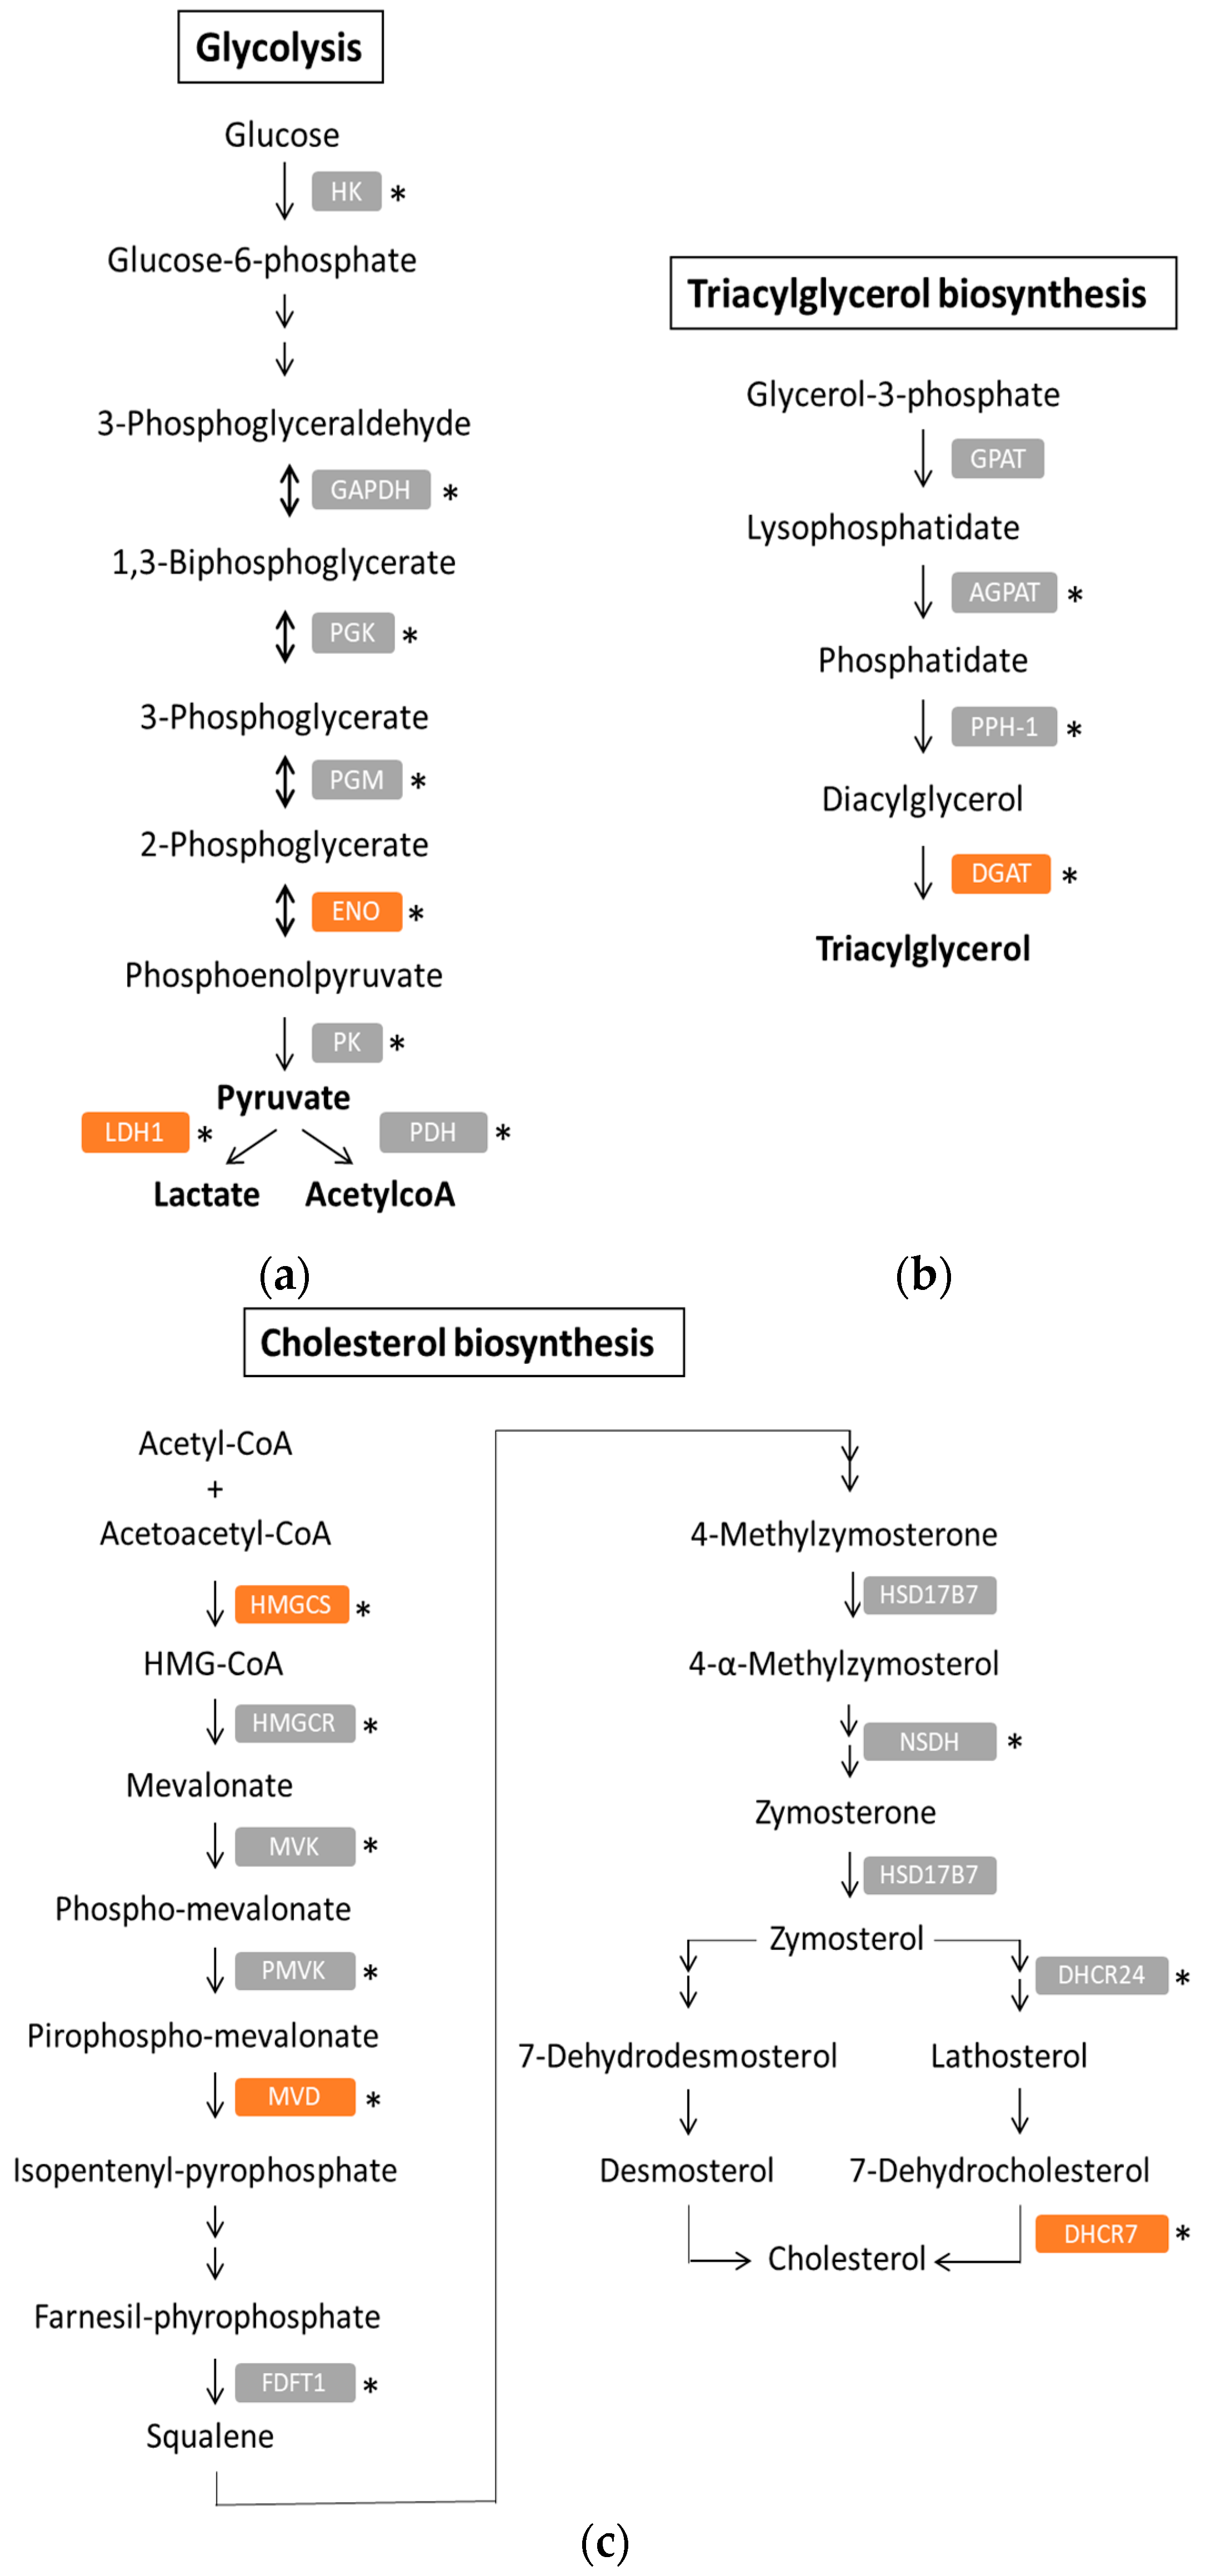
4.1. Warburg Phenotype

The major example of metabolic reprogramming is higher glucose consumption. The role of glucose metabolism in cancer was well defined by Otto Warburg back in the late 1920s, leading to be considered one of the hallmarks of cancer [46]. Glycolytic flow is precisely controlled to fulfil rapid proliferative and synthetic needs. Unlike normal cells, tumour cells have high levels of glycolysis, even in the presence of oxygen and reduced mitochondrial function, leading to a state called “aerobic glycolysis”, also called the “Warburg effect”. On the other hand, the “reverse Warburg effect” describes a two-compartment model in which cancer cells induce aerobic glycolysis in the stromal cells, whose glycolysis end-products are transferred to the cancer cells to feed mitochondrial oxidative phosphorylation (OXPHOS). This allows tumours to respond to variations in nutrient availability and to optimise cell proliferation and growth [47]. Interestingly, this two-compartment model can also be applied considering the functional heterogeneity of cancer cells in PDAC: glycolytic differentiated tumour cells could provide substrates to oxidative cancer stem cells (CSCs) [48].
A hypothesis for metabolic rewiring towards enhanced glycolysis over the reduction of mitochondrial oxidation as a source of ATP in PDAC is the presence of a dense desmoplastic stroma, which basically impedes neovascularisation. This creates a hypoxic microenvironment in which oxygen and nutrients are limited [49]. This state creates a positive feedback loop by which, on the one hand, pancreatic cancer cells feel a selective pressure under the hypoxic and nutrient shortage where only the most aggressive populations will remain. On the other hand, under such stress-driven situations, pancreatic cancer cells are forced to modify their metabolism in order to cope with their bioenergetic demands for PDAC progression, expansion and dissemination through the blood vessels towards less scarce environments [50]. Indeed, a recent study demonstrated that glycolysis and hypoxia signatures correlate in PDAC and that Prolyl 4-Hydroxylase subunit Alpha 1 (P4HA1), a critical enzyme involved in collagen synthesis, controls glycolysis through HIF1α stabilisation [51]. Moreover, gene expression arrays of metastatic PDAC revealed a glycolysis-based signature characterised by increased expression of many glycolytic enzymes [52], highlighting the importance of glycolytic metabolism in PDAC progression. In fact, Liu et al. recently demonstrated that the EMT-related gene SNAIL was able to induce a migratory phenotype in PDAC cell lines by promoting mesenchymal-related genes expression along with enhanced glucose uptake and lactate production [53].
Overall, the glycolytic state is characterised by an increased expression of glycolytic enzymes and glucose and lactate transporters, such as Glucose Transporter 1 (GLUT1), and Monocarboxylate Transporters 1 and 4 (MCT1, MCT4) [54,55]. Specifically, the overexpression of these membrane transporters leads to an enhanced glucose scavenging from the hypovascularised tumour microenvironment, which results in increased glucose availability in the cancer cell as well as a better balance of the glucose pathway in order to keep glycolysis at high rate. On the one hand, GLUT1 is an ATP-independent glucose transporter that enables glucose transference from a high-gradient extracellular compartment to low-gradient cytoplasmic compartment. Its expression dosage has been reported to be associated with PDAC progression from low- to high-grade pancreatic preneoplastic lesions when compared to normal pancreas [54]. On the other hand, MCT1 and MCT4 are proton-coupled symport transporters with higher affinity for lactate efflux. These transporters implicated in glucose homeostasis are required for cancer cells to neutralise intracellular acidification due to the increased glycolytic rate and have been reported to be overexpressed in PDAC. Kong et al. showed that inhibition or knockdown of MCT resulted in an inhibited lactate flux. Interestingly, they also demonstrated that these transporters are implicated in PDAC cell lines invasiveness, thus highlighting once again the implications of glucose homeostasis in pancreatic cancer [56].
Importantly, the up-regulation of most of these genes is mediated by PDAC driver mutations on K-RAS and TP53. As reviewed by Bryant et al. [57], oncogenic K-RAS enhances the expression of many glycolytic enzymes such as GLUT1, Hexokinase 1 and 2 (HK1, HK2) and Lactate Dehydrogenase A (LDHA), thus increasing glycolytic flux. This metabolic reprogramming towards glycolysis contributes to an enhanced survival of glycolytic PDAC cell lines in the presence of low levels of glucose. Moreover, another study based on transcriptome and metabolome analyses showed that mutant K-RAS in advanced PDAC mouse models is necessary for an enhanced glucose uptake [57]. This study also revealed that aberrant K-RAS is implicated in glucose metabolism intermediates channelling into different anabolic pathways, such as the hexosamine biosynthesis pathway (HBP) and pentose phosphate pathway (PPP), thus proving that glucose metabolism is necessary to fuel anabolic branches of PDAC metabolism to provide the cancer cells with building blocks for its increased proliferation demands [58]. Moreover, the enhanced expression of the glycolytic enzymes was demonstrated to be related to bad PDAC prognosis, invasiveness and metastases onset [59].

4.2. Lipid Metabolism in PDAC

PDAC tumours are also highly dependent on lipid metabolism [60,61] and, in fact, a high fat diet was shown to support tumour growth in murine models [60]. On the one hand, fatty acids (FA) can be provided exogenously by the absorption of extracellular lipids (from diet, liver synthesis or adipose tissue). For example, cancer-associated adipocytes can provide adipokines and lipids to cancer cells [62], increasing pancreatic cancer cell aggressiveness [63]. The exogenous FA uptake requires the presence of the transporter CD36 and FA-binding proteins (FABPs). CD36 can also influence gemcitabine resistance in PDAC, by regulating anti-apoptosis proteins [64,65]. Unsurprisingly, PDAC patients with high CD36 expression have lower overall survival and recurrence-free survival rates than patients with low expression. In this context, CD36 could be considered as an unfavourable prognosis factor and the use of anti-CD36 strategies in association with conventional chemotherapies could represent a promising therapeutic approach [64,66].
On the other hand, pancreatic cancer cells can synthesise de novo lipids through the lipogenesis process, producing more than 90% of the triacylglycerol-FA. This process uses the mitochondrial citrate produced from the tricarboxylic acid (TCA) cycle fuelled by glucose and/or glutamine as carbon sources [67]. Lipogenic enzymes are often overexpressed in PDAC cells; for example Fatty Acid Synthase (FASN) is particularly prominent and associated with poor prognosis [61,68,69,70]. The pharmacological inhibition of this enzyme reduces stemness features and gemcitabine resistance in pancreatic cancer cells [71]. The produced triacylglycerol molecules are stored in lipid droplets and a correlation was established between the accumulation of lipid droplets and tumour progression and aggressiveness [72]. Likewise, an elevated lipid synthesis correlates with CSC properties and survival in different types of cancer [72]. Thus, cancer cells acquire FA through either lipid uptake or de novo lipogenesis, and activate intracellular lipolysis to mobilise the FA stocks.
FA sustain three requirements of PDAC development and cancer cells in general: cell membrane formation, biosynthesis of signalling molecules and lipid-derived messengers, and energy production. First of all, lipid synthesis is an important requirement of highly proliferative cancer cells to sustain membrane formation [72]. From de novo synthesis, saturated or monounsaturated FA modulate membrane fluidity and form more dense membrane layers that may reduce the uptake of drugs and contribute to therapy-resistance [73]. Moreover, lipids are implicated in signal transduction in two different ways: by building lipid rafts modulating protein recruitments and interactions, as well as by formation of lipidic signalling molecules. This is the case for phosphatidylinositol-3,4,5-trisphosphate [PI(3,4,5)P3], able to activate the protein kinase B/AKT and stimulate cell proliferation and survival [73]. Finally, FA represent an important source of energy in non-glycolytic tumours, using the mitochondrial β-oxidation (fatty acid oxidation, FAO) to produce ATP [72,73]. In that context, Luo et al. demonstrated that the use of etomoxir, an inhibitor of FAO by blocking the entrance of FA in the mitochondria via Carnitine Palmitoyl Transferase 1A (CPT1A), can restore the sensitivity of pancreatic CSCs to gemcitabine by inducing an energy crisis in those cells [74]. These data suggest that CPT1A is an important actor of the cancer metabolism reprogramming and could represent an attractive therapeutic target, and highlight how this process is important for the cancer cell to supply ATP under energy stress.
Additionally, PDAC cells are also highly dependent on cholesterol, as it contributes, for example, to the formation of lipid rafts, thus modulating the recruitment of key oncogenes receptor such as the Epidermal Growth Factor (EGF)-receptor and regulating survival pathways. Cancer cells can increase their content through either synthesis (through mevalonate pathway) or endocytosis mediated by low-density lipoproteins (LDL) and LDL Receptor (LDLR). In PDAC patients, cholesterol biosynthesis is associated with a more differentiated phenotype (classical subtype), while high LDLR expression correlates with a higher risk of tumour recurrence. Interestingly, inhibition of cholesterol synthesis induced a mesenchymal phenotype [75] while blocking cholesterol uptake via the knock-down of LDLR was able to sensitise PDAC cells to chemotherapy [76,77].
Taken together, all these reports prove the potential of lipid metabolism targeting in order to sensitise PDAC cells to chemotherapy. However, some antitumourigenic effects of specific FA like palmitic and stearic acids were reported, and they would be able to trigger apoptosis and inhibit proliferation of pancreatic cancer cells [78]. Additionally, more research is required to fully understand the crosstalk of the different metabolic pathways. As an example, branched-chain amino acids (BCAAs) were able to sustain pancreatic cancer growth by regulating lipid metabolism [79].

4.3. Amino Acid Metabolism in PDAC

In their nutrient-deprived environment, PDAC cells also face the lack of amino acids (AAs) and use different processes to counteract this phenomenon and support their metabolic needs. First of all, several studies demonstrated an association between elevated plasma BCAAs levels and pancreatic cancer risk [80,81]. As increased consumption of BCAAs may occur about 10 years before PDAC diagnosis, plasma AAs concentrations can be considered as pre-diagnostic and diagnostic markers [82]. Moreover, the significant differences observed between the different PDAC stages make AAs good candidates to improve early diagnosis and patient stratification [82]. For example, analysis of AAs plasma levels in extended cohorts led to identifying three natural BCAAs with significant elevated concentrations: leucine, isoleucine and valine, metabolised via common pathways [80,83].
The close microenvironment represents another source of AAs to feed PDAC cells. For example, stromal cells, such as pancreatic stellate cells, secrete alanine, which is assimilated by PDAC cells to support their glutamine and glucose metabolism [84,85]. In another way, cancer-associated fibroblasts (CAFs) present an up-regulated BCAAs catabolism and are able to fuel PDAC cells with branched-chain α-ketoacid (BCKA), thanks to their elevated BCAT1 (Branched chain amino acid transaminase 1) activity [86]. It was also demonstrated that PDAC cells can directly catabolise extracellular collagen to produce proline and fuel the TCA cycle under restrictive nutrient conditions [87]. These exchanges between PDAC cells and extracellular milieu (plasma or closed microenvironment) are dependent on the expression of transporters such as the L-type Amino Acid Transporter 1 (LAT1) or the Cystine/Glutamate Exchanger (SLC7A11/xCT). For that reason, the expression of aa transporters is also associated with low prognosis and chemoresistance [88,89].
Additionally, indirect sources of AAs also contribute to PDAC development. In general, a whole-body protein breakdown occurs in the course of the disease, since PDAC cells are able to capture of external proteins, such as albumin, through the macropinocytosis process, which combines endocytosis and protein degradation (lysosomal or proteolytic degradation). This extracellular protein catabolism represents an important source of AAs, including glutamine, that sustains the central carbon metabolism. Indeed, although glucose is the dominant energy fuel for most cancers in vivo, it has been suggested that ATP generation relies on glutamine carbons in vitro, leading to glutamine addiction. Furthermore, glutamine plays other important roles in PDAC cells: (1) in lipid biosynthesis, (2) as a nitrogen donor for AAs and nucleotide biosynthesis, (3) as a carbon substrate for the anaplerosis of the mitochondrial TCA cycle, (4) in redox balance by participating in glutathione biosynthesis and generating NADPH [60,90]. PDAC cells metabolise glutamine through a non-canonical pathway driven by K-RAS or MYC oncogenes in which transaminases, such as Aspartate Aminotransferase, are essential [91].

5. PDAC Metabolic Signatures

Although initially it was thought that all PDAC tumours carried similar changes in metabolism, the existence of subtypes with specific metabolic requirements has become apparent lately. This section summarises and analyses reports that either directly identify metabolic subtypes in PDAC or their existence can be inferred from the signatures classifying each subtype.
Daemen et al. [92] identified three different metabolic subtypes in PDAC cell lines through metabolite profiling, further confirmed by transcriptional analysis: “slow-proliferating”, “glycolytic” and “lipogenic” (Table 3). The slow-proliferating subtype was defined by reduced cellular proliferation and low levels of AAs and carbohydrates. The glycolytic subtype showed high levels of gene expression and metabolites from the glycolytic, pentose phosphate and serine pathways. In contrast, the lipogenic group was characterised by sets of lipogenic genes and metabolites involved in the synthesis of cholesterol and lipids and mitochondrial OXPHOS. Interestingly, while glutamine contributed to TCA metabolites in glycolytic cell lines, the lipogenic ones used glucose to replenish the TCA cycle, which was accompanied by increased oxygen consumption and mitochondrial content. Finally, they created a signature defined by the expression ratio of the glycolytic gene ENO2 (neuron-specific enolase) and several lipid genes, further validated in 200 non-pancreatic cancer cell lines. Interestingly, the authors observed a correlation among their metabolic subtypes and Collison’s molecular subtypes [31]: Daemen’s lipogenic subtype is associated with the classical subtype, while the glycolytic one is related to the quasi-mesenchymal subtype (Table 4). Accordingly, and in contrast to the lipogenic subtype, the glycolytic subtype is very aggressive, grows rapidly, produces metastases and generally does not respond to regular chemotherapy [92].
As mentioned before, the L1, L2 and L6 PDAC subtypes described by Zhao et al. [34] were related to metabolism (Table 3), while the L1 tumours up-regulated glycolytic and lipogenic genes and the L2 subtype enriched glycolysis gene sets and down-regulated lipid metabolism ones. Finally, L6 up-regulated genes associated with protein metabolism and digestive enzyme activity. We can find similarities between Zhao’s and Daemen’s classifications: L2 would correspond to Daemen’s glycolytic subtype, associated with poor prognosis in clinical samples, while L1 would constitute a mixed group with characteristics of both glycolytic and lipogenic groups (Table 4).
The work by Lomberk et al. [35] analysing the epigenetic landscape of PDAC samples identified super-enhancers and super-enhancer-associated TFs regulating metabolic nodes (Table 3). Indeed, the classical subtype is associated with the up-regulation of TFs modulating lipid metabolism (PPAR), while MYC, a known regulator of PDAC glycolytic phenotype [47], likely controls the basal subtype.
Maurer et al. [36] conducted analyses of gene set variance in different published cohorts (TGCA, ICGC, UNC and CUMC), applying transcriptional deconvolution to identify the genes specifically associated with the epithelial compartment (Table 3). Interestingly, they confirmed the correlation between the classical subtype and lipid metabolism in the diverse datasets, highlighting cholesterol biosynthesis and retinol metabolism (Table 4).
A recent study by Karasinska et al. [93] analysed the expression of genes related to glycolysis and cholesterol synthesis in clinical samples (Table 3) to establish four metabolic subgroups of PDAC: “quiescent”, “glycolytic”, “cholesterogenic” and “mixed”. While the quiescent group had poor metabolic activity, the glycolytic and cholesterogenic subtypes enhanced one of these pathways. The glycolytic subtype was characterised by the amplification of K-RAS and MYC oncogene and showed the lowest expression of the mitochondrial pyruvate carriers MPC1 and MPC2. In addition, the glycolytic group showed poor prognosis, whereas the cholesterogenic one reported the longest median survival. Lastly, the mixed subtype presented high metabolic activity and enrichment in both the glycolytic and cholesterol biosynthesis pathways. These metabolic subtypes were also found in nine additional types of cancer. Karasinska et al. compared their metabolic classification with previous molecular signatures (Table 4): the quiescent group predominantly belonged to Moffit’s classical subgroup, and it showed the highest frequency of ADEX and exocrine-like cases, suggesting that the quiescent group might be involved in the secretion of digestive enzymes; the glycolytic subtype was associated with the basal, squamous and quasi-mesenchymal subgroups, all related with the worst outcome; finally, the cholesterogenic group had the lowest proportion of poor prognosis signatures, but the highest in Bailey’s pancreatic progenitor subtype.
Coming back to the classification of Dijk et al. [37], the epithelial subtype showed an enrichment in mitochondrial and lipid metabolism pathways such as OXPHOS, terpenoid backbone biosynthesis, TCA cycle, steroid biosynthesis and FA degradation (Table 3). This suggests a link between Dijk´s epithelial subtype and Daemen´s and Karasinka´s lipogenic subtypes, all of them correlated to the classical classification (Table 4).
As seen for both molecular and metabolic stratification, all these classifications share subtypes that are consistently present in PDAC. All stratifications comprise a classical subtype with better prognosis corresponding to the lipogenic metabolic subtype. On the other hand, the quasi-mesenchymal, basal or squamous subtypes, which are aggressive, metastatic and undifferentiated tumours, are always related to the glycolytic subtype [32,94]. This strongly suggests an association amongst the genetic signature, metabolic profile and tumour aggressiveness. Such a connection could reflect the transcriptional program of a driver mutation such as the ones found in K-RAS, which induces profound changes at the cellular level, including metabolic reprogramming. However, the heterogeneity found in molecular and metabolic subtypes does not necessarily correspond to specific mutations, suggesting an extra layer of complexity provided, for example, by the microenvironment. Thus, defining metabolic subtypes represents a clear opportunity for patient stratification, considering tumour phenotype independently of its mutational background, and opens a new avenue for the identification of targeted therapies for each subgroup.

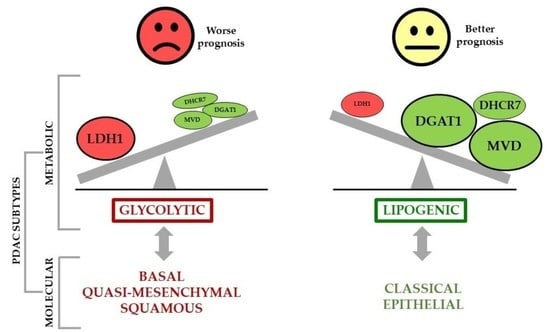
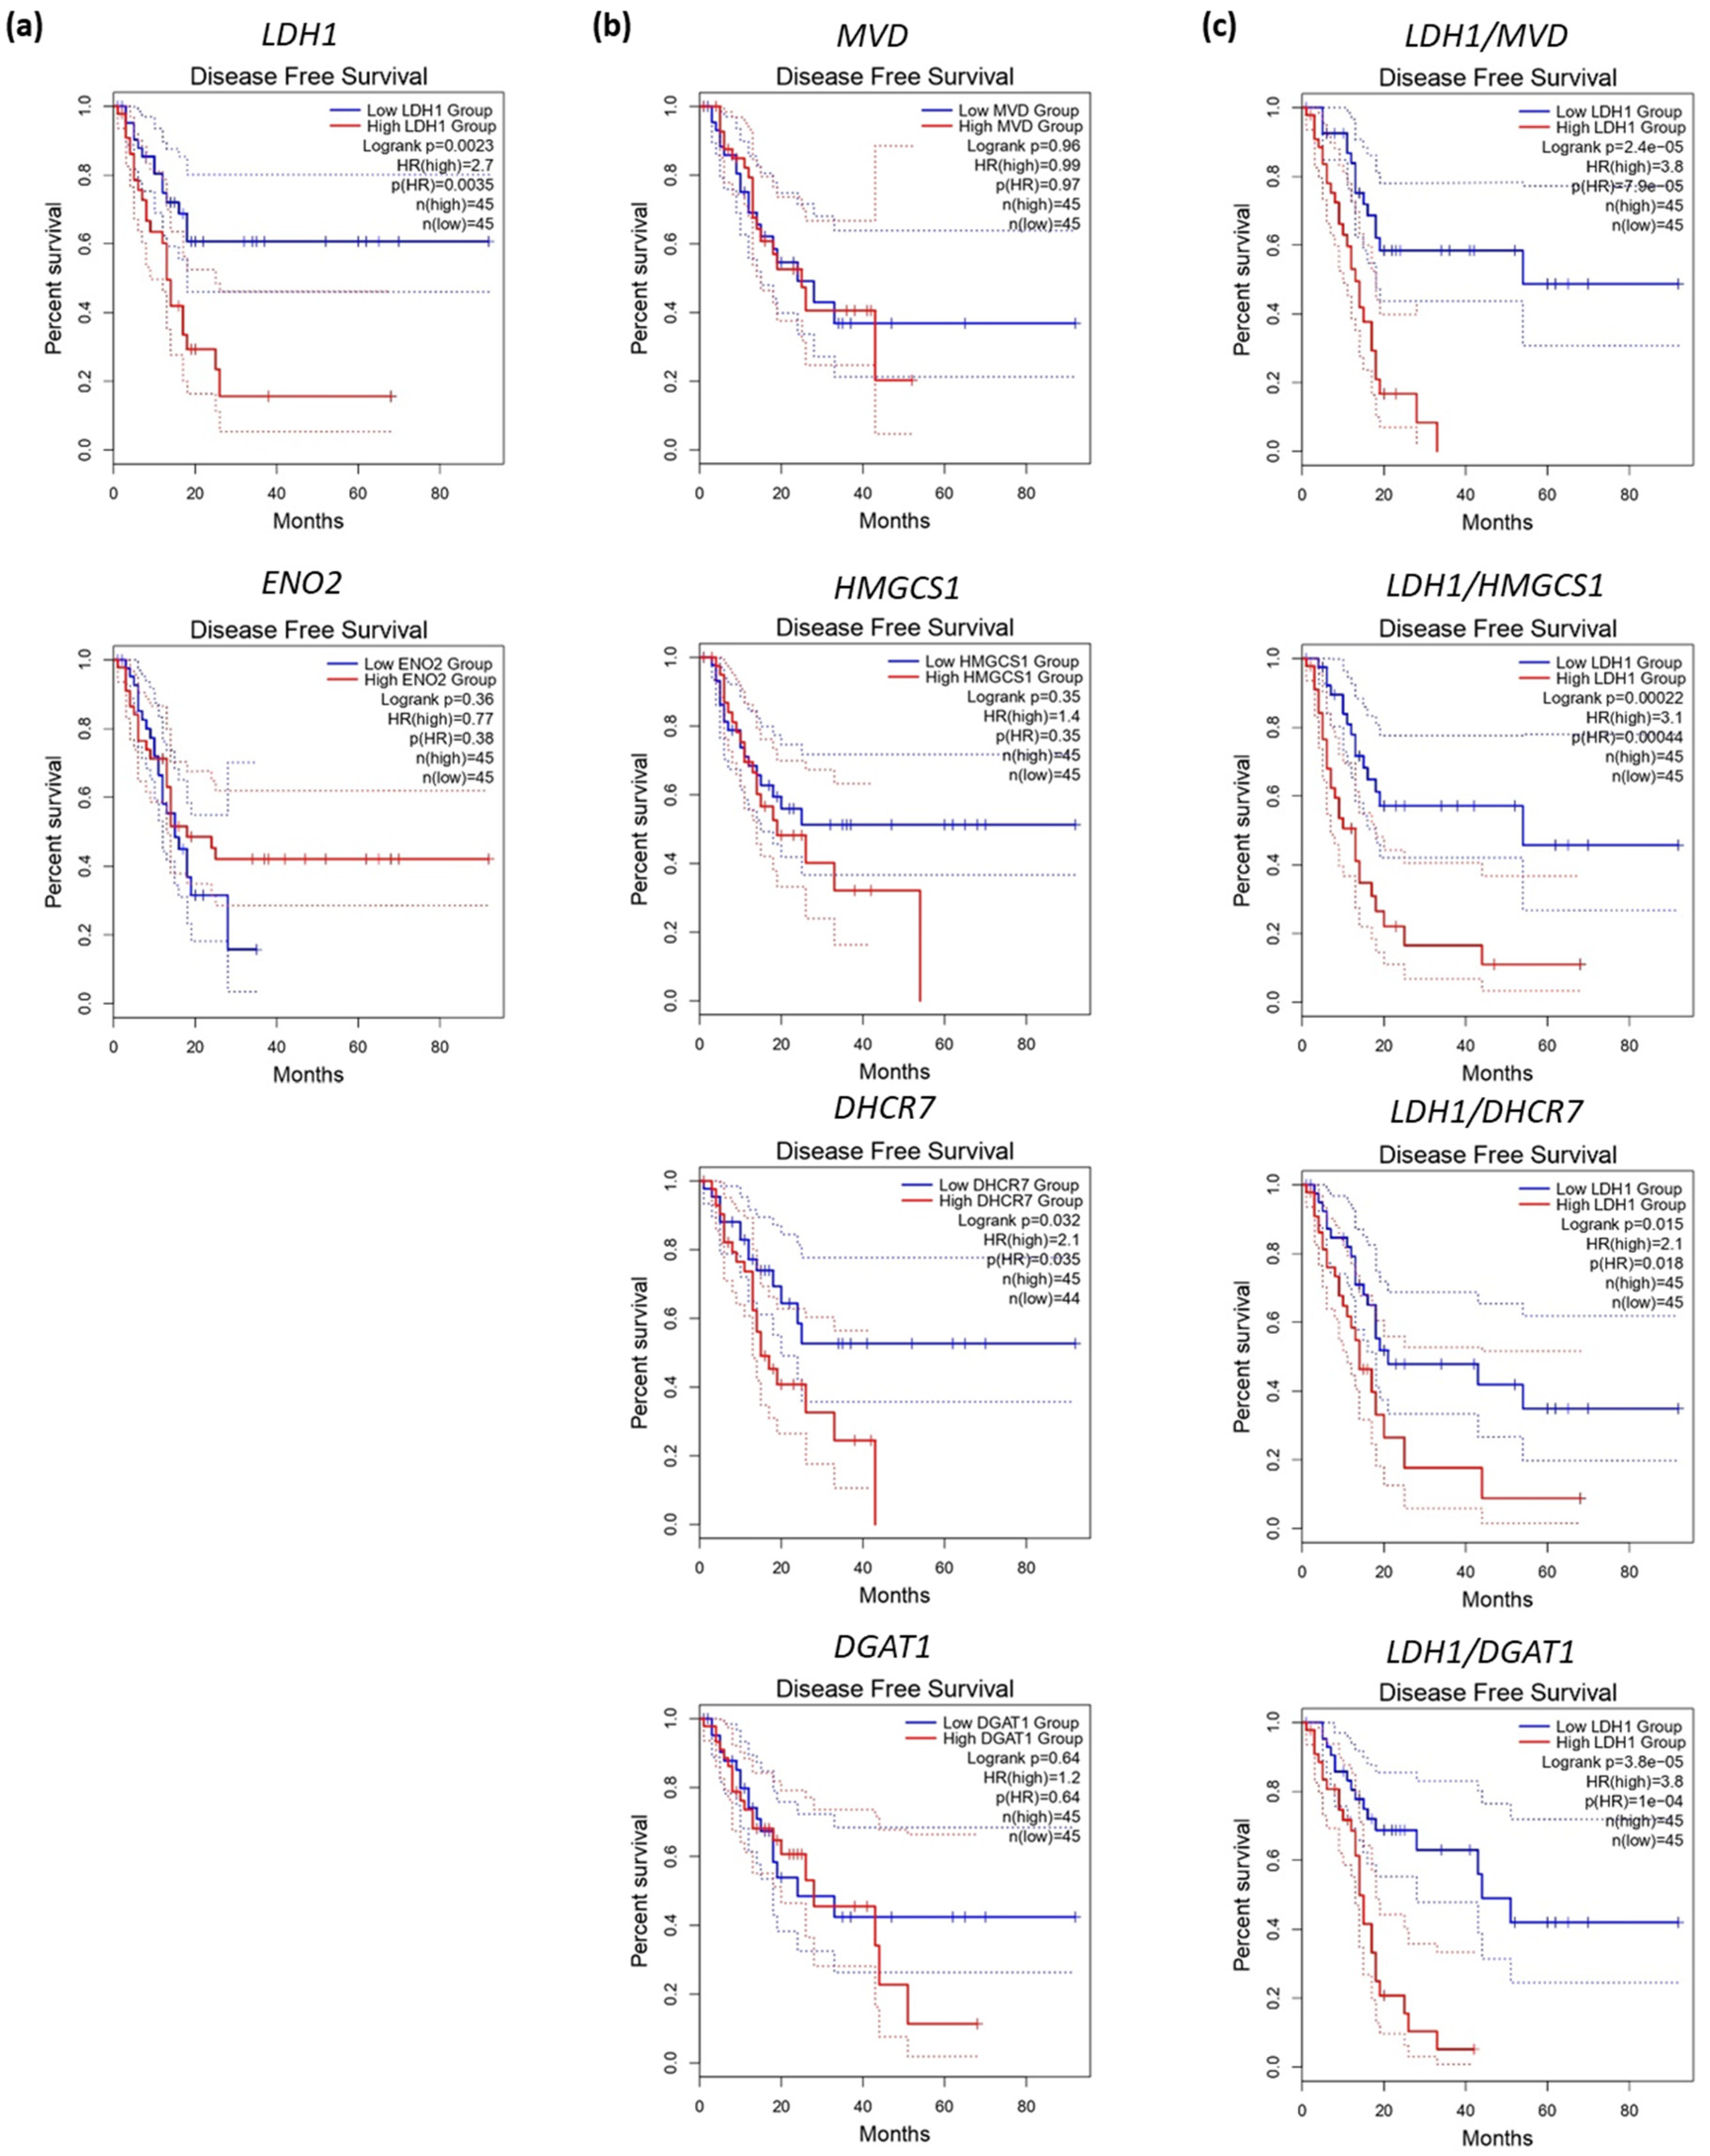
6. Metabolic Phenotypes and Survival in PDAC

As mentioned above, we can define at least two metabolic phenotypes consistently represented across the different analyses, regardless of the main focus of the studies (molecular or metabolic classification): glycolytic and lipogenic subtypes. Interestingly, bioinformatic analyses using TCGA and GTEx databases indicate that genes from both metabolic pathways are significantly up-regulated in tumoural vs. normal tissues (Figure 1). Amongst the genes included in this analysis, we can find representative genes of the metabolic subtypes defined by Daemen et al., Zhao et al. and Karasinska et al. in their respective stratification studies [34,92,93]: (1) for the glycolytic subtype, these are ENO2 (Daemen, Zhao, Karasinska) and lactate dehydrogenase 1 (LDH1) (Karasinska); (2) for the lipogenic subtype, it concerns those involved in the triacylglycerol and cholesterol biosynthesis, such as diacylglycerol O-acyltransferase 1 (DGAT1), 7-hydrocholesterol reductase (DHCR7), 3-hydroxy-3-methylglutaryl-CoA synthase 1 (HMGCS1) and mevalonate (diphospho-) decarboxylase (MVD) (Daemen, Karasinska).
Disease-free survival analyses for the representative genes of the metabolic stratification studies mentioned above revealed that, except for LDH1 and DHCR7, none of the individual genes had a significant impact on patient survival (Figure 2a,b). Surprisingly, although not significant, a trend for ENO2 expression associated with better prognosis was observed (Figure 2a). In fact, previous studies proved that up-regulated ENO2 contributes to the aggressiveness and poor prognosis of the glycolytic subtype in pancreatic cancer [34,92,93]. Importantly, Daemen et al. proposed a gene expression ratio based on ENO2 and a lipid signature composed by DGAT1, DHCR7, FDFT1, HMGCS1 and MVD to distinguish between glycolytic and lipogenic metabolic phenotypes for PDAC and other cancer types. Considering the survival analyses in Figure 2a, we analysed the relationship between the enrichment in glycolytic or lipogenic genes and prognosis, using a modified glycolytic/lipogenic gene ratio from Daemen’s study that includes LDH1 instead of ENO2. In this line, disease-free survival decreased significantly when the ratio LDH1 and any of the lipogenic genes increased; thus, when tumours were glycolytic (Figure 2c). Interestingly, the hazard ratio (HR) combining LDH1 and MVD or DGAT1 reached values of up to 3.8, facilitating the distinction between the two metabolic subtypes and their impact on prognosis. Although further work in this direction is certainly needed, the use of a simplified signature with the metabolic genes that most contribute to prognosis could streamline patient stratification based on the phenotypic features of the tumours.

7. Conclusions

PDAC is a heterogeneous disease that can be classified, according to its metabolic needs, into glycolytic and lipogenic subtypes with different prognosis. Indeed, the glycolytic subtype would be more aggressive and resistant to conventional chemotherapy than the lipogenic one. This metabolic stratification correlates with previous molecular classification systems, as they show subtypes sharing similar characteristics and prognosis. In this context, classification into metabolic subtypes may be better placed for clinical use, since it could provide information on the functional phenotype of the tumour, correlating to aggressiveness, chemoresistance and metastatic abilities independently from its mutational state. The information collected in this review strongly suggests that patient stratification based on metabolic features may bear prognostic value and guide therapeutic decisions in the future, identifying a subgroup of patients with poor prognosis that may be eligible to personalised treatments designed according to metabolic vulnerabilities.

Author Contributions

Conceptualisation, P.E.-R. and P.S.; data analysis and investigation P.E.-R.; writing—original draft preparation, P.E.-R., S.C. and B.P.-A.; writing—review and editing and supervision and funding acquisition, P.S. All authors have read and agreed to the published version of the manuscript.

Funding

This research was funded by the Instituto de Salud Carlos III through the Miguel Servet Program (CP16/00121) and Fondo de Investigaciones Sanitarias (PI17/00082) (both co-financed by European funds (FSE: “El FSE invierte en tu futuro” and FEDER: “Una manera de hacer Europa,” respectively) and the Worldwide Cancer Research Charity together with Fundación Científica Asociación Española contra el Cáncer (FCAECC) (19-0250).

Acknowledgments

We want to thank Alba Royo and Laura Sancho for proofreading the manuscript.

Conflicts of Interest

The authors declare no conflict of interest.

References

  1. Foucher, E.D.; Ghigo, C.; Chouaib, S.; Galon, J.; Iovanna, J.; Olive, D. Pancreatic Ductal Adenocarcinoma: A Strong Imbalance of Good and Bad Immunological Cops in the Tumor Microenvironment. Front. Immunol. 2018, 9, 1044. [Google Scholar] [CrossRef]
  2. Oppong, K.W.; Bekkali, N.L.H. Pancreatic ductal adenocarcinoma epidemiology and risk assessment: Could we prevent? Possibility for an early diagnosis. Endosc. Ultrasound 2017, 6, 58–S61. [Google Scholar] [CrossRef] [PubMed]
  3. Hur, C.; Tramontano, A.C.; Dowling, E.C.; Brooks, G.A.; Jeon, A.; Brugge, W.R.; Gazelle, G.S.; Kong, C.Y.; Pandharipande, P.V. Early Pancreatic Ductal Adenocarcinoma Survival Is Dependent on Size. Pancreas 2016, 45, 1062–1066. [Google Scholar] [CrossRef] [PubMed]
  4. Kakkar, A.; Choudhuri, J.; Mukherjee, I. The subtypes of pancreatic ductal adenocarcinomas. SANAMED 2016, 11, 239. [Google Scholar] [CrossRef] [Green Version]
  5. Le, N.; Sund, M.; Vinci, A.; Beyer, G.; Javed, M.A.; Krug, S.; Neessee, A.; Schober, M.; Information, P.E.K.F.C. Prognostic and predictive markers in pancreatic adenocarcinoma. Dig. Liver Dis. 2016, 48, 223–230. [Google Scholar] [CrossRef] [Green Version]
  6. Zeitouni, D.; Pylayeva-Gupta, Y.; Der, C.J.; Bryant, K.L. KRAS Mutant Pancreatic Cancer: No Lone Path to an Effective Treatment. Cancers 2016, 8, 45. [Google Scholar] [CrossRef]
  7. Orth, M.; Metzger, P.; Gerum, S.; Mayerle, J.; Schneider, G.; Belka, C.; Schnurr, M.; Lauber, K. Pancreatic ductal adenocarcinoma: Biological hallmarks, current status, and future perspectives of combined modality treatment approaches. Radiat. Oncol. 2019, 14, 1–20. [Google Scholar] [CrossRef]
  8. Adamska, A.; Domenichini, A.; Falasca, M. Pancreatic Ductal Adenocarcinoma: Current and Evolving Therapies. Int. J. Mol. Sci. 2017, 18, 1338. [Google Scholar] [CrossRef]
  9. Pu, N.; Chen, Q.; Gao, S.; Liu, G.; Zhu, Y.; Yin, L.; Hu, H.; Wei, L.; Wu, Y.; Maeda, S.; et al. Genetic landscape of prognostic value in pancreatic ductal adenocarcinoma microenvironment. Ann. Transl. Med. 2019, 7, 645. [Google Scholar] [CrossRef]
  10. Bailey, P.; Initiative, A.P.C.G.; Chang, D.K.; Nones, K.; Johns, A.L.; Patch, A.-M.; Gingras, M.-C.; Miller, D.K.; Christ, A.N.; Bruxner, T.J.C.; et al. Genomic analyses identify molecular subtypes of pancreatic cancer. Nature 2016, 531, 47–52. [Google Scholar] [CrossRef]
  11. Pihlak, R.; Weaver, J.M.J.; Valle, J.W.; McNamara, M.G. Advances in Molecular Profiling and Categorisation of Pancreatic Adenocarcinoma and the Implications for Therapy. Cancers 2018, 10, 17. [Google Scholar] [CrossRef] [PubMed] [Green Version]
  12. Waddell, N.; Pajic, M.; Patch, A.-M.; Chang, D.K.; Kassahn, K.S.; Bailey, P.; Johns, A.L.; Miller, D.; Nones, K.; Quek, K.; et al. Whole genomes redefine the mutational landscape of pancreatic cancer. Nature 2015, 518, 495–501. [Google Scholar] [CrossRef] [PubMed] [Green Version]
  13. Bournet, B.; Muscari, F.; Buscail, C.; Assenat, E.; Barthet, M.; Hammel, P.; Selves, J.; Guimbaud, R.; Cordelier, P.; Buscail, L. KRAS G12D Mutation Subtype Is A Prognostic Factor for Advanced Pancreatic Adenocarcinoma. Clin. Transl. Gastroenterol. 2016, 7, e157. [Google Scholar] [CrossRef]
  14. Sahin, I.H.; A Iacobuzio-Donahue, C.; O’Reilly, E.M. Molecular signature of pancreatic adenocarcinoma: An insight from genotype to phenotype and challenges for targeted therapy. Expert Opin. Ther. Targets 2015, 20, 341–359. [Google Scholar] [CrossRef]
  15. Roberts, N.J.; Norris, A.L.; Petersen, G.M.; Bondy, M.L.; E Brand, R.; Gallinger, S.; Roberts, N.J.; Olson, S.H.; Rustgi, A.K.; Schwartz, A.G.; et al. Whole Genome Sequencing Defines the Genetic Heterogeneity of Familial Pancreatic Cancer. Cancer Discov. 2016, 6, 166–175. [Google Scholar] [CrossRef] [Green Version]
  16. Notta, F.; Chan-Seng-Yue, M.; Lemire, M.; Li, Y.; Wilson, G.W.; Connor, A.A.; Denroche, R.E.; Liang, S.-B.; Brown, A.M.K.; Kim, J.C.; et al. A renewed model of pancreatic cancer evolution based on genomic rearrangement patterns. Nature 2016, 538, 378–382. [Google Scholar] [CrossRef]
  17. Raphael, B.; Hruban, R.H.; Aguirre, A.J.; Moffitt, R.A.; Yeh, J.J.; Stewart, C.; Robertson, A.G.; Cherniack, A.D.; Gupta, M.; Getz, G.; et al. Integrated Genomic Characterization of Pancreatic Ductal Adenocarcinoma. Cancer Cell 2017, 32, 185–203.e13. [Google Scholar] [CrossRef]
  18. Rice, A.; Hernández, A.E.D.R. The Mutational Landscape of Pancreatic and Liver Cancers, as Represented by Circulating Tumor DNA. Front. Oncol. 2019, 9. [Google Scholar] [CrossRef]
  19. Waters, A.M.; Der, C.J. KRAS: The Critical Driver and Therapeutic Target for Pancreatic Cancer. Cold Spring Harb. Perspect. Med. 2018, 8, a031435. [Google Scholar] [CrossRef]
  20. Iv, J.P.M.; Wang, S.C.; Hebrok, M. KRAS, Hedgehog, Wnt and the twisted developmental biology of pancreatic ductal adenocarcinoma. Nat. Rev. Cancer 2010, 10, 683–695. [Google Scholar] [CrossRef]
  21. Kanda, M.; Matthaei, H.; Wu, J.; Hong, S.; Yu, J.; Borges, M.; Hruban, R.H.; Maitra, A.; Kinzler, K.; Vogelstein, B.; et al. Presence of Somatic Mutations in Most Early-Stage Pancreatic Intraepithelial Neoplasia. Gastroenterol. 2012, 142, 730–733.e9. [Google Scholar] [CrossRef] [PubMed] [Green Version]
  22. Morrison, D.K. MAP Kinase Pathways. Cold Spring Harb. Perspect. Biol. 2012, 4, a011254. [Google Scholar] [CrossRef] [PubMed]
  23. Eser, S.; Schnieke, A.; Schneider, G.; Saur, D. Oncogenic KRAS signalling in pancreatic cancer. Br. J. Cancer 2014, 111, 817–822. [Google Scholar] [CrossRef] [PubMed]
  24. Mueller, S.; Engleitner, T.; Maresch, R.; Zukowska, M.; Lange, S.; Kaltenbacher, T.; Konukiewitz, B.; Öllinger, R.; Zwiebel, M.; Strong, A.; et al. Evolutionary routes and KRAS dosage define pancreatic cancer phenotypes. Nat. Cell Biol. 2018, 554, 62–68. [Google Scholar] [CrossRef]
  25. Grant, T.J.; Hua, K.; Singh, A. Molecular Pathogenesis of Pancreatic Cancer. In Progress in Molecular Biology and Translational Science; Elsevier BV: Amsterdam, The Netherlands, 2016; Volume 144, pp. 241–275. [Google Scholar]
  26. Morton, J.P.; Timpson, P.; Karim, S.A.; Ridgway, R.A.; Athineos, D.; Doyle, B.; Jamieson, N.B.; Oien, K.A.; Lowy, A.M.; Brunton, V.G.; et al. Mutant p53 drives metastasis and overcomes growth arrest/senescence in pancreatic cancer. Proc. Natl. Acad. Sci. USA 2010, 107, 246–251. [Google Scholar] [CrossRef] [Green Version]
  27. Weissmueller, S.; Manchado, E.; Saborowski, M.; Morris, J.P.; Wagenblast, E.; Davis, C.A.; Moon, S.-H.; Pfister, N.T.; Tschaharganeh, D.F.; Kitzing, T.; et al. Mutant p53 Drives Pancreatic Cancer Metastasis through Cell-Autonomous PDGF Receptor β Signaling. Cell 2014, 157, 382–394. [Google Scholar] [CrossRef] [Green Version]
  28. Zhao, M.; Mishra, L.; Deng, C.X. The role of TGF-β/SMAD4 signaling in cancer. Int. J. Biol. Sci. 2018, 14, 111–123. [Google Scholar] [CrossRef] [Green Version]
  29. Hao, Y.; Baker, D.; Dijke, P.T. TGF-β-Mediated Epithelial-Mesenchymal Transition and Cancer Metastasis. Int. J. Mol. Sci. 2019, 20, 2767. [Google Scholar] [CrossRef] [Green Version]
  30. David, C.J.; Huang, Y.-H.; Chen, M.; Su, J.; Zou, Y.; Bardeesy, N.; Iacobuzio-Donahue, C.A.; Massagué, J. TGF-β Tumor Suppression through a Lethal EMT. Cell 2016, 164, 1015–1030. [Google Scholar] [CrossRef] [Green Version]
  31. Collisson, E.A.; Sadanandam, A.; Olson, P.; Gibb, W.J.; Truitt, M.; Gu, S.; Cooc, J.; Weinkle, J.; Kim, G.E.; Jakkula, L.; et al. Subtypes of pancreatic ductal adenocarcinoma and their differing responses to therapy. Nat. Med. 2011, 17, 500–503. [Google Scholar] [CrossRef]
  32. Veenstra, V.L.; Garcia-Garijo, A.; Van Laarhoven, H.W.M.; Bijlsma, M.F. Extracellular Influences: Molecular Subclasses and the Microenvironment in Pancreatic Cancer. Cancers 2018, 10, 34. [Google Scholar] [CrossRef] [PubMed] [Green Version]
  33. Moffitt, R.A.; Marayati, R.; Flate, E.L.; Volmar, K.E.; Loeza, S.G.H.; Hoadley, K.A.; Rashid, N.U.; Williams, L.A.; Eaton, S.C.; Chung, A.H.; et al. Virtual microdissection identifies distinct tumor- and stroma-specific subtypes of pancreatic ductal adenocarcinoma. Nat. Genet. 2015, 47, 1168–1178. [Google Scholar] [CrossRef] [PubMed]
  34. Zhao, L.; Zhao, H.; Yan, H. Gene expression profiling of 1200 pancreatic ductal adenocarcinoma reveals novel subtypes. BMC Cancer 2018, 18, 1–13. [Google Scholar] [CrossRef] [PubMed]
  35. Lomberk, G.; Blum, Y.; Nicolle, R.; Nair, A.; Gaonkar, K.S.; Marisa, L.; Mathison, A.; Sun, Z.; Yan, H.; Elarouci, N.; et al. Distinct epigenetic landscapes underlie the pathobiology of pancreatic cancer subtypes. Nat. Commun. 2018, 9, 1–10. [Google Scholar] [CrossRef] [PubMed]
  36. Maurer, H.C.; Holmstrom, S.R.; He, J.; Laise, P.; Su, T.; Ahmed, A.; Hibshoosh, H.; A Chabot, J.; E Oberstein, P.; Sepulveda, A.R.; et al. Experimental microdissection enables functional harmonisation of pancreatic cancer subtypes. Gut 2019, 68, 1034–1043. [Google Scholar] [CrossRef] [PubMed]
  37. Dijk, F.; Veenstra, V.L.; Soer, E.C.; Dings, M.P.; Zhao, L.; Halfwerk, J.B.; Hooijer, G.K.; Damhofer, H.; Marzano, M.; Steins, A.; et al. Unsupervised class discovery in pancreatic ductal adenocarcinoma reveals cell-intrinsic mesenchymal features and high concordance between existing classification systems. Sci. Rep. 2020, 10, 337. [Google Scholar] [CrossRef] [PubMed]
  38. Chan-Seng-Yue, M.; Kim, J.C.; Wilson, G.W.; Ng, K.; Figueroa, E.F.; O’Kane, G.M.; Connor, A.A.; Denroche, R.E.; Grant, R.C.; McLeod, J.; et al. Transcription phenotypes of pancreatic cancer are driven by genomic events during tumor evolution. Nat. Genet. 2020, 52, 231–240. [Google Scholar] [CrossRef]
  39. Nicolle, R.; Blum, Y.; Duconseil, P.; Vanbrugghe, C.; Brandone, N.; Poizat, F.; Roques, J.; Bigonnet, M.; Gayet, O.; Rubis, M.; et al. Establishment of a pancreatic adenocarcinoma molecular gradient (PAMG) that predicts the clinical outcome of pancreatic cancer. EBioMedicine 2020, 57, 102858. [Google Scholar] [CrossRef]
  40. Juiz, N.; Elkaoutari, A.; Bigonnet, M.; Gayet, O.; Roques, J.; Nicolle, R.; Iovanna, J.; Dusetti, N. Basal-like and classical cells coexist in pancreatic cancer revealed by single-cell analysis on biopsy-derived pancreatic cancer organoids from the classical subtype. FASEB J. 2020, 34, 12214–12228. [Google Scholar] [CrossRef]
  41. Kamphorst, J.J.; Cross, J.R.; Fan, J.; De Stanchina, E.; Mathew, R.; White, E.P.; Thompson, C.B.; Rabinowitz, J.D. Hypoxic and Ras-transformed cells support growth by scavenging unsaturated fatty acids from lysophospholipids. Proc. Natl. Acad. Sci. USA 2013, 110, 8882–8887. [Google Scholar] [CrossRef] [Green Version]
  42. Hanahan, D.; Weinberg, R.A. Hallmarks of cancer: The next generation. Cell 2011, 144, 646–674. [Google Scholar] [CrossRef] [PubMed] [Green Version]
  43. Ying, H.; Dey, P.; Yao, W.; Kimmelman, A.C.; Draetta, G.F.; Maitra, A.; Depinho, R.A. Genetics and biology of pancreatic ductal adenocarcinoma. Genes Dev. 2016, 30, 355–385. [Google Scholar] [CrossRef] [PubMed] [Green Version]
  44. Chen, J.-Q.; Russo, J. Dysregulation of glucose transport, glycolysis, TCA cycle and glutaminolysis by oncogenes and tumor suppressors in cancer cells. Biochim. et Biophys. Acta (BBA) Bioenerg. 2012, 1826, 370–384. [Google Scholar] [CrossRef] [PubMed]
  45. Galluzzi, L.; Kepp, O.; Heiden, M.G.V.; Kroemer, G. Metabolic targets for cancer therapy. Nat. Rev. Drug Discov. 2013, 12, 829–846. [Google Scholar] [CrossRef]
  46. Warburg, O.; Wind, F.; Negelein, E. THE METABOLISM OF TUMORS IN THE BODY. J. Gen. Physiol. 2004, 8, 519–530. [Google Scholar] [CrossRef] [Green Version]
  47. Wilde, L.; Roche, M.; Domingo-Vidal, M.; Tanson, K.; Philp, N.; Curry, J.; Martinez-Outschoorn, U.E. Metabolic coupling and the Reverse Warburg Effect in cancer: Implications for novel biomarker and anticancer agent development. Semin. Oncol. 2017, 44, 198–203. [Google Scholar] [CrossRef]
  48. Sancho, P.; Burgos-Ramos, E.; Tavera, A.; Kheir, T.B.; Jagust, P.; Schoenhals, M.; Barneda, D.; Sellers, K.; Campos-Olivas, R.; Graña, O.; et al. MYC/PGC-1α Balance Determines the Metabolic Phenotype and Plasticity of Pancreatic Cancer Stem Cells. Cell Metab. 2015, 22, 590–605. [Google Scholar] [CrossRef] [Green Version]
  49. Koong, A.; Mehta, V.K.; Le, Q.T.; Fisher, G.A.; Terris, D.J.; Brown, J.; Bastidas, A.J.; Vierra, M. Pancreatic tumors show high levels of hypoxia. Int. J. Radiat. Oncol. 2000, 48, 919–922. [Google Scholar] [CrossRef]
  50. Spivak-Kroizman, T.R.; Hostetter, G.; Posner, R.; Aziz, M.; Hu, C.; Demeure, M.J.; Von Hoff, D.; Hingorani, S.R.; Palculict, T.B.; Izzo, J.; et al. Hypoxia Triggers Hedgehog-Mediated Tumor-Stromal Interactions in Pancreatic Cancer. Cancer Res. 2013, 73, 3235–3247. [Google Scholar] [CrossRef] [Green Version]
  51. Cao, X.; Cao, Y.; Li, W.; Zhang, H.; Zhu, Z. P4HA1/HIF1α feedback loop drives the glycolytic and malignant phenotypes of pancreatic cancer. Biochem. Biophys. Res. Commun. 2019, 516, 606–612. [Google Scholar] [CrossRef]
  52. Chaika, N.V.; Yu, F.; Purohit, V.; Mehla, K.; Lazenby, A.J.; DiMaio, D.; Anderson, J.M.; Yeh, J.J.; Johnson, K.R.; Hollingsworth, M.A.; et al. Differential Expression of Metabolic Genes in Tumor and Stromal Components of Primary and Metastatic Loci in Pancreatic Adenocarcinoma. PLoS ONE 2012, 7, e32996. [Google Scholar] [CrossRef] [PubMed] [Green Version]
  53. Liu, M.; Hancock, S.E.; Sultani, G.; Wilkins, B.P.; Ding, E.; Osborne, B.; Quek, L.-E.; Turner, N. Snail-Overexpression Induces Epithelial-mesenchymal Transition and Metabolic Reprogramming in Human Pancreatic Ductal Adenocarcinoma and Non-tumorigenic Ductal Cells. J. Clin. Med. 2019, 8, 822. [Google Scholar] [CrossRef] [PubMed] [Green Version]
  54. Cameron, M.E.; Yakovenko, A.; Trevino, J.G. Glucose and Lactate Transport in Pancreatic Cancer: Glycolytic Metabolism Revisited. J. Oncol. 2018, 2018, 1–6. [Google Scholar] [CrossRef] [PubMed]
  55. Basturk, O.; Singh, R.; Kaygusuz, E.; Balci, S.; Dursun, N.; Culhaci, N.; Adsay, N.V. GLUT-1 Expression in Pancreatic Neoplasia. Pancreas 2011, 40, 187–192. [Google Scholar] [CrossRef] [PubMed] [Green Version]
  56. Kong, S.C.; Nøhr-Nielsen, A.; Zeeberg, K.; Reshkin, S.J.; Hoffmann, E.K.; Novak, I.; Pedersen, S.F. Monocarboxylate Transporters MCT1 and MCT4 Regulate Migration and Invasion of Pancreatic Ductal Adenocarcinoma Cells. Pancreas 2016, 45, 1036–1047. [Google Scholar] [CrossRef]
  57. Bryant, K.L.; Mancias, J.D.; Kimmelman, A.C.; Der, C.J. KRAS: Feeding pancreatic cancer proliferation. Trends Biochem. Sci. 2014, 39, 91–100. [Google Scholar] [CrossRef] [Green Version]
  58. Ying, H.; Kimmelman, A.C.; Lyssiotis, C.A.; Hua, S.; Chu, G.C.; Fletcher-Sananikone, E.; Locasale, J.W.; Son, J.; Zhang, H.; Coloff, J.L.; et al. Oncogenic Kras Maintains Pancreatic Tumors through Regulation of Anabolic Glucose Metabolism. Cell 2012, 149, 656–670. [Google Scholar] [CrossRef] [Green Version]
  59. Tian, G.; Li, G.; Liu, P.; Wang, Z.; Li, N. Glycolysis-Based Genes Associated with the Clinical Outcome of Pancreatic Ductal Adenocarcinoma Identified by The Cancer Genome Atlas Data Analysis. DNA Cell Biol. 2020, 39, 417–427. [Google Scholar] [CrossRef]
  60. Liang, C.; Qin, Y.; Zhang, B.; Ji, S.; Shi, S.; Xu, W.; Liu, J.; Xiang, J.; Liang, D.; Hu, Q.; et al. Energy sources identify metabolic phenotypes in pancreatic cancer. Acta Biochim. et Biophys. Sin. 2016, 48, 969–979. [Google Scholar] [CrossRef] [Green Version]
  61. Swierczynski, J.; Hebanowska, A.; Sledzinski, T. Role of abnormal lipid metabolism in development, progression, diagnosis and therapy of pancreatic cancer. World J. Gastroenterol. 2014, 20, 2279–2303. [Google Scholar] [CrossRef]
  62. Lengyel, E.; Makowski, L.; DiGiovanni, J.; Kolonin, M.G. Cancer as a Matter of Fat: The Crosstalk between Adipose Tissue and Tumors. Trends Cancer 2018, 4, 374–384. [Google Scholar] [CrossRef] [PubMed]
  63. Cai, Z.; Liang, Y.; Xing, C.; Wang, H.; Hu, P.; Li, J.; Huang, H.; Wang, W.; Jiang, C. Cancer-associated adipocytes exhibit distinct phenotypes and facilitate tumor progression in pancreatic cancer. Oncol. Rep. 2019, 42, 2537–2549. [Google Scholar] [CrossRef] [PubMed] [Green Version]
  64. Kubo, M.; Gotoh, K.; Eguchi, H.; Kobayashi, S.; Iwagami, Y.; Tomimaru, Y.; Akita, H.; Asaoka, T.; Noda, T.; Takeda, Y.; et al. Impact of CD36 on Chemoresistance in Pancreatic Ductal Adenocarcinoma. Ann. Surg. Oncol. 2019, 27, 610–619. [Google Scholar] [CrossRef] [PubMed]
  65. Kubo, M.; Eguchi, H. ASO Author Reflections: Regulation of Chemoresistance in Pancreatic Ductal Adenocarcinoma by Scavenger Receptor CD36. Ann. Surg. Oncol. 2019, 27, 620–621. [Google Scholar] [CrossRef] [PubMed]
  66. Tanase, C.; Gheorghisan-Galateanu, A.A.; Popescu, I.D.; Mihai, S.; Codrici, E.; Albulescu, R.; Hinescu, M.E. CD36 and CD97 in Pancreatic Cancer versus Other Malignancies. Int. J. Mol. Sci. 2020, 21, 5656. [Google Scholar] [CrossRef]
  67. Qin, C.; Yang, G.; Yang, J.; Ren, B.; Wang, H.; Chen, G.; Zhao, F.; You, L.; Wang, W.; Zhao, Y. Metabolism of pancreatic cancer: Paving the way to better anticancer strategies. Mol. Cancer 2020, 19, 1–19. [Google Scholar] [CrossRef] [Green Version]
  68. Sunami, Y.; Rebelo, A.; Kleeff, J. Lipid Metabolism and Lipid Droplets in Pancreatic Cancer and Stellate Cells. Cancers 2017, 10, 3. [Google Scholar] [CrossRef] [Green Version]
  69. Cohen, R.; Neuzillet, C.; Tijeras-Raballand, A.; Faivre, S.; De Gramont, A.; Raymond, E. Targeting cancer cell metabolism in pancreatic adenocarcinoma. Oncotarget 2015, 6, 16832–16847. [Google Scholar] [CrossRef] [Green Version]
  70. Bian, Y.; Yu, Y.; Wang, S.; Li, L. Up-regulation of fatty acid synthase induced by EGFR/ERK activation promotes tumor growth in pancreatic cancer. Biochem. Biophys. Res. Commun. 2015, 463, 612–617. [Google Scholar] [CrossRef]
  71. Tadros, S.B.; Shukla, S.K.; King, R.J.; Gunda, V.; Vernucci, E.; Abrego, J.; Chaika, N.V.; Lyudmyla, B.; Lazenby, A.J.; Berim, L.; et al. De NovoLipid Synthesis Facilitates Gemcitabine Resistance through Endoplasmic Reticulum Stress in Pancreatic Cancer. Cancer Res. 2017, 77, 5503–5517. [Google Scholar] [CrossRef] [Green Version]
  72. Jagust, P.; De Luxán-Delgado, B.; Parejo-Alonso, B.; Sancho, P. Metabolism-Based Therapeutic Strategies Targeting Cancer Stem Cells. Front. Pharmacol. 2019, 10, 203. [Google Scholar] [CrossRef] [PubMed] [Green Version]
  73. Zaidi, N.; Lupien, L.; Kuemmerle, N.B.; Kinlaw, W.B.; Swinnen, J.V.; Smans, K. Lipogenesis and lipolysis: The pathways exploited by the cancer cells to acquire fatty acids. Prog. Lipid Res. 2013, 52, 585–589. [Google Scholar] [CrossRef] [PubMed] [Green Version]
  74. Luo, J.; Hong, Y.; Tao, X.; Wei, X.; Zhang, L.; Li, Q. An indispensable role of CPT-1a to survive cancer cells during energy stress through rewiring cancer metabolism. Tumor Biol. 2016, 37, 15795–15804. [Google Scholar] [CrossRef] [PubMed]
  75. Gabitova-Cornell, L.; Surumbayeva, A.; Peri, S.; Franco-Barraza, J.; Restifo, D.; Weitz, N.; Ogier, C.; Goldman, A.; Hartman, T.R.; Francescone, R.; et al. Cholesterol Pathway Inhibition Induces TGF-β Signaling to Promote Basal Differentiation in Pancreatic Cancer. Cancer Cell 2020, 38, 567–583.e11. [Google Scholar] [CrossRef] [PubMed]
  76. Vasseur, S.; Guillaumond, F. LDL Receptor: An open route to feed pancreatic tumor cells. Mol. Cell. Oncol. 2015, 3, e1033586. [Google Scholar] [CrossRef] [Green Version]
  77. Guillaumond, F.; Bidaut, G.; Ouaissi, M.; Servais, S.; Gouirand, V.; Olivares, O.; Lac, S.; Borge, L.; Roques, J.; Gayet, O.; et al. Cholesterol uptake disruption, in association with chemotherapy, is a promising combined metabolic therapy for pancreatic adenocarcinoma. Proc. Natl. Acad. Sci. USA 2015, 112, 2473–2478. [Google Scholar] [CrossRef] [Green Version]
  78. Zhang, G.; He, P.; Tan, H.; Budhu, A.; Gaedcke, J.; Ghadimi, B.M.; Ried, T.; Yfantis, H.G.; Lee, D.H.; Maitra, A.; et al. Integration of Metabolomics and Transcriptomics Revealed a Fatty Acid Network Exerting Growth Inhibitory Effects in Human Pancreatic Cancer. Clin. Cancer Res. 2013, 19, 4983–4993. [Google Scholar] [CrossRef] [Green Version]
  79. Lee, J.H.; Cho, Y.-R.; Kim, J.H.; Kim, J.; Nam, H.Y.; Kim, S.W.; Son, J. Branched-chain amino acids sustain pancreatic cancer growth by regulating lipid metabolism. Exp. Mol. Med. 2019, 51, 1–11. [Google Scholar] [CrossRef]
  80. Mayers, J.R.; Wu, C.; Clish, C.B.; Kraft, P.; Torrence, M.E.; Fiske, B.P.; Yuan, C.; Bao, Y.; Townsend, M.K.; Tworoger, S.S.; et al. Elevation of circulating branched-chain amino acids is an early event in human pancreatic adenocarcinoma development. Nat. Med. 2014, 20, 1193–1198. [Google Scholar] [CrossRef]
  81. Maertin, S.; Elperin, J.M.; Lotshaw, E.; Sendler, M.; Speakman, S.D.; Takakura, K.; Reicher, B.M.; Mareninova, O.A.; Grippo, P.J.; Mayerle, J.; et al. Roles of autophagy and metabolism in pancreatic cancer cell adaptation to environmental challenges. Am. J. Physiol. Liver Physiol. 2017, 313, G524–G536. [Google Scholar] [CrossRef]
  82. Tumas, J.; Baskirova, I.; Petrenas, T.; Norkuniene, J.; Strupas, K.; Sileikis, A. Towards a Personalized Approach in Pancreatic Cancer Diagnostics Through Plasma Amino Acid Analysis. Anticancer. Res. 2019, 39, 2035–2042. [Google Scholar] [CrossRef] [PubMed]
  83. Holmstrom, S.R.; Olive, K.P. Protein breakdown precedes pancreatic tumor development. Nat. Med. 2014, 20, 1097–1099. [Google Scholar] [CrossRef] [PubMed]
  84. Sousa, C.M.; Biancur, D.E.; Wang, X.; Halbrook, C.J.; Sherman, M.H.; Zhang, L.; Kremer, D.; Hwang, R.F.; Witkiewicz, A.K.; Ying, H.; et al. Pancreatic stellate cells support tumour metabolism through autophagic alanine secretion. Nat. Cell Biol. 2016, 536, 479–483. [Google Scholar] [CrossRef] [PubMed] [Green Version]
  85. Parker, S.J.; Amendola, C.R.; Hollinshead, K.E.R.; Yu, Q.; Yamamoto, K.; Encarnación-Rosado, J.; Rose, R.E.; LaRue, M.M.; Sohn, A.S.W.; Biancur, D.E.; et al. Selective Alanine Transporter Utilization Creates a Targetable Metabolic Niche in Pancreatic Cancer. Cancer Discov. 2020, 10, 1018–1037. [Google Scholar] [CrossRef] [PubMed]
  86. Zhu, Z.; Achreja, A.; Meurs, N.; Animasahun, O.; Owen, S.; Mittal, A.; Parikh, P.; Lo, T.; Franco-Barraza, J.; Shi, J.; et al. Tumour-reprogrammed stromal BCAT1 fuels branched-chain ketoacid dependency in stromal-rich PDAC tumours. Nat. Metab. 2020, 1–18. [Google Scholar] [CrossRef] [PubMed]
  87. Olivares, O.; Mayers, J.R.; Gouirand, V.; Torrence, M.E.; Gicquel, T.; Borge, L.; Lac, S.; Roques, J.; Lavaut, M.-N.; Berthezène, P.; et al. Collagen-derived proline promotes pancreatic ductal adenocarcinoma cell survival under nutrient limited conditions. Nat. Commun. 2017, 8, 16031. [Google Scholar] [CrossRef]
  88. Altan, B.; Kaira, K.; Watanabe, A.; Kubo, N.; Bao, P.; Dolgormaa, G.; Bilguun, E.-O.; Araki, K.; Kanai, Y.; Yokobori, T.; et al. Relationship between LAT1 expression and resistance to chemotherapy in pancreatic ductal adenocarcinoma. Cancer Chemother. Pharmacol. 2018, 81, 141–153. [Google Scholar] [CrossRef]
  89. Daher, B.; Parks, S.K.; Durivault, J.; Cormerais, Y.; Baidarjad, H.; Tambutte, E.; Pouyssegur, J.; Vucetic, M. Genetic Ablation of the Cystine Transporter xCT in PDAC Cells Inhibits mTORC1, Growth, Survival, and Tumor Formation via Nutrient and Oxidative Stresses. Cancer Res. 2019, 79, 3877–3890. [Google Scholar] [CrossRef] [Green Version]
  90. Halbrook, C.J.; Lyssiotis, C.A. Employing Metabolism to Improve the Diagnosis and Treatment of Pancreatic Cancer. Cancer Cell 2017, 31, 5–19. [Google Scholar] [CrossRef] [Green Version]
  91. Son, J.; Lyssiotis, C.A.; Ying, H.; Wang, X.; Hua, S.; Ligorio, M.; Perera, R.M.; Ferrone, C.R.; Mullarky, E.; Shyh-Chang, N.; et al. Glutamine supports pancreatic cancer growth through a KRAS-regulated metabolic pathway. Nat. Cell Biol. 2013, 496, 101–105. [Google Scholar] [CrossRef]
  92. Daemen, A.; Peterson, D.W.; Sahu, N.; Mccord, R.; Du, X.; Liu, B.; Kowanetz, K.; Hong, R.; Moffat, J.G.; Gao, M.; et al. Metabolite profiling stratifies pancreatic ductal adenocarcinomas into subtypes with distinct sensitivities to metabolic inhibitors. Proc. Natl. Acad. Sci. USA 2015, 112, E4410–E4417. [Google Scholar] [CrossRef] [PubMed] [Green Version]
  93. Karasinska, J.M.; Topham, J.T.; Kalloger, S.E.; Jang, G.H.; Denroche, R.E.; Culibrk, L.; Williamson, L.M.; Wong, H.-L.; Lee, M.K.-C.; O’Kane, G.M.; et al. Altered Gene Expression along the Glycolysis–Cholesterol Synthesis Axis Is Associated with Outcome in Pancreatic Cancer. Clin. Cancer Res. 2020, 26, 135–146. [Google Scholar] [CrossRef] [PubMed] [Green Version]
  94. Du, Y.; Zhao, B.; Liu, Z.; Ren, X.; Zhao, W.; Li, Z.; You, L.; Zhao, Y. Molecular Subtyping of Pancreatic Cancer: Translating Genomics and Transcriptomics into the Clinic. J. Cancer 2017, 8, 513–522. [Google Scholar] [CrossRef] [PubMed] [Green Version]
Figure 1. Genes from the glycolytic and lipogenic pathways up-regulated in PDAC samples. Expression of genes from glycolysis (a) triacylglycerol biosynthesis (b) and cholesterol biosynthesis (c) were analysed in cancerous (n = 179) and non-cancerous (n = 171) tissues (public gene expression information from PDAC vs. non-tumoural or normal pancreas tissues collected in the TCGA and GTEx databases) using GEPIA2 webtool (http://gepia2.cancer-pku.cn). The genes highlighted in the PDAC stratification studies from Daemen et al., Zhao et al. and Karasinska et al. are shown in orange. Significant differences in gene expression between cancerous and non-cancerous tissues was calculated by ANOVA test and is represented by an asterisk (* p ≤ 0.05).
Jcm 09 04128 g001
Figure 2. Disease-free survival analysis based on the expression of the genes selected for different metabolic classification systems. (a). LDH1 and ENO2. (b) MVD, HMGCS1, DHCRT and DGAT1. (c) Ratio LDH1 and MVD, HMGCS1, DHCR7 or DGAT1. Comparison of upper and lower population quartiles is displayed. Log-rank test, Hazard Ratio (HR) and their corresponding p-values were calculated based on the COX model. Analyses were performed using the GEPIA2 web tool (http://gepia2.cancer-pku.cn) using public gene expression information collected in the TCGA database.
Jcm 09 04128 g002
Table 1. Molecular Pancreatic Ductal Adenocarcinoma (PDAC) signatures.
AuthorType of StudyType and Number of PDAC SamplesDysregulated Pathways and MutationsOutcome
Collison et al. [31]Transcriptional1. Clinical samples microarray datasets
Microdissected (n = 27)
GSE15471 (n = 36)
GSE11838 (n = 107)
GSE16515 (n = 52)
E-MEXP-950 (n = 50)
2. Validation:
Mouse cell lines (n = 15)
Human cell lines (n = 19)
Classical: (↑) Adhesion-associated genes (GATA6). More K-RAS-dependentGood
Quasi-mesenchymal: (↑) Mesenchymal associated genesBad
Exocrine: (↑) Digestive exocrine enzyme genes
Moffit et al. [33]Transcriptional1. Microarray data
Primary tumour (n = 145)
Metastatic tumour (n = 61)
Cell lines (n = 17)
Pancreas normal samples (n = 46)
Distant site adjacent samples (n = 88)
2. Validation
Primary tumours (n = 15)
PDXs (n = 37)
Cell lines (n = 3)
CAF lines (n = 6)
Classical: Classical Collison ((↑) adhesion-associated genes (GATA6)) and SMAD4Good
Basal: (↑) Genes also highly expressed in basal tumours in bladder and breast cancerBad
Normal stroma: (↑) Pancreatic stellate cells, smooth muscle actin, vimentin and desmin markersGood
Activated stroma: (↑) Macrophages, tumour promotion and fibroblast activation-associated genesBad
Bailey et al. [10]Mutational
Transcriptional
Primary PDAC tumour samples and rare acinar cell carcinoma (n = 382)
PDAC exomes (n = 74)
Squamous: Hypermethylation and (↓) pancreatic endodermal cell fate genes. TP53, KDM6A and TP63ΔNBad
Pancreatic progenitor: (↑) Pancreatic early development genes (PDX1)Good
ADEX: (↑) K-RAS activation and pancreatic late development and differentiation genes
Immunogenic: (↑) Immune suppression and strong immune infiltration
Zhao et al. [34] Transcriptional (metanalysis)1. Microarray datasets of PDAC primary tumour samples (n = 1268)
TCGA (n = 172)
GSE79670 (n = 51)
TCGC PACA-AU (n = 71)
MTAB-1791 (n = 195)
ICGC array (n = 178)
GSE71729 (n = 145)
GSE62165 (n = 118)
GSE62452 (n = 69)
GSE57495 (n = 63)
GSE60980 (n = 49)
GSE77858 (n = 46)
GSE55643 (n = 45)
GSE15471 (n = 39)
L1: (↑) Metabolic genes
L2: (↑) Metabolic, cell proliferation and epithelium genes (CDKN2A)Bad
L3: (↑) Collagen and ECM associated genes
L4: (↑) Immune profileGood
L5: (↑) Neuroendocrine and insulin related pathwaysGood
L6: (↑) Metabolic and digestive enzyme genes
Lomberk et al. [35]Epigenetic1. PDXs (n = 24)
2. Clinical samples microarray datasets
GSE71729 (n = 145)
ICGC (n = 178)
TCGA (n = 172)
Classical: (↑) TFs involved in pancreatic development, metabolic regulators and Ras signallingGood
Basal: (↑) TF proliferative and transcription nodesBad
Maurer et al. [36]Transcriptional
Computational modelling
1. Primary PDAC tumour samples (n = 122)
2. Clinical samples microarray datasets
GSE71729 (UNC) (n = 125)
ICGC (n = 93)
TCGA (n= 127)
Classical: Classical MoffitGood
Basal: Basal MoffitBad
Immune-rich: (↑) immune and interleukin levelsGood
ECM-rich: (↑) matrix extracellular pathwaysBad
Dijk et al. [37]Transcriptional1. Primary PDAC tumour samples (n = 90)
2. Pancreatic cancer PDXs cohort (n = 14)
3. PDAC Cell lines cohort (n = 51)
Epithelial: (↑) MYC, mitochondrial components and ribosome signatureGood
Mesenchymal: (↑) K-RAS, pathways related to EMT, stromal signalling and TGF-βBad
Compound pancreatic: Similar to the mesenchymal subtype and (↑) endocrine pathwaysGood
Chan-Seng-Yue et al. [38]Whole genome sequencing
Transcriptional
Laser capture microdissected samples from late-stage PDAC
1. WGS (n = 314)
2. Bulk RNAseq (n = 248)
3. Single-cell RNAseq (n = 15)
Classical A/B: (↑) SMAD4 and GATA6 alterationsGood
Basal-like A/B: (↑) EMT and TGF-β pathways, loss of CDKN2A, TP53 mutations, K-RAS imbalanceBad
HybridMid
Nicolle et al. [39]TranscriptionalPDXs (n = 76)Graded types between classical and basal based on tumour differentiationGrade dependant
For each classification, type of study, type and number of samples, dysregulated pathways and mutations and prognosis are described in each column. Up-regulated and down-regulated pathways are shown as (↑) and (↓), respectively. CAF, Cancer-Associated Fibroblast; EMT, Epithelial-to-Mesenchymal Transition; PDAC, Pancreatic Ductal Adenocarcinoma; PDX, Patient-Derived Xenograft; TF, Transcription Factor; WGS, Whole Genome Sequencing.
Table 2. Molecular subtypes corresponding to PDAC classification.
AuthorsCommon SubtypesOthers
Collisson et al. [31]ClassicalQuasi-mesenchymalExocrine-like
Moffit et al. [33]ClassicalBasal-like Normal and activated stroma
Bailey et al. [39]ProgenitorSquamousADEXImmunogenic
Zhao et al. [34]L1L2L6L3, L4 and L5
Lomberk et al. [35]ClassicalBasal
Maurer et al. [36]ClassicalBasal Immune-rich and ECM-rich
Dijk et al. [37]EpithelialMesenchymalSecretoryCompound pancreatic
Chan-Seng-Yue et al. [38]Classical (A, B)Basal-like (A, B)Hybrid
Nicolle et al. [39]From Classical to Basal
Correlated subtypes are grouped in columns. Colours define the subgroups with the best (green) or worst (red) prognosis. ECM, Extracellular Matrix.
Table 3. Metabolic PDAC signatures.
AuthorType of StudyType and Number of PDAC SamplesDysregulated Pathways, Metabolites and MutationsPrognosis
Daemen et al. [92]Metabolic Transcriptional1. Metabolomic analysis
Cell lines (n = 38)
2. Transcriptional analysis
Cell lines (n = 38)
Slow-proliferating: (↓) amino acids and carbohydrates levels
Glycolytic: (↑) Metabolites and genes in glycolytic, pentose phosphate and serine pathways Bad
Lipogenic: (↑) Metabolites and genes in cholesterol and de novo lipid synthesisGood
Zhao et al. [34] Transcriptional1. Microarray datasets of primary tumour samples (n = 1268)
TCGA (n = 172)
GSE79670 (n = 51)
TCGC PACA-AU
(n = 71)
MTAB-1791 (n = 195)
ICGCarray (n = 178)
GSE71729 (n = 145)
GSE62165 (n = 118)
GSE62452 (n = 69)
GSE57495 (n = 63)
GSE60980 (n = 49)
GSE77858 (n = 46)
GSE55643 (n = 45)
GSE15471 (n = 39)
L1: (↑) Glycolytic and lipogenic genes
L2: (↑) Glycolytic genesBad
L3: (↑) Protein metabolism and digestive enzyme activity genes
Lomberk et al. [35]Epigenetic
Transcriptional
1. PDXs (n = 24)
2. Clinical samples microarray datasets
GSE71729 (n = 145)
ICGC (n = 178)
TCGA (n= 172)
Basal: (↑) MYC, glucose metabolism genes
Classical: (↑) PPARs, lipid metabolism genes
Good
Maurer et al. [36]Transcriptional
Computational modelling
1. Primary PDAC tumour samples
(n = 122)
2. Clinical samples microarray datasets
GSE71729 (UNC)
(n = 125)
ICGC (n = 93)
TCGA (n = 127)
Classical: (↑) lipogenic pathways (cholesterol, retinol and steroid hormone biosynthesis)Good
Karasinska et al. [93]Transcriptional Mutational1. Transcriptional datasets
TCGA (PAAD-US)
(n = 61)
ICGC (PACA-CA)
(n = 148)
COMPASS (n = 90)
PanGen/POG (n = 26)
2. Mutational datasets
TCGA (PAAD-US) (n = 60)
ICGC (PACA-CA) (n = 86)
Quiescent: (↓) metabolic activity
Glycolytic: Glycolytic genes. K-RAS and MYC oncogenes amplification
(↓) expression MPC1 and MPC2
Bad
Cholesterogenic: (↑) Cholesterol biosynthesis genesGood
Mixed: (↑) Glycolytic and cholesterol biosynthesis genes
Dijk et al. [37]Transcriptional1. Primary PDAC tumour samples (n = 90)
2. Pancreatic cancer PDXs cohort (n = 14)
3. PDAC Cell lines cohort (n = 51)
Epithelial: (↑) lipogenic pathwaysGood
For each classification, type of study, type and number of samples, dysregulated pathways, metabolites and mutations and prognosis are described in each column. Up-regulated and down-regulated pathways are shown as (↑) and (↓), respectively.
Table 4. Schematic overview of the correspondence of reported molecular and metabolic subtypes in PDAC.
AuthorsSubtypes
Collisson et al. [31]ClassicalQuasi-mesenchymal
Moffit et al. [33]ClassicalBasal-like
Bailey et al. [39]ProgenitorSquamous
Daemen et al. [91]LipogenicGlycolytic
Zhao et al. [92]L1 (Glycolytic/lipogenic)L2 (Glycolytic)
Lomberk et al. [35]Classical (PPAR-dep)Basal (MYC/K-RAS dep)
Maurer et al. [36]Classical (lipid metabolism)Basal
Karasinska et al. [34]CholesterogenicGlycolytic
Dijk et al. [37]Epithelial (lipid metabolism)Mesenchymal
Correlated subtypes are grouped in columns. Colours define the subgroups with the best (green) or worst (red) prognosis.
Publisher’s Note: MDPI stays neutral with regard to jurisdictional claims in published maps and institutional affiliations.

