Article

Water Erosion Risk Assessment in the Kenya Great Rift Valley Region

1
Aerospace Information Research Institute, Chinese Academy of Sciences, Beijing 100101, China
2
University of Chinese Academy of Sciences, Beijing 100049, China
3
Department of Geomatic Engineering and Geospatial Information Systems, Jomo Kenyatta University of Agriculture and Technology, P.O. Box 62000-00200 Nairobi, Kenya
4
Sino-Africa Joint Research Centre, P.O. Box 62000-00200 Nairobi, Kenya
5
Key Laboratory of Mountain Surface Processes and Ecological Regulation, Institute of Mountain Hazards and Environment, Chinese Academy of Sciences, Chengdu 610041, China
*
Author to whom correspondence should be addressed.
Sustainability 2021, 13(2), 844; https://doi.org/10.3390/su13020844
Submission received: 26 November 2020 / Revised: 9 January 2021 / Accepted: 11 January 2021 / Published: 16 January 2021
(This article belongs to the Special Issue Risk-Informed Sustainable Development in the Rural Tropics)

Abstract

:
The Kenya Great Rift Valley (KGRV) region unique landscape comprises of mountainous terrain, large valley-floor lakes, and agricultural lands bordered by extensive Arid and Semi-Arid Lands (ASALs). The East Africa (EA) region has received high amounts of rainfall in the recent past as evidenced by the rising lake levels in the GRV lakes. In Kenya, few studies have quantified soil loss at national scales and erosion rates information on these GRV lakes’ regional basins within the ASALs is lacking. This study used the Revised Universal Soil Loss Equation (RUSLE) model to estimate soil erosion rates between 1990 and 2015 in the Great Rift Valley region of Kenya which is approximately 84.5% ASAL. The mean erosion rates for both periods was estimated to be tolerable (6.26 t ha−1 yr−1 and 7.14 t ha−1 yr−1 in 1990 and 2015 respectively) resulting in total soil loss of 116 Mt yr−1 and 132 Mt yr−1 in 1990 and 2015 respectively. Approximately 83% and 81% of the erosive lands in KGRV fell under the low risk category (<10 t ha−1 yr−1) in 1990 and 2015 respectively while about 10% were classified under the top three conservation priority levels in 2015. Lake Nakuru basin had the highest erosion rate net change (4.19 t ha−1 yr−1) among the GRV lake basins with Lake Bogoria-Baringo recording annual soil loss rates >10 t ha−1 yr−1 in both years. The mountainous central parts of the KGRV with Andosol/Nitisols soils and high rainfall experienced a large change of land uses to croplands thus had highest soil loss net change (4.34 t ha−1 yr−1). In both years, forests recorded the lowest annual soil loss rates (<3.0 t ha−1 yr−1) while most of the ASAL districts presented erosion rates (<8 t ha−1 yr−1). Only 34% of all the protected areas were found to have erosion rates <10 t ha−1 yr−1 highlighting the need for effective anti-erosive measures.

1. Introduction

Soil erosion poses a serious threat to global agricultural production [1] with worldwide mean soil erosion rates and total annual soil loss estimated to be between 12 to 15 t ha−1 yr−1 and 2.5 to 4 billion tons [2], respectively. In East Africa (EA), particularly for countries within the east side of the Sudano-Sahelian region, rapid economic expansions resulting to unsustainable use of natural resources coupled with recent climatic changes have exacerbated on-site and off-site effects of soil erosion including flooding, environmental degradation and loss of agricultural land productivity [3,4,5]. Loss of productive soil by erosion in turn negatively impacts food security [1] as more than 50% of the population in most sub-Saharan countries depends on agriculture for their livelihood [6]. A multiple of factors make tropical developing countries more vulnerable to the processes of soil erosion including high soil erodibilities, deforestation, desertification, agricultural intensification, poor soil conservation methods, and convergence of intense climatic regimes [7].
Desertification contributes nearly 80% of soil and land degradation in Kenya which has 88% of its land mass classified as arid and semi-arid lands (ASAL) [5]. Low vegetation cover, population increases combined with climatic changes has enhanced water erosion which further increases the risk of dryland degradation. These ASALs have been identified as most “vulnerable regions to climatic change” as well as the main cause of most socio-economic problems in the country [8]. With a total contribution of about 34.2% to the Gross Domestic Product (GDP-2019) [9], agriculture forms the mainstay of Kenya’s economy. Mulinge et al. [10] estimated the total economic value of land degradation at 1.3 billion USD annually between 2001 and 2009 in Kenya which has over 12 million people living in degraded areas. Food crop productivity in Kenya’s highly erodible soils [11] has in the recent past been hampered by soil erosion, increasing population and dynamic weather changes. Forest logging on mountain ranges and unchecked land-use activities along with intensive tropical precipitation increases soil erosion rates in Kenya’s highland areas [12]. Water-induced soil erosion in the country’s croplands has been estimated at 26 t ha−1 yr−1 [4] and has resulted to a permanent reduction of soil productivity in about 20% of its total area [10]. Reference [11] which is a recent Land and Degradation Assessment (LADA 2016) report in Kenya shows only about 2.2% of the total surface area has minimal risk of degradation while 61.4% suffers from severe degradation through soil erosion. In addition, the total forestland in Kenya decreased by 1% while croplands and bare lands (mostly in ASAL areas) increased by 7.3% and 2.6% respectively between 1990 and 2010 [11]. Land degradation thus threatens the source of the livelihoods of millions of Kenyans who predominantly depend on small scale farming [13]. In the central highlands of Kenya as with other most rural catchments, the total annual soil loss predictions vary from 134 t ha−1 yr−1 to 549 t ha−1 yr−1 which surpasses the estimated soil tolerance for tropical highland areas of 2.2–10 t ha−1 yr−1 [14,15]. The Great Rift Valley (GRV) region of Kenya which has 84.5% of its coverage classified as ASAL [16], in particular is prone to erosion due to steep topography, severe droughts, continued population pressure within its highland areas and dynamic land use and land cover changes over the last decade [17,18]. These changes include; overgrazing due to inadequate animal husbandry by pastoralists that leads to soil desertification [19], increased deforestation in the highland forest areas, e.g., Mau Forest and Cherangani Hills [17], massive shift from shrub lands to grasslands, human migration from lowlands areas (ASAL) to highland areas, and reduction in cropland areas. Land misuse coupled with climatic changes have made rills, gullies and sheet erosion are prevalent occurrence in the region, e.g., in the Baringo-Kerio valley [20]. The region is important as it forms the largest part of Kenya’s grain basket zone that produces maize, wheat, beans, and tea [21]. The area has recorded high amounts of rainfall during the East African Short Rains (EASR) (October–December) periods in the recent past due to the Indian Nino resulting in rising lake levels in the GRV lakes [22]. Flooding of these lakes has also been attributed to a 50-year cyclic climatic event [23]. This has potentially heightened the risks of water erosion, pollution, siltation, flooding, and landslides [7,12].
A series of programs have been instigated in Kenya to address land degradation problems [10,21]. For instance, the forest policy has boosted reforestation measures which enabled the country to attain 6.99% national forest cover in 2014 [10]. Establishment of national parks and protected areas has reduced overgrazing and other adverse human-related activities in large rangelands although this significantly increases the pressure on the carrying capacity of the abutting lands. Some districts have adopted some Soil and Water Conservation (SWC) measures, e.g., conservation tillage practices and terracing, commonly referred to as Fanya Juu terraces, have shown considerable results [24]. With the current population density, the magnitude of soil erosion rates have continued to rise due to extreme weather changes, over-cultivation, desertification, and relative scarcity of productive farming land resulting to unsustainable sub division of land [3]. Since about 75 percent of the soils in Kenya are environmentally fragile and soil erosion is a long-term process involving complex combination of physical and hydrological factors [10,25], there is a need for methodical monitoring in order to establish critical areas and plan or devise for targeted soil conservation measures. Additionally, agriculture in Kenya strongly depends on irrigation water [21], and therefore it is important to monitor soil erosion spatial processes so as arm policy makers with efficient solutions to reduce soil transported into reservoirs.
Various studies have applied different models to compute soil loss by water erosion and sediment yields [26]. Some of the main hydrological models include the Universal Soil Loss Equation (USLE) [27], and its revised version (Revised Universal Soil Loss Equation (RUSLE)), Agricultural Non-Point Source Model (AGNPS), Morgan–Morgan–Finney (MMF), Soil and Water Assessment Tool (SWAT), Water Erosion Prediction Project (WEPP), Erosion Productivity Impact Calculator (EPIC), European Soil Erosion Model (EUROSEM), and The Limberg soil erosion mode (LISEM) [26]. These are broadly classified into physical and experiential models [28]. The applicability of a particular model generally depends on watershed spatial scale or characteristics, data accessibility and efficiency. Despite their complexity and high data requirements, physical models have “inbuilt process-based sub models” [26] that represent erosion processes more realistically. At regional scales and large catchments with limited data, empirical models such as USLE and RUSLE are most commonly applied [29] to estimate potential water erosion rates. The RUSLE is an updated version of the USLE model that has been extensively applied in many areas with different terrain characteristics and climatic zones to estimate long-term potential annual soil erosion rate, mainly because of its easy integration with geospatial technologies and low data requirements. Recent advancements in Geographic Information Systems (GIS) have enhanced RUSLE to allow for erosion monitoring at varied spatial and temporal scales [30].
Many of the past soil erosion studies in Kenya focus on the catchment scale or are at the local level [12,24,25,31]. Defersha et al. [32] applied WEPP and EROSION 3D physical models to estimate erosion rates and sediment yields at the Mara River Basin and revealed that the mean annual erosion rates for cultivated lands (120 t ha−1 yr−1) was higher than that of bush land (7 t ha−1 yr−1) or grasslands (3 t ha−1 yr−1). Mati et al. [33] assessed the applicability of EUROSEM in two small catchments and found it inadequate for dry rangeland areas. Baker et al. [34] used the SWAT model in River Njoro watershed on the floor of Kenya’s Rift Valley and showed that surface runoff increased proportionately with changes in land use. Similarly, Hunink et al. [35] indicated that coffee and maize growing areas presented mean erosion rates of 50 t ha−1 yr−1 and 10 t ha−1 yr−1 in the Upper Tana basin, respectively. In the USLE study by Mati et al. [24], 36% of the Upper Ewaso Ng’iro basin was predicted to suffer from mean erosion rates above the tolerable rate of 10 t ha−1 yr−1 mostly in the overgrazed rangelands. However, despite the presence of soil erosion in the physiographical regions of Kenya, few studies have applied the RUSLE model for spatial temporal evaluations particularly at the regional or national level [25,28,31,36]. The present study targets the GRV region of Kenya which covers about 33% of the country’s total surface area with an aim to quantify (i) estimate the magnitude of potential soil loss rates in 1990 and 2015; (ii) assess the spatial changes among soil erosion risk classes between the two periods; (iii) identify priority areas for SWC; and (iv) quantify annual soil loss rates in Kenya Great Lakes ASAL basins, topography and protected areas.

2. Materials and Methods

2.1. Study Area

The Kenya Great Rift Valley (KGRV) region is located in the tropical zone of East African Rift System (EARS) and geographically lies between latitudes 4°12′ N and 3°15′ S and longitudes 34°00′ E and 38°05′ E (Figure 1). The region shares its northern border with Sudan–Ethiopia border, southern border with Tanzania and about half of its western border with Uganda. It has a total area of 194,291.73 Km2, corresponding to approximately 33% of the country’s total area The area is characterized by undulating volcanic and tectonic terrain with altitudes ranging from 360 to 4170 m.a.s.l with a mean altitude of approximately 1200 m.a.s.l. The Eastern Rift Valley traverses north south across the region approximately 720 km and 110 km wide. The Kenya Lake System UNESCO World Heritage Site is located in this region [37] and Lake Turkana which is located in the north is both the world’s largest permanent desert lake and largest alkaline lake. The area encompasses Kenya’s four main water towers: the Mau Forest Complex which supports an important ecosystem—including an equivalent market value of 229 million USD for the tea and tourism economic sectors only [38]—Cherangani Hills and sections of Mt. Elgon and Aberdare Ranges. These vital ecosystems face constant threats from both anthropogenic forces (encroachment and deforestation) and natural hazards that have resulted to drying up of some rivers and streams within the region. Figure 2 shows Landsat time-series images indicating rising water levels in Lake Baringo due increased rainfall in the East Africa (EA) region (EASR) [22] and large-scale deforestation within the Mau forest Complex highlands [17].
The area has a tropical climate with a mean annual precipitation of about 614 mm and two wet seasons (March–May (Masika) and September–December (Vuli)). The highland areas including Mau Forest (2000 to 2800 m above sea level) enjoy high intensity rainfall ranging between 1000 and 2000 mm and mean annual temperatures of 10 and 22 °C. The long-term (1970–2015) mean annual precipitation of Lodwar (8635000), Egerton University (KE0863), and Narok (9135001) meteorological stations representing Upper, Central, and Lower climatic zones of the KGRV, respectively, ranges from about 5 mm to 150 mm as shown in Figure 3. Daily rainfall data from the Kenya Meteorological Department (KMD) showed that Lodwar, Egerton University, and Narok stations recorded 2, 26, and 14 days with rainfall measurement greater than 10 mm, respectively, in the year 1990. Similarly and following the same order, the stations recorded 6, 28, and 19 days in the year 2015. The maximum daily rainfalls for Lodwar, Egerton University, and Narok stations in 1990 are 30.1, 72.2, and 46.5 mm, respectively, and 30.8, 41.4, and 36.2 mm, respectively, in 2015. The northern Lotikipi plains in Turkana district experience low amounts of rainfall ranging from 3 to 55 mm yearly with mean annual temperatures varying from 28 to 31 °C. The tropical highlands of the KGRV are mostly associated with Andosols and Nitisols soils that are developed from volcanic material. Cambisols are within areas with medium elevation while Lithosols, Solonchaks, and Regosols are prevalent in the ASAL regions. The dominant soil categories (Figure 4) include Lithosol (29.8%), Regosols (15.0%), Nitosols (10.4%), Cambisols (7%), and Ferrasols (6.8%) [39]. The area has five agro-ecological zones (AEZ) (Figure 1) include Arid North (with a mean annual rainfall of 506 mm), Semi-Arid North (759 mm), Semi-Arid South (762 mm), High Rainfall (1188 mm), and Turkana (258 mm) with a proportion of each zone contributing 24.8%, 9.5%, 20.5%, 15.5%, 29.7%, and 15.5%, respectively, of the total region area [16,21,40]. The region presents ideal conditions to conduct soil loss analysis for the country due to its unique environmental diversity (i.e., combination of ASAL and High Rainfall AEZ) that covers four of the five drainage basins in Kenya [40]. Topography and landforms largely shapes the region’s drainage pattern (Figure 4). Several rivers branch from the central Kenya highlands into the endorheic Great Rift Valley basin, rivers in the western areas flow westward into Lake Victoria while streams from the Sudan-Ethiopia border drain into Lake Turkana (Figure 4). The lithology of the region is mainly dominated by igneous rocks around the mountainous landforms with sedimentary and metamorphic rocks mainly occupying the northern and western parts respectively. The four dominant landform types include Plains (29.2%), Plateaus (17.8%), Hills and Mountain foot ridges (12.6%), and Mountains (10.4%). Based on the 2019 national census the area has an estimated population of 13.8 million [9] which derive its livelihood mainly from agriculture in the High Rainfall AEZ and animal husbandry in the ASALs.

2.2. Data Collection

Table 1 shows the key datasets used in this study obtained from different sources. All the data was re-projected to the World Geodetic System (WGS) 1984_Universal Traverse Mercator (UTM) and resampled to match the data with coarse spatial resolution (250 m) using the SDMtoolbox in ArcGIS 10.5 software.

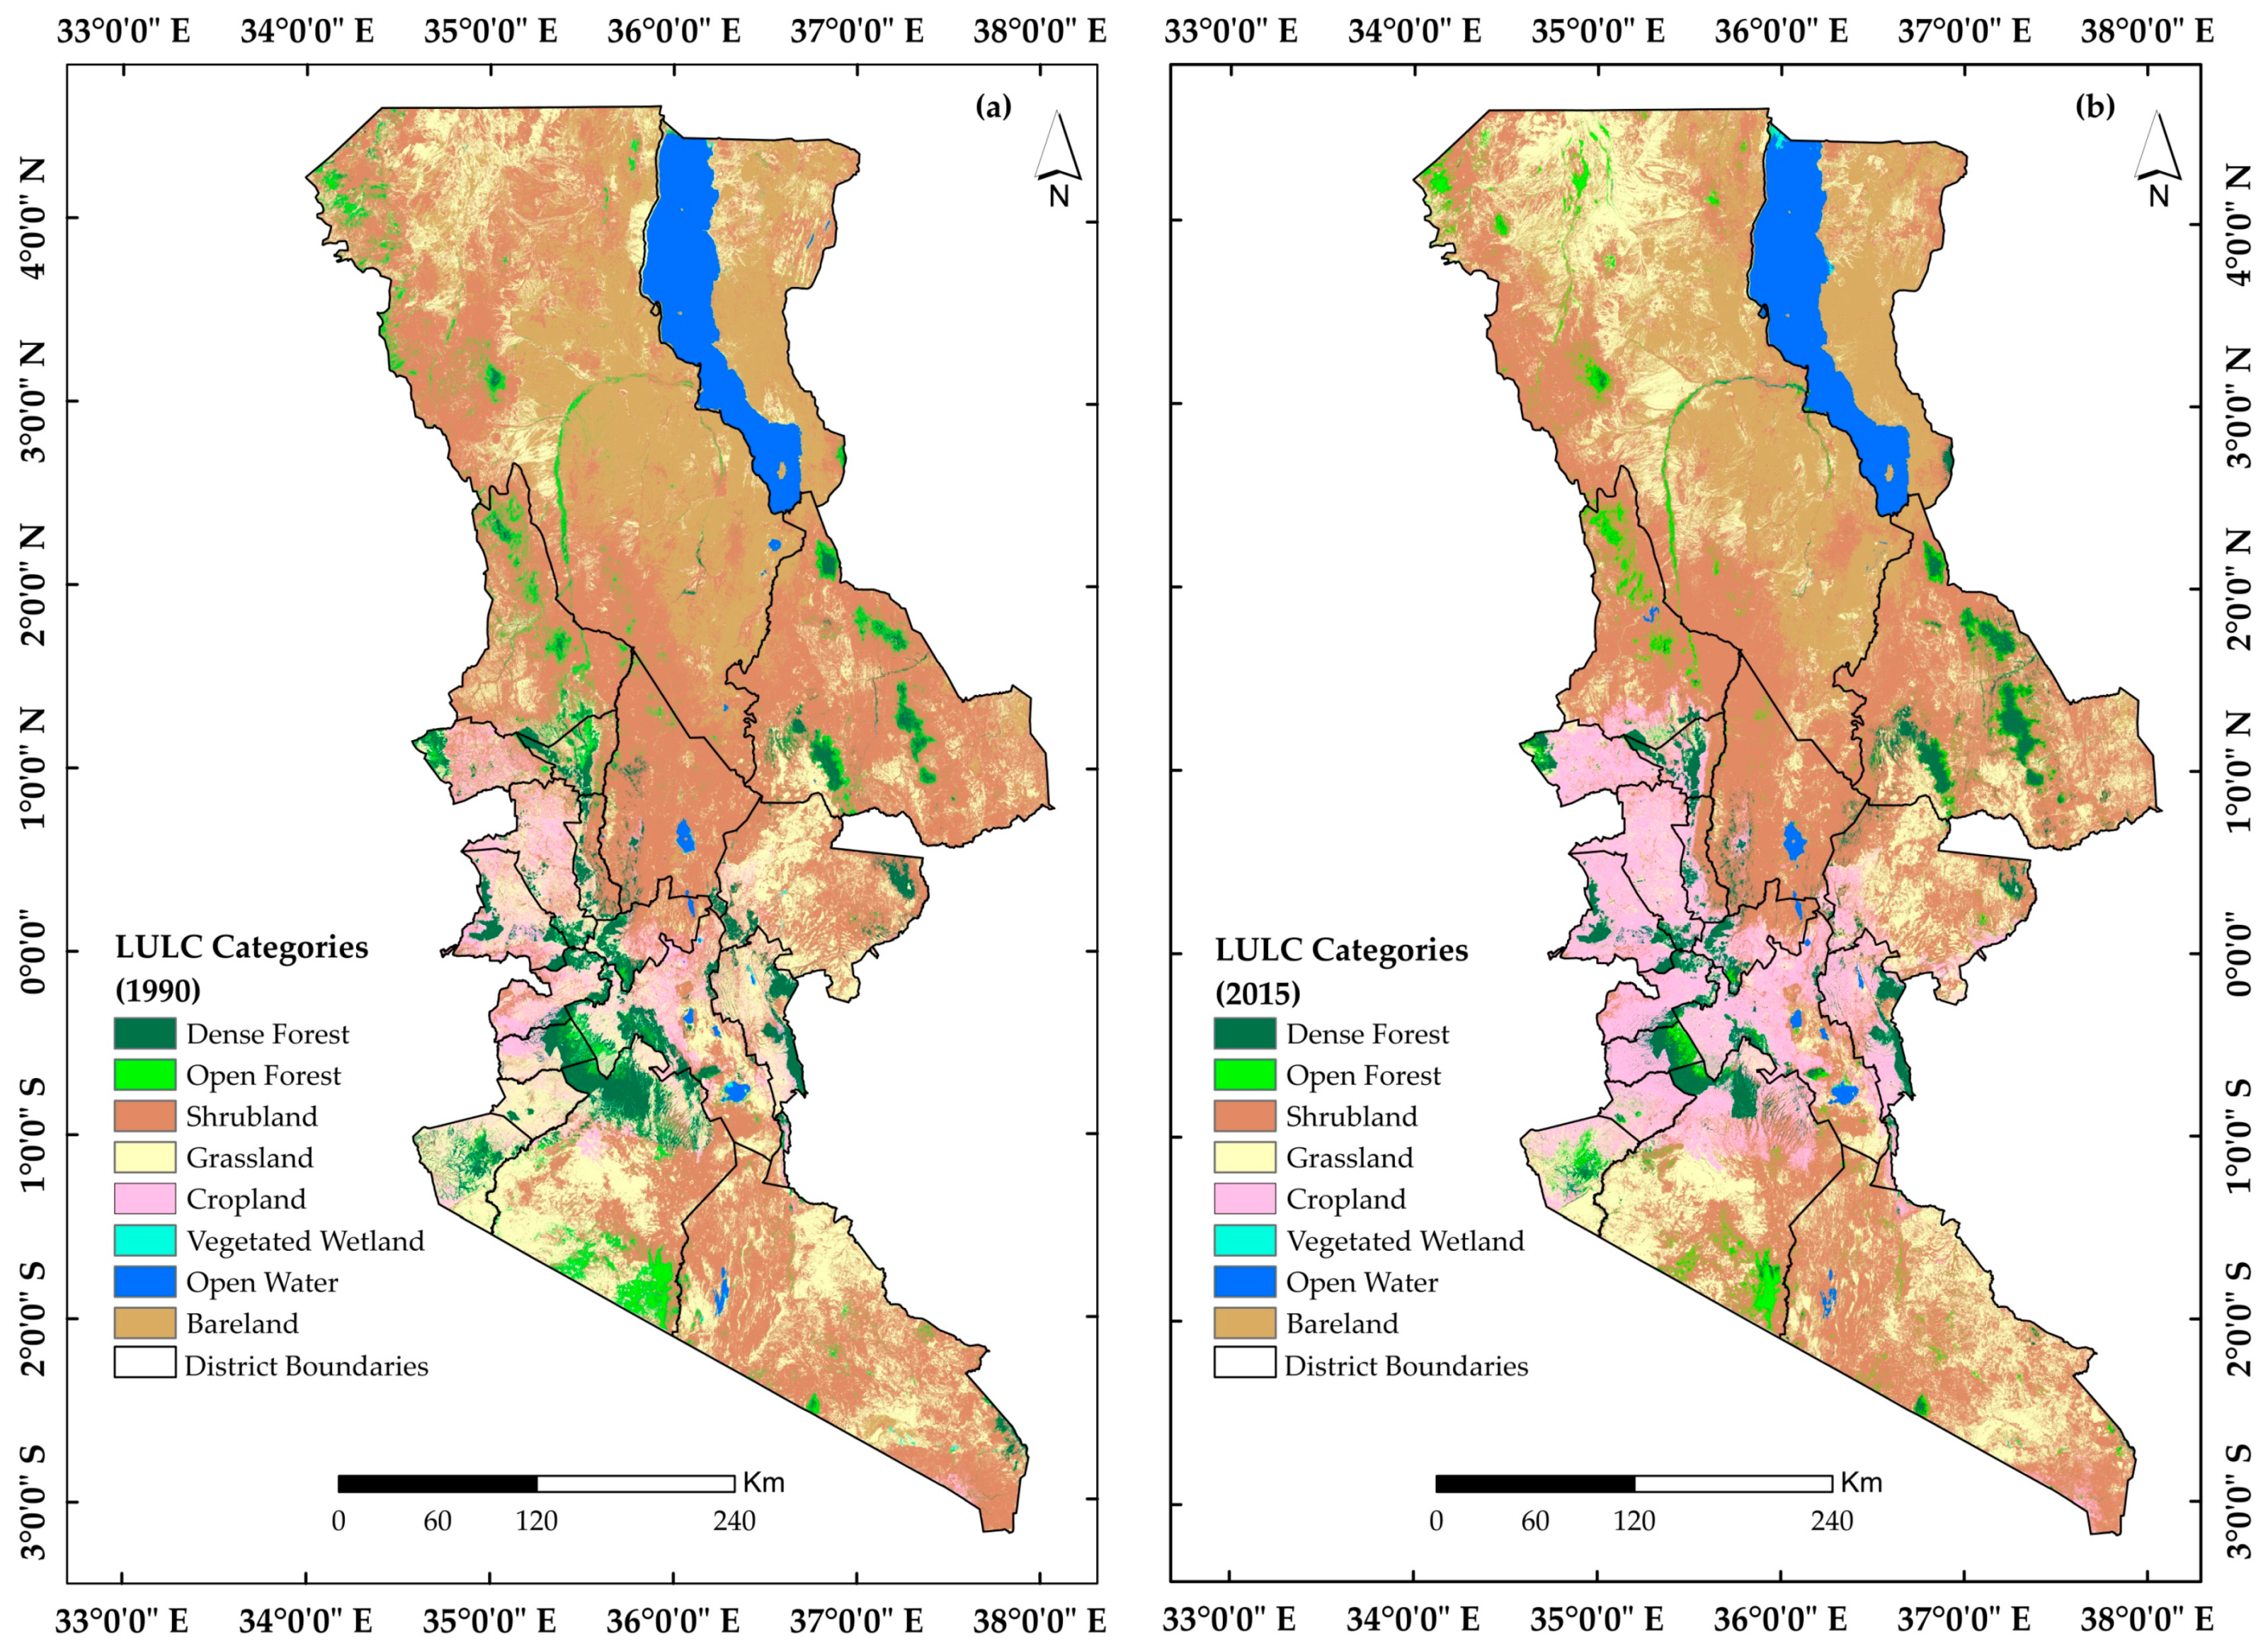
2.3. Land Use and Land Cover (LULC) Maps

For this study, 1990 and 2015 land use and land cover (LULC) maps for the GRV in Kenya (Figure 5) were acquired from the Department of Resource Surveys and Remote Sensing (DRSRS), Kenya in order to mask out non-erodible areas, estimate erosion rates for different LULC categories [41] and the impact of land use land cover changes (LULCC) on soil los rates. Erosion-prone areas covered a total area of 185,884.3 Km2 that included Dense Forest (4.9%), Open Forest (3.3%), shrub land (48.6%), grassland (21.6%), cropland (4.9%), and bare lands (16.7%), in 1990. Following a similar order, the proportion of land uses were 4.2%, 3.0%, 45%, 20.7%, 11.8%, and 15.3% in the year 2015.

2.4. RUSLE Model Application

Due to its unique merits that include easy integration with geospatial technologies [30], applicability in areas with limited data and adaptability at different spatial scales the Revised Universal Soil Loss Equation (RUSLE) empirical model has broadly been applied to estimate soil erosion rates worldwide.
The RUSLE model was chosen in this study since it has been tested in different landscapes, its application expediency and low data requirements [45]. The RUSLE equation [45] (Equation (1)) incorporates five different environmental variables using geo-informatics techniques to estimate the characteristics of soil erosion (Figure 6). These factors are rainfall erositivity (R), soil erodibility (K), slope length and steepness (LS), cover management (C), and support practice (P) [27].
A   = R K L S C P
where A = annual average soil loss (t ha−1 yr−1); R = rainfall erosivity factor (MJ mm ha−1 h−1y−1); K = soil erodibility factor (t ha h ha−1 MJ−1mm−1); LS = slope length and slope steepness factor (dimensionless); C = cover management factor (dimensionless); P = support practice factor (dimensionless).

2.5. Determination of RUSLE Factors

2.5.1. Rainfall Erosivity (R) Factor

Due to the direct correlation between rainfall intensity and erosion, the R factor represents the main driving factor of soil erosion [30] and contributes almost 80% of total soil loss [46]. The classical Wischmeier and Smith (1978) calculation method for R factor requires the use of storm erosivity index (EI) values of at least 20 years to account for seasonal variabilities and rainfall intensities [14,27]. Globally, not many areas have such gauged data readily available especially in developing countries [28]. The Lo et al. [47] method (Equation (2)) was adapted to estimate the rainfall erosivity factor since it has been applied by several studies in the East Africa region with significant results [29,48].
R = 38.46 + 3.48 × P
where R = Rainfall Erosivity in MJ mm ha−1 h−1 yr−1, P is the mean annual precipitation in mm. The mean annual precipitation for the time periods 1981–1999 and 1999–2015 were computed from the monthly average precipitation downloaded from the Climate Hazards Group InfraRed Precipitation with Station data (CHIRPS) [44] database and used to calculate rainfall erosivity factors for the periods 1990 and 2015, respectively [31]. CHIRPS data is readily available at high spatial-temporal resolutions and has been shown to have significant results in determining long-term rainfall trends when compared to rain gauge station datasets for Kenya [49,50] as well as the entire East Africa region [7,51].

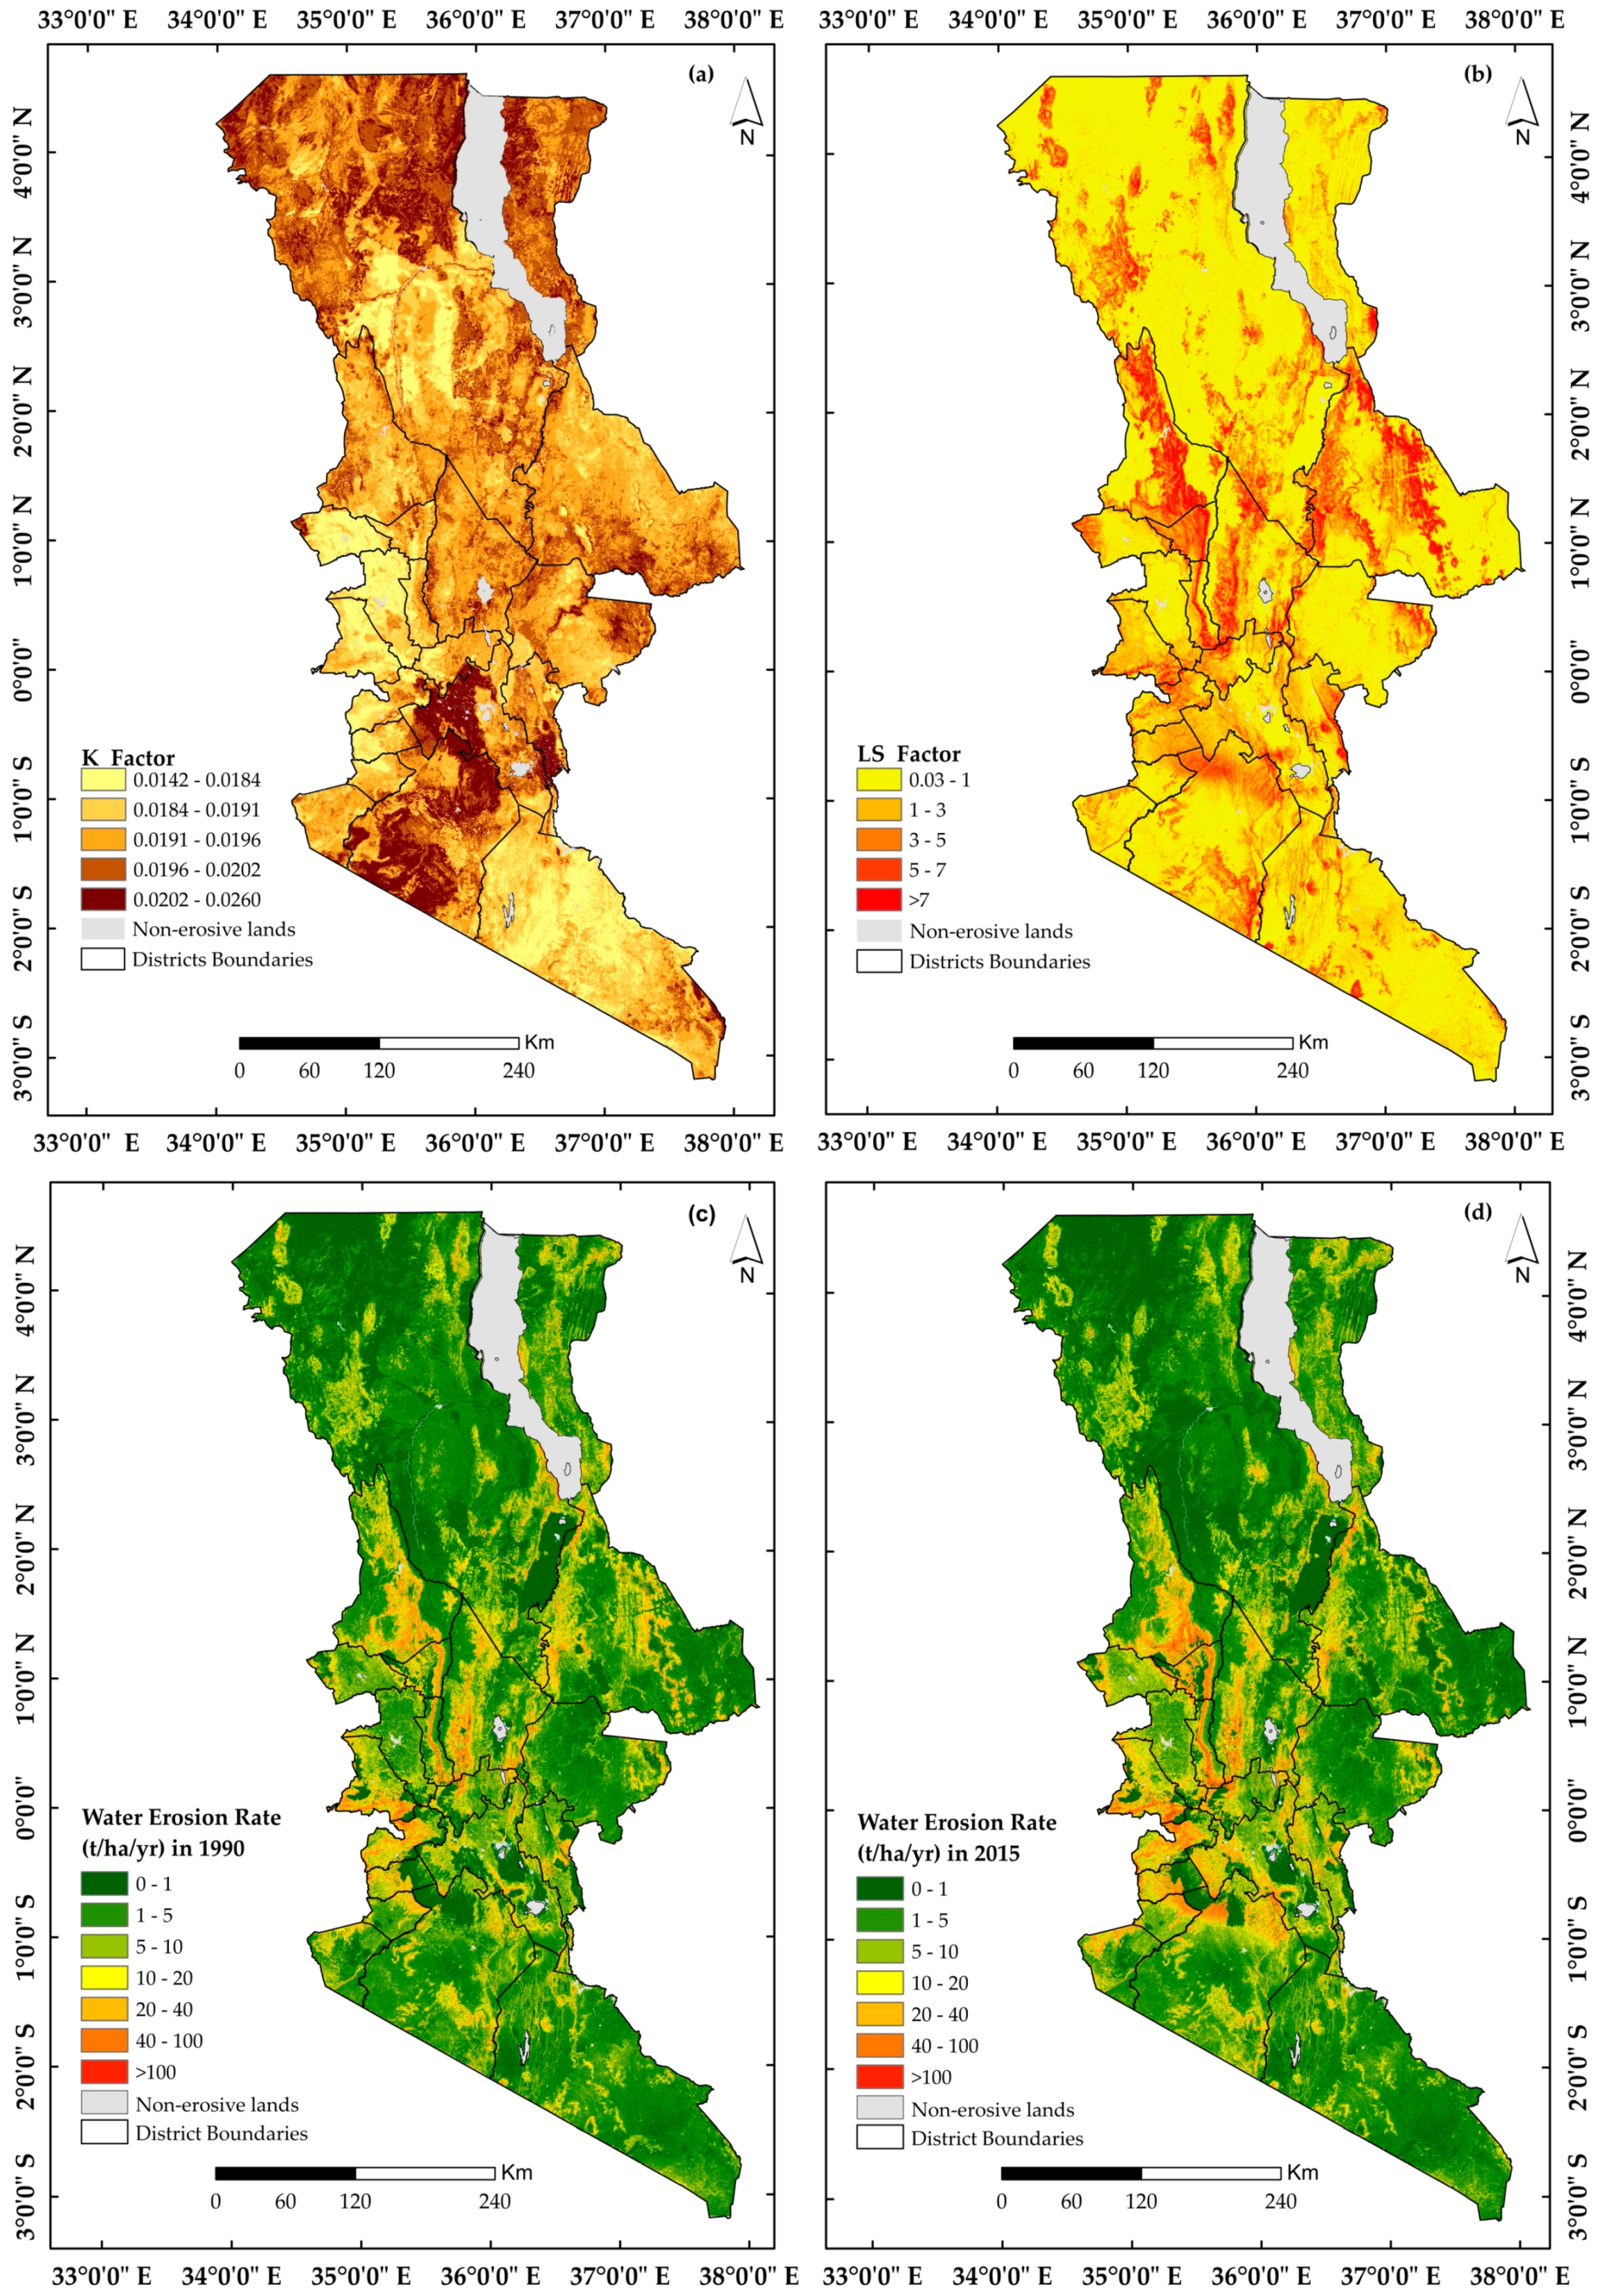
2.5.2. Soil Erodibility (K) Factor

The K factor indicates the ability or resistance of soil particles to disintegrate and be transported by surface water runoff. This is dependent on the inherent soil properties including soil texture, organic matter, soil structure, and permeability [52]. To determine the K factor, the EPIC (erosion-productivity impact calculator) [53] model was applied to the sand, organic, silt and sand soil fractions of the area as compiled by the Africa Soil Information Service (AfSIS) [43].
K   = F c s a n d × F s i c l × F o r g c × F h i s a n d × 0.1317 ,
where
F c s a n d   =   [ 0.2 + 0.3 e x p ( 0.0256 S A N ( 1 S I L 100 ) ) ] ,
F s i c l   =   [ S I L C L A + S I L ] 0.3 ,
F o r g c   = [ 1.0   0.0256 C C + e x p ( 3.72 2.95 C ) ] ,
F h i s a n d   =   [ 1.0   0.70   S N 1 S N 1 + e x p ( 5.51 + 22.9   S N 1 ) ] ,
where SAN, SIL, and CLA are percent sand, silt and clay content, respectively; C is the organic carbon content; and SN1 is sand content subtracted from 1 and divided by 100. Fcsand (Equation (4)) = gives a low soil erodibility factor for soil with coarse sand and a high value for soil with little sand content. Fsi-cl (Equation (5)) = gives a low soil erodibility factor with high clay to silt ration Forgc (Equation (6)) = is the factor that reduces soil erodibility for soil with high organic content. Fhisand (Equation (7)) = is the factor that reduces soil erodibility for soil with extremely high sand content.

2.5.3. Slope Length and Slope Steepness (LS) Factor

The LS factor represents the impact of topography on soil erosion [54]. It expresses the effects of local landscape on soil loss and is taken as the product of two terrain attributes: slope length (L) and slope steepness factor (S). Increasing the slope length and slope steepness values leads to higher overland flow speed and accelerates erosion rates [48]. The (LS) can be defined as the ratio of soil loss on a given slope length and steepness to soil loss from a seedbed with 22.13 m slope length and a steepness of 9% where all other conditions are held constant [54]. SRTM GL1 version 3 (30 m resolution) dataset provided by the United States Geological Survey (U.S.G.S.) [42] for the region was acquired to derive terrain attributes using the Raster Calculator tool from the Spatial Analyst extension of ArcMap 10.5 (Environment Systems Research Institute (Esri) Inc., Redlands, CA, USA). The L factor was calculated following algorithm (Equation (8)) proposed by Desmet and Govers (1996) while the S factor was estimated using the McCool et al. (1987) method (Equation (11)) [55,56]
L i . j   =   ( A i . j i n + D 2 ) m + 1 A i . j i n m + 1 D m + 2 · x i . j m · ( 22.13 ) m ,
m   =   β 1 + β
β   =   sin θ / 0.0896 3 ( sin θ ) 0.8 + 0.56
S i . j   =   { 10.8 sin θ i . j + 0.03 ,   tan θ i . j < 9 % 16.8 sin θ i . j 0.50 ,   tan θ i . j 9 %
where Li.j = slope length factor for the grid cell with coordinates (i.j); D = the grid cell size (m); Xi.j =; ai.j = aspect direction for the grid cell with coordinates (i.j); Ai.j-in = Flow accumulation or contributing area at the inlet of a grid cell with coordinates (i.j) (m2), β = the ratio of inter-rill erosion, θ = the slope in degrees [56].

2.5.4. Cover Management Factor (C) Factor

The C factor corresponds to impact of vegetation canopy and land management practices on soil loss [27]. Reference [27] defined the C factor as the proportion of soil loss from land cropped under specific conditions to the corresponding soil loss under clean-tilled, continuous fallow land. The cover management factor ranges from 0 for non-erosive areas with thick vegetation cover to 1 which indicates very high susceptibility to erosion due to intensive tillage or exposed smooth surfaces. Nyssen et al. [57] emphasized on the importance of C factor in soil erosion assessments thus misrepresentations of C factor coefficients for different land covers can result in high over or under estimations of erosion rates. For this study, C value coefficients were adopted from different literatures mainly focusing on the East Africa region (Table 2) and assigned to the corresponding thematic LULC raster maps.

2.5.5. Support Practice (P) Factor

The P factor represents land management control practices aimed at decreasing the rate of surface water runoff which in turn reduces soil erosion [27,56]. Conventional conservation measures include contouring, strip-cropping and terracing. Determining P factor values at large regional scales is nontrivial due to scarcity of data regarding conservation practices as well as complexities presented by different land uses [28]. A maximum value of “1” indicating poorest conservation practices was set to the P-factor [27] for the entire region since precautionary measures are often overlooked in regional soil erosion investigations [4]. In addition, Reference [64] revealed that the impact of soil and water conservation measures rapidly diminish in East African semi-arid areas. This study also separately estimated mean erosion rates in agricultural areas within the central and southern parts of the Kenya GRV region (Figure 1) in the year 2015 taking into account the three traditional soil erosion control practices proposed by Shin (1999) [65] (Table 3) to better understand their effect on croplands.

3. Results

3.1. Estimated Soil Erosion Rates in the Great Rift Valley Region of Kenya

Figure 7 and Figure 8 show the RUSLE results for the two periods while their statistical details are provided in Table 4. Rainfall Erosivity Factor (R) value varied between 359 and 8241 MJ mm ha−1 h−1 yr−1 (Figure 7a) with a mean of 2626.7 MJ mm ha−1 h−1 yr−1 in the year 1990. For the year 2015, the value varied from 340 and 7974.9 MJ mm ha−1 h−1 yr−1 with an average of 2162 MJ mm ha−1 h−1 yr−1. In both years the highland areas recorded rainfall erosivity values >5000 MJ mm ha−1 h−1 yr−1 as with the work of Reference [7]. The central areas of the Kenya Great Rift Valley region is largely dominated by high R value while at the upper and lower parts (ASAL zones), R values are in the low range. These R values are consistent with the spatial distribution of the average annual rainfall across the region. Soil erodibility Factor (K) values ranged from 0.014 to 0.026 t ha h ha−1 MJ−1 mm−1 (Figure 8a). The topographic factor (LS) values were classified into five categories (Figure 8b) while the cover management Factor (C) ranged between 0 and 0.4 (Figure 7d).
The mean erosion rate for the year 1990 was estimated at 6.26 t ha−1 yr−1 with a standard deviation of 50.71 while the year 2015 presented a rate of 7.14 with a standard deviation of 40.38. In both years, the estimated mean rate of annual soil loss fell within the normal soil loss tolerances (from 5 to 11 t ha−1 yr−1) [14,27,46]. The amount of total annual soil loss in the KGRV region was 116 Mt yr−1 in 1990 and 132 Mt yr−1 in 2015. To show the spatial distribution of water erosion and their areal extents in 1990 and 2015, the study area was classified into six erosion risk categories ranging from “very low” to “extremely high”. In both years, the very low and low erosion classes when combined constitute greater sections of the total study area. In 1990, the two classes totaled to 154,822.1 Km2 (83.3% of the total study area) while in 2015, the total was 150,695.2 Km2 (81.1% of the total study area). The areal extent covered by medium, high medium, high, very high, and extremely high increased from 16,249.6 Km2, 10,783.2 Km2, 3 564.3 Km2, 257.9 Km2, and 207.0 Km2 in 1990 to 16,906.1 Km2, 11,838.3 Km2, 5430.8 Km2, 561.4 Km2, and 452.4 Km2, respectively, in 2015. However, the low erosion class reduced from 99,265.1 Km2 to 93,733.1 Km2 over the study period.

3.2. Land Use/Land Cover Changes (LULCC) and Soil Erosion in the Great Rift Valley Region of Kenya

Table 5 shows the comparison of soil loss estimates between changes in LULC types within the investigated area. The results suggest a significant incline of mean rate of soil loss in cropland (from 15.8 t ha−1 yr−1 in 1990 to 20.6 t ha−1 yr−1 in 2015) and dismal reduction across all the other LULC types. LULCC occurred in the area of about 71,044.6 Km2 (38.2%), while 114,839.7 Km2 (61.8%) remained unchanged over the study period. Notable LULC types experiencing conversions (Table A1) include shrubland to grassland 15,077.3 Km2, grassland to shrubland 12,289.9 Km2, grassland to cropland 7530.7 Km2, bareland to grassland 4686.5 Km2, and dense forest to cropland 1643.6 Km2. Among LULCC that contributed to increased soil losses are dense forest to bareland (59.0 t ha−1 yr−1), dense forest to cropland (31.0 t ha−1 yr−1), open forest to cropland (31.0 t ha−1 yr−1), shrubland to cropland (10.7 t ha−1 yr−1), grassland to cropland (10.2 t ha−1 yr−1), and open forest to grassland (5.7 t ha−1 yr−1). Conversely, LULCC that contributed to reduced soil losses include cropland to dense forest (−26.4 t ha−1 yr−1), shrubland to open forest (−10.1 t ha−1 yr−1), and shrubland to dense forest (−19.5 t ha−1 yr−1) (Table 5).
Spatial analysis of erosion risk conducted at the district level revealed that most of the districts within the mountainous landform part of the KGRV recorded soil loss rates >10 t ha−1 yr−1 (Table A2). Kericho district was consistent in presenting mean rates greater than 20 t ha−1 yr−1 in both study periods while most ASAL (e.g., Turkana, Laikipia and Kajiado) districts had rates <5 t ha−1 yr−1. Keiyo and Marakwet districts had the highest soil loss increment of about 10 t ha−1 yr−1 over the study period. This is agreement with work of Reference [31] who reported an average increase of about 6 t ha−1 yr−1 for the western parts of the KGRV. This can be attributed to the high altitude and high mean rainfall which favored intensive farming on highly erosive soils in the region [31]. Table A3 shows the distribution of LULCC in relation to soil erosion at a district level. It represents the area coverage of the LULCC that occurred per district and the corresponding mean soil loss rates. The results suggest that though Keiyo district experienced the least conversions, it had highest erosion rates due to its high slope (19.8%) and mean rainfall (about 1200 mm). On the contrary, the driest districts characterized by semiarid desert plateaus recorded low erosion rates despite their high LULC conversion exchanges (e.g., Turkana and Samburu).

3.3. Estimated Soil Erosion Rates in the Protected Areas within the Great Rift Valley Region of Kenya

The United Nations Environment Program (UNEP) and the World Conservation Monitoring Center (WCMC) puts the total number of protected areas of Kenya at 411 with coverage of approximately 72,545 Km2 [28,66] The number of the protected areas listed in the Great Rift Valley region of Kenya (Table A4) with a soil rate of <10 t ha−1 yr−1 went down from 57% in 1990 to 34% in 2015. Most of the protected areas that recorded an inclined of mean erosion rate are located in the areas occupied by characterized steep gradients topography and high rainfall intensity. Some of the endangered areas with mean erosion rates >35 t ha−1 yr−1 in year 2015 that need intervention planning include Kessop (51.86 t ha−1 yr−1), Sogotio (40.7 t ha−1 yr−1), Kaisungor (47.04 t ha−1 yr−1), Chemurokoi (40.87 t ha−1 yr−1), and Kimojoch (41.45 t ha−1 yr−1). Internationally acclaimed areas like Masai Mara, Lake Nakuru, and Amboseli national parks had consistent low soil loss averages of 1.5 to 4 t ha−1 yr−1 in both years of study and dismal changes. Nevertheless, areas that experienced high cases of deforestation between the two periods presented sharp incline erosion rates, e.g., Eastern Mau (from 5.94 to 18.18 t ha−1 yr−1), South Western Mau (from 4.56 to 13.45 t ha−1 yr−1), Southern Mau (from 13.13 to 19.22 t ha−1 yr−1), Kipkabus (from 17.77 to 34.15 t ha−1 yr−1), and Timboroa (from 14.17 to 24.55 t ha−1 yr−1).

3.4. Classification Estimated Mean Erosion Rates by Severity and Conservation Priority

To prioritize for conservation planning, the quantitative soil erosion loss map loss of the Great Rift Valley region of Kenya were classified into 6 erosion classes following the methodology by Koirala et al. [67] in order to identify conservation priority areas (Table 6). The erosion severity ordinal classes are namely: slight (0–5 t ha−1 yr−1), moderate (5–10 t ha−1 yr−1), high (10–20 t ha−1 yr−1), very high (20–40 t ha−1 yr−1), severe (40–80 t ha−1 yr−1), and very severe (>80 t ha−1 yr−1). Areas with very severe erosion levels have been categorized as first priority whereas slight erosion values allocated 6th conservation priority. The results show that areas under slight erosion decreased from 71.73% of the total erosive lands in 1990 to 69.46% in 2015. However, the extent of total erosive lands for moderate, high, very high, severe and very severe classes increased from 11.57%, 8.74%, 5.8%, 1.91%, and 0.25% in 1990 to 11.63%, 9.09%, 6.36%, 2.92%, and 0.54%, respectively, in 2015.

3.5. Estimated Soil Erosion Rates by Slope and Elevation

The mean annual soil loss for areas with high slopes (β = 17.6–26.8%) was 14.99 t ha−1yr−1 resulting in a total loss of approximately 19.2 Mt yr−1 in the year 1990 (Table 7). The erosive lands within this slope category had the largest erosion net change in the year 2015 which presented a rate of 18.53 t ha−1yr−1. Total soil loss for gentle slopes (β < 7%) increased slightly from 20.1 Mt yr−1 to 21.1 Mt yr−1. The elevation raster map of the investigated area was reclassified into five different categories and the corresponding mean soil loss rates extracted using the ArcGIS Spatial Analyst tool set. The mean erosion rate for elevation of <500 m.a.s.l were 3.42 t ha−1 yr−1 in 1990 and 2.32 t ha−1 yr−1 in 2015 (Table 8). Areas with elevation greater than 2000 m.a.s.l characterized by high mean rainfall had the highest net change in soil loss (5.87 t ha−1 yr−1) while regions with an elevation less than 1500 m.a.s.l having slightly reduced erosion rates.

3.6. Soil Erosion in the Major River Basins

The Great Rift Valley region of Kenya covers four of the five major basins that drain in Kenya [40,68]: the entire Great Rift Valley Area basin (GRVA) and sections of Ewaso Ngiro, Lake Victoria and Athi River basins (Figure 4) that had mean annual soil rates of 6.16 t ha−1 yr−1, 5.09 t ha−1 yr−1, 9.42 t ha−1 yr−1, and 3.0 t ha−1 yr−1 in 1990 and 6.79 t ha−1 yr−1, 4.37 t ha−1 yr−1, 13.7 t ha−1 yr−1, and 3.6 t ha−1 yr−1 in 2015, respectively (Table 9). Of all the major sub basins within the KGRV region, only Lake Bogoria-Baringo had a mean annual soil loss rate >10 t ha−1 yr−1 in 1990 while Lake Victoria, Lake Nakuru, Lake Naivasha, and also Lake Bogoria-Baringo recorded soil loss rates >10 t ha−1 yr−1 in the year 2015.

3.7. Estimated Soil Erosion Rates by Major Landform and Soil Types within the KGRV

Table 10 and Table A4 present the statistical details of the soil loss rates within the major landform types and dominant soils within the Kenya Great Rift Valley region respectively. In both years of study, areas around escarpment had the highest mean erosion rates of >25 t ha−1 yr−1 with plains recorded lowest rates of about 2.5 t ha−1 yr−1. Mountainous parts around the central KGRV had the highest incline in mean erosion rates (4.34 t ha−1 yr−1) while depressions had decreased soil rates (−1.43 t ha−1 yr−1) over the study period. The results show that all of the dominant soil groups had mean soil loss rates <10 t ha−1 yr−1 in the year 1990 while Andosols and Nitisols (soils associated with volcanic material) recorded 11.53 t ha−1 yr−1 and 13.9 t ha−1 yr−1 in 2015, respectively. In addition, the two soil groups presented high soil loss rate net changes over the study period with Andosols (with high agricultural production) increasing by 5.52 t ha−1 yr−1. Despite their resistance to water erosion due to good aggregate stability and high water permeability, Andosols can become susceptible to erosion particularly in intensively cultivated and deforested areas [69]. The heavy clayey Vertisols and the mostly water logged Gleysols had consistent low soil loss rates (about 3.0 t ha−1 yr−1) in both years.

3.8. Sensitivity Analysis of the RUSLE Model Factors used in the KGRV

Each of the five RUSLE parameters has a different role or impact on the total magnitude of the mean erosion rate [52]. The descriptive statistics in the model shown in Table 11 revealed that rainfall erosivity parameter (R) and soil erodibility parameter (K) are the two strongest controlling parameters for soil erosion in the Kenya GRV region. Regions with severe erosion rates increased significantly after removing parameter K.

3.9. Estimated Soil Erosion Rates in the Agricultural areas within the Central and Southern Rift Valley Region of Kenya (in 2015)

The central and southern region that includes the High Rainfall AEZ where agriculture is mostly practiced within the study area [21] (Figure 8), was separately analyzed in 2015 to understand the effect of common conservation practices on cropland areas (i.e., contouring, strip-cropping, and terracing). This can assist in making risk-informed decisions to conserve croplands that substantially contributed to increased soil loss rates over the period of study. Under the baseline conditions with P factor values set to “one”, the total cropland area (21,864.2 Km2) Figure 9a had a moderate mean soil erosion rate of 18.0 t ha−1 yr−1; only 4.5% of the croplands had a sustainable mean soil loss <1 t ha−1 yr−1 while 28.6% of the croplands had severe soil loss rates >20 t ha−1 yr−1 mostly in central highland areas. This estimated mean annual soil loss rate is higher than the normal soil tolerances (from 5 to 11 t ha−1 yr−1) [27] and the highland threshold for agro-ecological zones in tropical areas (from 0.2 to 11 t ha−1 yr−1) [48]. The study predicted that, compared to the baseline scenario, terraces Figure 9b would decrease mean soil loss by 84.4% (from 18.0 to 2.8 t ha−1 yr−1) while strip-cropping Figure 9c and contouring Figure 9d would slow soil erosion rate by approximately 2.5 and 1.2 times (from 18.0 to 7.2 t ha−1 yr−1) and (from 18.0 to 14.4 t ha−1 yr−1), respectively.

4. Discussion

Overview of Estimated Soil Erosion Risk in the Great Rift Valley Region of Kenya

The present study found that the mean erosion rate for the entire area was estimated at 6.26 t ha−1 yr−1 with a total soil loss of 116 Mtyr−1 in 1990 (Figure 6) and 7.14 t ha−1 yr−1 with a total soil loss of 132 Mtyr−1 in 2015. This estimated rate is within the range of erosion rate for Africa (10.8–146 t ha−1 yr−1) [70] and slightly below the tolerable limits for mountainous environments (below 25 t ha−1 yr−1) [67]. The mean erosion rate is also within range of the normal soil loss tolerances (ranging between 5 and 11 t ha−1 yr−1) [27,48]. For both years, a greater proportional of the investigated region fell under the tolerable category (Table 4) as per the recommended maximum threshold of soil loss tolerance of 10 t ha−1 yr−1 for tropical areas [71]. Lake Bogoria-Baringo basin presented mean annual erosion rates >10 t ha−1 yr−1 for both periods while Lake Naivasha which recorded 10.8 t ha−1 yr−1 (Table 9) in year 2015. These values are in agreement with study by Mati et al. [24] which reported >10 t ha−1 yr−1 mean erosion rates in the Ewaso Ngi’ro basin. Flooding and the adverse effects of soil erosion within the Kenya GRV lakes has been attributed to the geomorphology of the lakes’ environment and climatic factors [23]. Research is ongoing to find more definitive explanations for the recent rising levels of these Great Lakes [72,73]. Lakes Baringo and Naivasha are bordered mostly by flats lands while Lakes Bogoria and Nakuru are located in valleys enclosed by eastern and western rift escarpments [17]. Mubea and Menz [74,75] works revealed increasing urbanization and land degradation patterns in Nakuru district. This compounded with recent climatic changes [50] can offer some explanations why Lake Nakuru basin recorded the highest rise in soil loss rates among the Great Lakes. Rapid increment in floriculture and horticulture farming, over cultivation near river banks, and population growth are some of anthropogenic factors contributing to land degradation in the Lake Naivasha basin [76]. Willy et al. [77] survey study in Lake Naivasha basin showed low implementation of soil conservation practices with only 16% of sample households employing a combination of terracing, contouring, and grass strips. Lakes Baringo and Bogoria are located in Baringo County whose economy relies heavily on livestock which contributes 70% of its total income and supports 90% of its population [9]. Baringo County experiences frequent droughts; therefore, overgrazing can put pressure on land resulting to desert-like conditions [78]. Despite the highest mean annual precipitation and slope gradients for tree cover areas, forests presented lowest mean erosion rates for both periods (Table 5) emphasizing on the values of trees in soil erosion control. However, croplands had highest mean erosion rates indicating that intensive agricultural activities in areas with steep slopes significantly increase soil erosion threat within the Kenya GRV region. Fenta et al. [7] noted the high susceptibility to soil erosion of Kenyan highlands especially in disturbed forests or under sparse vegetation. Previous studies including [14,41] have also reported high erosion rates in highland areas with forestlands or poor vegetation due to deforestation, overgrazing, wildfires, and land cover changes. Koirala et al. [67] is in agreement with the concept that soil erosion increased proportionately with slope in mountainous regions while Schürz et al. [36] also reported high erosion rates in forested districts located on highlands e.g., West Pokot and Marakwet. In addition, recent study by Kogo et al. [31] in western Kenya (a subset of the KGRV region) revealed high rates around highlands e.g., the Mt. Elgon. Large bare areas in the ASAL which might potentially have high erosion rates recorded relatively low actual mean rates due to low rainfall and erosivity values. Significant bareland to grassland land cover conversions resulted in slight reduction of soil loss rates in ASAL areas, e.g., Turkana and Marsabit districts. The top three priority regions (Table 6) with erosion rates > 20 t ha−1 yr−1 contribute approximately 10% of the total erosive prone areas in the year 2015 and include highland districts located across the steep escarpment and ranges. Such areas are in urgent need of soil water conservation measures to mitigate heavy soil losses. Most of the protected areas are within forests or highland areas and recorded high erosion rates (Table A5) which is comparable with other estimated erosion rates for protected sites in other tropical lands as shown in References [28,29].
To assess the validity of RUSLE method for this region, the findings of the study were compared with areas of similar geo-environment and climatic conditions in the Eastern Rift Valley (EAR) region and seen to be analogous. For instance, our results coincide with those of previous studies by: Aneseyee et al. [79] evaluated the mean soil erosion rate in the neighboring Omo-Gibe Basin in the Ethiopian Rift Valley to be 17.65 t ha−1 yr−1, Tamene et al. [71] found the mean soil loss rate of Laelaywkro catchment in Northern Ethiopia to be 20 t ha−1 yr−1, Gizaw et al. [80] revealed that mean annual soil loss of Somodo watershed in South West Ethiopia is 18.69 t ha−1 yr−1 and Ligonja and Shrestha [81] reported a mean erosion rate of 15.7 t ha−1 yr−1 in Kondoa, Tanzania (Table 12). The districts’ mean erosion rate values within the study area were consistent though not equal to the median and mean of soil losses values that resulted from the USLE model ensemble calculated by Schürz et al. [36]. In line with other studies in the East Africa region, terracing was found to be a highly effective soil erosion control measure especially for croplands located on the Kenya GRV highlands and the High Rainfall AEZ. Terracing and use of stone bunds was in practice across the Eastern Rift Valley (ERV) in small scale since the prehistoric periods as evidenced by ancient agricultural landscapes situated in the ASAL areas, i.e., Marakwet (Kenya), Engaruka (Tanzania) (Figure 10a), and Konso (Ethiopia) [82]. In Kenya, many of these terraces that had shown significant results were demolished or abandoned in retaliation to the colonial authority [20]. A sizeable number of smallholder farmers currently employ terracing and contouring within the Kenya GRV region (Figure 10b).
Ruto et al. [86] revealed that terracing reduced soil erosion activity in Narok County and significantly increased maize and beans yields. Despite their effectiveness in controlling runoff, terraces, and stone bunds can be the source of erosion if poorly maintained or abandoned over time [64]. The high mean water erosion rates in the river basins can be attributed to negative land use land changes (Figure 2b) as well as neglect in adopting effective soil water conservation measures (Figure 10). Zhunusovaet al. [87] indicated that the single use of terraces had negative impact on crop yield in the Lake Naivasha basin while Reference [88] found that mulching and ground cover can be ineffective in controlling runoff flow on croplands with steep slopes as those in Kenya GRV region. In addition, Willy et al. [77] reported combined control measures (multiple soil conservation practices) can be adequate within the Lake Naivasha basin. Ten out of the thirteen water basins in the Kenya GRV region are located in ASAL regions characterized by lowland pasture, desert shrubs, exposed barren areas with sparse vegetation and poor land, and animal husbandry; thus, susceptible to water erosion (Figure 11). In Kerio Valley basin, increase in barelands, degraded forests coupled with recent high rainfall intensity increased soil loss resulting in heavy sedimentation as evidenced by very low water levels of Lake Kamnarok in the downstream areas [12]. Although the RUSLE method has been applied widely in different landscapes with significant results, its accuracy largely depends on the type of dataset (resolution, up-to-date, preference of primary over secondary data) and data manipulation methods [30]. The method suffers some limitations and its applicability in mountainous terrain remains doubtful [89]; possibly explaining the very high mean erosion rates recorded on escarpments and ranges within the Kenya GRV region.
The soil erodibility factor for this study did not include pertinent factors, e.g., level of soil weathering, resistance against dispersion and crusting [90]. The mean annual erosion estimated in the current study also does not account for rainfall erositvity and vegetation seasonal variability. The Van der Knijff algorithm C = e x p ( a N D V I β N D V I ) [91] where a and β are the parameters that determine the shape of the (Normalized Difference Vegetation Index) NDVI-C curve have been employed by several studies [28,29] in the East Africa (EA) region to estimate vegetation cover factor although it can lead to overestimation of C values in tropical regions with high rainfalls [30,41,92] (e.g., the forested areas of the KGRV). This equation gave high range of values for the KGRV (0.0–1.6) when compared to the values generated by the Durigon equation [92] C = ( N D V I + 1 ) / 2 (0.05–0.65) recommended for tropical areas. This is after applying these equations on eleven MODIS (Moderate Resolution Imaging Spectroradiometer) NDVI datasets taken during the KGRV’s wet seasons in the year 2015 for comparison purposes. Methods that assign C values to different LULC classes based on on-field determinations or combination techniques (e.g., involving image transformations and geostatistical analysis) are recommended for better estimation of C factor [4,30,36,71]. Table 13 shows the zonal statistics details between C factor map given by the Durigon equation on MODIS NDVI and the 2015 LULC map. The mean C factor values for forests are high (approximately 150 times higher than those used in this study) resulting to overestimation of the corresponding mean soil loss rates. This can give a false interpretation that croplands are better than forests in controlling water erosion in the KGRV.
Few works have been undertaken to estimate P factor values for the EA region [93] thus a maximum value of “one” was assigned to the Kenya GRV study area to indicate none conservation measures. The P factor method previously applied by other researchers in the region in which agricultural lands are assigned P values in relation to percent slope [41,46] (0–5%, P = 0.10; 5–10%, P = 0.12; 10–20%, P = 0.14; 20–30%, P = 0.19; 30–50%, P = 0.25; and 50–100%, P = 0.33) was noted to generate a comparatively low mean erosion rate (6.3 t ha−1 yr−1) for croplands within the Kenya GRV after including it in the 2015 RUSLE model. Use of high resolution imagery with field data can be more sufficient [94]. In addition, generation of RUSLE parameters from published datasets with medium or coarse resolutions (data interpolations) may produce spatially variable erosion rates that can exceed acceptable tolerance levels [95]. These limitations notwithstanding, the RUSLE method was seen as a fast and practical approach in pinpointing potential erosion hotspots for such a vast region using limited data and the study results will be valuable in the management of the Kenya GRV region as well as provide useful guidelines in soil erosion investigations in tropical areas.

5. Conclusions

Water erosion is major source of soil degradation in Kenya whose land mass is dominated by arid and semi-arid lands. These ASALs are susceptible to natural hazards including soil erosion that can destroy vegetation cover resulting to land degradation hence increase desertification risk. This poses a significant threat to agricultural production and food security in Kenya. The present study examined the magnitude of soil erosion rates using the RUSLE model in the Great Rift Valley region of Kenya due to its environmental diversity (i.e., combination of ASALs and agricultural lands) and important ecosystem services it provides in the country. The study is among the first attempts to quantify multi-temporal soil loss rates at the national scale for Kenya (with about 33% of the total land mass). Annual soil loss was found to be severe in the central and southern parts of region particularly along mountain fringes with high rainfall intensity for both years. The overall mean soil loss rate for the entire area fell under the tolerable erosion rate of 10 t ha−1 yr−1 in 1990 and 2015 although the substantial net changes in erosion rates for croplands underscores the need to devise effective anti-erosive interventions. Areas that require prioritized in soil conservation measures include more than half of all the protected areas as well as croplands in the central and southern regions of the Kenya GRV that presented mean erosion rates higher than 15 t ha−1 yr−1. This also includes water basins: e.g., Lake Nakuru which has high urbanization trends as well ASAL basins, and Lake Bogoria-Baringo basin which has been adversely affected by human activities, e.g., agriculture with poor SWC measures and over reliance to pastoralism. Outcomes of this study can inform watershed managers on ways to reduce soil erosion rates, e.g., value of integrated conservation practices, curbing unregulated land use, overgrazing, limiting mass migration and deforestation as well as encouraging conservation tillage. The findings can further help policy makers plan for sustainable soil management strategies as the country gears towards achieving land degradation-neutrality.

Supplementary Materials

The RUSLE model factor maps for KGRV are available online at https://www.mdpi.com/2071-1050/13/2/844/s1.

Author Contributions

Formal analysis, methodology and investigation and writing; G.W., L.Y. and J.Z. Project supervision and administration; L.Y. and Y.N. Reviewing, statistical analysis and discussion; T.N., B.K., J.d.D.N. and Y.N. All authors have read and agreed to the published version of the manuscript.

Funding

This research was funded by the National Key Research and Development Project of China through grant agreement No 2020YFC1521900 and 2020YFC1521901. This work has also been supported by National Key Research and Development Program (No. 2014A8007007020) and China Scholarship Council 2014GXYB33 through Sino-Africa Joint Research Centre.

Institutional Review Board Statement

Not applicable.

Informed Consent Statement

Not applicable.

Data Availability Statement

Data available in a publicly accessible repository that that does not issue DOIs.

Acknowledgments

The authors would like to thank the editor and anonymous reviewers for their valuable comments and suggestions to improve the quality of this paper. The authors thank Yves Hategekimana, Fidele Kamarage and Felix Mutua for their valuable assistance.

Conflicts of Interest

The authors declare no conflict of interest.

Appendix A

Table A1. Estimated Water-induced Mean soil loss rates under different Land Use and Land Cover (LULC) Conversions within the Great Rift Valley region of Kenya.
LULC ConversionsArea (ha)Average Erosion Rate (t/ha/y)Average Slope (%)
Bareland to Cropland2810 −11.27.5
Bareland to Dense Forest2724 −23.615.0
Bareland to Grassland468,651 −3.04.0
Bareland to Open Forest12,554 −4.64.3
Bareland to Shrubland450,977 −6.38.1
Cropland to Bareland3683 12.24.7
Cropland to Dense Forest13,471 −26.414.6
Cropland to Grassland75,764 −4.76.3
Cropland to Open Forest3015 −14.511.5
Cropland to Shrubland68,429 −5.312.1
Dense Forest to Bareland1441 59.09.8
Dense Forest to Cropland164,363 31.015.7
Dense Forest to Grassland45,609 9.214.2
Dense Forest to Open Forest73,087 1.620.7
Dense Forest to Shrubland132,667 15.519.9
Grassland to Bareland240,603 3.74.3
Grassland to Cropland753,068 10.29.3
Grassland to Dense Forest37,950 −9.617.6
Grassland to Open Forest50,646 −3.810.5
Grassland to Shrubland1,228,990 1.07.1
Open Forest to Bareland4492 10.86.8
Open Forest to Cropland35,447 26.315.0
Open Forest to Dense Forest98,021 −3.834.6
Open Forest to Grassland24,458 5.713.8
Open Forest to Shrubland272,772 7.618.1
Shrubland to Bareland429,738 6.58.6
Shrubland to Cropland532,070 10.712.4
Shrubland to Dense Forest142,017 −19.529.7
Shrubland to Grassland1,507,730 −0.95.8
Shrubland to Open Forest227,208 −10.123.2
Table A2. Estimated Water-induced Mean soil loss rates per district within the Great Rift Valley region of Kenya.
Districts NamesArea
(104 ha)
Year 1990Year 2015Net Change (t/ha/y)Average Slope (%)
Erosion Rate (t/ha/y)Soil Loss (Mt/y)Erosion Rate (t/ha/y)Soil Loss (Mt/y)
Keiyo14.3814.542.124.773.610.2319.8
Marakwet15.8513.972.223.813.89.8425.1
Bomet14.2810.091416.202.36.1110.2
Kericho20.8320.054.226.065.46.0116.0
Nandi28.3618.615.324.116.85.5015.3
Buret13.9013.831.918.432.64.6015.1
Trans Nzoia24.427.371.811.572.84.2011.5
Nakuru74.827.485.411.648.44.1611.4
Uasin Gishu33.295.341.88.472.83.139.1
Narok150.235.778.78.62132.8513.2
Trans Mara27.846.311.89.102.52.799.5
Nyandarua32.688.442.811.203.72.7613.6
West Pokot90.0111.151013.84122.6920.7
Koibatek23.0910.492.413.1732.6815.8
Laikipia94.174.123.94.774.50.658.9
Baringo86.4511.239.511.439.70.2016.3
Kiambu3.2312.750.412.630.4−0.1215.9
Turkana499.83.4617.33.2119−0.2510.9
Kajiado216.833.728.13.437.4−0.299.9
Marsabit184.667.288.36.27−1.086.7
Samburu209.716.96145.7512−1.2116.5
Table A3. Estimated mean soil loss and mean slope per district of erosion-prone areas experiencing Land Use/Land Cover Changes (LULCC) between 1990 and 2015.
Districts NamesExtent of LULCC (%)Average Erosion Rate (t/ha/y)Average Rainfall (mm/y)Average Slope (%)
Keiyo0.3710.24119519.8
Marakwet0.449.83114325.1
Bomet0.556.16131510.2
Kericho0.496.01145816
Nandi0.75.49151415.3
Buret0.334.6166115.1
Trans Nzoia0.834.17117211.5
Nakuru2.034.1398811.4
Uasin Gishu1.03.1410559.1
Narok3.232.8592113.2
Nyandarua0.992.78114013.6
West Pokot1.62.7477220.7
Koibatek0.482.73105515.8
Trans Mara0.772.713659.5
Laikipia1.960.647468.9
Baringo0.790.1480116.3
Marsabit1.88−0.123446.7
Turkana12.06−0.2325810.9
Kajiado4.11−0.315749.9
Kiambu0.08−0.592315.9
Samburu3.52−1.2152816.5
Table A4. Distribution of estimated soil erosion rates under different soil types in the KGRV.
Dominant Soil TypeArea
(104 ha)
Extent (%)Year 1990Year 2015Net Change (t/ha/y)Average Slope (%)
Erosion Rate (t/ha/y)Soil Loss (Mt/y)Erosion Rate (t/ha/y)Soil Loss (Mt/y)
Andosols66.823.596.014.011.537.75.5212.75
Nitosols199.0310.79.4618.813.927.64.4411.87
Planosols21.171.137.311.59.912.02.68.26
Ferrasols132.627.134.886.46.899.12.017.92
Cambisols136.247.325.567.56.348.60.788.65
Lithosols576.7831.026.6638.47.2741.90.6111.52
Vertisols101.795.472.832.93.263.30.435.52
Luvisols29.221.575.121.45.481.60.367.92
Gleysols41.282.222.320.952.471.00.153.9
Solonchaks56.603.123.892.23.662.0−0.237.14
Fluvisols15.070.813.020.452.780.41−0.243.89
Regosols283.5815.256.9819.76.7119.0−0.2711.32
Xerosols123.396.634.625.73.023.7−1.68.29
Yermosols75.244.046.154.64.213.1−1.9413.08
Table A5. Estimated Water-induced Mean soil loss rates per Protected Areas within the Great Rift Valley region of Kenya.
Protected Area NamesArea
(104 ha)
Year 1990Year 2015Net Change (t/ha/y)Average Slope (%)
Erosion Rate (t/ha/y)Soil Loss(Mt/y)Erosion Rate (t/ha/y)Soil Loss (Mt/y)
Chemurokoi0.3912.910.0540.870.1627.9627.4
Kaisungor0.1122.470.0247.040.0524.5631.1
Sogotio0.3317.710.0640.700.1322.9929.9
Metkei0.179.420.0226.520.0517.145.6
Kipkabus (Elg-Marak)0.0617.770.0134.150.0216.3743.7
Kessop0.2539.430.1051.860.1312.4338.6
Eastern Mau6.595.940.3918.181.2012.2415.7
Kerrer0.3215.350.0527.350.091226.4
Kipkabus (Uasin/Gishu)0.707.160.0517.790.1210.6312.2
Bahati1.128.900.1019.320.2210.4215.1
Timboroa0.5314.170.0724.550.1310.3717.8
Kapchemutwa0.9228.550.2638.790.3610.2337.5
Lelan1.1021.650.2431.600.359.9437.1
Embobut2.0017.980.3627.760.569.7834.2
Mau Narok0.073.390.0012.990.019.623.4
Marmanet2.085.920.1215.410.329.4916.1
Kapolet0.138.910.0118.180.029.2626.3
South-western Mau8.324.560.3813.451.128.8816.5
Kaptagat1.188.390.1016.970.208.5713.4
Transmara3.775.510.2113.910.528.3926.4
Maji Mazuri0.805.430.0413.770.118.3315.6
Kiptaberr1.078.800.0916.870.188.0622.4
Londiani2.157.740.1715.000.327.2615.6
Taressia0.0414.180.0120.660.016.4810.6
Katimok0.1923.720.0530.170.066.4529.3
Kipkunurr1.5310.050.1516.400.256.3528.8
Southern Mau0.0113.130.0019.220.006.0912.6
Kakamega0.7020.780.1526.740.195.9615
Kilombe Hill0.3213.070.0419.010.065.9419.3
Ol-arabel0.997.820.0813.720.145.914
Molo0.0913.020.0118.780.025.75
North Nandi1.1312.000.1317.670.205.6711.6
Ol-pusimoru3.574.490.1610.140.365.6515.7
Mount Londiani2.225.390.1210.380.234.9818.7
Northern Tinderet2.946.450.1911.350.334.917.3
Kapsaret0.134.770.019.190.014.428.7
Tinderet3.407.130.2411.330.384.217.1
Chemorogok1.129.840.1113.870.154.0219.6
Ngong Hills0.338.860.0311.780.042.9211.3
Ol-bolossat0.363.240.016.030.022.797.1
South Nandi1.9911.150.2213.900.282.7514.4
Menengai0.5510.610.0613.280.072.6713.5
Leshau0.023.640.006.270.002.636.4
Kitalale0.205.040.017.620.012.577.3
Sekhendu0.065.430.007.990.012.557.5
Mount Elgon0.999.360.0911.680.122.3227.1
Kipipiri0.4312.860.0615.120.072.2632.3
Mukogodo2.9410.540.3112.690.372.1424.1
Uaso Narok0.124.820.016.960.012.148.2
Chepalungu0.502.250.014.360.022.115.6
Rumuruti0.622.950.025.030.032.086.8
Kapkanyar0.702.720.023.830.031.1120.2
Eburu0.828.090.079.170.071.0727.2
Lariak0.523.810.024.870.031.056.7
Sibiloi14.682.570.383.060.450.489.1
Kerio Valley0.491.270.011.450.010.185.7
Nakuru0.050.950.001.060.000.18.1
Nasolot0.7611.780.0911.780.09021.1
Perkerra Catchment0.5313.230.0713.220.07014.1
Masai Mara14.993.710.563.700.55−0.019
South Turkana10.455.140.545.110.53−0.0215.4
Lake Nakuru1.872.820.052.780.05−0.048
Longonot0.2810.430.0310.070.03−0.3617.2
Mount Nyiru3.836.440.256.030.23−0.4137.6
Maralai1.726.470.115.870.10−0.616.2
Mukobe0.087.620.016.990.01−0.6211.7
Samburu1.593.960.063.170.05−0.799.5
South Island0.8620.250.1719.080.16−1.169.7
Amboseli4.012.690.111.500.06−1.187
Hell’s Gate1.1913.630.1612.170.15−1.4518.6
Lake Bogoria0.8519.260.1617.100.14−2.1622.5
Loitokitok0.227.620.025.240.01−2.389.2
Kabarak0.1527.430.0424.580.04−2.8527.5
Kimojoch0.0844.330.0341.450.03−2.8738.8
Saimo0.1033.200.0329.460.03−3.7434.1
Namanga Hill1.0610.740.116.580.07−4.1532.6
Ndotos Range9.5112.421.186.980.66−5.4334.1
Matthews Range9.4110.701.015.230.49−5.4631.2
Central Island0.1118.060.029.900.01−8.1610.5

References

  1. Gomiero, T. Soil Degradation, Land Scarcity and Food Security: Reviewing a Complex Challenge. Sustainability 2016, 8, 281. [Google Scholar] [CrossRef] [Green Version]
  2. Chuenchum, P.; Xu, M.; Tang, W. Estimation of Soil Erosion and Sediment Yield in the Lancang–Mekong River Using the Modified Revised Universal Soil Loss Equation and GIS Techniques. Water 2020, 12, 135. [Google Scholar] [CrossRef] [Green Version]
  3. Blake, W.H.; Rabinovich, A.; Wynants, M.; Kelly, C.; Nasseri, M.; Ngondya, I.; Patrick, A.; Mtei, K.; Munishi, L.; Boeckx, P.; et al. Soil erosion in East Africa: An interdisciplinary approach to realising pastoral land management change. Environ. Res. Lett. 2018, 13, 124014. [Google Scholar] [CrossRef] [Green Version]
  4. Fenta, A.A.; Tsunekawa, A.; Haregeweyn, N.; Poesen, J.; Tsubo, M.; Borrelli, P.; Panagos, P.; Vanmaercke, M.; Broeckx, J.; Yasuda, H.; et al. Land susceptibility to water and wind erosion risks in the East Africa region. Sci. Total Environ. 2020, 703, 135016. [Google Scholar] [CrossRef] [PubMed]
  5. Nguru, P.M.; Rono, D.K. Combating Desertification in Kenya. In Combating Desertification in Asia, Africa and the Middle East; Heshmati, G.A., Squires, V., Eds.; Springer Science & Business: New York, NY, USA; London, UK, 2013; pp. 139–151. [Google Scholar] [CrossRef]
  6. Van Straaten, P. Rocks for Crops: Agrominerals of Sub-Saharan Africa; ICRAF: Nairobi, Kenya, 2002. [Google Scholar]
  7. Fenta, A.A.; Yasuda, H.; Shimizu, K.; Haregeweyn, N.; Kawai, T.; Sultan, D.; Ebabu, K.; Belay, A.S. Spatial distribution and temporal trends of rainfall and erosivity in the Eastern Africa region. Hydrol. Process. 2017, 31, 4555–4567. [Google Scholar] [CrossRef]
  8. Ameso, E.A.; Bukachi, S.A.; Olungah, C.O.; Haller, T.; Wandibba, S.; Nangendo, S. Pastrol Resilience among the Maasai Pastrolists of Laikipia County, Kenya. Land 2018, 7, 78. [Google Scholar] [CrossRef] [Green Version]
  9. Government of Kenya. Statistical Abstract. 2019. Available online: https://www.knbs.or.ke/?wpdmpro=statistical-abstract-2019 (accessed on 3 September 2020).
  10. Mulinge, W.; Gicheru, P.; Murithi, F.; Maingi, P.; Kihiu, E.; Kirui, O.K.; Mirzabaev, A. Economics of Land Degradation and Improvement in Kenya. In Economics of Land Degradation and Improvement—A Global Assessment for Sustainable Development; Nkonya, E., Mirzabaev, A., von Braun, J., Eds.; Springer International Publishing: Cham, Switzerland, 2016; pp. 471–498. [Google Scholar] [CrossRef] [Green Version]
  11. Ministry of Environment and Forestry. Land Degradation Assessment in Kenya-March. 2016. Available online: http://www.environment.go.ke/wp-content/uploads/2018/08/LADA-Land-Degradation-Assessment-in-Kenya-March-2016.pdf (accessed on 12 July 2020).
  12. Boitt, M.; Albright, O.; Kipkulei, H. Assessment of Soil Erosion and Climate Variability on Kerio Valley Basin, Kenya. J. Geosci. Environ. Prot. 2020, 8, 97–114. [Google Scholar] [CrossRef]
  13. Cohen, M.J.; Brown, M.T.; Shepherd, K.D. Estimating the environmental costs of soil erosion at multiple scales in Kenya using emergy synthesis. Agric. Ecosyst. Environ. 2006, 114, 249–269. [Google Scholar] [CrossRef]
  14. Angima, S.; Stott, D.; O’Neill, M.; Ong, C.K.; Weesies, G.A. Soil Erosion Prediction Using RUSLE for Central Kenya Highland Conditions. Agric. Ecosyst. Environ. 2003, 97, 295–308. [Google Scholar] [CrossRef]
  15. Gachene, C.K.K.; Mbuvi, J.P.; Jarvis, N.J.; Linner, H. Soil Erosion Effects on Soil Properties in a Highland Area of Central Kenya. Soil Sci. Soc. Am. J. 1997, 61, 559–564. [Google Scholar] [CrossRef] [Green Version]
  16. Vigani, M.; Dudu, H.; Ferrari, E.; Mainar, A. Estimation of Food Demand Parameters in Kenya A Quadratic Almost Ideal Demand System (QUAIDS) Approach; Publications Office of the European Union: Luxembourg, 2019. [Google Scholar] [CrossRef]
  17. Were, K.O.; Dick, Ø.B.; Singh, B.R. Remotely sensing the spatial and temporal land cover changes in Eastern Mau forest reserve and Lake Nakuru drainage basin, Kenya. Appl. Geogr. 2013, 41, 75–86. [Google Scholar] [CrossRef]
  18. Muriithi, F.K. Land use and land cover (LULC) changes in semi-arid sub-watersheds of Laikipia and Athi River basins, Kenya, as influenced by expanding intensive commercial horticulture. Remote Sens. Appl. Soc. Environ. 2016, 3, 73–88. [Google Scholar] [CrossRef]
  19. Muchena, F.N. Indicators for Sustainable Land Management in Kenya’s Context. GEF Land Degradation Focal Area Indicators; ETC-East Africa: Nairobi, Kenya, 2008. [Google Scholar]
  20. Dregne, H.E. Land Degradation in the Drylands. Arid Land Res. Manag. 2002, 16, 99–132. [Google Scholar] [CrossRef]
  21. Ministry of Agriculture Livestock Fisheries and Irrigation. Towards Sustainable Agricultral Transformation and Food Security in Kenya 2019–2029; Government Press: Nairobi, Kenya, 2019. Available online: http://www.kilimo.go.ke/wp-content/uploads/2019/05/ASTGS-Long-version.pdf (accessed on 3 September 2020).
  22. Hirons, L.; Turner, A. The Impact of Indian Ocean Mean-State Biases in Climate Models on the Representation of the East African Short Rains. J. Clim. 2018, 31, 6611–6631. [Google Scholar] [CrossRef]
  23. Obando, J.A.; Onywere, S.; Shisanya, C.; Ndubi, A.; Masiga, D.; Irura, Z.; Mariita, N.; Maragia, H. Impact of Short-Term Flooding on Livelihoods in the Kenya Rift Valley Lakes. In Geomorphology and Society, Advances in Geographical and Environmental Sciences; Meadows, M.E., Lin, J.-C., Eds.; Springer: Tokyo, Japan, 2016; pp. 193–215. [Google Scholar] [CrossRef]
  24. Mati, B.; Morgan, R.; Quinton, J.; Brewer, T.; Liniger, H. Assessment of erosion hazard with the USLE and GIS: A case study of the Upper Ewaso Ng’iro North basin of Kenya. Int. J. Appl. Earth Obs. Geoinf. 2000, 2, 78–86. [Google Scholar] [CrossRef]
  25. Luvai, A.; Obiero, J.P.; Omuto, C. Methods for Erosion Estimates in Assessment of Soil Degradation: A Review for Catchments in Kenya. Int. J. Eng. Res. 2020. [Google Scholar] [CrossRef]
  26. Avwunudiogba, A.; Franklin Hudson, P. A Review of Soil Erosion Models with Special Reference to the needs of Humid Tropical Mountainous Environments. Eur. J. Sustain. Dev. 2014, 3, 299. [Google Scholar] [CrossRef] [Green Version]
  27. Wischmeier, W.H.S.; Smith, D.D. Predicting Rainfall Erosion Losses—A Guide to Conservation Planning; US Department of Agriculture Science and Education Administration: Washington, DC, USA, 1978.
  28. Hategekimana, Y.; Allam, M.; Meng, Q.; Nie, Y.; Mohamed, E. Quantification of Soil Losses along the Coastal Protected Areas in Kenya. Land 2020, 9, 137. [Google Scholar] [CrossRef]
  29. Karamage, F.; Zhang, C.; Liu, T.; Maganda, A.; Isabwe, A. Soil Erosion Risk Assessment in Uganda. Forests 2017, 8, 52. [Google Scholar] [CrossRef]
  30. Phinzi, K.; Ngetar, N.S. The assessment of water-borne erosion at catchment level using GIS-based RUSLE and remote sensing: A review. Int. Soil Water Conserv. Res. 2019, 7, 27–46. [Google Scholar] [CrossRef]
  31. Kogo, B.K.; Kumar, L.; Koech, R. Impact of Land Use/Cover Changes on Soil Erosion in Western Kenya. Sustainability 2020, 12, 9740. [Google Scholar] [CrossRef]
  32. Defersha, M.B.; Melesse, A.M.; McClain, M.E. Watershed scale application of WEPP and EROSION 3D models for assessment of potential sediment source areas and runoff flux in the Mara River Basin, Kenya. CATENA 2012, 95, 63–72. [Google Scholar] [CrossRef]
  33. Mati, B.; Morgan, R.; Quinton, J. Soil erosion modelling with EUROSEM at Embori and Mukogodo catchments, Kenya. Earth Surf. Process. Landf. 2006, 31, 579–588. [Google Scholar] [CrossRef] [Green Version]
  34. Baker, T.J.; Miller, S.N. Using the Soil and Water Assessment Tool (SWAT) to assess land use impact on water resources in an East African watershed. J. Hydrol. 2013, 486, 100–111. [Google Scholar] [CrossRef]
  35. Hunink, J.E.; Niadas, I.A.; Antonaropoulos, P.; Droogers, P.; de Vente, J. Targeting of intervention areas to reduce reservoir sedimentation in the Tana catchment (Kenya) using SWAT. Hydrol. Sci. J. 2013, 58, 600–614. [Google Scholar] [CrossRef] [Green Version]
  36. Schürz, C.; Mehdi, B.; Kiesel, J.; Schulz, K.; Herrnegger, M. A systematic assessment of uncertainties in large scale soil loss estimation from different representations of USLE input factors—A case study for Kenya and Uganda. Hydrol. Earth Syst. Sci. Discuss. 2019, 2019, 1–35. [Google Scholar] [CrossRef]
  37. UNESCO. World Heritage List-Kenya Lake System in the Great Rift Valley. Available online: https://whc.unesco.org/en/list/1060 (accessed on 12 July 2020).
  38. Eshiamwata, G.W. Monitoring Habitat at Key Biodiversity Sites in Africa Using Remote Sensing: Land Cover Change at important Bird Areas in Eastern Africa; University of Nairobi: Nairobi, Kenya, 2012; Available online: http://erepository.uonbi.ac.ke/handle/11295/6777 (accessed on 7 June 2020).
  39. FAO. Digital Soil Map of the World. Available online: http://data.fao.org/maps/wms?styles=geonetwork_DSMW_14116_style (accessed on 3 September 2020).
  40. World Resources Institute. Kenya GIS Data-Annual Projected Water Balance by Subdrainage Area in Kenya, 2000 and 2010. In World Resources Institute; 2007; Available online: https://www.wri.org/resources/data-sets/kenya-gis-data#water (accessed on 3 September 2020).
  41. Nambajimana, J.d.D.; He, X.; Zhou, J.; Justine, M.F.; Li, J.; Khurram, D.; Mind’je, R.; Nsabimana, G. Land Use Change Impacts on Water Erosion in Rwanda. Sustainability 2019, 12, 50. [Google Scholar] [CrossRef] [Green Version]
  42. United States Geological Survey. U.S. Geological Survey Earthexplorer. Available online: http://earthexplorer.usgs.gov/ (accessed on 3 September 2020).
  43. Hengl, T.; Heuvelink, G.B.M.; Kempen, B.; Leenaars, J.G.B.; Walsh, M.G.; Shepherd, K.D.; Sila, A.; MacMillan, R.A.; Mendes de Jesus, J.; Tamene, L.; et al. Mapping Soil Properties of Africa at 250 m Resolution: Random Forests Significantly Improve Current Predictions. PLoS ONE 2015, 10, e0125814. [Google Scholar] [CrossRef]
  44. Funk, C.; Peterson, P.; Landsfeld, M.; Pedreros, D.; Verdin, J.; Shukla, S.; Husak, G.; Rowland, J.; Harrison, L.; Hoell, A.; et al. The climate hazards infrared precipitation with stations—A new environmental record for monitoring extremes. Sci. Data 2015, 2, 150066. [Google Scholar] [CrossRef] [Green Version]
  45. Renard, K.G.; Foster, G.R.; Weesies, G.; McCool, D.; Yoder, D. Predicting Soil Erosion by Water: A Guide to Conservation Planning with the Revised Universal Soil Loss Equation (Rusle); United States Department of Agriculture: Washington, DC, USA, 1997; Volume 703.
  46. Weldu Woldemariam, G.; Edo Harka, A. Effect of Land Use and Land Cover Change on Soil Erosion in Erer Sub-Basin, Northeast Wabi Shebelle Basin, Ethiopia. Land 2020, 9, 111. [Google Scholar] [CrossRef] [Green Version]
  47. Lo, A.; El-Swaify, S.A.; Dangler, E.W.; Shinshiro, L. Effectiveness of El30 as An Erosivity Index in Hawaii; E1-Swaify, S.A., Moldenhauer, W.C., Lo, A., Eds.; Soil Conservation Society of America: Ankeny, IA, USA, 1985. [Google Scholar]
  48. Woldemariam, G.W.; Iguala, A.D.; Tekalign, S.; Reddy, R.U. Spatial Modeling of Soil Erosion Risk and Its Implication for Conservation Planning: The Case of the Gobele Watershed, East Hararghe Zone, Ethiopia. Land 2018, 7, 25. [Google Scholar] [CrossRef] [Green Version]
  49. Ayugi, B.; Tan, G.; Ullah, W.; Boiyo, R.; Ongoma, V. Inter-comparison of remotely sensed precipitation datasets over Kenya during 1998–2016. Atmos. Res. 2019, 225, 96–109. [Google Scholar] [CrossRef]
  50. Kimaru, A.N.; Gathenya, J.M.; Cheruiyot, C.K. The Temporal Variability of Rainfall and Streamflow into Lake Nakuru, Kenya, Assessed Using SWAT and Hydrometeorological Indices. Hydrology 2019, 6, 88. [Google Scholar] [CrossRef] [Green Version]
  51. Dinku, T.; Funk, C.; Peterson, P.; Maidment, R.; Tadesse, T.; Gadain, H.; Ceccato, P. Validation of the CHIRPS Satellite Rainfall Estimates over Eastern of Africa: Validation of the CHIRPS Satellite Rainfall Estimates. Q. J. R. Meteorol. Soc. 2018, 144. [Google Scholar] [CrossRef] [Green Version]
  52. Sujatha, E.R.; Sridhar, V. Spatial Prediction of Erosion Risk of a Small Mountainous Watershed Using RUSLE: A Case-Study of the Palar Sub-Watershed in Kodaikanal, South India. Water 2018, 10, 1608. [Google Scholar] [CrossRef] [Green Version]
  53. Williams, J.R. The EPIC Model. In Computer Models of Watershed Hydrology; Water Resources Publications: Highlands Ranch, CO, USA, 1995. [Google Scholar]
  54. Morgan, R.P.C.; Morgan, D.D.V.; Finney, H.J. A predictive model for the assessment of soil erosion risk. J. Agric. Eng. Res. 1984, 30, 245–253. [Google Scholar] [CrossRef]
  55. Desmet, P.J.J.; Govers, G. A GIS procedure for automatically calculating the USLE LS factor on topographically complex landscape units. J. Soil Water Conserv. 1996, 5, 427–433. [Google Scholar]
  56. McCool, D.K.; Brown, L.C.; Foster, G.R.; Mutchler, C.K.; Meyer, L.D. Revised slope steepness factor for the universal soil loss equation. Trans. ASAE 1987, 30, 1387–1396. [Google Scholar] [CrossRef]
  57. Nyssen, J.; Simegn, G.; Taha, N. An upland farming system under transformation: Proximate causes of land use change in Bela-Welleh catchment (Wag, Northern Ethiopian Highlands). Soil Tillage Res. 2009, 103, 231–238. [Google Scholar] [CrossRef]
  58. Hurni, H. Erosion-Productivity-Conservation Systems in Ethiopia. In Proceedings of the IV International Conference on Soil Conservation on Soil Conservation, Maracey, Venezuela, 3–9 November 1985; pp. 654–674. [Google Scholar]
  59. Yang, D.; Kanae, S.; Oki, T.; Koike, T.; Musiake, K.; Yang, D.W.; Shinjiro, K.; Taikan, O.; Toshio, K.; Katumi, M. Global potential soil erosion with reference to land use and climate changes. Hydrological Process. Hydrol. Process. 2003, 17, 2913–2928. [Google Scholar] [CrossRef]
  60. Girma, R.; Gebre, E. Spatial modeling of erosion hotspots using GIS-RUSLE interface in Omo-Gibe river basin, Southern Ethiopia: Implication for soil and water conservation planning. Environ. Syst. Res. 2020, 9, 19. [Google Scholar] [CrossRef]
  61. Bewket, W.; Teferi, E. Assessment of soil erosion hazard and prioritization for treatment at the watershed level: Case study in the chemoga watershed, blue nile basin, Ethiopia. Land Degrad. Dev. 2009, 20, 609–622. [Google Scholar] [CrossRef]
  62. Gelagay, H.S.; Minale, A.S. Soil loss estimation using GIS and Remote sensing techniques: A case of Koga watershed, Northwestern Ethiopia. Int. Soil Water Conserv. Res. 2016, 4, 126–136. [Google Scholar] [CrossRef] [Green Version]
  63. Haregeweyn, N.; Tsunekawa, A.; Poesen, J.; Tsubo, M.; Meshesha, D.T.; Fenta, A.A.; Nyssen, J.; Adgo, E. Comprehensive assessment of soil erosion risk for better land use planning in river basins: Case study of the Upper Blue Nile River. Sci. Total Environ. 2017, 574, 95–108. [Google Scholar] [CrossRef] [Green Version]
  64. Taye, G.; Poesen, J.; Vanmaercke, M.; Wesemael, B.V.; Martens, L.; Teka, D.; Nyssen, J.; Deckers, J.; Vanacker, V.; Haregeweyn, N.; et al. Evolution of the effectiveness of stone bunds and trenches in reducing runoff and soil loss in the semi-arid Ethiopian highlands. Z. Geomorphol. 2015, 59, 477–493. [Google Scholar] [CrossRef]
  65. Shin, G. The Analysis of Soil Erosion Analysis in Watershed Using GIS; Gang-Won National University: Chuncheon, Korea, 1999. [Google Scholar]
  66. UNEP-WCMC. Protected Areas Delimited by the United Nations Environment Programme (UNEP) and the World Conservation Monitoring Centre (WCMC). Available online: https://www.protectedplanet.net/ (accessed on 3 September 2020).
  67. Koirala, P.; Thakuri, S.; Joshi, S.; Chauhan, R. Estimation of Soil Erosion in Nepal Using a RUSLE Modeling and Geospatial Tool. Geosciences 2019, 9, 147. [Google Scholar] [CrossRef] [Green Version]
  68. GoK. National Water Master Plan 2030, Volume I—Executive Summary. 2013. Available online: https://wasreb.go.ke/downloads/National%20Water%20Master%20Plan%202030%20Exec.%20Summary%20Vol.%201%20Main%201.pdf (accessed on 12 July 2020).
  69. FAO. World Reference Base for Soil Resources 2014. In International Soil Classification System for Naming Soils and Creating Legends for Soil Maps; FAO: Rome, Italy, 2015; Volume 106. [Google Scholar]
  70. Stocking, M. Rates of erosion and sediment yield in the African environment. In Proceedings of the Challenges in African Hydrology and Water Resources, Harare, Zimbabwe, 11–16 July 1984; pp. 285–295. [Google Scholar]
  71. Tamene, L.; Adimassu, Z.; Aynekulu, E.; Yaekob, T. Estimating landscape susceptibility to soil erosion using a GIS-based approach in Northern Ethiopia. Int. Soil Water Conserv. Res. 2017, 5, 221–230. [Google Scholar] [CrossRef]
  72. Wambui, M.; Opere, A.; Githaiga, J.; Karanja, F. Assessing the impacts of climate variability and climate change on biodiversity in Lake Nakuru, Kenya. Bonorowo Wetl. 2018, 8, 13–24. [Google Scholar] [CrossRef]
  73. Olago, D.; Opere, A.; Barongo, J. Holocene palaeohydrology, groundwater and climate change in the lake basins of the Central Kenya Rift. Hydrol. Sci. J. J. Des. Sci. Hydrol. 2009, 54. [Google Scholar] [CrossRef]
  74. Mubea, K.; Menz, G. Monitoring Land-Use Change in Nakuru (Kenya) Using Multi-Sensor Satellite Data. Adv. Remote. Sens. 2012, 1, 74–84. [Google Scholar] [CrossRef] [Green Version]
  75. Mubea, K.; Goetzke, R.; Menz, G. Simulating Urban Growth in Nakuru (Kenya) Using Java-Based Modelling Platform XULU. In Proceedings of the 2013 European Modelling Symposium, Manchester, UK, 20–22 November 2013; pp. 103–108. [Google Scholar]
  76. Harper, D.M.; Mavuti, K.M. Lake Naivasha, Kenya: Ecohydrology to guide the management of a tropical protected area. Ecohydrol. Hydrobiol. 2004, 4, 287–305. [Google Scholar]
  77. Willy, D.K.; Zhunusova, E.; Holm-Müller, K. Estimating the joint effect of multiple soil conservation practices: A case study of smallholder farmers in the Lake Naivasha basin, Kenya. Land Use Policy 2014, 39, 177–187. [Google Scholar] [CrossRef]
  78. Eric, O.O.; Onyango, J.; Obudho, P.A. Lake Baringo; Experince and Lessons Learnt Brief; University of Nairobi: Nairobi, Kenya, 2006. [Google Scholar]
  79. Aneseyee, A.B.; Elias, E.; Soromessa, T.; Feyisa, G.L. Land use/land cover change effect on soil erosion and sediment delivery in the Winike watershed, Omo Gibe Basin, Ethiopia. Sci. Total Environ. 2020, 728, 138776. [Google Scholar] [CrossRef] [PubMed]
  80. Gizaw, T.; Yalemtsehay, D.; Kalkidan, F. Soil Erosion Risk Assessment Using GIS Based USLE Model for Soil and Water Conservation Planning in Somodo Watershed, South West Ethiopia. Int. J. Environ. Agric. Res. 2018, 4, 35–43. [Google Scholar]
  81. Ligonja, P.; Shrestha, R. Soil Erosion Assessment in Kondoa Eroded Area in Tanzania using Universal Soil Loss Equation, Geographic Information Systems and Socioeconomic Approach. Land Degrad. Dev. 2013, 26. [Google Scholar] [CrossRef]
  82. Widgren, M.S. Islands of Intensive Agriculture in Eastern Africa; Ohio University Press: Athens, OH, USA, 2004. [Google Scholar]
  83. Sutherland, R.A.; Bryan, K.B. Runoff and erosion from a small semiarid catchment, Baringo district, Kenya. Appl. Geogr. 1990, 10, 91–109. [Google Scholar] [CrossRef]
  84. Kiepe, P. Cover and Barrier Effect of Cassia Siamea Hedgerows on Soil Conservation in Semi-Arid Kenya. Soil Technol. 1996, 9, 161–171. [Google Scholar] [CrossRef]
  85. Tiffen, M.; Mortimore, M.; Gichuki, F. More People Less Erosion; Environmental Recovery in Kenya; ACTS Press: Nairobi, Kenya, 1994. [Google Scholar]
  86. Ruto, A.; Gachene, C.; Gicheru, P.; Mburu, D.; Khalif, Z. Crop yields along the toposequence of terraced andosols in Narok, Kenya. Trop. Subtrop. Agroecosyst. 2017, 20, 35–47. [Google Scholar]
  87. Zhunusova, E.; Kyalo Willy, D.; Holm-Müller, K. An Analysis of Returns to Intergrated Soil Conservation Practices in the Lake Naivasha Basin, Kenya. In Proceedings of the 4th International Conference of the African Association of Agricultural Economists, ICAAAE, Hammamet, Tunisia, 22–25 September 2013. [Google Scholar]
  88. Baumhardt, R.L.B.-C. Soil: Conservation Practices. In Encyclopedia of Agriculture and Food Systems; Alfen, N.V., Ed.; Elsevier: San Diego, CA, USA, 2014; Volume 5, pp. 153–165. [Google Scholar]
  89. Thapa, P. Spatial estimation of soil erosion using RUSLE modeling: A case study of Dolakha district, Nepal. Environ. Syst. Res. 2020, 9, 15. [Google Scholar] [CrossRef]
  90. Le Roux, J.J.; Morgenthal, T.L.; Malherbe, J.; Pretorius, D.J.; Sumner, P.D. Water erosion prediction at a national scale for South Africa. Water SA 2008, 34, 305–314. [Google Scholar] [CrossRef] [Green Version]
  91. Van der Knijff, J.J.R.; Montanarella, L. Soil Erosion Risk Assessment in Italy; European Soil Bureau, Joint Research Centre of the European Commission: Brussels, Belgium, 2000. [Google Scholar]
  92. Durigon, V.L.; Carvalho, D.F.; Antunes, M.A.H.; Oliveira, P.T.S.; Fernandes, M.M. NDVI time series for monitoring RUSLE cover management factor in a tropical watershed. Int. J. Remote Sens. 2014, 35, 441–453. [Google Scholar] [CrossRef]
  93. Xiong, M.-Q.; Sun, R.; Chen, L.-D. Global analysis of support practices in USLE-based soil erosion modeling. Prog. Phys. Geogr. Earth Environ. 2019, 43. [Google Scholar] [CrossRef]
  94. Wang, R.; Zhang, S.; Yang, J.; Pu, L.; Yang, C.; Yu, L.; Chang, L.; Bu, K. Intergrated Use of GCM, RS, and GIS for the Assessment of Hillslope and Gully Erosion in the Mushi River Sub-Catchment, Northeast China. Sustainability 2016, 8, 317. [Google Scholar] [CrossRef]
  95. Molnár, D.K.; Julien, P.Y. Estimation of upland erosion using GIS. Comput. Geosci. 1998, 24, 183–192. [Google Scholar] [CrossRef]
Figure 1. Map of the study area: (a) administrative districts and Agro-Ecological Zones (AEZ) [16,21] within the Great Rift Valley region of Kenya and (b) the location of Great Rift Valley region in Kenya (c) location of Kenya in the Africa continent.
Sustainability 13 00844 g001
Figure 2. Landsat time-series images on selected areas in the Kenya GRV region: (a,b) indicating rising water levels in Lake Baringo between 30th May, 2013 and 1st May, 2020 respectively; (c,d) indicating large-scale deforestation in the Mau Forest Complex between 1st February, 2002 and 16th February, 2016 respectively.
Sustainability 13 00844 g002
Figure 3. Average monthly rainfall (mm) for the Kenya Great Valley Region.
Sustainability 13 00844 g003
Figure 4. Maps of the Kenya Great Rift Valley (KGRV) region: (a) Landform types (b) Dominant Soil types region in Kenya (c) Lithological map (d) Major river basins.
Sustainability 13 00844 g004
Figure 5. Land use/land cover distribution maps for the Kenya Great Rift Valley Region: (a) 1990 (b) 2015.
Sustainability 13 00844 g005
Figure 6. The methodological framework for estimating water-induced soil erosion rates using RUSLE model in the Great Rift Valley region of Kenya. LCLU: Land Use and Land Cover, DRSRS: Department of Resource Surveys and Remote Sensing, CHIRPS: Climate Hazards Group InfraRed Precipitation with Station data, SRTM: Shuttle Radar Topography Mission, AfSIS: Africa Soil Information Service.
Sustainability 13 00844 g006
Figure 7. The Revised Universal Soil Loss Equation (RUSLE) factor maps of the KGRV: (a) rainfall erosivity factor, 1990 (supplementary materials); (b) cover management factor, 1990 (supplementary materials); (c) rainfall erosivity factor, 2015 (supplementary materials); and (d) cover management factor, 2015 (supplementary materials).
Sustainability 13 00844 g007
Figure 8. The Revised Universal Soil Loss Equation (RUSLE) factor and results maps of the KGRV: (a) soil erodibility factor (supplementary materials); (b) slope length and slope steepness factor (supplementary materials); (c) spatial distribution of man annual soil loss in 1990 (supplementary materials); and (d) spatial distribution of man annual soil loss in 1990 (supplementary materials).
Sustainability 13 00844 g008
Figure 9. The estimated mean soil erosion rates for croplands (21,864.2 Km2) within the central and southern regionsof the KGRV under different conservation practices in 2015 period: (a) baseline scenario; (b) terracing; (c) strip-cropping; and (d) contouring.
Sustainability 13 00844 g009
Figure 10. Soil conservation practices in the Eastern Rift Valley (ERV) region: (a) an archived aerial image (1960s) showing abandoned stone bunds and terraces of the semi-arid, historical agricultural landscape on the foot of the ERV escarpment at Engaruka, Tanzania; (b) Google Earth image taken on 26 July 2019 depicting soil conservation measures in Narok County, Kenya GRV.
Sustainability 13 00844 g010
Figure 11. Google Earth images showing spatial occurrence of water erosion in the Kenya GRV region: (a) image taken 15th May, 2017 showing exposed soil areas in Marigat District within the Lake Baringo basin; (b) image taken 15th May 2017 indicating poor soil conservation measures in Lorwak in Baringo County; (c,d) a time series images taken 9t October 2017 and 18th December 2017 respectively showing water erosion severity on a bare area in Narok County during the short rain period (October–December, 2017).
Sustainability 13 00844 g011
Table 1. The key datasets used for the Revised Universal Soil Loss Equation (RUSLE) model in the KGRV.
VariablesDatasetsData Source
TerrainDEMSRTM GL1 version (30 m) [42]
http://earthexplorer.usgs.gov/ (NASA)
SoilSoil PropertiesAfrica Soil Information Service (AfSIS) (250 m) [43]
https://files.isric.org/public/afsis250m/ (ISRIC-WSI)
LandLULC MapLand Use Land Cover (LULC) Maps of 1990 and 2015 (30 m)
Department of Resource Surveys and Remote Sensing (DRSRS), MoE&F(K)
ClimateRainfall MapCHIRP Global Rainfall Data (5 arcsec) [44] between 1981 to 2015 periods
ftp://ftp.chg.ucsb.edu/pub/org/chg/products/ (USGS-EROS)
DEM—Digital Elevation Model; SRTM GL1—Shuttle Radar Topography Mission Global 1 arc second; NASA—National Aeronautics and Space Administration, US; AfSIS—Africa Soil Information Service; ISRIC-WSI—International Soil Reference and Information Centre, World Soil Information; MoE&F(K)—Ministry of Environment and Forestry (Kenya); CHIRPS—Climate Hazards Group InfraRed Precipitation with Station data; USGS-EROS—United States Geological Survey, Earth Resource Observation Center.
Table 2. Adopted C values for different land use patterns (after past literatures in East Africa (EA)).
Land UseC FactorSources
Dense Forest0.001[58,59]
Open Forest0.01[58,59,60]
Shrubland0.08[36,61]
Grassland0.05[58,60,62]
Cropland0.15[58,60,61,63]
Bareland0.40[59,63]
Table 3. P factor estimates for the common erosion control practices focusing on slope (%) [65].
Slope (%)Conservation Support Practices (P Factor)
ContouringStrip CroppingTerracing
0.0–7.00.550.270.10
7.0–11.30.600.300.12
11.3–17.60.800.400.16
17.6–26.80.900.450.18
>26.81.000.500.20
Table 4. The erosion risk classes and their corresponding erosion rate net changes between the 1990 and 2015 periods.
Erosion Risk ClassErosion Rate Class
(t/ha/y)
Year 1990Year 2015Net Change (t/ha/y)
Area
(104 ha)
Extent%Erosion Rate (t/ha/y)Area
(104 ha)
Extent%Erosion Rate (t/ha/y)
Very Low0–1555.5729.880.45569.6230.670.44−0.01
Low1–10992.6553.43.42937.3350.373.490.07
Medium10–20162.508.7514.19169.069.0914.20.01
High medium20–40107.835.827.79118.386.4127.980.19
High40–8035.641.9152.2854.312.9253.681.40
Very High80–1002.580.1388.415.610.388.570.16
Extremely
High
>1002.070.13284.414.520.24168.85−79.56
Table 5. Estimated mean erosion rates per LULCC (Land use/land cover change) category (1990–2015) for Dense Forest, Open Forest, Shrubland, Grassland, Cropland and Bareland.
LULC TypesDense ForestOpen ForestShrub
Land
Grass
Land
Crop
Land
Bare
Land
Erosion Rate
2015
Dense Forest-1.615.59.231.059.01.2
Open Forest−3.8-7.65.726.310.82.9
Shrubland−19.5−10.1-−0.910.76.57.1
Grassland−9.6−3.81.0-10.23.72.0
Cropland−26.4−14.5−5.3−4.7-12.220.6
Bareland−23.6−4.6−6.3−3.0−11.2-6.3
Erosion Rate 19901.54.07.23.515.86.4-
Net Change (1990–2015)−0.3−1.1−0.1−1.54.8−0.10.9
Table 6. The distribution of estimated soil erosion rates per different severity classes.
Erosion Class
(t/ha/y)
Severity ClassYear 1990Year 2015Net
Change
(t/ha/y)
Priority
Level
Area
(104 ha)
Extent
(%)
Erosion Rate
(t/ha/y)
Area
(104 ha)
Extent
(%)
Erosion Rate
(t/ha/y)
0–5Slight1333.0171.731.61290.70 69.461.54−0.066th
5–10Moderate215.2111.577.07 216.25 11.637.110.045th
10–20High162.50 8.7414.19 169.06 9.0914.20.014th
20–40Very High107.835.827.79 118.38 6.3627.980.193rd
40–80Severe35.641.9152.28 54.312.9253.681.402nd
>80Very Severe4.650.25175.67 10.14 0.54124.39−51.281st
Table 7. The distribution of estimated soil erosion rates by slope.
Slope
(%)
Area
(104 ha)
Extent %Year 1990Year 2015Net Change (t/ha/y)Average Rainfall (mm/y)
Erosion Rate (t/ha/y)Soil Loss
(Mt/y)
Erosion Rate (t/ha/y)Soil Loss (Mt/y)
0–71142.27 61.451.7620.11.8521.10.09522
7–11.3238.24 12.815.7513.76.5915.70.84724
11.3–17.6163.36 8.7810.2316.712.4820.42.25807
17.6–26.8128.00 6.8814.9919.218.5323.73.54809
>26.8186.97 10.0824.9546.627.5451.42.59756
Table 8. The distribution of estimated soil erosion rates by elevation.
Elevation (m.a.s.l) Area
(104 ha)
Extent %Year 1990Year 2015Net Change (t/ha/y)Average Rainfall (mm/y)
Erosion Rate (t/ha/y) Soil Loss (Mt/y)Erosion Rate (t/ha/y)Soil Loss (Mt/y)
<500137.99 7.423.424.72.323.2−1.1298
500–1000654.75 35.223.8525.23.6323.7−0.22313
1000–1500371.19 19.967.0226.16.6624.7−0.36612
1500–2000425.87 22.938.0534.39.1438.91.09900
>2000269.05 14.479.6726.015.5441.85.871128
Table 9. The estimated soil erosion rates and the corresponding net changes in the major river basins of the KGRV.
Sub-Basin NameArea
(104 ha)
Year 1990Year 2015Net Change (t/ha/y)Average Slope (%)
Erosion Rate (t/ha/y)Soil Loss (Mt/y)Erosion Rate (t/ha/y)Soil Loss (Mt/y)
Lake Victoria263.109.4224.713.7036.04.2812.6
Lake Nakuru23.206.741.510.932.54.1912.0
Ewaso Ngiro South-Narok88.225.945.29.218.13.2713.4
Lake Naivasha32.398.702.810.803.52.1013.5
Lake Bogoria-Baringo77.4010.137.812.119.31.9814.6
Turkwel River203.465.9312.16.7413.70.8114.1
Kerio Valley174.427.0512.37.7513.50.7013.5
Suguta130.628.1010.68.1410.60.0416.3
Lotikipi Plains202.192.555.12.454.9−0.1011.1
Ewaso Ngiro South-Kajiado82.766.035.05.894.9−0.1411.9
Athi River137.063.004.12.693.6−0.319.40
Lake Turkana188.405.9711.25.3710.1−0.6010.9
Ewaso Ngiro255.605.09134.3711.1−0.7212.9
Table 10. The estimated soil erosion rates per landforms categories in the Great Rift Valley region of Kenya.
Landform
Types
Area
(104 ha)
Extent
(%)
Year 1990Year 2015Net
Change
(t/ha/y)
Average
Slope (%)
Erosion Rate
(t/ha/y)
Soil
Loss
(Mt/y)
Erosion Rate
(t/ha/y)
Soil Loss
(Mt/y)
Mountains201.9810.8610.5721.3 14.91 30.1 4.3419.35
Escarpment15.130.8128.094.2 30.89 4.6 2.832.86
Plateaus342.7018.436.9523.8 8.47 29.0 1.529.67
Mountain Foot ridges241.1612.9712.5530.2 13.62 32.8 1.0721.19
Foot Slope147.567.934.416.5 5.25 7.7 0.847.03
Plain564.8230.382.413.5 2.34 13.2 −0.064.98
Complex Landforms93.725.16.466.0 6.39 5.9 −0.079.11
Alluvial Plain125.046.721.351.6 1.16 1.4 −0.193.13
Valley21.461.156.011.2 5.35 1.1 −0.668.24
Volcanic Shield/Craters26.561.429.342.4 8.66 2.3 −0.6817.29
Depression78.694.236.174.8 4.74 3.7 −1.435.21
Table 11. Sensitivity analysis of parameters used in the KGRV RUSLE model.
DescriptionMinimum Erosion Rate (t ha−1y−1)Maximum Erosion Rate (t ha−1y−1)Average Erosion Rate (t ha−1y−1)Standard Deviation
Removal of R0142.780.0100.049
Removal of K1.888,438,8271127.434034.52
Removal of LS1.2438.2311.254.35
Removal of C0.19545,818.8893.19295.96
Table 12. Previous studies in and around the Great Rift Valley region of Kenya.
StudiesCase StudyMean Erosion Rates
(t ha−1 y−1)
Method
Fenta et al. [4]Kenya & All croplands6.95 and 26.0RUSLE
Haregeweyn et al. [63]Cultivated lands, Upper Blue Nile28.8RUSLE
Kogo et al. [31]Lake Victoria Basin, Western Kenya7.5–12.3RUSLE
Defersha et al. [32]Bush land, Mara River Basin7WEPP & EROSION 3D
Aneseyee et al. [79]Omo-Gibe Basin (ERV)17.65RUSLE
Hategekimana et al. [28]Kenyan Coast10–27.9RUSLE
Ligonja and Shrestha [81]Kondoa, Tanzania (ERV)15.7USLE
Sutherland and Bryan [83]Lake Baringo sub-basin16–96Plot study
Mati et al. [24]Upper EwasoNg’irosub-basin0–51.3Plot study
Kiepe [84]Machakos, Kenya16–36Plot study
Tiffen et al. [85]Athi basin area15.0Plot study
Table 13. The mean C factor values for different land uses in KGRV and their corresponding soil loss rates for 2015.
LULCMean C Factor Value (Using Durigton Equation with MODIS NDVI Data)Mean Erosion Rate (2015) (t ha−1 y−1)
Dense Forest0.1652.9
Open Forest0.2240.5
Shrubland0.3022.2
Grassland0.339.8
Cropland0.2126.9
Bareland0.426.59
Overall0.3219.0
Publisher’s Note: MDPI stays neutral with regard to jurisdictional claims in published maps and institutional affiliations.

