Abstract
Wind energy is an abundant renewable energy resource that has been extensively used worldwide in recent years. The present work proposes a new Multi-Objective Optimization (MOO) based genetic algorithm (GA) model for a wind energy system. The proposed algorithm consists of non-dominated sorting which focuses to maximize the power extraction of the wind turbine, minimize the cost of generating energy, and the lifetime of the battery. Additionally, the performance characteristics of the wind turbine and battery energy storage system (BESS) are analyzed specifically torque, current, voltage, state of charge (SOC), and internal resistance. The complete analysis is carried out in the MATLAB/Simulink platform. The simulated results are compared with existing optimization techniques such as single-objective, multi-objective, and non-dominating sorting GA II (Genetic Algorithm-II). From the observed results, the non-dominated sorting genetic algorithm (NSGA III) optimization algorithm offers superior performance notably higher turbine power output with higher torque rate, lower speed variation, reduced energy cost, and lesser degradation rate of the battery. This result attested to the fact that the proposed optimization tool can extract a higher rate of power from a self-excited induction generator (SEIG) when compared with a conventional optimization tool.
1. Introduction
The global economy has a direct impact on energy which acts as a prime driving force [1]. However, fossil fuel-based generation from coal and oils threatens the climatic conditions which increase carbon emission significantly [2]. Renewable energy (RE) is an important alternative source to reduce the usage of fossil fuels and the design of renewable energy-based system depend on numerous factors in order to ensure their competitiveness and importance. Renewables such as wind, solar, biomass, and hydropower play an important role to replace the conventional system [3].
There had always been a consistent push from the state government as well as the central government in many developing countries, for instance India, to initiate attractive Renewable Energy policies [4,5,6]. The specific renewable energy has been advanced based on the technologies for the electricity generation [7]. By taking these effective steps, the country can become rich in renewable energy production and can pave the way for the Sustainable Development Goal 7 attainment [8]. In recent times, the wind energy system (WES) has become the most important renewable energy resource (RES) conversion system and it is expected to rise more than 1000 GW by the year 2030 [9]. It has gained its importance as one of the most important renewable energy sources by being an eco-friendly energy resource [10,11]. There has been more competition for wind energy in the energy market and many methods are implemented by researchers to improve the reliability, maintenance, and increase in investment to develop renewable energy system utilization based on the potential of wind energy [12,13]. It has undergone many modernization processes to ensure efficient operation [14,15]. Technically, many researchers are making efforts to improve the system to the maximum level. Many problems are also rectified related to the aerodynamic optimization of a wind turbine, the power curve at different speeds, the position of a wind turbine in the wind farm, and the blade shape of the wind turbine [16,17,18]. The important aspect is to maximize power extraction from the available resources. To justify the maximum power extraction, the wind speed analysis to be considered through modelling [19]. Further, storage integration using a battery energy management system (BESS) is currently a significant topic in energy systems study, predominantly due to the need for high RE capacities [20]. Considering these inferences, the following subsection describes the literature review on WES, research gaps and motivation, and contributions to the work.
1.1. Literature Review on Optimization Algorithm for WES
Over the past decade, many optimization techniques were introduced to solve the issues in renewable energy sources particularly solar and wind energy systems. The recent progress of the existing WES optimization algorithms is tabulated in Table 1.

Table 1.
Existing survey report relating various optimization techniques.
1.2. Research Gaps and Motivation
Consolidating all the advantages and drawbacks from the literature reports, there is a need to adopt a powerful optimization technique to enhance the RES system further by focusing on both technical and economic concerns. As the combinations of the multi-scenario-multi-objective strategy were not demonstrated by the authors greatly. Further, the existing optimization algorithm had various concerns notably convergence complications while adopting multi-scenario-multi-objective problems. Moreover, energy cost and battery performance were not discussed extensively. It is observed that the adaptation of the NSGA II algorithm for RES application was described extensively by many researchers [41] to optimize the sizing of multi-source renewable energy systems. However, the effectiveness of the NGSA-III algorithm for RES has not been demonstrated by researchers particularly for optimization of the wind energy system in terms of technical and economic concerns. Therefore, this work focuses to propose an effective multi-objective NSGA III optimization method to choose the best subset of features in the system to achieve flexibility in the wind energy [42]. The major advantages of the NSGA III algorithm over existing multi-objective algorithms are as follows [43];
- It uses the information from a set of supplied reference points and niche technology to select the new parent population.
- It improves the diversity of the population greatly and shows the ability to solve multi-objective problems.
- It uses a fixed rate for mutation operators.
- The adaptive mutation operators of the algorithm can deal with big data optimization problems effectively.
Considering these advantages, the NSGA III-based multi-objective optimization of the energy systems is important for finding the potential variables for enhancing system performance. It forms a suitable method for wind energy systems compare to existing optimization for choosing two or more objectives simultaneously [44]. Various generators for wind turbines can be installed such as PMSG (Permanent Magnet Synchronous Generator), DFIG (Doubly Fed Induction Generator), and self-excited induction generator (SEIG). PMSG has high oscillations in DC-link voltage when connected to the grid through wind turbine [45]. DFIG has more power loss due to the presence of gear box that leads to low efficiency [46]. A Self-Excited Induction Generator (SEIG) is considered in this work for the wind turbine which has a high torque, high efficiency, less oscillations in a DC-link voltage. In a nutshell, this work focuses to demonstrate the effectiveness of the NSGA-III optimization technique in the wind energy system with SEIG wind turbines.
1.3. Objectives of the Work
Based on the available research gaps from the existing literature report, this work focuses on the following objectives using the NSGA III algorithm;
- To check the effectiveness of the NSGA III algorithm for the optimization approach in WES.
- To evaluate the higher rate of electrical power from SEIG.
- To reduce the cost of energy (COE) from WES.
- To analyze the SEIG parameters such as current, voltage, torque, and rotor speed.
- To study the degradation rate of the battery against operating hours.
- To study the internal resistance characteristics of the battery during the charging and discharging process.
The rest of this research article is organized as follows. Section 2 describes the wind energy systems. Section 3 describes the proposed methodology which includes the algorithm of NSGA-III and SEIG modelling. The effectiveness of the proposed methodology and comparative study with existing optimization techniques is demonstrated in Section 4. Lastly, Section 5 concludes the work by highlighting the obtained results.
2. Wind Energy System
The effective operation of a wind energy system is tested by implementing the existing algorithm and proposed algorithm in this work. The wind energy system operation is shown in Figure 1. It consists of wind turbines, a battery energy storage system (BESS), DC/DC converters, DC bus, DC/AC converters, and loads. The wind turbine comprises of self-excited induction generator (SEIG) with a small scale rated connected in parallel and the generated energy is stored in the battery energy storage system (BESS). A DC/DC converter is an electronic circuit that converts a source direct current (DC) from one voltage magnitude to another. The DC bus integrates the various sources and maintains the specified voltage constantly. The load consumes the energy in terms of AC supply and therefore DC/AC converters are adapted for DC to AC conversion. A bi-directional converter also plays a major role to achieve the maximum power in the wind turbine RES [47]. The efficiency of the wind turbine is considered 20% with a maximum and minimum wind speed of 25 and 3 m/s, respectively. The maximum power of the turbine is estimated to be 10 kW with an average wind speed of 11 m/s.
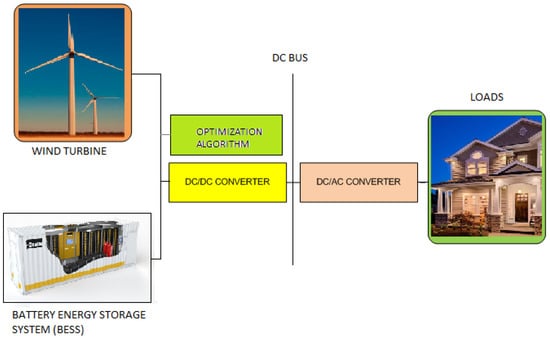
Figure 1.
Wind energy system—test case.
2.1. Electrical Power Output
The power extraction from the wind energy system is evaluated using Equation (1) according to wind speed and rated power of the individual turbine [48].
where PR is the rated power of the turbine in Watts, Vi denotes the cut-in-speed of the wind in m/s, V0 represents the cut-out-speed of the wind in m/s, and the term VR denotes the average wind speed in m/s.
2.2. Cost Components
The cost analysis is carried out using the cost of energy (COE) per kWh and it can be determined by the following expression [36]:
PVC states the Present value cost that can be derived as follows;
where I represents the investment cost, r denotes a discount rate, Comr is the cost of operation and maintenance, the term i states the inflation rate, S defines the salvage values, and n defines the lifetime of the turbine. The cost breaks up to 10-kW turbine is illustrated in Table 2.
Table 2.
Cost breakup of 10-kW turbine.
The Annual Energy Production (AEP) cost is an important term to investigate the annual performance of the wind turbine. It can be computed as follows:
Then the capacity factor (CF) is defined as the ratio between the average output powers to the rated power of the wind turbine. It is dimensionless and can be expressed as follows:
2.3. BESS
BESS is determined in three stages to known the performance of the battery storage. They are as follows:
2.3.1. State of Charge (SOC)
The battery energy storage is the main part of the wind energy system. There are various types of battery models, where it will provide a particular type of battery [49]. The model for the battery energy storage systems is as follows:
The functions r and s as follow:
and,
With the following constraints,
where α denotes the battery self-discharge rate in percentage/day, β states the charging efficiency in percentage, δ terms the discharge efficiency in percentage, Mc represents the maximum charging threshold in MW, and Md states the maximum discharging threshold in MW. The description of the parameters in (7), y(n), and z(n) are energy in the battery and energy fed to the battery respectively. When ) the battery is charged with positive input energy and is negative input energy while the battery is discharging.
The state of charge of the battery is defined as follows [50]:
where i(t) is the DC in the interval [t − 1, t], positive if the battery is charging, and Cn is the nominal capacity. In SOC the DC voltage is elapsed.
2.3.2. Degradation Rate of Battery
The degradation rate of the battery is computed based on lifetime. It is derived from the lifetime curve given by the manufacturers with diverse depths of discharge (DOD) related to numbers of residual cycles to failure. It is known that deeper discharges resulting in less residual cycles to failure. The lifetime can be computed for every DOD using the below equation
where the term Qmax states the battery capacity in kWh, fn denotes the number of cycles to failure, and gn represents the DOD in percentage (from manufacturer data). The battery life can be computed using the following equation;
where the term Ln indicates the lifespan of an individual battery in kWh, Qthrpt represents the annual battery throughput in kWh/year, and the term Rf terms a battery float life in years.
2.3.3. Effect of Internal Resistance
The internal resistance of the battery is considered base on the Rint model. The internal resistance of the battery for the wind energy in the Rint model is given as [51].
where, in Equation (13), Pbat is the power of the battery, Vbat is the voltage given to the battery, Ibat current of the battery, and Rbat is the resistance of the battery.
3. Proposed Methodology and its Modelling
3.1. Multi-Objective Non-Dominated Sorting Genetic Algorithm (NSGA-III)
GA is the metaheuristic search algorithms that are inspired by Darwin’s Theory of Evolution. To solve the optimization problems, GA possess an intelligent approach. It is utilized for a wide range of optimization problems [42] and done by the decision-making process for a mono solution. It has a set of parameters to control within the optimization [52]. Further, Scaffer introduced multi-objective optimization in the 1980s [53] for solving the problems in machine learning. It initially generates the population randomly to match the set of solutions. The objective functions at an optimal solution will give the clear solutions. It has dominant solutions and non-dominant solutions in which the non-dominant solutions are known as Pareto solutions [54]. In Pareto, one or more satisfactory solutions can be chosen with the iteration process [55]. The Multi-Objective Optimization (MOO) based GA algorithm uses non dominated classifications of the GA population and it maintained the diversity in non-dominated solutions. The Pareto optimal solution procedure is presented in Figure 2 to show the difference between dominant solutions and non-dominant solutions. Based on the non-dominated solutions this will modify the Pareto population and perform the GA for MOO.
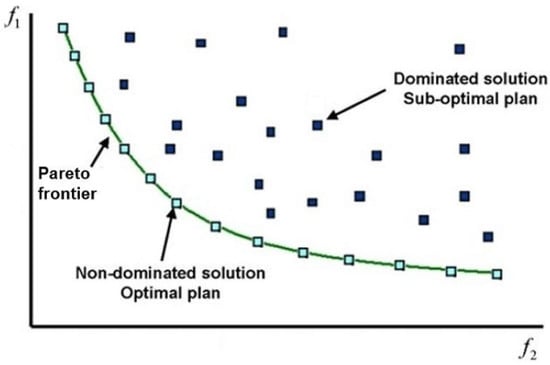
Figure 2.
Pareto frontier of multi-objective optimization.
The steps to be followed for calculations in GA based MOO are as follows.
In the first step, the rank should be assigned according to ri. In this step ri is determined as,
where ni is the number of solutions that dominate the solution ‘i’.
In the second step, there is a need to assign the row fitness to each solution using linear mapping functions. In this, the best rank solutions and worst rank solutions are determined. After row fitness values are assigned in the second step, the third step is to find the average in the best solutions and worst solutions. The average is called as assigned fitness to each solution of the rank.
The assigned fitness values are evaluated for GA based MOO in the following method.
Initially, there is a need to compute ni, i.e., the dominant solutions of ‘i’ and ri for the rank μ(ri) = μ(ri) + 1, for the count of rank solutions.
Next ‘N’ is considered as the best rank solution and ‘1’ as the worst solution.
For the next step, if i < N and I = i + 1, again the procedure should be started from the first step. Otherwise, the next step should be followed to find the maximum rank, which is considered as r*.
To find the average fitness solution, the following equation should be derived;
In Equation (15), k is the total number of solutions that gives the fitness solution for each ‘i’. Shared fitness value should also be counted if two variables have the same rank and it should be converted into a single value. If both have the same count, it is known as the nesha count in the Pareto frontier.
Nesha count is calculated using the below equation.
In Equation (16), dij represents two solutions that have the same rank. The sharing of fitness value can be calculated as follows:
Equation (17) is applicable only when d < δshare and ‘α’ should be between 1 and 2. The dij should be evaluated as follows:
In (18), fl is represented as objectives. The fitness value should be calculated in ‘i’ and ‘j’ to find the best rank in ‘i’ and ‘j’.
The assigned fitness solution is changed to,
The assigned fitness value should be calculated for each value to find the rank solution.
In the final step, if the rank r > r*, there is a need to increment the r* and find fitness solution dij. If r < r*, the procedure will be completed.
The MOO based on NSGA-III gives the best solution with the variations in the step-wise calculation. Even though this has various possible solutions in the optimization, the best solution can be easily captured by optimizing through the fitness solution curve. The simplified algorithm of the proposed methodology is demonstrated in Figure 3.
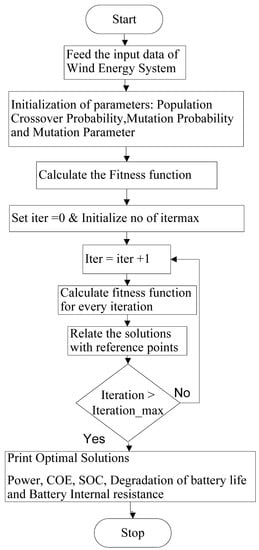
Figure 3.
Flow chart of MOO with NSGA-III operation.
Algorithm Steps:
Step 1: Feed the input data into the algorithm
Step 2: Initialization of algorithm parameters, which is shown in Table 3
Table 3.
NSGA III System parameters.
Step 3: Evaluate the fitness function according to objective function
Step 4: Initiate evolution procedure of NSGA-III for proposed work
Step 5: Checking the criteria, if current Iteration is greater than Iteration_Max
Step 6: If the maximum iteration is not reached, then go to step 5, where iteration is incremented by 1
Step 7: If the maximum iteration is reached, the optimal solutions are printed and the criterion is stopped
3.2. Parameters of NSGA III
3.2.1. Population Size and Robustness
The population size in GAs is generally taken from tens to hundreds and rarely considered up to thousands. The NSGA-III parameters have been clearly shown in Table 3. This algorithm runs five times continuously with different initializations. In the long run, it is evaluated for 1000 fitness function and in the shorter run for 100. In the MOO problem, there is a set of solutions to be determined rather than a single solution. The objectives are the function of another set of parameters, the decision variables, which are the variables that can control within the optimization model such as retrofit measures. Further, a robustness assessment of Pareto solutions can be performed by simulating the performance of over 50 possible operations. Different from above, the robustness functions are introduced as an additional objective cost in the multi-objective optimization.
where and are the vulnerability and robustness functions of the objective function , respectively: and define the mean value and standard deviation of , respectively. Then a simulation method is used to evaluate the robustness functions with some samples. However, in this case, the mean value and the objective function have a similar meaning, it can be consolidated and form optimization functions. The mean value and standard deviation of the objective function are defined as the optimization functions and the robustness functions.
3.2.2. Noise Handling Features
In MOO, three noise-handling features, including experiential learning directed perturbation, gene adaptation selection strategy, and possibilistic archiving model are proposed to improve the robustness [56]. This noise is an important distributed perturbation with an objective as follows:
where n2 represents the level of noise, Normal denotes the normal distribution function , and represents the objective function with and without the additive noise. The three noise handling characteristics are based on population dynamics, diversity, and leadership. The individual is represented as a vector ; where the vector denotes the decision vector in the genotype space and the phenotype space , respectively; is associated objective vector in the objective space, . The binary representation of the decision variables is mapped by the function from the genotype space to the phenotype space and there is a corresponding inverse function .
3.2.3. Quantitative Measure
In this study, three different qualitative measures were used [57].
Proximity Indicator: The metric of generational distance (GD) gives a good indication of the gap between the true Pareto front (PFtrue) and the evolved Pareto front (PFknown). PFtrue is the global Pareto-optimal set. Mathematically, the metric is a function of individual distance given as follows;
where nPF is the number of members in PFknown, di is the Euclidean distance between the members i of PFknown and its nearest member of PFtrue. Intuitively, the lower value of GD is desirable since it indicates little deviation from the true Pareto front.
Diversity Indicator: The concern about unary diverse indicators it gives measure of diversity. Based on pareto front it is followed as:
where are the maximum and minimum of the mth objective of PFknown and are the maximum and minimum of the mth objective in PFknown. The greater the maximum spread is, the more area of PFtrue is covered by the PFknown.
Distribution Indicator: The metric of spacing indicates how evenly the solutions are distributed along the discovered front. Considering the diversity present in the solution set, we modify spacing as follows:
where is the number of members in PFknown, di is the Euclidean distance between the member i of PFknown and its nearest member of PFknown. The smaller the spacing is, the more evenly the members in PFknown distribute.
3.2.4. Predictive Controllers for MOO Based NSGA-III
The predictive control has three levels in the objective function; they are handling constraints, maximizing economics, and maintaining control. The control or constraint variables are found to be out of their limits. Maximizing economics is assigned to out-weigh the control variables. The control maintenance predicts the limits in operation process and structure design for the system considered. Further, Szulczyk et al. [58], Lichota et al. [59] described an equation for harmonic excitation in the predictive analysis.
In Equation (26), fk are consecutive harmonic frequencies, Ak is the amplitude of k-th harmonic, Φk is the phase shift angle, δj is a deflection of j-th speed control and t denotes time. To select a base frequency fo, it is required to define the signal duration T,
Amplitudes of the outputs in the latter case can be obtained from,
In Equation (28), Pj,k defines the power of the k-th harmonic assigned to j-th control surface.
3.2.5. Stochastic Dominance in the MOO Based NSGA-III
Stochastic parameters will be useful when dealing with non-linearity in the operation [60]. This stochastic dominance allows investors to maximize profit. This is utilized to know the pros and cons of the system without considering the losses in the system.
The measure of risk is calculated as follows;
In Equation (29), VR is the value at risk. The value-at-risk of the random outcome x at level α.
The average value at risk is sometimes known as conditional value at risk. This risk does not affect the system heavily and it is represented as.
In Equation (30), is the average value at risk and is a special case of AVR.
A decision-maker is risk-neutral in some of the chosen objectives. For illustration, it may be a budget with respect to costs.
In a two-stage stochastic multi-objective optimization the equation is given as.
where j is the recourse function and it is evaluated in an additional stage, the second stage can be derived as follows:
In Equation (32), y is called as here and now or 1st stage decision, whereas, x depends on the realization of , is known as wait and see or 2nd stage operation.
3.3. SEIG Modelling
Based on the non-dominant solutions of the Pareto frontier, the modelling of SEIG is carried out which can be used for the wind energy system. Various stator poles and rotors can be designed based on the requirement to operate the system smoothly [61]. To protect a system during grid fault to achieve maximum power a fuzzy logic design is implemented [62,63]. The complete SEIG modelling is shown in Figure 4.
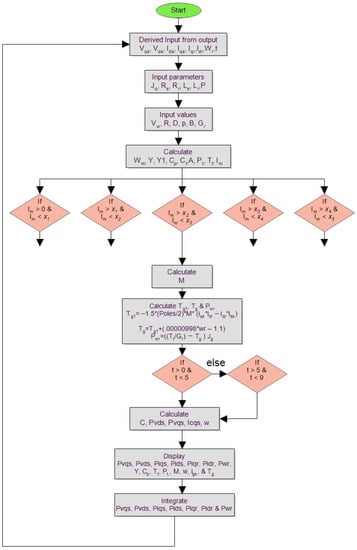
Figure 4.
Self-excited induction generator (SEIG) modelling for wind energy systems.
In SEIG modelling, the voltage and current of the d-q axis reference notations are taken as Vqs, Vds, Iqs, Ids. The resistance value of the stator and rotor are denoted as ‘Rr’ and ‘Rs’. Further, Ls and Lr are the inductance of stator and rotor. The inertia is represented as ‘Jg’ and the number of poles is denoted as P. Additionally, the wind velocity is represented as ‘VW’, radius as ‘R’, diameter as ‘D’, pitch angle as ‘B’, and Gear ratio as Gr. Moreover, ‘Y’ is considered as Tip Speed Ratio (TSR), Cp is power coefficient, ‘A’ as area, ‘Pt’ as power, and ‘Tt’ as torque. The term ‘M’ is denoted as Mutual inductance and ‘Im’ as magnetizing inductance. In SEIG, ‘Tg’ is denoted a generator torque, ‘Pwr’ as power, ‘Tt’ as turbine torque, ‘Pt’ as turbine power, and ‘w’ as rotor speed.
3.4. Objective Function
To maximize the multiple objective functions, a vector of objective functions is considered and derived as follows:
The above function is expressed with minimization and subject to certain constraints as represented below.
Turbine constraints:
where Vtip is the tip speed and Vtip,max is the maximum tip speed on turbine blade; ω is the blade natural frequency and is the tip deflection.
Battery constraints:
The charging and discharging power of the battery states the upper and lower power limitation when the charging and discharging taken place. It should be within the allowable band as described below,
where Pstorage,t states the charging and discharging power of battery at time t; −Pmax and Pmax represent the upper and lower bound of battery power respectively.
The balancing equation of battery between charging and discharging can be derived as constraints as follows;
where ta and tb states the charging region and tc and td denotes the discharging region; Pch and Pdis represent the charging and discharge power of the battery, and ε denotes the permissible error for power balance.
4. Results and Discussions
4.1. Performance of SEIG
It is stated earlier that the SEIG is considered for this study which consists of four poles, 4 m radius, 13–15° pitch angle, and a gear ratio of 30. Additionally, the wind speed profile of the system is demonstrated in Figure 5. The proposed methodology is simulated using the defined wind turbine system and the results are observed and demonstrated in detail.
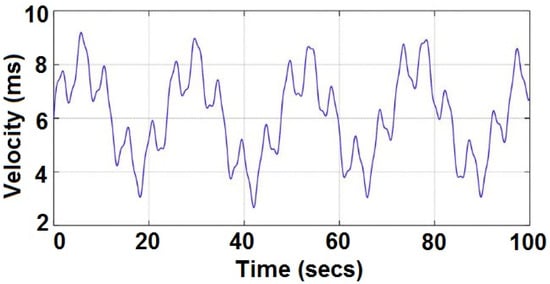
Figure 5.
Wind speed profile.
The mechanical power output of the wind turbine is directly associated with the wind speed profile. It is a known fact that the output power of the turbine is proportional to the cube of wind profile and the reduction of the wind speed by half results in a reduction of power output by one-eighth of its reference value. The mechanical features of the turbine affect the electrical characteristics directly. Based on the defined wind profile, the electrical parameters of the SEIG have recorded notably output voltage, output current, and maximum power extraction. The generated voltage increases with faster wind speed specifically between 3.8 to 9 m/s. Consequently, the output voltage of the turbine attains a higher magnitude of 305 V with a smoother waveshape. Particularly, the magnitude of the voltage is maintained constant after 0.05 s as shown in Figure 6. Nonetheless, the existing technologies such as SOO, MOO, and NSGA II generate voltage up to 290.9 V, 374 V, and 332.4 V, respectively. This shows the effectiveness of the proposed algorithm which can attain higher voltage from the wind turbine.
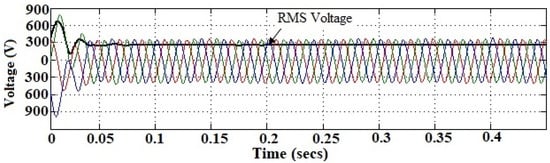
Figure 6.
Output voltage.
Further, the wind turbine generates the output current concerning the characteristics of the generated voltage. The output current shows similar trends with voltage characteristics with a maximum magnitude of 25.5 A as demonstrated in Figure 7. On other hand, the existing optimization techniques generate a better magnitude of current but not greater than NSGA III. Both the current and voltage magnitude shows a greater level when the proposed optimization is adopted. This is because NSGA III maintains better coverage of Pareto solutions that takes the reference point mechanism but the other existing method notably NSGAII uses crowding distance operator to maintain the uniform coverage. Moreover, the most significant component of the scheme is the maximum power extraction using the proposed system. Therefore, the power characteristics of the system is demonstrated in Figure 8. Since the output current and voltage of the proposed system show better characteristics over the existing optimization technique, the electrical power output should represent similar characteristics. From the observed plot, it is perceived that the NSGA-III based SEIG system yield maximum power optimally about 7.5 kW. This is a notably greater power extraction over the existing methods notably MOO and NGSA II. It shows that the proposed scheme obtains high wind power density which results in better electrical energy production per square meter of air space (W/m2).
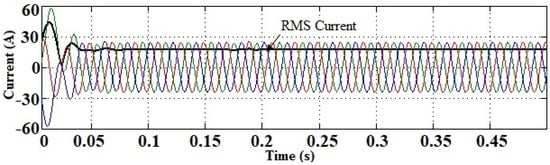
Figure 7.
Output current.
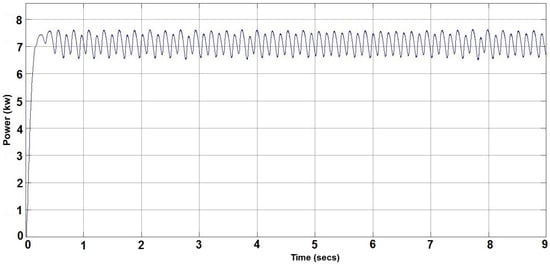
Figure 8.
Power characteristics.
Attesting to the above-discussed facts, the rotor speed of the turbine shows similar trends as characterized in Figure 9. This is due to the statement that the speed of the wind turbine is directly related to output power. Moreover, the torque characteristics of the NSGA-III based system show the initial distortions and it is reduced significantly to obtain a steady level laterally. The relationship between the torque–speed characteristics of the system is presented in Figure 10. The torque characteristic represents that there is an inclination with an increase in the speed of the rotor. However, it starts to decline from the specific speed of the rotor. The maximum torque is obtained about 152 N/m at a speed of 1100 rpm; the torque on full load is reduced to 125 N/m at a speed of 1250 rpm.
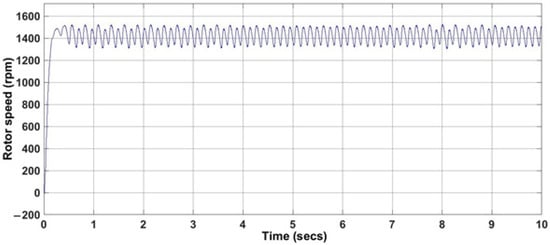
Figure 9.
Rotor speed of SEIG.
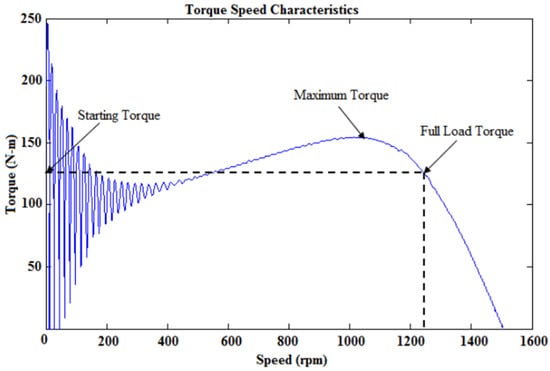
Figure 10.
Speed vs torque characteristics.
Further, wind speed chiefly governs the amount of electricity produced by a wind turbine. Generally, higher wind velocities produce more power because it allows the blades to revolve faster. Consequently, it generates more mechanical power and extracts more electrical power from the turbine. The relationship between wind velocity and electrical power output for a 10-kW wind turbine is depicted in Figure 11. The proposed technique maintains a better limit of cut-in speed and cut-out speed that generates a higher rate of electrical power with a constant level. In general, the wind velocity varies from 11 m/s to 15 m/s for the wind energy system. Consequently, the output power is recorded as 7.5 kW at 11 m/s and started to decline towards the increase of velocity. Later, the output power dropped suddenly particularly after the cut-out speed due to the wind velocity factor. As exceeding the cut-out speed may damage the equipment, it must be shut down immediately. However, constant speed power is maintained between the rated output speed and cut-out speed. This shows the effectiveness of the proposed methodology that can maintain constant power for diverse wind velocity. Under this scenario, the pitch angle of 15° is noticed during the attainment of maximum power shown in Figure 12.
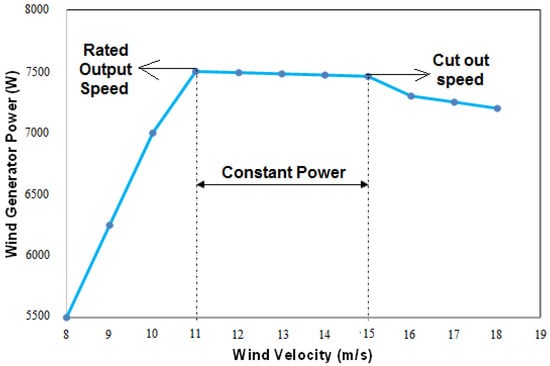
Figure 11.
Arbitrary power curve of a 10-MW wind turbine compared to wind speed.
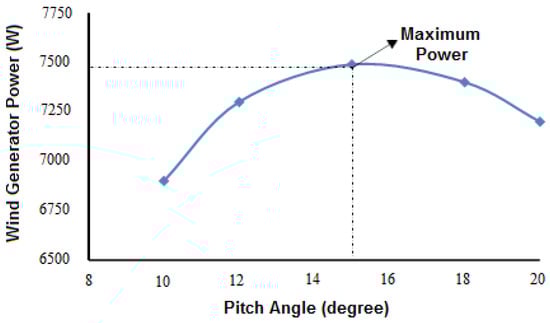
Figure 12.
Pitch angle vs generator power.
To show the effect of single parameter change, 16 different cases are tested as shown in Table 4. In the cases 1, 2, 3 and 4, Population, Crossover Probability, Mutation Probability and Mutation Parameter are varied, respectively, whereas other three parameters are kept constant. It can be observed that, algorithm parameters are sensitivity, it has not affected the quality of solution. The optimal parameter settings of algorithm is tabulated as shown in Table 4.
Table 4.
Performance analysis of parameters of NSGA III.
The considered system is simulated for conventional GA optimization techniques such as Single objective-based GA [64], Multi-objective [65], and NSGA-II [41]. The observed results for the NSGA-III algorithm are compared with the conventional optimization techniques and tabulated in Table 5.
Table 5.
Comparison of proposed NSGA-III with other existing optimization techniques.
The proposed method is solved repeatedly for 100 times. The best and the worst values among the best solutions of these 100 runs are presented in Table 5.
Further, the COE of the wind energy system is analyzed for existing and proposed optimization algorithm. Comparing the outcomes of all optimization techniques adopted, NSGA III offers a lesser COE of Rs. 4.2/kWh. This is due to the higher generation of AEP of 65.70 MWh with a higher rate of the capacity factor of about 0.75.
In a nutshell, it is stated earlier that the wind speed is considered as 8–12 m/s for all cases. However, the output from each case shows varied magnitudes of parameters as mentioned in Table 5. Notably, the output voltage of the wind energy system recorded a lower value of 290.9 V for the single objective optimization system and obtained a higher value of about 374 V for MOO. On the other hand, the maximum current is observed from NSGA-III. Therefore, it logged a higher rate of output power extraction about 7.5 kW (with a pitch angle of 15°) which is much greater than other optimization techniques. Additionally, the NSGA-III technique shows a lower speed variation of about 13.33% which ensures the stable operation of the system. Further, the torque generation is found to be 152 N/m. Furthermore, the capacity factor and AEP show superior performance which endorses the effective performance of the NSGA-III optimization technique over other techniques.
4.2. BESS
The basic functions of BESS are charging, discharging, and storage processes, and their characteristics are based on the following conditions [66]:
- State of charge
- Battery storage capacity
- Rate of discharge and charge
- Environmental temperature
The BESS based power electronic converter is employed for frequency regulation and load changes [67]. To attain a suitable operation, each of these conditions are to be considered, and the behavior of the battery is depending on three factors:
- Charging time
- Discharging time
- Storing period
The three behavior types are very important for analysis and described as follows:
4.2.1. Charging Time
When the battery is charging, a change in the energy occurs in the battery. The parameters such as ambient temperature, rate of charge, battery quantity, state of charge, and a specific amount of energy is absorbed in the battery.
4.2.2. Discharging Time
In the case of discharge time, the characteristics are the same as charging time. However, these effects are not the same as charging based on empirical results from any type of batteries [68]. It is observed that the percentage of loss of energy in the discharging process is larger than the time of charging with the same conditions [69]. The effect of temperature also plays a role in charging and discharging time.
4.2.3. Storing Period
In discharging and charging time, energy will be stored inside the battery and also some energy will be lost due to the chemical reactions inside the battery. The factors for storing energy in the battery are based on the type of battery and materials used in the battery [70].
In all the conditions the temperature the performance of the battery is highly dependent on the temperature.
Based on the modelling of the battery charging, discharging, and SOC, the tests are conducted in MATLAB/Simulink software platform and discussed to represent the performance of the battery on the considered parameters. Figure 13 shows the system voltage response based on the SOC response. The test includes six different levels for determining the charge and discharge of the battery it is visible for the proposed algorithm MOO based NSGA-III charge level has a better performance compared to SOO, MOO, and MOO (NSGA-II).
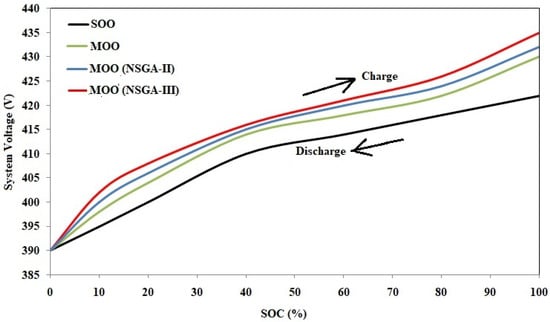
Figure 13.
Percentage of state of charge (SOC) versus system voltage (V).
The degrading mechanism is a complex matter due to the charging and discharging pattern that can trigger the degradation pathways. The degradation performance of the battery can be projected using real-time storage measurements, accelerated aging at higher temperatures, and thermal measurements. The major cause of degradation is due to the inaccurate control of charging voltage. Considering these facts, the degradation of the battery is analyzed based on the charging and discharging span and represented in Figure 14. The response for battery degradation in NSGA-III is linearly increasing; whereas for SOO, MOO, and MOO (NSGA-II), the degradation of battery life shows a high distortion rate when compared with MOO based NSGA-III.
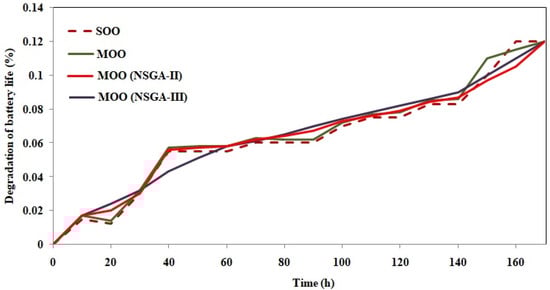
Figure 14.
Degradation of battery life.
The internal resistance of the battery varies with the SOC of the battery. The resistance value is higher at the initial range after charging and gradually reduces with the increase of SOC. This is caused due to the decline of the specific gravity and a depletion of the electrolyte. However, the resistance value increase is practically linear with the fall of the specific gravity. Attesting to these facts, Figure 15 shows the comparison for the battery charge and discharge internal resistance for different techniques.
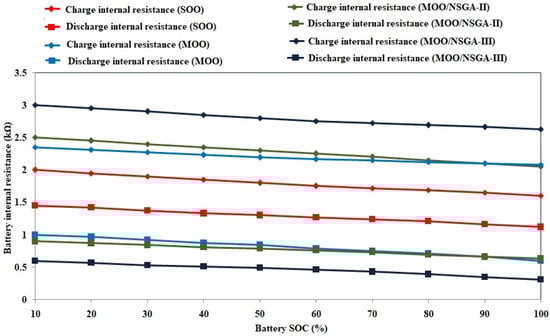
Figure 15.
Battery charge and discharge internal resistance.
The proposed method is evaluated by repeatedly running for 100 times. The best and the worst values among the best solutions of these 100 runs are presented in Table 6 for BESS in NSGA-III. The simulated results show that there is slight disturbance in the output during repeated running of algorithm which might not affect the quality of the solution. The proposed system can withstand up to 2 kΩ in a charging state for the SOO technique and maintains 1.25 kΩ during discharging mode. In MOO, the system can withstand up to 2.5 kΩ and 0.75 kΩ during the charging and discharging state. For MOO (NSGA-II), the system can withstand up to 2.35 kΩ in the charging state; whereas it can operate up to 0.63 kΩ in the discharging state. Notably, the battery charge for the MOO (NSGA-III) algorithm can withstand the system for 3 kΩ. During discharging, the system can operate up to 0.38 kΩ. The internal resistance of the battery is directly related to the performance of the battery. It is essential to maintain higher resistance during the charging state and lower value during the discharging state. As per the observed analysis, it is inferred that the NSGA-III is advantageous when compared with SOO, MOO (NSGA), and MOO (NSGA-II).
Table 6.
Performance analysis of parameters of NSGA III for battery energy storage system (BESS).
Consolidating all the results, it is observed that the proposed system has the potential to enhance the electrical power output from a wind turbine with the reduced cost of energy. The application of the proposed method adopted in this work by investors during the planning stage could considerably increase the financial enactment of their investment.
5. Conclusions
In this work, the effectiveness of a multi-objective based NSGA-III algorithm is demonstrated for wind energy systems consisting of SEIG. The various parameters such as output voltage, output current, rotor speed, pitch angle, speed variations, torque, and power of SEIG are evaluated. The conclusions of this exertion are summarized as follows:
- NSGA-III algorithm can accurately recognize the best boundary.
- It extracted a higher rate of power about 7.5 kW from SEIG which is greater than other existing optimization algorithms.
- The speed variation of the generator recorded the least value of about 13.33%.
- The net torque rate of the generator is commendable about 152 N/m.
- The capacity factor and annual energy production show greater characteristics about 0.75 and 65.70 MWh respectively.
- The cost of generated energy is reduced by about Rs. 4.2/kWh with the proposed methodology.
- The charge level of the BESS against system voltage and degradation factor against operating hours shows better performance using the proposed scheme compared with the conventional method.
- Using NSGA-III scheme, the withstand resistance of BESS during the charging period shows a better scale of 3 kΩ, and discharging withstand resistance is least about 0.38 kΩ.
In a nutshell, the proposed methodology (NSGA-III) delivers greater advantages for wind energy systems compare with a single objective, multi-objective, and NSGA-II algorithm.
Author Contributions
The authors S.S. and C.S. developed the main theme of the article and performed the work on data collection, ideology, and optimization; R.M.E., K.R., and R.R.V. contributed equally to the final dissemination of the research investigation to form the article; L.M.-P. contributed to the review and editing of the article. All authors have read and agreed to the published version of the manuscript.
Funding
This research received no external funding.
Institutional Review Board Statement
Not applicable.
Informed Consent Statement
Not applicable.
Data Availability Statement
Not applicable.
Acknowledgments
The authors would like to thank the Department of Electrical and Electronics Engineering, College of Engineering, Anna University, Chennai, India, for the technical expertise provided. They also acknowledge Irfan Ahmad Khan, Clean and Resilient Energy Systems Laboratory, Texas A&M University, Galveston, USA for the technical inputs provided.
Conflicts of Interest
The authors declare no conflict of interest.
References
- Jimada-Ojuolape, B.; The, J. Surveys on the reliability impacts of power system cyber–physical layers. Sustain. Cities Soc. 2020, 62, 102384. [Google Scholar] [CrossRef]
- Anthony, M.; Prasad, V.; Raju, K.; Alsharif, M.H.; Geem, Z.W.; Hong, J. Design of Rotor Blades for Vertical Axis Wind Turbine with Wind Flow Modifier for Low Wind Profile Areas. Sustainability 2020, 12, 8050. [Google Scholar] [CrossRef]
- Rajvikram, M. The motivation for renewable energy and its comparison with other energy sources: A review. Eur. J. Sustain. Dev. Res. 2019, 3, em0076. [Google Scholar]
- Elavarasan, R.M.; Shafiullah, G.M.; Padmanaban, S.; Kumar, N.M.; Annam, A.; Vetrichelvan, A.M.; Mihet-Popa, L.; Holm-Nielsen, J.B. A Comprehensive Review on Renewable Energy Development, Challenges, and Policies of Leading Indian States with an International Perspective. IEEE Access 2020, 8, 74432–74457. [Google Scholar] [CrossRef]
- Rajvikram, M.; Shafiullah, G.M.; Manoj Kumar, N.; Sanjeevikumar, P. A State-of-the-Art review on the drive of renewables in Gujarat, State of India: Present situation, barriers and future initiatives. Energies 2020, 13, 40. [Google Scholar]
- Elavarasan, R.M.; Selvamanohar, L.; Raju, K.; Vijayaraghavan, R.R.; Subburaj, R.; Nurunnabi, M.; Khan, I.A.; Afridhis, S.; Hariharan, A.; Pugazhendhi, R.; et al. A Holistic Review of the Present and Future Drivers of the Renewable Energy Mix in Maharashtra, State of India. Sustainability 2020, 12, 6596. [Google Scholar] [CrossRef]
- Rajvikram, M. Comprehensive Review on India’s Growth in Renewable Energy Technologies in Comparison with Other Prominent Renewable Energy Based Countries. J. Sol. Energy Eng. 2020, 142, 030801. [Google Scholar]
- Elavarasan, R.M.; Afridhis, S.; Vijayaraghavan, R.R.; Umashankar, S.; Nurunnabi, M. SWOT analysis: A framework for comprehensive evaluation of drivers and barriers for renewable energy development in significant countries. Energy Rep. 2020, 6, 1838–1864. [Google Scholar] [CrossRef]
- Global Wind Report Annual Market Update. 2010. Available online: http://gwec.net/wp-content/uploads/2012/06/GWEC_annual_market_update_2010_-_2nd_edition_April_2011.pdf (accessed on 20 October 2020).
- Adelaja, A.; McKeown, C.; Calnin, B.; Hailu, Y. Assessing offshore wind potential. Energy Policy 2012, 42, 191–200. [Google Scholar] [CrossRef]
- Coskun, A.A.; Türker, Y.O. Wind energy and Turkey. Environ. Monit. Assess. 2012, 184, 1265–1273. [Google Scholar] [CrossRef]
- Pliego Marugán, A.; García Márquez, F.P.; Pinar Pérez, J.M. Optimal maintenance management of off-shore wind farms. Energies 2016, 9, 46. [Google Scholar] [CrossRef]
- Marugán, A.P.; Márquez, F.P.G.; Lev, B. Optimal decision-making via binary decision diagrams for investments under a risky environment. Int. J. Prod. Res. 2017, 55, 5271–5286. [Google Scholar] [CrossRef]
- Ishugah, T.; Li, Y.; Wang, R.; Kiplagat, J. Advances in wind energy resource exploitation in urban environment: A review. Renew. Sustain. Energy Rev. 2014, 37, 613–626. [Google Scholar] [CrossRef]
- Kamil, K. Energy for sustainable development: A case of developing countries. Renew. Sustain. Energy Rev. 2012, 16, 1116–1126. [Google Scholar]
- Chan, C.; Bai, H.; He, D. Blade shape optimization of the Savonius wind turbine using a genetic algorithm. Appl. Energy 2018, 213, 148–157. [Google Scholar] [CrossRef]
- Pagnini, L.C.; Burlando, M.; Repetto, M.P. Experimental power curve of small-size wind turbines in turbulent urban environment. Appl. Energy 2015, 154, 112–121. [Google Scholar] [CrossRef]
- Gao, X.; Yang, H.; Lu, L. Optimization of wind turbine layout position in a wind farm using a newly-developed two-dimensional wake model. Appl. Energy 2016, 174, 192–200. [Google Scholar] [CrossRef]
- Muñoz, C.Q.G.; Márquez, F.P.G. Wind Energy Power Prospective. In Renewable Energies; Springer: Berlin/Heidelberg, Germany, 2018; pp. 83–95. [Google Scholar]
- Bordin, C.; Anuta, H.O.; Crossland, A.; Gutierrez, I.L.; Dent, C.J.; Vigo, D.A. linear programming approach for battery degradation analysis and optimization in offgrid power systems with solar energy integration. Renew. Energy 2017, 101, 417–430. [Google Scholar] [CrossRef]
- Wang, R.; Xiong, J.; He, M.-F.; Gao, L.; Wang, L. Multi-objective optimal design of hybrid renewable energy system under multiple scenarios. Renew. Energy 2020, 151, 226–237. [Google Scholar] [CrossRef]
- Zhang, D.; Liu, J.; Jiao, S.; Tian, H.; Lou, C.; Chen, G.; Zhang, J.; Wang, C.; Zuo, J. Research on the configuration and operation effect of the hybrid solar-wind-battery power generation system based on NSGA-II. Energy 2019, 189, 116121. [Google Scholar] [CrossRef]
- Zhao, F.; Yuan, J.; Wang, N. Dynamic Economic Dispatch Model of Microgrid Containing Energy Storage Components Based on a Variant of NSGA-II Algorithm. Energies 2019, 12, 871. [Google Scholar] [CrossRef]
- Kamjoo, A.; Maheri, A.; Dizqah, A.M.; Putrus, G. Multi-objective design under uncertainties of hybrid renewable energy system using NSGA-II and chance constrained programming. Int. J. Electr. Power Energy Syst. 2016, 74, 187–194. [Google Scholar] [CrossRef]
- Shaheen, M.A.M.; Alghuwainem, S.; Alkuhayli, A. A novel hybrid GWO-PSO optimization technique for optimal reactive power dispatch problem solution. Ain Shams Eng. J. 2020. [Google Scholar] [CrossRef]
- Feroz, A.; Mansoor, M.; Ling, Q.; Yin, B.; Javed, M.Y. A Salp-Swarm Optimization based MPPT technique for harvesting maximum energy from PV systems under partial shading conditions. Energy Convers. Manag. 2020, 209, 112625. [Google Scholar]
- Liu, J.; Wang, M.; Peng, J.; Chen, X.; Cao, S.; Yang, H. Techno-economic design optimization of hybrid renewable energy applications for high-rise residential buildings. Energy Convers. Manag. 2020, 213, 112868. [Google Scholar] [CrossRef]
- Deveci, K.; Güler, Ö. A CMOPSO based multi-objective optimization of renewable energy planning: Case of Turkey. Renew. Energy 2020, 155, 578–590. [Google Scholar] [CrossRef]
- Krishnamoorthy, R.; Udhayakumar, K.; Kannadasan, R.; Elavarasan, R.M.; Mihet-Popa, L. An Assessment of Onshore and Offshore Wind Energy Potential in India Using Moth Flame Optimization. Energies 2020, 13, 3063. [Google Scholar] [CrossRef]
- Yahiaoui, A.; Fodhil, F.; Benmansour, K.; Tadjine, M.; Cheggaga, N. Grey wolf optimizer for optimal design of hybrid renewable energy system PV-Diesel Generator-Battery: Application to the case of Djanet city of Algeria. Sol. Energy 2017, 158, 941–951. [Google Scholar] [CrossRef]
- Graditi, G.; Adinolfi, G.; Tina, G.M. Photovoltaic optimizer boost converters: Temperature influence and electro-thermal design. Appl. Energy 2014, 115, 140–150. [Google Scholar] [CrossRef]
- Mengjun, M.; Rui, W.; Yabing, Z.; Tao, Z. Multi-Objective Optimization of Hybrid Renewable Energy System Using an Enhanced Multi-Objective Evolutionary Algorithm. Energies 2017, 10, 674. [Google Scholar] [CrossRef]
- Pirouz, B.; Khorram, E. A computational approach based on the ε-constraint method in multi-objective optimization problems. Adv. Appl. Stat. 2016, 49, 453–483. [Google Scholar] [CrossRef]
- Kouaissah, N.; Hocine, A. Optimizing sustainable and renewable energy portfolios using a fuzzy interval goal programming approach. Comput. Ind. Eng. 2020, 144, 106448. [Google Scholar] [CrossRef]
- Babatunde, M.; Ighravwe, D.E. A CRITIC-TOPSIS framework for hybrid renewable energy systems evaluation under techno-economic requirements. J. Proj. Manag. 2019, 109–126. [Google Scholar] [CrossRef]
- Mohamed, M.A.; Eltamaly, A.M.; Alolah, A.I. Swarm intelligence-based optimization of grid-dependent hybrid renewable energy systems. Renew. Sustain. Energy Rev. 2017, 77, 515–524. [Google Scholar] [CrossRef]
- Yu, D.; Zhang, T.; He, G.; Nojavan, S. Energy management of wind-PV-storage-grid based large electricity consumer using robust optimization technique. J. Energy Storage 2020, 27, 101054. [Google Scholar] [CrossRef]
- Zhang, Y.; Huang, Z.; Zheng, F.; Zhou, R.; An, X.; Li, Y. Interval optimization based coordination scheduling of gas–electricity coupled system considering wind power uncertainty, dynamic process of natural gas flow and demand response management. Energy Rep. 2020, 6, 216–227. [Google Scholar] [CrossRef]
- Qais, M.H.; Hasanien, H.M.; Alghuwainem, S. Whale optimization algorithm-based Sugeno fuzzy logic controller for fault ride-through improvement of grid-connected variable speed wind generators. Eng. Appl. Artif. Intell. 2020, 87, 103328. [Google Scholar] [CrossRef]
- Qais, M.H.; Hasanien, H.M.; Alghuwainem, S. Enhanced whale optimization algorithm for maximum power point tracking of variable-speed wind generators. Appl. Soft Comput. J. 2019, 86, 105937. [Google Scholar] [CrossRef]
- Abdelkader, A.; Rabeh, A.; Mohamed Ali, D.; Mohamed, J. Multi-objective genetic algorithm-based sizing optimization of a stand-alone wind/PV power supply system with enhanced battery/supercapacitor hybrid energy storage. Energy 2018, 163, 351–363. [Google Scholar] [CrossRef]
- Movahed, Z.P.; Kabiri, M.; Ranjbar, S.; Joda, F. Multi-objective optimization of life cycle assessment of integrated waste management based on genetic algorithms: A case study of Tehran. J. Clean. Prod. 2020, 247, 247. [Google Scholar] [CrossRef]
- Zhou, Y.; Cao, S.; Kosonen, R.; Hamdy, M. Multi-objective optimisation of an interactive buildings-vehicles energy sharing network with high energy flexibility using the Pareto archive NSGA-II algorithm. Energy Convers. Manag. 2020, 218, 113017. [Google Scholar] [CrossRef]
- Du, W.; Tang, Y.; Leung, S.Y.S.; Tong, L.; Vasilakos, A.V.; Qian, F. Robust Order Scheduling in the Discrete Manufacturing Industry: A Multiobjective Optimization Approach. IEEE Trans. Ind. Informatics 2017, 14, 253–264. [Google Scholar] [CrossRef]
- Rajvikram, M.; Renuga, P.; Aravind Kumar, G.; Bavithra, K. Fault Ride-through Capability of Permanent Magnet Synchronous Generator Based Wind Energy Conversion System. Power Res. 2016, 12, 531–538. Available online: http://cprijournal.in/index.php/prj/article/view/142845 (accessed on 20 October 2020).
- Rajvikram, M. Solutions for Voltage SAG in a Doubly Fed Induction Generator Based Wind Turbine: A Review. Power Res. A J. CPRI 2019, 14, 73–77. [Google Scholar] [CrossRef]
- Rajvikram, M.; Aritra, G.; Tapas, K.M.; Apoorva, K.; Meenal, S. Investigations on Performance Enhancement Measures of the Bidirectional Converter in PV–Wind Interconnected Microgrid System. Energies 2019, 12, 2672. [Google Scholar]
- Alayat, M.M.; Kassem, Y.; Çamur, H. Assessment of Wind Energy Potential as a Power Generation Source: A Case Study of Eight Selected Locations in Northern Cyprus. Energies 2018, 11, 2697. [Google Scholar] [CrossRef]
- Anthony, M.G.; Francis, V.P.R.; Roderick, W.D. Analysis of Battery Lifetime Extension in a Small-Scale Wind-Energy System Using Supercapacitors. IEEE Trans. Energy Convers. 2013, 28, 24–33. [Google Scholar]
- Rancilio, G.; Lucas, A.; Kotsakis, E.; Fulli, G.; Merlo, M.; Delfanti, M.; Masera, M. Modeling a Large-Scale Battery Energy Storage System for Power Grid Application Analysis. Energies 2019, 12, 3312. [Google Scholar] [CrossRef]
- Liu, Y.; Wu, X.; Du, J.; Song, Z.; Wu, G. Optimal sizing of a wind-energy storage system considering battery life. Renew. Energy 2020, 147, 2470–2483. [Google Scholar] [CrossRef]
- Ryu, N.; Lim, S.; Min, S.; Izui, K.; Nishiwaki, S. Multi-Objective Optimization of Magnetic Actuator Design Using Adaptive Weight Determination Scheme. IEEE Trans. Magn. 2017, 53, 2–5. [Google Scholar] [CrossRef]
- Schaffer, J.D. Multiple objective optimization with vector evaluated genetic algorithms. In Proceedings of the 1st International Conference on Genetic Algorithms and their Applications, Pittsburgh, PA, USA, 24–26 July 1985; pp. 93–100. [Google Scholar]
- Deb, K. Multi-objective Genetic Algorithms: Problem Difficulties and Construction of Test Problems. Evol. Comput. 1999, 7, 205–230. [Google Scholar] [CrossRef]
- Wang, Y.; Shi, Q.; Hu, Q.; You, Z.; Bai, Y.; Guo, C. An efficiency sorting multi-objective optimization framework for sustainable supply network optimization and decision making. J. Clean. Prod. 2020, 272, 122842. [Google Scholar] [CrossRef]
- Goh, C.; Tan, K.C. Noise Handling in Evolutionary Multi-Objective Optimization. In Proceedings of the 2006 IEEE International Conference on Evolutionary Computation, Vancouver, BC, Canada, 16–21 July 2006; pp. 1354–1361. [Google Scholar] [CrossRef]
- Goh, C.K.; Chiam, S.C.; Tan, K.C. An Investigation on Noisy Environments in Evolutionary Multi-Objective Optimization. IEEE Trans. Evol. Comput. 2006, 11, 354–381. [Google Scholar] [CrossRef]
- Szulczyk, J.; Lichota, P.E. Evolutionary Algorithm Based Multisine Inputs. In Proceedings of the 20th International Carpathian Control Conference, Cracow-Wieliczka, Poland, 26–29 May 2019; pp. 411–416. [Google Scholar]
- Lichota, P.; Szulczyk, J.; Tischler, M.B.; Berger, T. Frequency Responses Identification from Multi-Axis Maneuver with Simultaneous Multisine Inputs. J. Guid. Control. Dyn. 2019, 42, 2550–2556. [Google Scholar] [CrossRef]
- Wojsznis, W.; Mehta, A.; Wojsznis, P.; Thiele, D.; Blevins, T. Multi-objective optimization for model predictive control. ISA Trans. 2007, 46, 351–361. [Google Scholar] [CrossRef]
- Kumar, R.R.; Devi, P.; Chetri, C.; Vardhan, A.S.S.; Rajvikram, M.; Mihet-Popa, L.; Saket, R.K. Design and characteristics investigation of novel dual stator pseudo-pole five-phase permanent magnet synchronous generator for wind power application. IEEE Access 2020, 8, 175788–175804. [Google Scholar] [CrossRef]
- Rajvikram, M.; Renuga, P.; Swathisriranjani, M. Fuzzy based MPPT controller’s role in extraction of maximum power in wind energy conversion system. In Proceedings of the International Conference on Control, Instrumentation, Communication and Computational Technologies (ICCICCT), Kumaracoil, India, 16–17 December 2016; pp. 713–719. [Google Scholar]
- Rajvikram, M.; Vishnupriyan, J. Coordinative Control of Tuned Fuzzy Logic and Modified Sliding Mode Controller in PMSG-Based Wind Turbines. In Advances in Smart Grid Technology; Springer: Singapore, 2020; pp. 189–201. [Google Scholar]
- Zhang, Y.; Sun, G.; Li, G.; Luo, Z.; Li, Q. Optimization of foam-filled bitubal structures for crashworthiness criteria. Mater. Des. 2012, 38, 99–109. [Google Scholar] [CrossRef]
- Liu, H.; Li, Y.; Duan, Z.; Chen, C. A review on multi-objective optimization framework in wind energy forecasting techniques and applications. Energy Convers. Manag. 2020, 15, 113324. [Google Scholar] [CrossRef]
- Modelling and Control of Wind Farms Integrated with Battery Energy Storage Systems. Available online: http://unsworks.unsw.edu.au/fapi/datastream/unsworks:47753/SOURCE02?view=true (accessed on 20 October 2020).
- Ganesan, S.; Subramaniam, U.; Ghodke, A.A.; Rajvikram, M.; Raju, K.; Bhaskar, S.M. Investigation on Sizing of Voltage Source for a Battery Energy Storage System in Microgrid with Renewable Energy Sources. IEEE Access 2020, 8, 188861–188874. [Google Scholar] [CrossRef]
- Liao, L.; Zuo, P.; Ma, Y.; Chen, X.; An, Y.; Gao, Y.; Yin, G. Effects of temperature on charge/discharge behaviors of life PO4 cathode for li-ion batteries. Electrochim. Acta 2012, 60, 269–273. [Google Scholar] [CrossRef]
- Plangklang, B.; Pornharuthai, P. Mathematical model and experiment of temperature effect on discharge of lead-acid battery for PV systems in tropical area. Energy Power Eng. 2013, 5, 43–49. [Google Scholar] [CrossRef]
- Batteries and Charge Control in Stand-Alone Photovoltaic Systems. Available online: http://www.fsec.ucf.edu/en/publications/pdf/FSEC-CR-1292-01.pdf (accessed on 20 October 2020).
Publisher’s Note: MDPI stays neutral with regard to jurisdictional claims in published maps and institutional affiliations. |
© 2021 by the authors. Licensee MDPI, Basel, Switzerland. This article is an open access article distributed under the terms and conditions of the Creative Commons Attribution (CC BY) license (http://creativecommons.org/licenses/by/4.0/).