Article

Trend Analysis of Annual and Seasonal River Runoff by Using Innovative Trend Analysis with Significant Test

by
Yilinuer Alifujiang
1,2,
Jilili Abuduwaili
3,4,5,* and
Yongxiao Ge
3,4,5
1
College of Resources and Environmental Science, Xinjiang University, Urumqi 830046, China
2
Key Laboratory of Oasis Ecology, Xinjiang University, Urumqi 830046, China
3
State Key Laboratory of Desert and Oasis Ecology, Xinjiang Institute of Ecology and Geography, Chinese Academy of Sciences, Urumqi 830011, China
4
Research Center for Ecology and Environment of Central Asia, Chinese Academy of Sciences, Urumqi 830011, China
5
University of Chinese Academy of Sciences, Beijing 100049, China
*
Author to whom correspondence should be addressed.
Water 2021, 13(1), 95; https://doi.org/10.3390/w13010095
Submission received: 23 November 2020 / Revised: 15 December 2020 / Accepted: 29 December 2020 / Published: 4 January 2021
(This article belongs to the Section Hydrology)

Abstract

:
This study investigated the temporal patterns of annual and seasonal river runoff data at 13 hydrological stations in the Lake Issyk-Kul basin, Central Asia. The temporal trends were analyzed using the innovative trend analysis (ITA) method with significance testing. The ITA method results were compared with the Mann-Kendall (MK) trend test at a 95% confidence level. The comparison results revealed that the ITA method could effectively identify the trends detected by the MK trend test. Specifically, the MK test found that the time series percentage decreased from 46.15% in the north to 25.64% in the south, while the ITA method revealed a similar rate of decrease, from 39.2% to 29.4%. According to the temporal distribution of the MK test, significantly increasing (decreasing) trends were observed in 5 (0), 6 (2), 4 (3), 8 (0), and 8 (1) time series in annual, spring, summer, autumn, and winter river runoff data. At the same time, the ITA method detected significant trends in 7 (1), 9 (3), 6(3), 9 (3), and 8 (2) time series in the study area. As for the ITA method, the “peak” values of 24 time series (26.97%) exhibited increasing patterns, 25 time series (28.09%) displayed increasing patterns for “low” values, and 40 time series (44.94%) showed increasing patterns for “medium” values. According to the “low”, “medium”, and “peak” values, five time series (33.33%), seven time series (46.67%), and three time series (20%) manifested decreasing trends, respectively. These results detailed the patterns of annual and seasonal river runoff data series by evaluating “low”, “medium”, and “peak” values.

1. Introduction

Climate change affects regional water resources [1]. Water resources are an essential foundation for society’s sustainable development, the economy, and the ecological environment [2,3,4]. As a unique geographic component, the mountain area is the birthplace of most rivers in arid regions. Almost all rivers originate in the mountainous regions [5]. Central Asia’s water resources are mainly recharged by melting ice and snow in the mountainous areas, making them more sensitive to climate change [6,7,8]. Human activities have led to global environmental changes [9]. Due to population growth and disproportional spatial distribution, developing industries, agricultural expansion, and increased urban construction, there is increased pressure on water and other natural resources because the anthropogenic demand for water is growing [10]. The river runoff is one of the primary forms and components of water resources and the most critical water source for production and living [11,12]. Affected by climate variability and anthropogenic activities, the river runoff of many rivers worldwide has undergone significant changes, seriously threatening the state of regional water resources [13,14,15,16,17,18].
Under the influence of natural conditions such as climate and landforms, along with human activities, the evolution of river runoff obeys specific laws [19,20]. Anthropogenic activities such as river water intake, reservoir water storage, and cross-basin water transfer consume runoff and affect water resources’ spatiotemporal distribution of [21,22,23,24]. These activities also cause different degrees of spatiotemporal variation in the hydrological sequence of the Lake Issyk-Kul Basin [25], leading to inconsistencies and varying frequencies of the basin’s hydrological characteristics [26,27,28], which subsequently make the results of hydrology and water resource analysis subject to calculation deviations and distortions of hydrological laws [29]. Therefore, to further grasp the evolution of water resources in the basin, it is necessary to study the evolution of river runoff. In order to support water management, the first phase in determining the impact of the climate system on hydrology is to estimate the trends (direction and magnitude) of hydrological variables [30,31,32].
Trend analysis is used to evaluate the rate or direction of changes in a variable over a period of time [33,34]. Due to climate change, many researchers have paid great attention to trend identification and river runoff analysis over the past several decades [35,36]. Although there are classical trend identification methods, such as Sen’s slope Sen [37], regression analysis [38], Spearman’s rho [39], the Mann-Kendall (MK) trend test [40,41], and the others, these techniques search for monotonic trends as a whole within a given time. Atta-ur-Rahman and Dawood [42] used the Sen slope method to perform a spatial statistical analysis of temperature trends in northern Pakistan. Satanand, Saravanan [43] have developed runoff forecasting models that utilize data mining tools and regression analysis techniques. Sharma, Patel [44] employed Spearman’s Rho to investigate the long-term changes in river flows from 1973–2013 in the Tapi basin of west-central India. Research has revealed that the river basin’s river flow is generally decreasing, except for the Tapi River itself. This downward trend is primarily due to human activities, such as changes in land-use patterns. Wang, Peng [45] investigated the characteristics of runoff variations and the respective impacts of climate variability and anthropogenic activities on runoff variations from 1961–2015 in the five sub-basins of the Tapi Basin by applying several approaches, including Hurst exponent analysis, the MK trend test, and the cumulative anomaly method. These well-known trend techniques limit the possibility of partial trend interpretation, information extraction, and knowledge. However, to draw meaningful inferences from the hydrological time series trends, the development of robust methods that require less stringent assumptions remains a considerable challenge.
The innovative trend analysis (ITA) method with more information functions can illuminate future potential climate change impacts, planning, management, design, and research [46]. For the benefit of researchers, the ITA method is rapidly spreading around the world. It is being utilized to assess hydrometeorological trends [47,48,49,50,51] since it can objectively identify “low”, “medium”, and “peak” data series values visually, rather than identifying trends as a whole [52,53,54,55]. Trend research has been the focus of tremendous efforts by researchers in the past decade. Demir and Kisi [56] employed an innovative trend analysis method to determine the possible annual total precipitation trends in the Turkish provinces in Tokat, Ordu, Sinop, Corum, Samsun, and Amasya. Huang, Liu [57] applied the ITA method to investigate the water quality parameters’ temporal evolutionary laws at six different aquifers in the New Three coal mine. In Turkey, monthly streamflows in the Yesilirmak, Western Black Sea, and Eastern Black Sea basins were examined using observed data from nine stations, as reported by Kişi, Santos [58]. They concluded that trends of “low” and “peak” streamflow data could be identified by the ITA method, which has some advantages over Şen’s method and MK test. In England, Alashan [59] investigated the temporal variations of Maximum temperatures from 1853–2017 using a modified Mann-Kendall (MMK) approach, Sen’s slope estimator (SSE), an innovative trend analysis. This study indicated that MMK_ITA (modified Mann-Kendall_Innovative trend analysis) has a more substantial influence on serial correlation than MK and MMK_SSE. MMK_ITA can be used in trend calculations and is better than traditional methods, even when relying on time series.
As one of the crucial links in the water cycle, river runoff is affected by both climate (precipitation, temperature, evaporation) and human activities (projects involving the underlying surface, topography, and water conservancy, among others), and is highly complex, dynamic, and nonlinear [60,61]. Lake Issyk-Kul is an endorheic mountain lake [62]. Accordingly, climate change and human activities are affecting the lake’s surface runoff [63]. Many researchers have pointed out that surface runoff changes are the main driving factor in the water level fluctuations of Lake Issyk-Kul [64,65,66]. Exploring river runoff variability of in this endorheic lake basin is essential for developing sustainable water resources in the study area [67]. Still, there have been few studies on the characteristics of river runoff changes. To the best of our knowledge, there is no published research on the use of ITA of river runoff in the Lake Issyk-Kul Basin. Moreover, there are some deficiencies in the existing studies: (1) Most previous research focused on annual river runoff changes, while only a few investigations performed detailed analyses on monthly runoff changes; (2) The collected river runoff data durations have not been long, and the number of hydrological stations used in the studies has been limited; and (3) The “low”, “medium”, and “peak” trends of river runoff were not explored. Keeping the above reviews in mind, this study was conducted with the following specific objectives: (i) to analyze the temporal trend in seasonal and annual river runoff time series data using the MK test, Theil-Sen Median (TSM), and new ITA method with significance test; (ii) to compare the results of MK method with the new ITA.

2. Study Area and Data

2.1. Study Area

Lake Issyk-Kul (Figure 1) is an inland saltwater lake located in the basins of the Teskey Ala-Too Range and Kungey Ala-Too mountain ranges in the Western Tian Shan Mountains in northeastern Kyrgyzstan [68]. The center of the lake is 42.42° N, 77.33° E. Lake Issyk-Kul is 60.1 km from north to south and 178 km from east to west, with an area of 6236 km2. Its water storage capacity can reach 1730×108 m3, the perimeter of the lake shoreline is approximately 669 km, the average lake depth is 278.4 m, and the maximum lake depth is 702 m [64,69]. Among the world’s mountain lakes, Lake Issyk-Kul is second only to Lake Titicaca in South America in terms of area and ranks first of lake depth and lake water volume. The climate in the lake area is mild and dry. The average temperature in July is 15–25 °C, and the average temperature in January is −6 °C. The Lake Issyk-Kul drainage basin occupies a surface area of 22,080 km2, and there are 118 large and small rivers with a surface runoff of about 36.7 × 10⁸ m3 [62]. The main river flows are Chong-Koi-Suu, Cholpon-Ata, Chong-Ak-Suu, Ak-Suu, Chong-Uryukty, Pzhergalan, Ak-sai, Tossor, Ton, Dzhuuku, Tamga, Karakol, and Chong-Kyzyl-Su [63].
Lake Issyk-Kul is a closed inland lake with no outlet. Many rivers are used for irrigation before flowing into the lake, but rivers are not the only source of lake water. The annual surface water supply is 13 × 108 m3, and the annual total of precipitation and groundwater is 330 mm. The annual evaporation of the lake is 820 mm.

2.2. Data Sources

This paper obtained the monthly and annual time series data (river runoff, covering the 1943–2012 period) selected from 13 hydrological stations surrounding Lake Issyk-Kul, as shown in Figure 1. This study compiled observational data provided by the National Science & Technology Infrastructure Center-Data Sharing Infrastructure of Earth System Science and the Department of Water Resources and Irrigation of the Ministry of Agriculture and Land Reclamation of the Kyrgyz Republic and the National Statistical Committee of the Kyrgyz Republic [63]. In this study, data from the four prominent seasons—spring (March-April-May), summer (June-July-August), autumn (September-October-November), and winter (December-January-February)—were analyzed. Also, the trends of seasonal and annual data series. Table 1 lists the arithmetical evaluation results, including mean, maximum, minimum, standard deviation, kurtosis, and skewness of annual and seasonal river runoff time series (m3/s). These results indicate that the river runoff in spring and autumn generally exhibits positive skewness (the river runoff has a highly skewed distribution, e.g., Ton annually, Chong-Urykty in winter), and the annual river runoff also displays positive kurtosis.

3. Methodology

This study used the MK trend test [40,41] and selected the Şen’s trend method [46,55] to evaluate the annual and seasonal, temporal trends and features of the river runoff. The data analysis is developed in the DPS (Data Processing System) and SPSS (Statistical Product and Service Solutions) software. These methods are described in the following sections.

3.1. Trend Test

The MK trend test is a rank-based nonparametric test employed to detect significant trends in meteorological and hydrological time series [40,41]. The MK trend test statistic S is defined as:
S = i = 1 n 1 k = i + 1 n sgn ( x k x i )
where, xk is the rank of the kth observation, xi is the rank of the ith observations, n is the number of observations, and sgn (θ) = sign (sgn), recorded as sgn (xkxi) and measured as:
sgn ( θ ) = {     1 , θ > 0     0 , θ = 0 1 , θ < 0
Assuming that the series with sample size n ≥ 8 is the test statistic S, then if H0 is valid, S is approximately normally distributed, and P is the number of tied groups, and ti denotes the number of data values in the ith tied group (i = 1, 2, 3 … n). A tied group is a set of sample data having the same value. With variance var[S] computed as:
var [ S ] = [ n ( n 1 ) ( 2 n + 5 ) i = 1 p t i ( t i 1 ) ( 2 t i + 5 ) ] / 18
After calculating the var[S] of the data series, the standardized statistic Zc value is calculated using the following formula:
Z c = { S 1 var ( S ) , S > 0 0 , S = 0 S + 1 var ( S ) , S < 0
The standardized statistical Zc value follows the standard normal distribution (Z), with a variance of one (σ2 = 1) and a mean value of zero (µ = 0). The null hypothesis (H0) assumes the river runoff observations have no trend, while the alternate hypothesis (H1) assumes the river runoff data series have no trend. Therefore, under the two-sided condition, H0 and H1 are tested at a significant level (α): If |Z| > 2.58, the trend is significant at the confidence level of α = 99%; if |Z| > 1.96, the trend is significant at the confidence level of α = 95%. If ± Zc > ± Zα/2, then H1 is accepted, and H0 is rejected. A negative (positive) value of Zc indicates a downward (upward) trend in the observed data.

3.2. Innovative Trend Analysis Method

In this approach, a recorded observation time series is separated into two halves from the initial data to the final data, and the two sub-series are then sorted in ascending order. Based on the two-dimensional Cartesian coordinate system, the first half-series (xi) is located on the horizontal axis (x-axis), and the second half-series (xj) is located on the vertical axis (y-axis). The range of the two axes should be equal, as shown in Figure 2a. The 1:1 (45°) line divides the diagram into two similar triangles. If the data series accumulates on the 1:1 line, it is concluded that there is no trend (trendless). If the data series falls above the 1:1 line (upper triangular area), it can be assumed that the data series exhibits an upward trend. If the data series accumulates below the 1:1 line (lower triangular area), there is a downward trend in the time-series data [46,55]. Therefore, the variable domain of each semi-sequence can be classified into different patterns (“low”, “medium”, and “peak”). The scope of each group can be determined either qualitatively from experts’ opinions or quantitatively by dividing the range of change into subcategories. The closer the scatter points are to the 1:1 (45°) line, the weaker the trend slope [46,55].
The straight-line trend slope calculated by the following equation [46]:
s = 2 ( y ¯ 2 y ¯ 1 ) n
where s is the straight-line slope of the trend line represented by the ITA method; n is the number of data year; y 2 ¯ and y 1 ¯ are the arithmetic averages of the first half and the second half (y, sequence) of the dependent variable. Figure 2b is a graphical representation for understanding the concept of trend slope. As shown in Figure 2b, the substitution of the numerical values as n = 70 and the arithmetic averages from Figure 2b as y 2 ¯ = 36 and y 1 ¯ = 42 in to Equation (5), yields s = 2 × (36 − 42)/70 = −0.1714.
The standard deviation of sampling slope is defined as:
σ s 2 = 8 n 2 σ 2 n ( 1 ρ y ¯ 1 ρ y ¯ 2 )
The standard deviation of the sampling slope is σ s ; the standard deviation of whole the time series is σ , and ρ y 1 ¯ y 2 ¯ is the correlation coefficient between the ascendingly sorted two halves arithmetic averages calculates as:
ρ y ¯ 1 ρ y ¯ 2 = E ( y ¯ 1 y ¯ 2 ) E ( y ¯ 1 ) E ( y ¯ 2 ) σ y ¯ 1 σ y ¯ 2
Finally, the lower and upper confidence limits (CL) of a standard normal PDF with zero mean and standard deviation are scri, then the confidence limits (CL) of the trend slope at the α level of significance are calculated by applying the following equation [70]:
C L 1 a = 0 ± s c r i × σ s
where CL represents the lower and upper confidence limits at α level of significance; s is the slope value, and σ s is the standard deviation of sampling slope. A negative (positive) value of s indicates a decreasing (increasing) trend in the data points.

4. Results and Analysis

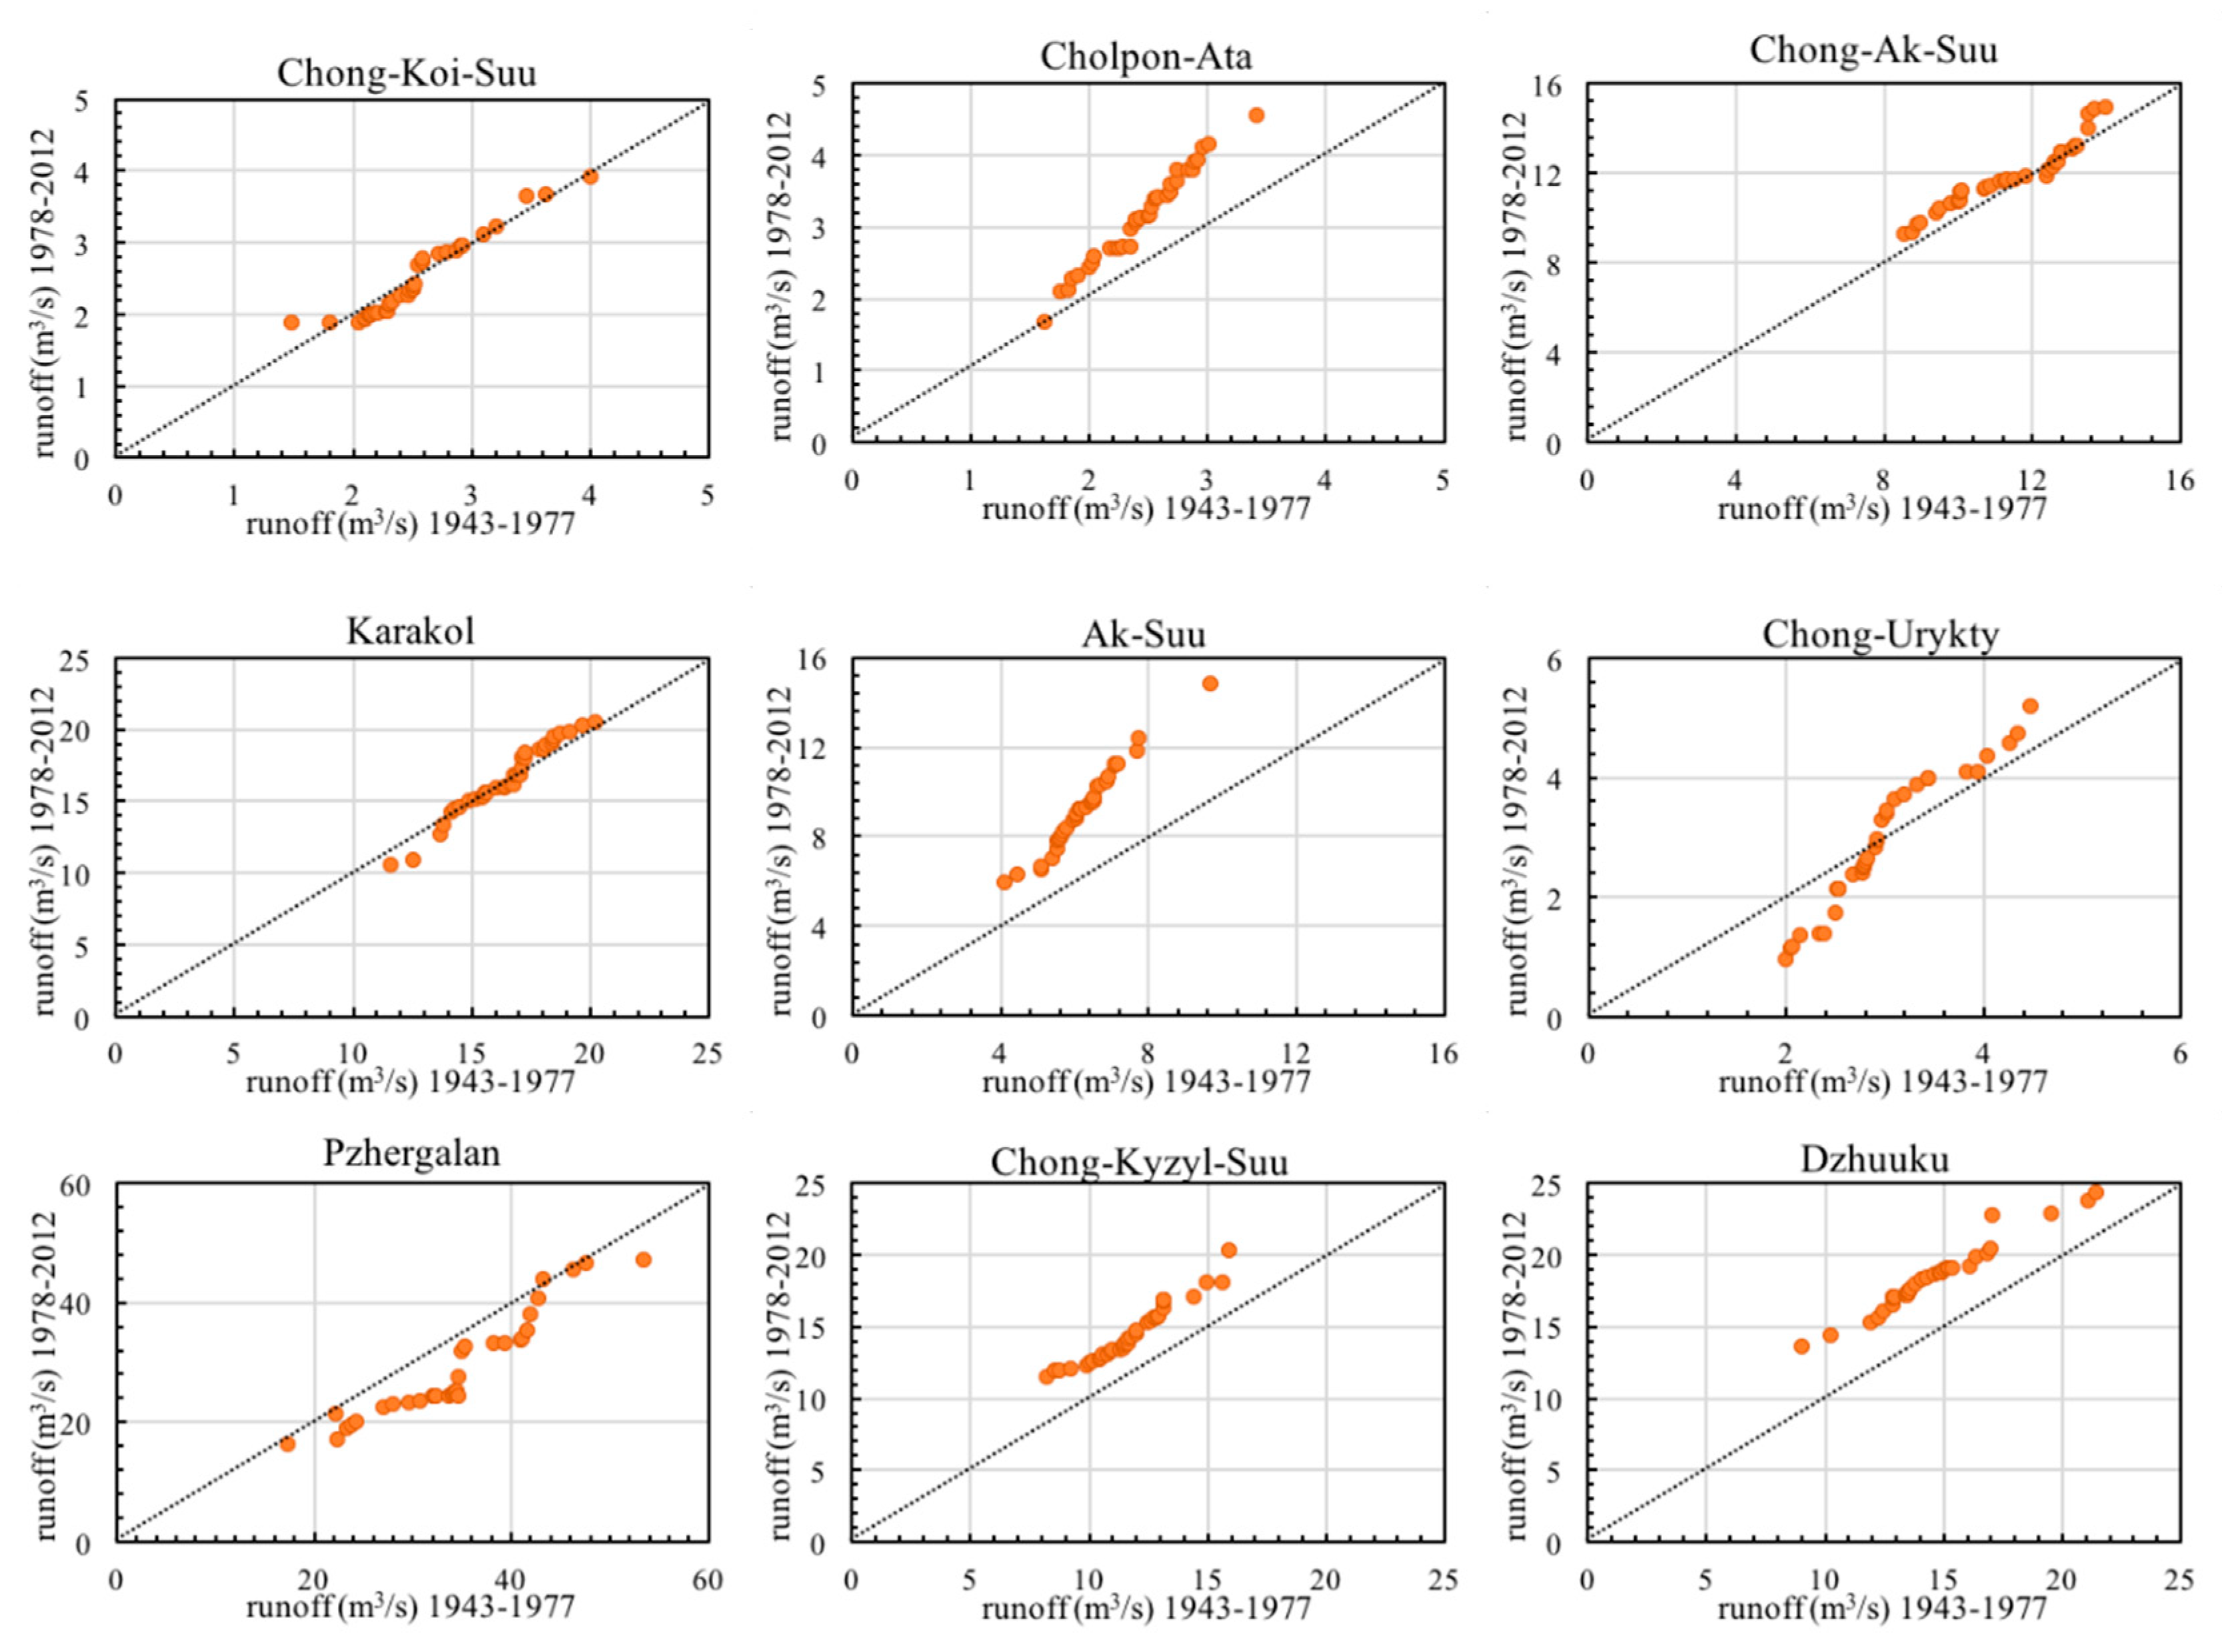
4.1. Trend Variations of Annual River Runoff in the Lake Issyk-Kul Basin

This study used the annual river runoff data from 1943–2012 at the 13 hydrological stations in the Issyk-Kul Basin to evaluate the annual and seasonal trends by employing the MK test and TSM, as presented in Table 2. These results show that the magnitudes of the trends at most of the selected river stations were positive (with the exceptions of the Pzhergalan and Tossor stations) and varied from 0.001–0.031 m3/s. Notably, the stations in the northern portion of the study area (i.e., Chong-Koi-Suu, Cholpon-Ata, Ak-Suu, Chong-Urykty, and Chong-Ak-Suu) exhibited large slopes (the mean slope was 0.011 m3/s). In contrast, the stations in the basins’ southeastern parts (i.e., Pzhergalan, Karakol, Chong-Kyzyl-Suu, and Dzhukuu) displayed higher slopes (the mean absolute slope was 0.028 m3/s).
The southern parts of the basin (i.e., Ak-Sai, Ton, Tossor, and Tamga) mainly presented weak slopes (from −0.007 m3/s to 0.007 m3/s, with a mean absolute slope of 0.0075 m3/s). As for the MK trend test, the positive values were more dominant. At Ak-Suu, Chong-Koi-Suu, Chong-Urykty, Chong-Kyzyl-Suu, and Ton stations (38.5%), exhibiting statistically significant trends were shown at the α = 99% confidence level, confirming the results of the TSM. No significant negative trends were found at the Pzhergalan and Dzhuuku stations (Zc = −1.93 and Zc = −1.03, respectively), comprising 15.4% of the 13 stations. All other stations (i.e., Cholpon-Ata, Chong-Ak-Suu, Karakol, Ak-sai, Tossor, and Tamga, comprising 46.1%) displayed no significant positive trends.
After the MK test, the annual river runoff trends were determined by applying the ITA method, as listed in Table 3. It can be seen from this table that the slope (s) of yearly river runoff was dominated by positive values, i.e., Cholpon-Ata (0.74), Chong-Ak-Suu (0.83), Ak-Suu (3.73), Chong-Koi-Suu (1.98), Chong-Urykty (0.51), Chong-Kyzyl-Suu (3.67), Dzhuuku (3.55), Ak-Sai (1.93), Ton (2.83), and Tamga (1.52). Meanwhile, negative trends were found at Pzhergalan (−4.71), Karakol (−0.19), and Tossor (−0.18). These results imply that some decreasing trends ignored by the MK trend test can be detected by the ITA method, verifying its ability to detect the hidden patterns in data series. The ITA method’s graphical results for all 13 stations from 1943–2012 are presented in Figure 3. The increasing tendency of annual river runoff at most stations is indicated by the data points falling above the 1:1 (45°) line in the Cartesian coordinate system.

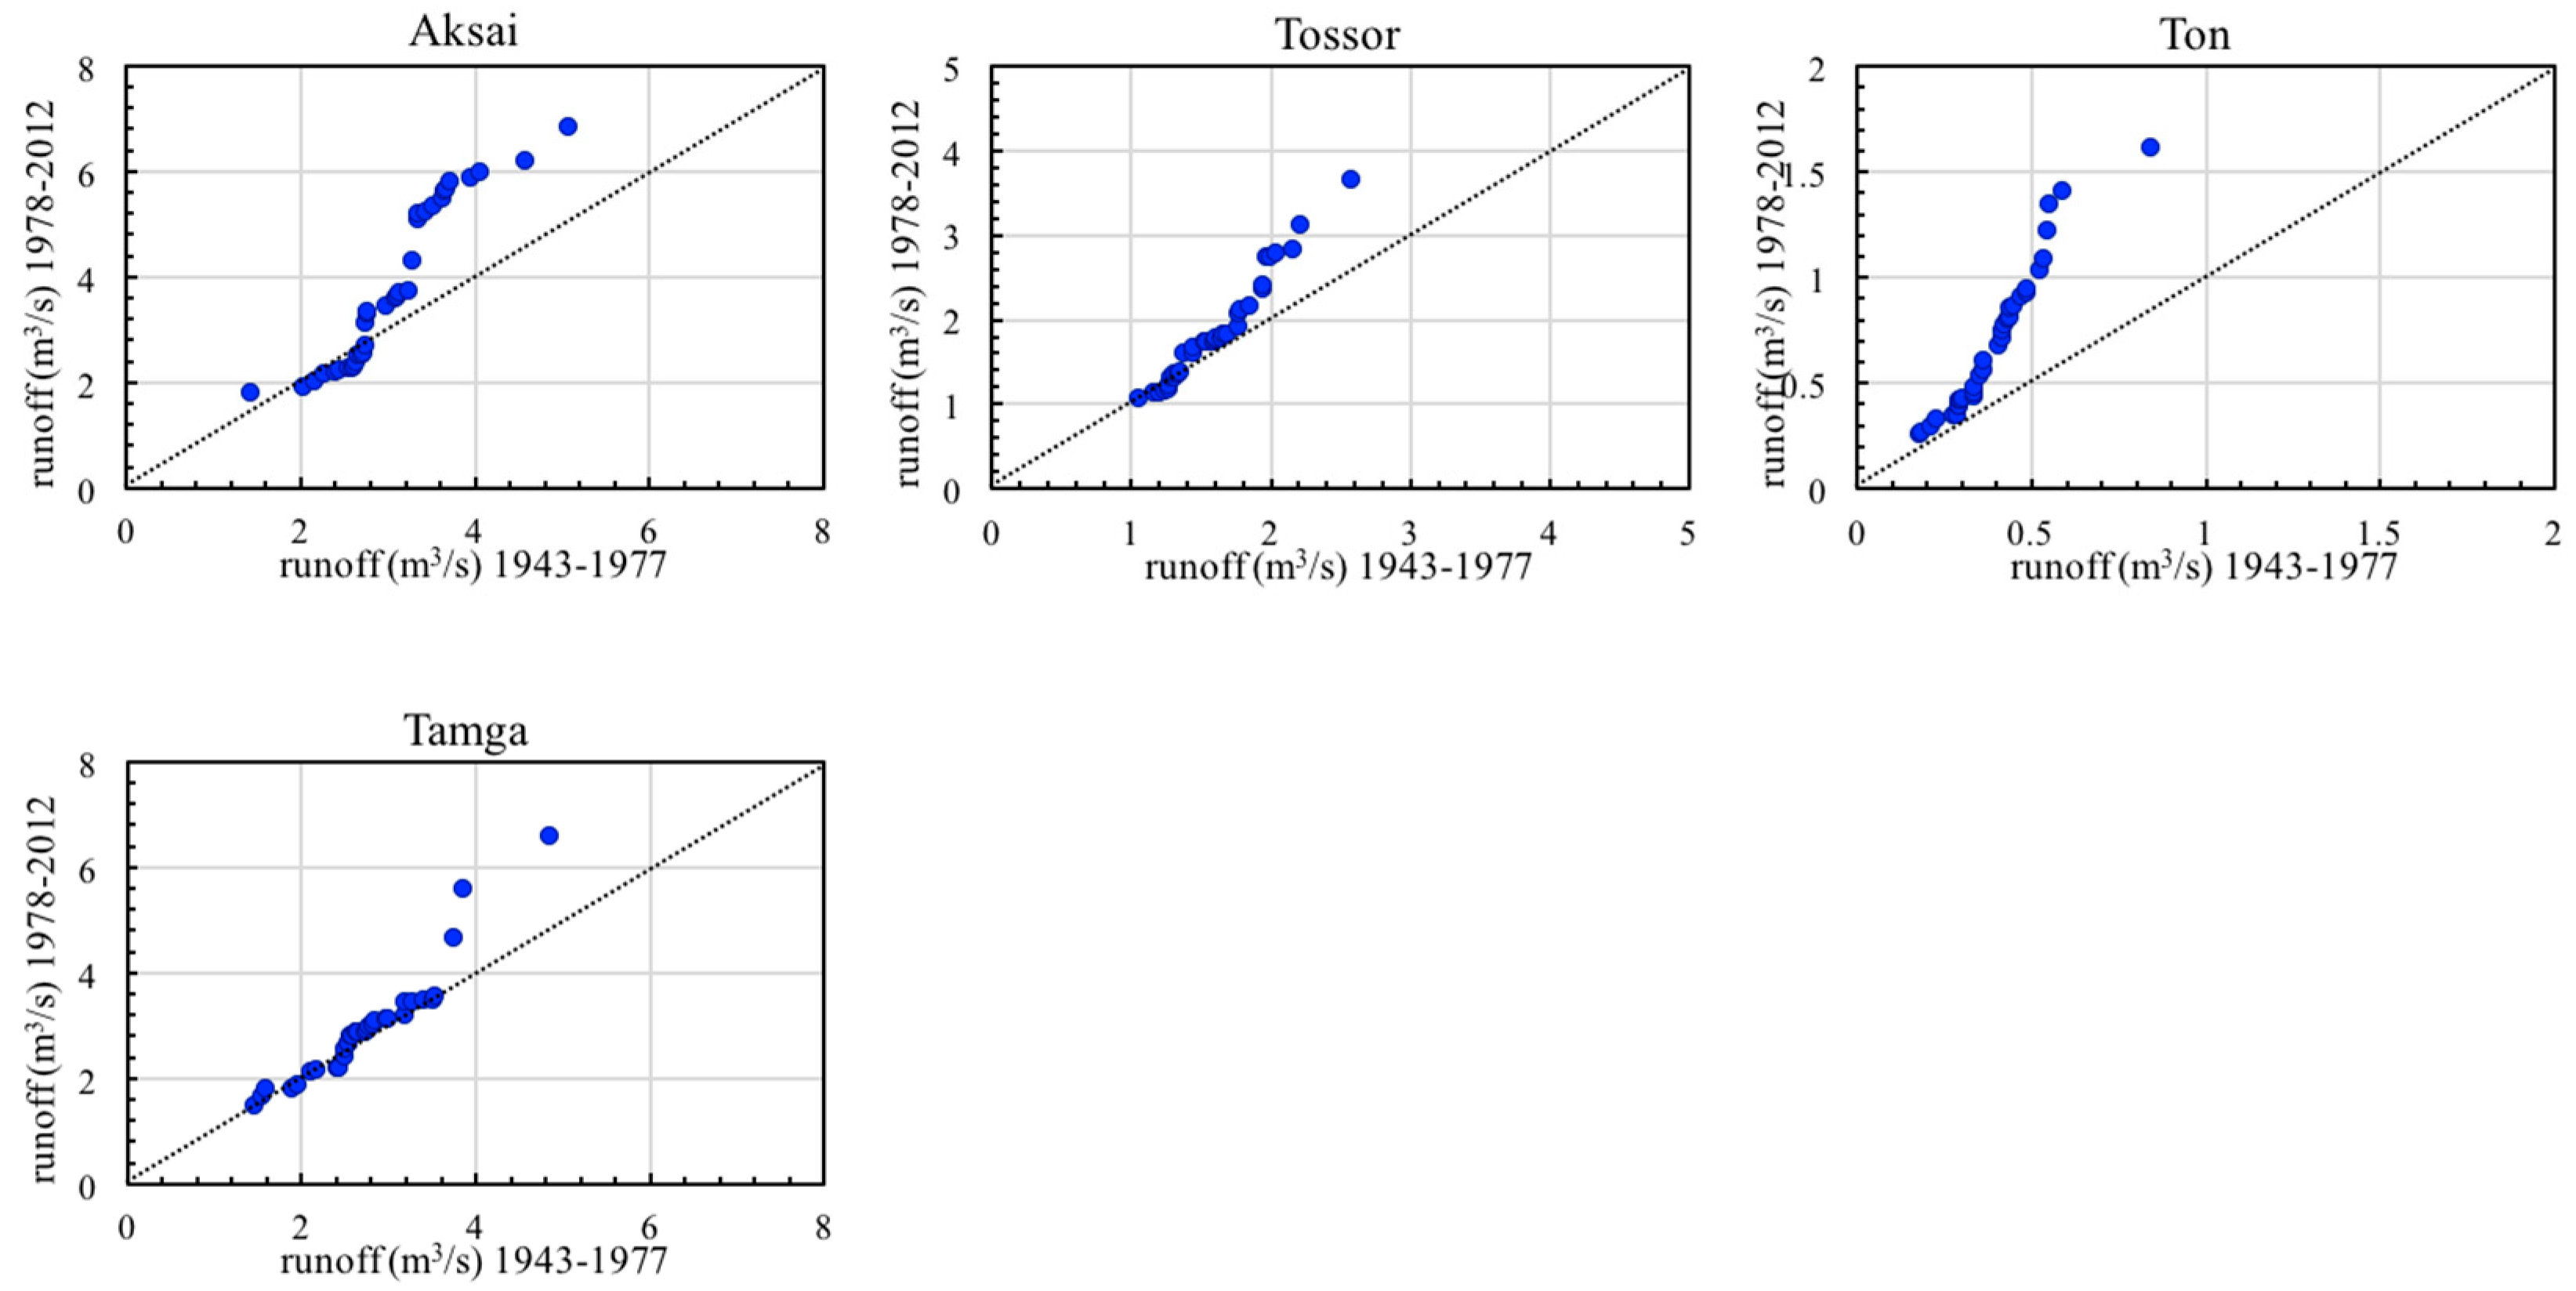
4.2. Trend Variations of Spring River Runoff in the Lake Issyk-Kul Basin

The river runoff trends in the spring season were identified using the classical MK trend test and TSM, and the test statistics are summarized in Table 2. These findings demonstrate that the river runoff was dominated by positive trends, with seven stations, namely Ak-Suu (Zc = 4.95), Chong-Koi-Suu (Zc = 6.57), Chong-Kyzyl-Su (Zc = 5.94), Ton (Zc = 5.90), Cholpon-Ata (Zc = 2.42), Ak-sai (Zc = 2.00), and Dzhuuku (Zc = 2.38) (53.8%) exhibiting significant increasing trends. In comparison, significant negative trends were found at Tossor (Zc = −2.02) and Tamga (Zc = −2.02) (15.4% of the 13 stations).
After applying the MK trend test, the ITA method was used for the spring season for river runoff. The test results are listed in Table 4. The ITA results indicated nine stations (Cholpon-Ata, Ak-Suu, Chong-Koi-Suu, Chong-Uryukty, Chong-Kyzyl-Su, Dzhuuku, Ak-sai, Tossor, and Ton) exhibited significant positive trends. In comparison, three stations (Chong-Ak-Suu, Pzhergalan, and Tamga) displayed significant negative trends. Still, employing the MK trend test, the values had both negative and positive directions. The graphical ITA results for all the 13 river stations during the spring seasons from 1943–2012 are presented in Figure 4. As can be seen from this figure, for Tossor and Karakol, most of the data points for the spring season runoff fell on the no-trend line.

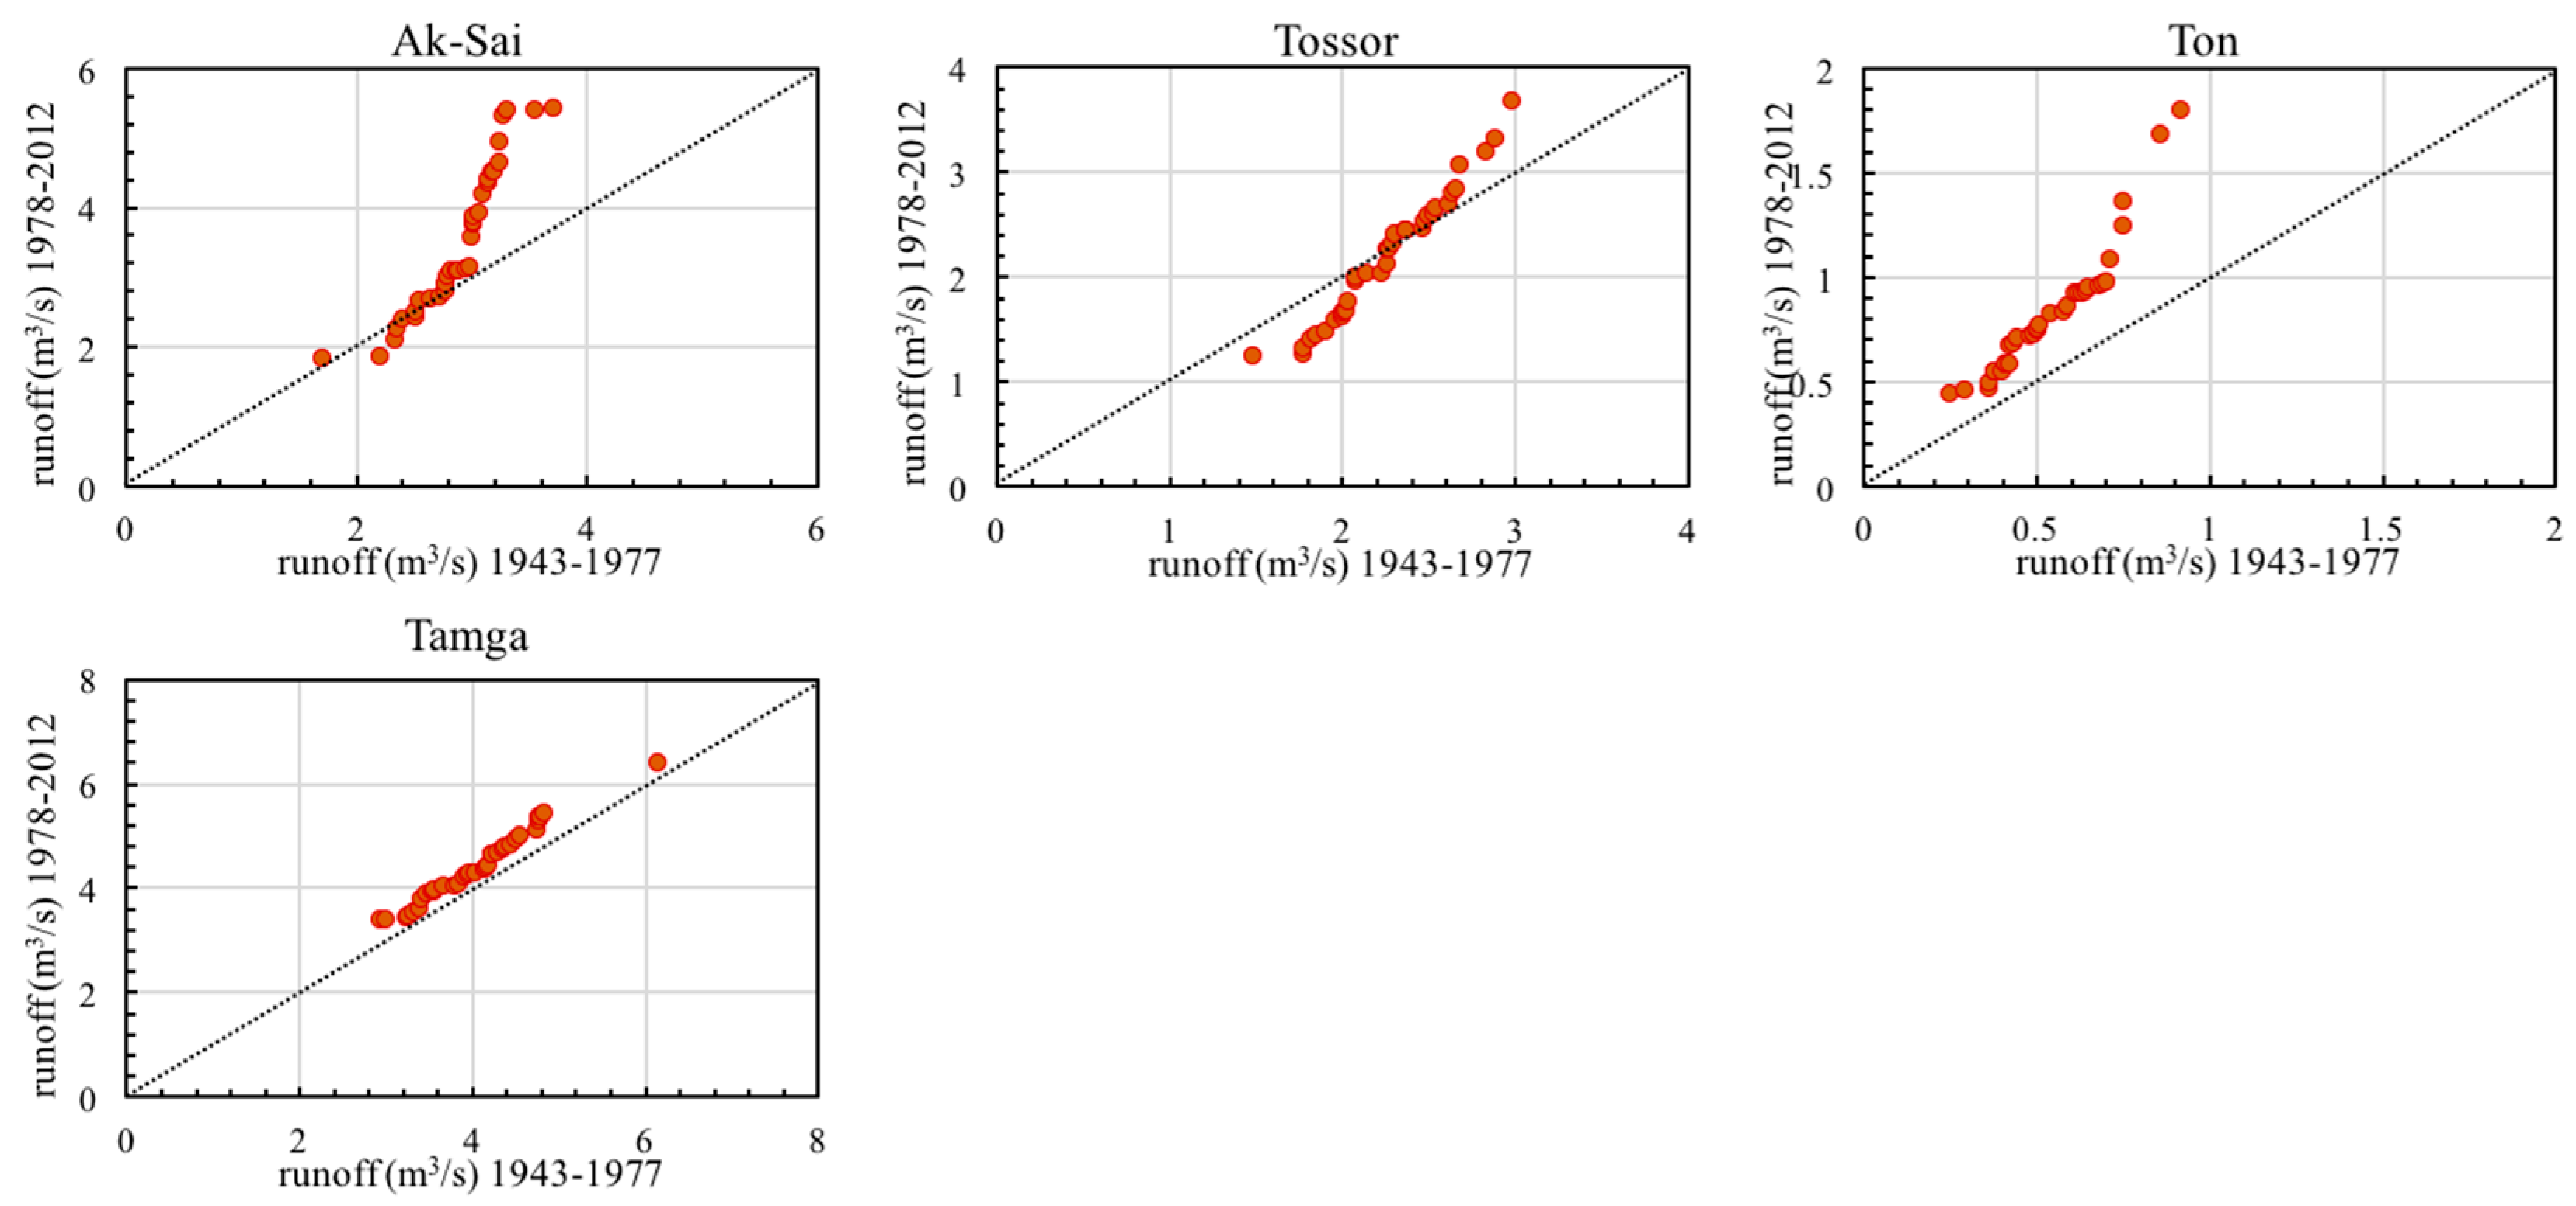
4.3. Trend Variations of Summer River Runoff in the Lake Issyk-Kul Basin

The MK trend test and TSM statistics obtained for the summer season river runoff are listed in Table 2. As can be seen from this table, three stations exhibited significant negative trends—Pzhergalan (Zc = −2.22), and Chong-Kois-Suu (Zc = −2.01) at the 95% level, and the Tossor (Zc = −3.81) station at the 99% level. Meanwhile, significant positive values were dominant at for four stations (30.8%)—Cholpon-Ata (Zc = 5.33), Ak-Suu (Zc = 5.49), Chong-Kyzyl-Suu (Zc = 5.00), and Dzhuuku (Zc = 5.33)). Table 4 also summarizes the ITA test values of all 13 stations, which revealed that the positive values of the ITA slope (s) predominated, which only three stations—Pzhergalan, Karakol, and Dzhuuku—exhibiting negative values. The graphical ITA results for all 13 river stations during the summer seasons from 1943–2012 are illustrated in Figure 5.

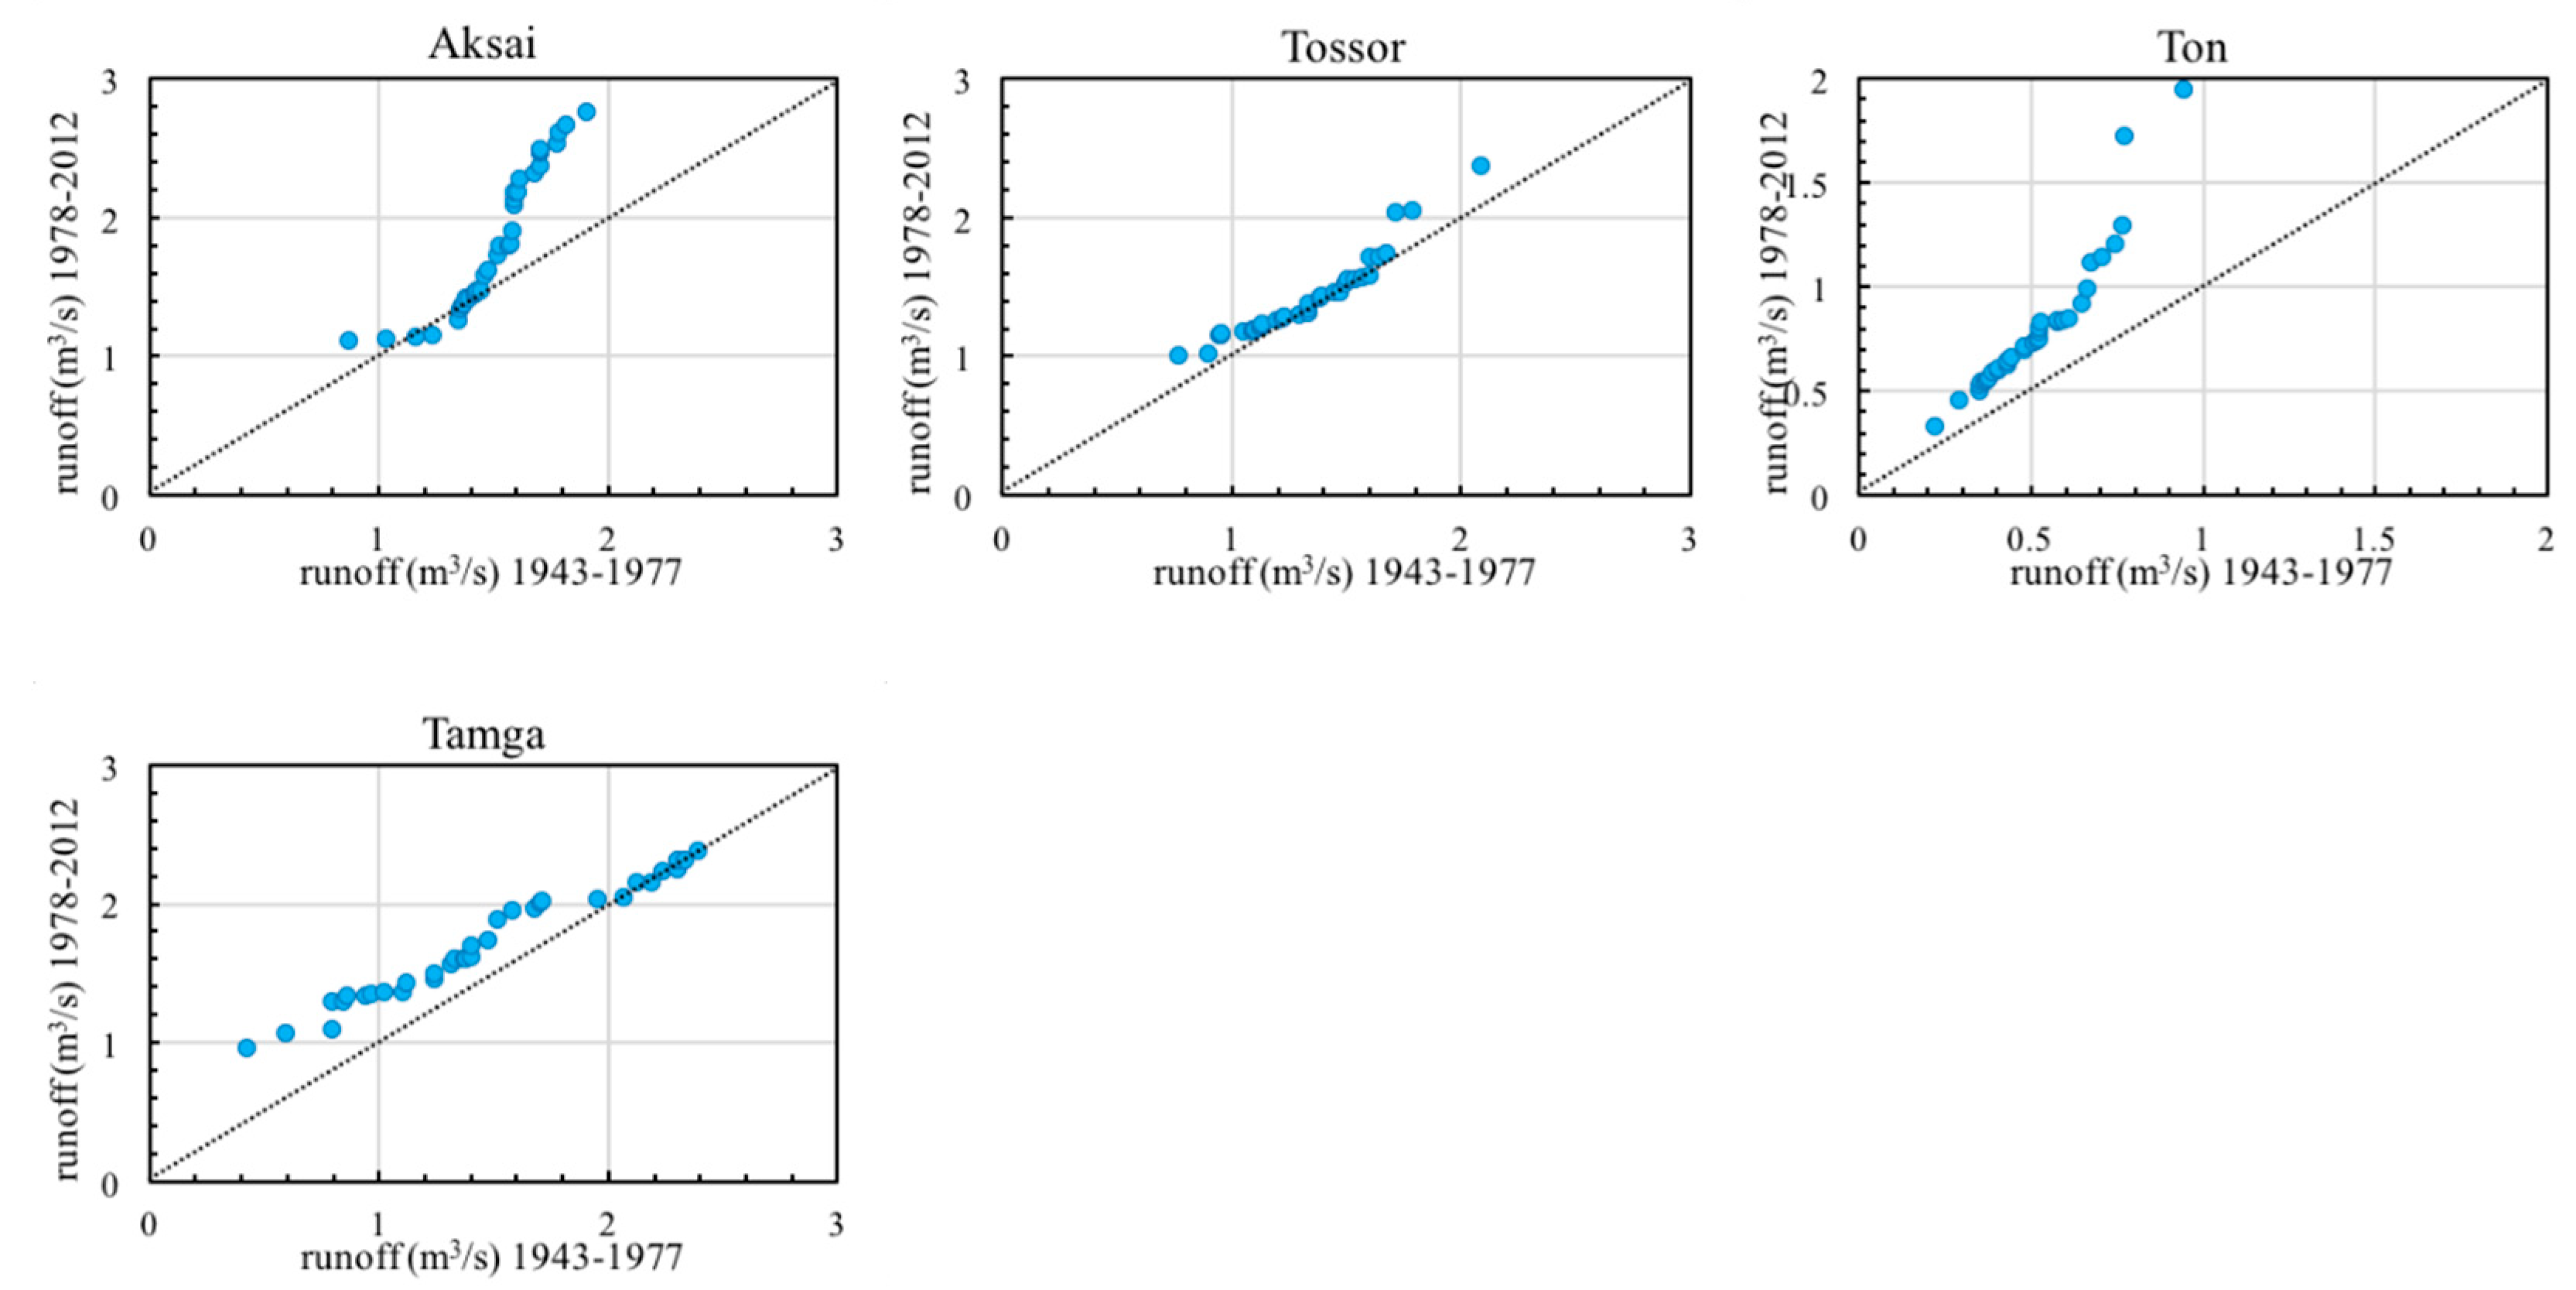
4.4. Trend Variations of Autumnr River Runoff in the Lake Issyk-Kul Basin

Table 2 summarizes the MK test statistics obtained for the autumn river runoff. As illustrated by these results, the positive values were more dominant, and some were statistically significant at the 99% confidence level. Specifically, significant positive trends were found at Cholpon-Ata (Zc = 3.31), Chong-Ak-Suu (Zc = 2.81), Ak-Suu, (Zc = 4.99), Chong-Koi-Suu (Zc = 6.37), Chong-Urykty (Zc = 3.26), Chong-Kyzyl-Suu (Zc = 6.10), Dzhuuku (Zc = 4.18), and Ton (Zc = 5.48) (61.5%), mainly scattered on the northern rivers of the Lake Issyk-Kul Basin. The summer river runoff trends were similar to the annual river runoff results due to the concentrated river runoff during summer in this region. The value at Karakol (Zc = 1.95) was also very close to the positive significance limit (Zc = 1.96). Besides, the ITA values are provided in Table 4 and graphically illustrated in Figure 6. As shown in Table 4, the positive values of slope (s) were predominated, with negative trends only found at Pzhergalan, Karakol, Tossor, and Tamga.

4.5. Trend Variations of Winter River Runoff in the Lake Issyk-Kul Basin

The MK test statistics computed for winter river runoff are listed in Table 2. These results revealed that, significant positive trends were found at nine stations (69.23%), including Pzhergalan (Zc = 6.10), Ak-Suu (Zc = 5.39), Chong-Koi-Suu (Zc = 6.10), Chong-Kyzyl-Suu (Zc = 6.28), Tossor (Zc = 3.44), Ton (Zc = 8.14), Chong-Urykty (Zc = 3.34) at the 99% level, and the Chong-Ak-Suu (Zc = 2.43) and Ak-Sai (Zc = 6.28) stations at the 95% level. In contrast, a significant negative trend was detected at Dzhuuku (Zc = −2.54) at the 95% level. The value of Cholpon-Ata (Zc = 1.90) was close to the positive significance limit (Zc = 1.96). The other two stations (Karakol and Tamga) exhibited negative trends, but neither was significant.
These results indicate that the increasing annual river runoff trends at most stations were mainly due to river runoff in autumn and winter. It is worth noting that, with the exceptions of Dzhuuku, Karakol, and Tamga, winter river runoff at all stations displayed significant increasing trends. The ITA results for all 13 river stations are graphically illustrated in Figure 7 and summarized in Table 4. Negative trends were identified at Chong-Koi-Suu and Chong-Urykty, while all other stations showed positive tendencies.

4.6. Comparison of Trend Analysis Methods

Verify the reliability of the seasonal and annual river runoff trends in the study area, the ITA method (Table 3 and Table 4), and two well-known methods of TSM and MK trend test (Table 2) were used. According to the temporal distribution of the MK test, significantly increasing (decreasing) trends were observed in 5 (0), 6 (2), 4 (3), 8 (0), and 8 (1) time series in annual, spring, summer, autumn, and winter river runoff data. At the same time, the ITA method detected significant trends in 7 (1), 9 (3), 6(3), 9 (3), and 8 (2) time series in the study area. The significant positive and negative trends of the seasonal and annual river runoff datasets were found to display similar decreases from north to south using either the ITA method (39.2% to 29.4%; Table 3 and Table 4) or the MK trend test (46.15% to 25.64%; Table 2). Corresponding graphs of these results are displayed in Figure 3, Figure 4, Figure 5, Figure 6 and Figure 7. For the summer and winter seasons, the data series (orange and yellow points) of most hydrological stations fell above the 1:1 (45°) line (Figure 5 and Figure 7, respectively).
Besides, in Figure 8, the analysis of the ITA results (Figure 8f–j,l) has compared with the MK trend test (Figure 8a–e,k). Among the 65 annual (13 gauging stations annual data series) and seasonal data series (13 gauging stations spring, summer, autumn, and winter data series) studied, significant trends of 39 data series (60%) were found through the MK trend test. However, using the ITA method, 51 data series (78.46%) showed a significant trend. All significant trends identified by the MK trend test can also be detected by the ITA method. It can be seen from Figure 8a–e,k and Figure 8f–j,l that the trend results of the MK trend test and ITA in the spring, summer, winter, and annual runoff series are similar. However, the ITA method can be used to effectively identify many significant trends that cannot be identified by the MK trend test (especially in spring and autumn). It should be said that the ITA method is beneficial for analyzing many hidden changing trends of river runoff data series in the study area.
Table 5 summarizes the results of the ITA method for “low”, “medium”, and “peak.” As presented in Table 5, the “low”, “medium”, and “peak” values of all 13 river stations were individually evaluated by the ITA method. As provided in Table 2, there is trendless (no trend) in annual and seasonal data series according to the MK test, but increasing and decreasing trends are seen with the ITA method (Table 5). The ITA method results revealed that increasing trends occurred in 89 of the 195 data series at the 13 hydrological stations (45.64%), while decreasing trends were found in 15 data series (7.69%). In comparison, 24 data series (26.97%) exhibited increasing patterns for “peak” river runoff, 25 data series (28.09%) displayed increasing patterns for “low” river runoff, and 40 data series (44.94%) showed increasing patterns for “medium” river runoff. According to the “low”, “medium”, and “peak” river runoff, five data series (33.33%), seven data series (46.67%), and three data series (20%) manifested downward trends, respectively. These results provided detailed information concerning the annual and seasonal river runoff patterns by evaluating the “low”, “medium”, and “peak” values.

5. Discussion

The change of river runoff characteristics has always been the focus and hotspot of hydrological and water resource scientific research. In this study, the ITA method presented by Şen [46] was applied at annual and seasonal time series recorded from 13 hydrological stations (Figure 1) surrounding the lake Issyk-Kul. The river is the product of climate. Suppose the weather station data describes the climatic characteristics of different locations. In that case, the river flow describes the interaction between precipitation and temperature in the river catchment area on a larger scale [71].
River discharge is determined by rainfall, which falls in the catchment area, and by evaporation, which depends on air temperature [72,73]. As reported by Alifujiang, Abuduwaili [74], the ITA method’s application at three sites in the Issyk-Kul Basin revealed that the precipitation exhibited significant increasing trends in summer and winter. Moreover, utilization of the MK trend test and ITA method demonstrated that the percentage of time series with significant positive trends of monthly precipitation was decreased from north to south by Alifujiang.et.al [74]. This study revealed that in the summer and winter seasons, the data series of most hydrological stations fell above the 1:1 (45°) line. The significant positive and negative trends of the seasonal and annual river runoff datasets were found to display similar decreases from north to south using either the ITA method or the MK trend test, both of which indicated that river runoff is affected by precipitation. Thus, external hydrological cycle processes mainly determine the precipitation in the Issyk-Kul Basin [66].
Rivers that are mainly supplied by glacial meltwater generally have a significant increase in runoff during the summer (from June to September), with more floods during the flood season and an increase in annual runoff [5]. According to the origin of Lake Issyk-Kul, there are four types of rivers, and most of the rivers are glacial-snow type [75]. Thus, some measures should take in the summer that is vulnerable to high floods in the future. For the Lake Issyk-Kul basin, the river stations on those 13 rivers are located above the water withdrawal to irrigation. Alymkulova, Abuduwaili [65] pointed out that agricultural water demand increased in summer (from May to July or August), while in October, it rises again. Our results showed most of the river stations have an increasing trend in summer. The results revealed that the time of the high volume of water intake is not under decreasing river runoff.

6. Conclusions

In this study, to verify the reliability of the seasonal and annual river runoff trends in the Lake Issyk-Kul basin, Central Asia, the ITA method and the well-known method of MK trend test were used. The ITA method can be used to effectively identify many significant trends that cannot be determined by the MK trend test. It should be said that the ITA method is beneficial for analyzing many hidden changing trends of river runoff data series in the study area. The conclusions as follows:
(1)
The MK trend test results show that in 39-time series, there were significant positive and negative trends (among them, northern river in 18-time series, south-eastern rivers in 11-time series, southern rivers in 10-time series) on seasonal and annual river runoff.
(2)
The ITA method results revealed that in 51-time series (in which the stations of the northern part of the lake basin in 20-time series, south-eastern parts in 16-time series, and southern regions in 15-time series), there were significant positive and negative trends on seasonal and annual river runoff. Specifically, the MK test found that the time series percentage decreased from 46.15% in the north to 25.64% in the south, while the ITA method revealed a similar rate of decrease, from 39.2% to 29.4%.
(3)
According to the temporal distribution of the MK test, significantly increasing (decreasing) trends were observed in 5 (0), 6 (2), 4 (3), 8 (0), and 8 (1) time series in annual, spring, summer, autumn, and winter river runoff data. At the same time, the ITA method detected significant trends in 7 (1), 9 (3), 6(3), 9 (3), and 8 (2) time series in the study area. The comparison results revealed that the ITA method could effectively identify the trends detected by the MK trend test.
(4)
According to the ITA method, the “peak” values of 24 time series (26.97%) exhibited increasing patterns, 25 time series (28.09%) displayed increasing patterns for “low” values, and 40 time series (44.94%) showed increasing patterns for “medium” values. According to the “low”, “medium”, and “peak” values, five time series (33.33%), seven time series (46.67%), and three time series (20%) manifested decreasing trends, respectively. These results detailed the patterns of annual and seasonal river runoff data series by evaluating “low”, “medium”, and “peak” values.

Author Contributions

The research article is the joint work with five authors, J.A. designed the experiments, and Y.A. analyzed the trends of river runoff variability by employing Şen’s method and wrote the manuscript. Y.G. helped to review and prepare this paper for publication. All authors have read and agreed to the published version of the manuscript.

Funding

This research was funded by West Light Foundation of Chinese Academy of Sciences (2017-XBQNXZ-B-012), National Natural Science Foundation of China (Grant No. U1603242) and. supported by a grant from the Xinjiang University Fund (BS180245) for Distinguished Young Scholars.

Institutional Review Board Statement

Not applicable.

Informed Consent Statement

Not applicable.

Data Availability Statement

All data used in this study are available on the State Key Laboratory of Desert and Oasis Ecology, Xinjiang Institute of Ecology and Geography Chinese Academy of Sciences, the Department of Water Resources and Irrigation, Ministry of Agriculture and Land Reclamation of the Kyrgyz Republic, and the National Science & Technology Infrastructure Center-Data Sharing Infrastructure of Earth System Science [63,74].

Acknowledgments

We thank the Department of Water Resources and Irrigation, Ministry of Agriculture and Land Reclamation of the Kyrgyz Republic for the provision of data.

Conflicts of Interest

The authors declare that there is no conflict of interests regarding the publication of this paper.

References

  1. Rasool, S.I. Climate change, global change: What is the difference? Eos Trans. Am. Geophys. Union. 2013, 69, 668. [Google Scholar] [CrossRef]
  2. Lin, N.-F.; Tang, J.; Han, F.-X. Eco-environmental problems and effective utilization of water resources in the Kashi Plain, western Terim Basin, China. Hydrogeol. J. 2001, 9, 202–207. [Google Scholar] [CrossRef]
  3. Ji, X.; Kang, E.; Chen, R.; Zhao, W.; Zhang, Z.; Jin, B. The impact of the development of water resources on environment in arid inland river basins of Hexi region, Northwestern China. Environ. Geol. 2006, 50, 793–801. [Google Scholar] [CrossRef]
  4. Michel-Guillou, E. Water resources and climate change: Water managers’ perceptions of these related environmental issues. J. Water Clim. Chang. 2015, 6, 111–123. [Google Scholar] [CrossRef]
  5. Chen, Y.N.; Li, Z.; Fang, G.H.; Deng, H. Impact of climate change on water resources in the Tianshan Mountians, Central Asia. Acta Geogr. Sin. 2017. [Google Scholar] [CrossRef]
  6. Deng, H.; Chen, Y.; Wang, H.; Zhang, S. Climate change with elevation and its potential impact on water resources in the Tianshan Mountains, Central Asia. Glob. Planet. Chang. 2015, 135, 28–37. [Google Scholar] [CrossRef]
  7. Abuduwaili, J.; Issanova, G.; Saparov, G. Water Resources and Impact of Climate Change on Water Resources in Central Asia. In Hydrology and Limnology of Central Asia; Springer: Singapore, 2018; pp. 1–9. [Google Scholar]
  8. Bernauer, T.; Siegfried, T. Climate change and international water conflict in Central Asia. J. Peace Res. 2012. [Google Scholar] [CrossRef] [Green Version]
  9. Yang, K.; Teng, M.; Luo, Y.; Zhou, X.; Zhang, M.; Sun, W.; Li, Q. Human activities and the natural environment have induced changes in the PM 2.5 concentrations in Yunnan Province, China, over the past 19 years. Environ. Pollut. 2020, 265, 114878. [Google Scholar] [CrossRef]
  10. Kehl, J. The Great Lapse: Climate Change, Water Resources and Economic Risks in the Great Lakes. J. Water Resour. Prot. 2018, 10, 1106–1114. [Google Scholar] [CrossRef] [Green Version]
  11. Wang, Y.Q.; Yuan, Z.; Xu, J.J.; Yan, B.; Hong, X.F. Research on the attribution identification of source runoff variation in the Yellow River Source Region based on water and energy balance model. IOP Conf. Ser. Earth Environ. Ser. 2019, 344, 012122. [Google Scholar] [CrossRef]
  12. Meresa, H.; Gatachew, M.T. Climate change impact on river flow extremes in the Upper Blue Nile River basin. J. Water Clim. Chang. 2018, 10, 759–781. [Google Scholar] [CrossRef]
  13. Wu, Y.; Zhong, P.-A.; Xu, B.; Zhu, F.; Ma, B. Changing of flood risk due to climate and development in Huaihe River basin, China. Stoch. Environ. Res. Risk Assess. 2017, 31, 935–948. [Google Scholar] [CrossRef]
  14. Ling, H.; Xu, H.; Fu, J. Changes in intra-annual runoff and its response to climate change and human activities in the headstream areas of the Tarim River Basin, China. Quat. Int. 2014, 336, 158–170. [Google Scholar] [CrossRef]
  15. Liu, Z.; Cuo, L.; Li, Q.; Liu, X.; Ma, X.; Liang, L.; Ding, J. Impacts of Climate Change and Land Use/Cover Change on Streamflow in Beichuan River Basin in Qinghai Province, China. Water 2020, 12, 1198. [Google Scholar] [CrossRef] [Green Version]
  16. Yang, F.; Xue, L.; Wei, G.; Chi, Y.; Yang, G. Study on the dominant causes of streamflow alteration and effects of the current water diversion in the Tarim River Basin, China. Hydrol. Process. 2018, 32, 3391–3401. [Google Scholar] [CrossRef]
  17. Wu, F.; Zhan, J.; Su, H.; Yan, H.; Ma, E. Scenario-Based Impact Assessment of Land Use/Cover and Climate Changes on Watershed Hydrology in Heihe River Basin of Northwest China. Adv. Meteorol. 2015, 2015, 1–11. [Google Scholar] [CrossRef] [Green Version]
  18. Chen, Z.; Chen, Y.; Li, B. Quantifying the effects of climate variability and human activities on runoff for Kaidu River Basin in arid region of northwest China. Theor. Appl. Clim. 2012, 111, 537–545. [Google Scholar] [CrossRef]
  19. Zhu, Y.J.; Guo, C.Q.; Huang, X.K. Change of precipitation and runoff at Wuzhou station on Xijiang River under influence of climate changes and human activities. J. China Hydrol. 2010, 30, 50–55. [Google Scholar]
  20. Wang, S.; Ling, L.I.; Yan, M. The contributions of climate change and human activities to the runoff yield changes in the middle Yellow River Basin. Geogr. Res. 2013, 32, 395–402. [Google Scholar]
  21. Huo, Z.; Feng, S.; Kang, S.; Li, W.; Chen, S. Effect of climate changes and water-related human activities on annual stream flows of the Shiyang river basin in arid north-west China. Hydrol. Process. 2008, 22, 3155–3167. [Google Scholar] [CrossRef]
  22. Dong, W.; Cui, B.; Liu, Z.; Zhang, K. Relative effects of human activities and climate change on the river runoff in an arid basin in northwest China. Hydrol. Process. 2008, 28, 4854–4864. [Google Scholar] [CrossRef]
  23. Kong, D.; Miao, C.; Wu, J.; Duan, Q. Impact assessment of climate change and human activities on net runoff in the Yellow River Basin from 1951 to 2012. Ecol. Eng. 2016, 91, 566–573. [Google Scholar] [CrossRef]
  24. Liang, J.; Liu, Q.; Zhang, H.; Li, X.; Qian, Z.; Lei, M.; Li, X.; Peng, Y.; Li, S.; Zeng, G. Interactive effects of climate variability and human activities on blue and green water scarcity in rapidly developing watershed. J. Clean. Prod. 2020, 265, 121834. [Google Scholar] [CrossRef]
  25. Zhang, S.; Wang, Y.; Yu, P.; Zhang, H.; Tu, X. Impact of human activities on the spatial and temporal variation of runoff of Jinghe Basin, Northwest China. J. Arid. Land Resour. Environ. 2011, 6, 66–72. [Google Scholar] [CrossRef]
  26. Omer, A.; Wang, W.; Basheer, A.K.; Yong, B. Integrated assessment of the impacts of climate variability and anthropogenic activities on river runoff: A case study in the Hutuo River Basin, China. Hydrol. Res. 2017, 48, 416–430. [Google Scholar] [CrossRef] [Green Version]
  27. Jiang, S.; Ren, L.; Yong, B.; Singh, V.P.; Yang, X.; Yuan, F. Quantifying the effects of climate variability and human activities on runoff from the Laohahe basin in northern China using three different methods (pages 2492–2505). Hydrol. Process. 2011, 25, 1–14. [Google Scholar] [CrossRef]
  28. Zhao, R.; Chen, Y.; Shi, P.; Zhang, L.; Pan, J.; Zhao, H. Land use and land cover change and driving mechanism in the arid inland river basin: A case study of Tarim River, Xinjiang, China. Environ. Earth Sci. 2012, 68, 591–604. [Google Scholar] [CrossRef]
  29. Sangho, L.; Sang, K. Quantification of Hydrological Responses Due to Climate Change and Human Activities over Various Time Scales in South Korea. Water 2017, 9, 34. [Google Scholar]
  30. Shahid, M.; Rahman, K.U. Identifying the Annual and Seasonal Trends of Hydrological and Climatic Variables in the Indus Basin Pakistan. Asia-Pac. J. Atmos. Sci. 2020, 1–15. [Google Scholar] [CrossRef]
  31. Fathian, F.; Morid, S.; Kahya, E. Identification of trends in hydrological and climatic variables in Urmia Lake basin, Iran. Theor. Appl. Clim. 2014, 119, 443–464. [Google Scholar] [CrossRef]
  32. Monk, W.A.; Peters, D.L.; Curry, R.A.; Baird, D.J. Quantifying trends in indicator hydroecological variables for regime-based groups of Canadian rivers. Hydrol. Process. 2011, 25, 3086–3100. [Google Scholar] [CrossRef]
  33. Sun, S.; Barraud, S.; Branger, F.; Braud, I.; Castebrunet, H. Urban hydrologic trend analysis based on rainfall and runoff data analysis and conceptual model calibration. Hydrol. Process. 2018, 31, 1349–1359. [Google Scholar] [CrossRef] [Green Version]
  34. Gao, Z.; Zhang, L.; Zhang, X.; Cheng, L.; Potter, N.; Cowan, T.; Cai, W. Long-term streamflow trends in the middle reaches of the Yellow River Basin: Detecting drivers of change. Hydrol. Process. 2016, 30, 1315–1329. [Google Scholar] [CrossRef]
  35. Pandey, Y.; Mishra, A.K.; Sarangi, A.; Singh, D.K.; Sahoo, R.N.; Sarkar, S. Trend analysis of rainfall and runoff in the Jhelum basin of Kashmir Valley. Indian J. Agric. Sci. 2018, 88, 320–325. [Google Scholar]
  36. Xu, Y.; Wang, S.; Bai, X.; Shu, D.; Tian, Y. Runoff response to climate change and human activities in a typical karst watershed, SW China. PLoS ONE 2018, 13, e0193073. [Google Scholar] [CrossRef]
  37. Sen, Estimates of the Regression Coefficient Based on Kendall’s Tau. Publ. Am. Stat. Assoc. 1968, 63, 1379–1389. [CrossRef]
  38. Bland, J.M.; Altman, D.G. Regression Analysis. Lancet 1986, 327, 908–909. [Google Scholar] [CrossRef]
  39. Yue, S.; Pilon, P.; Cavadias, G. Power of the Mann–Kendall and Spearman’s rho tests for detecting monotonic trends in hydrological series. J. Hydrol. 2002, 259, 254–271. [Google Scholar] [CrossRef]
  40. Mann, H.B. Nonparametric test against trend. Econometrica 1945, 13, 245–259. [Google Scholar] [CrossRef]
  41. Kendall, M.G. A New Measure of Rank Correlation. Biometrika 1938, 30, 81–93. [Google Scholar] [CrossRef]
  42. Rahman, A.-U.; Dawood, M. Spatio-statistical analysis of temperature fluctuation using Mann–Kendall and Sen’s slope approach. Clim. Dyn. 2017, 48, 783–797. [Google Scholar] [CrossRef]
  43. Mishra, S.; Saravanan, C.; Dwivedi, V.K.; Shukla, J.P. Rainfall-Runoff Modeling using Clustering and Regression Analysis for the River Brahmaputra Basin. J. Geol. Soc. India 2018, 92, 305–312. [Google Scholar] [CrossRef]
  44. Sharma, P.J.; Patel, P.L.; Jothiprakash, V. Impact of rainfall variability and anthropogenic activities on streamflow changes and water stress conditions across Tapi Basin in India. Sci. Total. Environ. 2019, 687, 885–897. [Google Scholar] [CrossRef] [PubMed]
  45. Wang, R.; Peng, W.; Liu, X.; Jiang, C.; Wu, W.; Chen, X. Characteristics of Runoff Variations and Attribution Analysis in the Poyang Lake Basin over the Past 55 Years. Sustainability 2020, 12, 944. [Google Scholar] [CrossRef] [Green Version]
  46. Sen, Z. Innovative Trend Analysis Methodology. J. Hydrol. Eng. 2012, 17, 1042–1046. [Google Scholar] [CrossRef]
  47. Malik, A.; Kumar, A.; Guhathakurta, P.; Kisi, O. Spatial-temporal trend analysis of seasonal and annual rainfall (1966–2015) using innovative trend analysis method with significance test. Arab. J. Geosci. 2019, 12, 328. [Google Scholar] [CrossRef]
  48. Cui, L.; Wang, L.; Lai, Z.; Tian, Q.; Liu, W.; Li, J. Innovative trend analysis of annual and seasonal air temperature and rainfall in the Yangtze River Basin, China during 1960–2015. J. Atmos. Sol. Terr. Phys. 2017, 164, 48–59. [Google Scholar] [CrossRef]
  49. Li, J.; Wu, W.; Ye, X.; Jiang, H.; Gan, R.; Wu, H.; He, J.; Jiang, Y. Innovative trend analysis of main agriculture natural hazards in China during 1989–2014. Nat. Hazards 2018, 95, 677–720. [Google Scholar] [CrossRef]
  50. Kisi, O. An innovative method for trend analysis of monthly pan evaporations. J. Hydrol. 2015, 527, 1123–1129. [Google Scholar] [CrossRef]
  51. Güçlü, Y.S. Multiple Şen-innovative trend analyses and partial Mann-Kendall test. J. Hydrol. 2018, 566, 685–704. [Google Scholar]
  52. Caloiero, T.; Coscarelli, R.; Ferrari, E. Application of the Innovative Trend Analysis Method for the Trend Analysis of Rainfall Anomalies in Southern Italy. Water Resour. Manag. 2018, 32, 4971–4983. [Google Scholar] [CrossRef]
  53. Caloiero, T. Evaluation of rainfall trends in the South Island of New Zealand through the innovative trend analysis (ITA). Theor. Appl. Clim. 2019, 139, 493–504. [Google Scholar] [CrossRef]
  54. Alashan, S. An improved version of innovative trend analyses. Arab. J. Geosci. 2018, 11, 50. [Google Scholar] [CrossRef]
  55. Şen, Z. Innovative trend significance test and applications. Theor. Appl. Clim. 2017, 127, 939–947. [Google Scholar] [CrossRef]
  56. Demir, V.; Kisi, O. Comparison of Mann-Kendall and innovative trend method (Şen trend) for monthly total precipitation (Middle Black Sea Region, Turkey). In Proceedings of the 3rd International Balkans Conference on Challenges of Civil Engineering, 3-BCCCE, Tirana, Albania, 19–21 May 2016. [Google Scholar]
  57. Huang, D.; Liu, Z.; Jiang, Q. Application of non-parametric Mann-Kendall and innovative trend method analysis to groundwater quality parameters variation: A case study from aquifers in Xinsankuang Coal mine. J. Water Resour. Water Eng. 2018. [Google Scholar] [CrossRef]
  58. Kişi, Ö.; Guimaraes Santos, C.A.; Marques da Silva, R.; Zounemat-Kermani, M. Trend analysis of monthly streamflows using Şen’s innovative trend method. Geofizika 2018, 35, 53–68. [Google Scholar] [CrossRef]
  59. Alashan, S. Combination of modified Mann-Kendall method and en innovative trend analysis. Eng. Rep. 2020. [Google Scholar] [CrossRef]
  60. Hamade, S.; Tabet, C. The Impacts of Climate Change and Human Activities on Water Resources Availability in the Orontes Watershed: Case of the Ghab Region in Syria. J. Water Sustain. 2013, 3, 45–59. [Google Scholar] [CrossRef]
  61. Mohammadi, G.; Ebrahimi, K. Effects of human activities and climate variability on water resources in the Saveh plain, Iran. Environ. Monit. Assess. 2015, 187, 35. [Google Scholar] [CrossRef]
  62. Romanovsky, V.V. Water level variations and water balance of Lake Issyk-Kul. Lake Issyk Kul Its Nat. Environ. 2002, 13, 45–57. [Google Scholar]
  63. Alifujiang, Y.; Abuduwaili, J.; Ma, L.; Samat, A.; Groll, M. System Dynamics Modeling of Water Level Variations of Lake Issyk-Kul, Kyrgyzstan. Water 2017, 9, 989. [Google Scholar] [CrossRef] [Green Version]
  64. Salamat, A.U.; Abuduwaili, J.; Shaidyldaeva, N. Impact of climate change on water level fluctuation of Issyk-Kul Lake. Arab. J. Geosci. 2015, 8, 5361–5371. [Google Scholar] [CrossRef]
  65. Alymkulova, B.; Abuduwaili, J.; Issanova, G.; & Nahayo, L. Consideration of Water Uses for Its Sustainable Management, the Case of Issyk-Kul Lake, Kyrgyzstan. Water 2016, 8, 298. [Google Scholar] [CrossRef] [Green Version]
  66. Romanovsky, V.V.; Tashbaeva, S.; Crétaux, J.F.; Calmant, S.; Drolon, V. The closed Lake Issyk-Kul as an indicator of global warming in Tien-Shan. Nat. Sci. 2013, 5, 608–623. [Google Scholar] [CrossRef] [Green Version]
  67. Ilaboya, R. Modelling and Simulation of Rainfall-Runoff Relations for Sustainable Water Resources Management in Ethiope Watershed using SCS-CN, ARC-GIS, ARC-HYDRO, HEC-GEOHMS and HEC-HMS. Tr. Civil Eng. 2018, 2. [Google Scholar] [CrossRef] [Green Version]
  68. Ferronskii, V.I.; Polyakov, V.A.; Brezgunov, V.S.; Vlasova, L.S.; Karpychev, Y.A.; Bobkov, A.F.; Romaniovskii, V.V.; Johnson, T.; Ricketts, D.; Rasmussen, K. Variations in the Hydrological Regime of Kara-Bogaz-Gol Gulf, Lake Issyk-Kul, and the Aral Sea Assessed Based on Data of Bottom Sediment Studies. Water Resour. 2003, 30, 252–259. [Google Scholar] [CrossRef]
  69. Shabunin, G.D.; Shabunin, A.G. Climate and physical properties of water in Lake Issyk-Kul. In Lake Issyk-Kul: Its Natural Environment; Springer: Dordrecht, The Netherlands, 2002; Volume 13, pp. 3–11. [Google Scholar]
  70. Wang, Y.; Xu, Y.; Tabari, H.; Wang, J.; Wang, Q.; Song, S.; Hu, Z. Innovative trend analysis of annual and seasonal rainfall in the Yangtze River Delta, eastern China. Atmos. Res. 2020, 231, 1–14. [Google Scholar] [CrossRef]
  71. Ma, R.-X.; Huang, J.T.; Tian, H.; Cui, X.D.; Wang, D. Characteristics of precipitation, evaporation and temperature at the Golmud River Catchment in recent 60 years. Arid Land Geogr. 2017, 40, 1005–1012. [Google Scholar]
  72. Zhang, Q.; Jiang, T.; Gemmer, M.; Becker, S. Precipitation, temperature and discharge analysis from 1951 to 2002 in the Yangtze Catchment, China. Hydrol. Sci. J. Des Sci. Hydrol. 2005, 50, 65–80. [Google Scholar] [CrossRef] [Green Version]
  73. Burgers, H.E.; Schipper, A.M.; Hendriks, A.J. Size relationships of water discharge in rivers: Scaling of discharge with catchment area, main-stem length and precipitation. Hydrol. Process. 2014, 28, 5769–5775. [Google Scholar] [CrossRef]
  74. Alifujiang, Y.; Abuduwaili, J.; Maihemuti, B.; Emin, B.; Groll, M. Innovative Trend Analysis of Precipitation in the Lake Issyk-Kul Basin, Kyrgyzstan. Atmosphere 2020, 11, 332. [Google Scholar] [CrossRef] [Green Version]
  75. Narama, C.; Shimamura, Y.; Nakayama, D.; Abdrakhmatov, K. Recent changes of glacier coverage in the western Terskey-Alatoo range, Kyrgyz Republic, using Corona and Landsat. Ann. Glaciol. 2006, 43, 223–229. [Google Scholar] [CrossRef] [Green Version]
Figure 1. Lake Issyk-Kul Basin Map.
Water 13 00095 g001
Figure 2. Illustration of the Şen’s method [46,55] (a) The increasing, decreasing, and no trend (trendless) in the ITA method; (b) The innovative trend slope.
Water 13 00095 g002
Figure 3. Analysis of the ITA for annual river runoff at 13 stations.
Water 13 00095 g003aWater 13 00095 g003b
Figure 4. Analysis of the ITA for spring river runoff at 13 stations.
Water 13 00095 g004aWater 13 00095 g004b
Figure 5. Analysis of the ITA for summer river runoff at 13 stations.
Water 13 00095 g005aWater 13 00095 g005b
Figure 6. Analysis of the ITA for autumn river runoff at 13.
Water 13 00095 g006aWater 13 00095 g006b
Figure 7. Analysis of the ITA for winter river runoff at 13.
Water 13 00095 g007aWater 13 00095 g007b
Figure 8. Analysis of the MK trend trest (ae,k) and ITA results (fj,l) for annual and seasonal river runoff at 13 stations in the Lake Issyk-Kul basin. Notes: Cks-Chong-Koi-Suu, Ca-Cholpon-Ata, Cak-Chong-Ak-Suu, Aks-Ak-Suu, Cu-Chong-Uryukty, Pg-Pzhergalan, As-Ak-sai, Ts-Tossor, To-Ton, Dk-Dzhuuku, Tg-Tamga, Kk-Karakol, and Cky-Chong-Kyzyl-Su.
Water 13 00095 g008aWater 13 00095 g008b
Table 1. Descriptive statistics of annual and seasonal river runoff (m3/s) at study hydrological stations between 1943 and 2012.
Statistical ParametersPzhergalanCholpon-AtaChong-Ak-SuuAk-SuuChong-Koi SuuAk-SaiKarakolChong-Kyzyl-SuuDzhuukuTossorTonChong-Ury ktyTamga
Annual
Min11.72.176.595.502.516.058.237.929.903.671.802.796.39
Max34.001.415.313.501.513.256.815.356.812.230.681.514.22
Mean21.430.290.590.830.410.920.861.021.080.500.290.380.69
Stdev4.220.62−0.280.370.581.08−0.410.790.350.201.650.800.67
Skew0.700.19−0.71−0.90−0.810.92−0.540.490.260.044.041.550.77
Kurt0.620.914.182.090.861.714.763.484.431.250.250.752.93
Spring
Min10.80.411.821.380.430.872.251.651.470.770.220.810.43
Max32.001.644.774.231.872.765.815.534.772.361.942.523.22
Mean16.090.982.822.471.091.673.622.932.401.370.661.441.62
Stdev3.880.290.530.740.480.420.830.860.560.300.300.420.54
Skew1.560.220.600.310.580.860.590.891.410.872.020.850.30
Kurt3.73−0.350.99−0.87−1.210.17−0.050.693.901.255.910.260.03
Summer
Min16.21.638.544.121.492.2410.488.249.081.910.450.960.69
Max59.074.5514.9314.774.0111.1920.4720.2324.277.582.145.1817.64
Mean32.512.7911.557.742.505.6116.5013.1116.554.661.122.9310.72
Stdev9.500.651.562.100.531.822.252.383.101.430.430.913.18
Skew0.430.490.110.840.930.92−0.450.460.24−0.320.510.13−1.42
Kurt−0.27−0.17−0.680.590.601.300.030.340.00−0.56−0.56−0.163.59
Autumn
Min11.50.712.981.170.761.433.432.163.661.060.180.281.46
Max37.072.487.353.853.456.857.877.7310.363.651.613.036.59
Mean22.261.284.682.481.493.425.103.816.171.740.541.032.85
Stdev4.930.361.000.640.671.250.911.061.290.520.300.420.87
Skew0.791.150.540.171.160.950.401.380.711.321.561.851.64
Kurt1.261.82−0.01−0.770.240.050.152.270.532.122.326.975.20
Winter
Min7.40.311.430.750.331.251.190.881.410.710.120.240.62
Max23.971.103.432.162.114.062.762.563.071.951.551.941.64
Mean14.870.562.191.300.962.312.061.522.121.150.380.511.01
Stdev2.750.150.440.290.590.670.400.410.330.280.300.260.21
Skew−0.320.960.790.300.971.12−0.380.920.341.252.133.120.33
Kurt1.841.800.49−0.25−0.820.42−0.720.090.501.194.7814.130.42
Table 2. Analysis of MK trend test and TSM trend analysis for the temporal runoff dynamics (1943–2012).
Station NameAnnualSpringSummerAutumnWinter
TSMMKTSMMKTSMMKTSMMKTSMMK
Cholpon-Ata0.0011.480.0042.42 *0.0215.33 **0.013.31 **0.0021.90
Chong-Ak-Suu0.0081.40−0.002−0.550.0090.870.022.81 **0.0062.43 *
Ak-Suu0.0274.74 **0.0224.95 **0.0575.49 **0.024.99 **0.0095.39 **
Chong-Koi-Suu0.0167.08 **0.0186.57 **−0.005−2.01 *0.026.37 **0.027.60 **
Chong-Urykty0.0043.50 **0.0031.12−0.007−1.230.013.26 **0.0023.34 **
Pzhergalan−0.05−1.93−0.012−0.67−0.141−2.22 *−0.01−0.370.0542.96 **
Karakol0.0010.310.0050.910.0020.200.011.95−0.001-0.48
Chong-Kyzyl-Suu0.0315.95 **0.0265.94 **0.0615.00 **0.036.10 **0.0146.28 **
Dzhuuku0.029−1.030.0072.38 *0.0865.23 **0.034.18 **−0.005−2.54 *
Ak-Sai0.0081.890.0062.00 *0.0171.730.011.020.0082.03 *
Tossor−0.0071.72−0.007−2.02 *−0.034−3.81 **0.0010.080.0043.44 **
Ton0.0087.01 **0.0085.90 **0.0051.900.015.48 **0.0068.14 **
Tamga0.0071.68−0.007−2.02 *−0.008−0.590.0010.88−0.001−0.54
** Trends at the 99% confidence level. * Trends at the 95% confidence level; The slope by TSM is in m3/s.
Table 3. Analysis of ITA (slope s) of annual river runoff in the study area (1943–2012).
StationSlope sStandard Deviation σCorrelation ρ y1y2Slope Standard Deviation σs
Cholpon-Ata0.740.2920.980.01
Chong-Ak-Suu0.830.5890.980.03
Ak-Suu3.73 *0.8290.950.06
Chong-Koi-Suu1.98 **0.4140.920.04
Chong-Urykty0.510.3830.980.02
Pzhergalan−4.71 **4.2190.940.36
Karakol−0.190.8560.980.04
Chong-Kyzyl-Suu3.67 **1.020.960.07
Dzhuuku3.55 **1.080.980.05
Ak-Sai1.93 **0.9250.940.08
Tossor−0.180.5040.980.02
Ton2.83 **0.2870.950.02
Tamga1.52 *0.6930.980.03
** Trends at the 99% confidence level * Trends at the 95% confidence level.
Table 4. Analysis of ITA (slope s) of seasonal river runoff (1943–2012).
StationSpringSummerAutumnWinter
Cholpon-Ata1.98 **1.94 **1.64 *0.13
Chong-Ak-Suu−0.54 *1.30 *1.66 *1.79 *
Ak-Suu2.78 **8.45 **2.48 **1.20 *
Chong-Koi-Suu2.31 **2.27 **1.82 *−0.59 *
Chong-Urykty1.62 *0.481.56 *−0.55 *
Pzhergalan−2.49 ** −2.15 **−1.88 ** 2.14 **
Karakol−0.05−0.77 *−0.420.15
Chong-Kyzyl-Suu3.20 **1.24 *2.49 **7.65 **
Dzhuuku3.50 **−0.64 *1.59 *10.75 **
Ak-Sai1.55 *0.933.19 **2.04 **
Tossor1.69 *1.24 **−2.24 **1.70 *
Ton1.93 **0.821.55 *1.85 *
Tamga−0.68 *0.62−1.31 **0.60
** and * represent 99% and 95% significant levels, respectively.
Table 5. Results of the ITA method for annual and seasonal river runoff in the “low”, “medium”, and “peak” in the Lake Issyk-Kul baisin (1943–2012).
StationsAnnualSpringSummerAutumnWinter
Name ITA ITA ITA ITA ITA
LMPLMPLMPLMPLMP
Cholpon-Ata(+)(+)No(+)(+)NoNo(+)NoNo(+)(+)NoNoNo
Chong-Ak-SuuNo(+)(+)No(−)NoNo(+)NoNo(+)(+)No(+)(+)
Ak-SuuNo(+)No(+)(+)(+)(+)(+)No(+)(+)No(+)(+)No
Chong-Koi-Suu(+)(+)No(+)(+)(+)NoNoNo(+)(+)No(+)NoNo
Chong-Urykty(−)(+)(+)No(+)(+)No(+)(+)No(+)No(+)NoNo
PzhergalanNo(−)NoNo(−)No(−)(−)NoNoNo(+)No(+)(+)
KarakolNoNoNoNoNo(−)NoNoNoNoNoNoNo(−)(−)
Chong-Kyzyl-SuuNo(+)(+)(+)(+)No(+)(+)No(+)(+)No(+)(+)No
DzhuukuNo(+)(+)NoNo(+)(+)(+)(+)(+)(+)(+)No(−)No
Ak-SaiNoNoNo(+)NoNoNo(+)(+)No(+)(+)No(+)No
TossorNoNo(+)(+)No(+)(−)(−)(+)No(+)No(+)(+)No
Ton(+)(+)No(+)(+)No(+)(+)(+)(+)(+)No(+)NoNo
TamgaNo(+)(+)(−)(+)(+)NoNoNoNoNoNo(−)No(−)
Notes: (±) and No represents the increasing (decreasing) and no trends; L-low, P-peak, M-medium.
Publisher’s Note: MDPI stays neutral with regard to jurisdictional claims in published maps and institutional affiliations.

