Abstract
Global urbanization has the most tremendous negative effects on the changing landscapes in many developing countries’ cities. It is necessary to develop appropriate monitoring techniques for tracking transport space evolution. The work explores the impacts of urban growth dynamics of transport space over the past decades as a basis for predicting future space demands in Kano, Nigeria. Three epochs of Landsat images from 1984, 2013 and 2019 were processed, classified and analyzed. Spatial classifications of land-use/land-cover (LULC) types in Kano include transport space, built-up areas, vegetation, farmland, bare land and water. The data analysis involves model calibration, validation and prediction using areas using the hybrid modeling techniques—cellular automata-Markov (CA-Markov) in IDIRISI SELVA 17.0 and remote-sensing ARC-GIS 10.7 softwares. The result finds significant expansion of transport and built-up areas while other LULC receded throughout the entire study period. Predictive modeling of transport infrastructure shows spatial expansion by 345 km2 (3.9%) and 410 km2 (11.7%) in 2030 and 2050 respectively. Kappa reliability indices of agreement (KIA) classified images and ground maps were 85%, 86% and 88%, respectively, for 1984, 2013 and 2019 time series. The calibration quality met the 80% minimum suggested in literature for the spatial-temporal track and prediction of urban growth phenomena.
1. Introduction
Urbanization has produced a variety of endemic structural changes in land-use/land-cover (LULC) characteristics. LULC highlights the causal relationships between spatial transformations involving land conversion and adverse environmental ramifications. Globally, urban agglomerations inches closer to worrisome milestones, as cities assume new roles of de facto national economies of many countries [1]. With globalization, the cities have become increasingly attractive to all strata of human society because of their strategic economic and political advantages, employment opportunities and availability of relevant infrastructures and facilities. Urbanization exerts a chain anthropogenic process on the natural environment and is arguably the major contributor to global land-use transition. LULC change is a complex mechanism that transforms natural landscapes, climate conditions and a major source of threat to environmental biology, ecological ‘flora and fauna’ and deterioration of biodiversity.
Fast LULC change has caused many catastrophic weather and environmental events due to rising tides of natural and anthropogenic forcing elements such as solar radiation, flooding, temperature, wind and seismic effects [2]. Whilst the evolutionary phases of the developed nations have reached their prime, their counterparts in the developing world are in the worst phase of uncontrolled urbanization. Whilst the developed nations’ developmental stages have entered their primes, their counterparts in the developing countries are in the worst period of unchecked urbanization.
Manifest variants of crumbled infrastructure, poverty, insecurity, instability and social-economic inequalities have increased the trend and scale of rural to urban migration, defining rural settings of Africa, Asia and South America compared to cities. In low- and middle-income countries, the marked population-cum-urbanization chains have had a tremendous impact on LULC transition and urban development planning. Equally, many cities are plagued by population waves, urban sprawls and gaps in infrastructure, which currently occupy many domains of knowledge and discourses by policy makers and academia. LULC expansion is among the major contributors to climatic change [3], not least the impact of the transport sector, which contributes a significant share of about 27% to global greenhouse gas (GHG) emission [4].
Land covers include physical and human landscapes (e.g., vegetation, rocks, water bodies, arable land and transport infrastructures). Land use, on the other hand, involves human activities on the ground including farming, mining, commercial and industrial developments etc. Empirical studies by researchers have established many diverse fields of applications of LULC including geology and mining [5,6], hydrology and water catchments [7], agriculture [8], forestry and wildlife [9,10], urban evolution and regional geography [11], climate change and environmental ecology [12]. The traditional urban growth of Nigeria has always merged all infrastructure development together, including transport, without recourse to their differing critical needs and priorities.
The rapid global urbanization pace is undercut by epic challenges of meeting the greater demands for housing, health and educational facilities, good transport systems, employment and other basic services, especially for the poor urban communities. The key impetus of a sustainable urban planning regime optimizes development for socioeconomic and environmental inclusion for all, with compatible land use and resilient infrastructure. Urban planning developments in developed countries have long been discernibly planned and coordinated with sustainable outlooks [13]. The developing countries’ cities, on the other hand, have concentrated development at the center, while the periphery is littered with a scattered mosaic of urban sprawl and slums neglected by the political authorities [14,15].
Segregated socioeconomic structure of Nigerian society, together with the menacing atmosphere of Boko-haram Islamist insurgency and other violent crimes has heightened the plague of urbanization in Kano—the second most populous city in the country [16,17,18]. The underlying population increase in Kano metropolis combined with massive transport infrastructure deficits has brought mobility, pollution, motorization, safety and urban transport problems to a head [19,20]. The spatial, socioeconomic and environmental impacts of loosely planned cities can be devastating, especially for the city which has experienced remarkable urban growth over a short period of time [21].
Efficient, accessible and resilient transport infrastructure and services bore the hallmark of livable sustainable cities. While Kano city authorities are attempting to cover up for the seemingly wide gap in transport infrastructure, sufficient attention has not been paid to the changing physical and spatial-temporal scales of the urban landscape and its compatibility with a sustainable paradigm.
In theory, all past events could influence our forecasts for the next experiment when sequences of stochastic events are observed. Satellite imaging has been widely used with remote-sensing technology to locate, inventory, map or classify landscape ecology [22,23]. Like a Markov chain, a Markov process can be considered a directed graph of a system’s states [24]. Thus, a Markov continuous process could be adapted to model dynamic changes in transport infrastructure and urban landscape ecology by two-time states to forecast potential distribution areas.
In order to make informed decisions, there is a need for comprehensive documentation of LULC transition, and the causal effects of transport planning and policy interventions. The research is motivated to examine the relationship between city growth, the demand of transport infrastructure and transition chains in landscape ecology with the goal of predicting future land-use changes scenarios in Kano metropolis. In this research, we apply three Landsat images (from Thematic Mapper (TM) of July 1984, Enhanced Thematic Mapper Plus (ETM+) of March 2013 and Operational Land Imager (OLI) of October 2019) for remote sensing transport landscape mapping.
Geographic information systems (GIS) are remote-sensing tools for tracking geographic and spatial changes, LULC simulation and scenario prediction. It is commonly used to study LULC changes and prediction based on past knowledge with a validation model to measure the accuracy of prediction [25]. Continuous Landsat imagery data offer useful information which can be used as a prediction reference. Landsat has remained the most widely used satellite remote-sensing data, and its continuous long-term dependability, cost-effectiveness, and timeliness have made it a useful resource for tracking LULC transition.
Many developed countries have largely reached the terminal stage of urban transition; the climax of future urban growth potential of 2030 to 2050 will take place in African and Asian cities where most of the world-leading mega-cities will emerge [26]. Mega-cities, cities with at least ten million inhabitants, are sprouting in Africa without the critical aspect of infrastructure development. Needless to say that the Nigerian city of Lagos became the world 14th largest mega-city with an urban population of more than 15 million in 2013 [27]. Kano metropolis, the second largest city of 4million inhabitants, is exhibiting similar growth potentials to join in the pack. The cycle of urbanization coupled with defective and poorly oriented policies is negatively impacting the most basic infrastructure [28].
We retrospectively tracked urbanization in Nigeria from two important temporal milestones (1984 and 2013) to when the research data were taken in 2019. The country returned to civil rule in 1983 blossomed economy, an impetus triggering the high urbanization wave in 1984 with many cities almost tripling in size within a few years [29]. At 2013, demographic indices for the first time reached a pinnacle of 58.3% urbanization level, putting more Nigerians in cities than rural settings [16].
The trajectories of future potential population and urban growths are higher—urbanization level is estimated at about 67.1%, creating more than 295 million city dwellers out of about 450million projected total population in 2050 [27]. Even as urbanization is often related to higher wages, improved productivity and overall living standards improvements, the speed and size of the new urban paradigm in developed countries do not assure these improvements. In the United Nations Human Development Index, Nigeria is ranked 152 out of 178 countries among the group of “low human development” [30].
Furthermore, we developed a Markov probability transition matrix implemented in IDRISI SELVA 17 to forecast likely future scenarios of transport infrastructure and land-use ecology to Kano city’s urban form in 2030 to 2050 temporal periods after model validation. Population and urbanization growth indicators speak to the strategic importance of these time scales to planning and development control—Nigerian population forecast could climb 450 million milestone in 2050, with urban agglomeration spikes of about 70% in 2030 [30]. The cellular automata-Markov (CA-Markov) model fitted in IDIRIS SELVA software could be used to establish a spatial weighting of a specific area roughly the same as existing land use, making it very accurate in spatial-temporal dynamics and quantitative estimation of LULC change modeling [31]. Finally, a scientific framework is developed for tracking urban spatial-temporal dynamics and as a decision-making tool for ecological conservation and optimal resource allocation for Nigerian cities
2. Materials and Methods
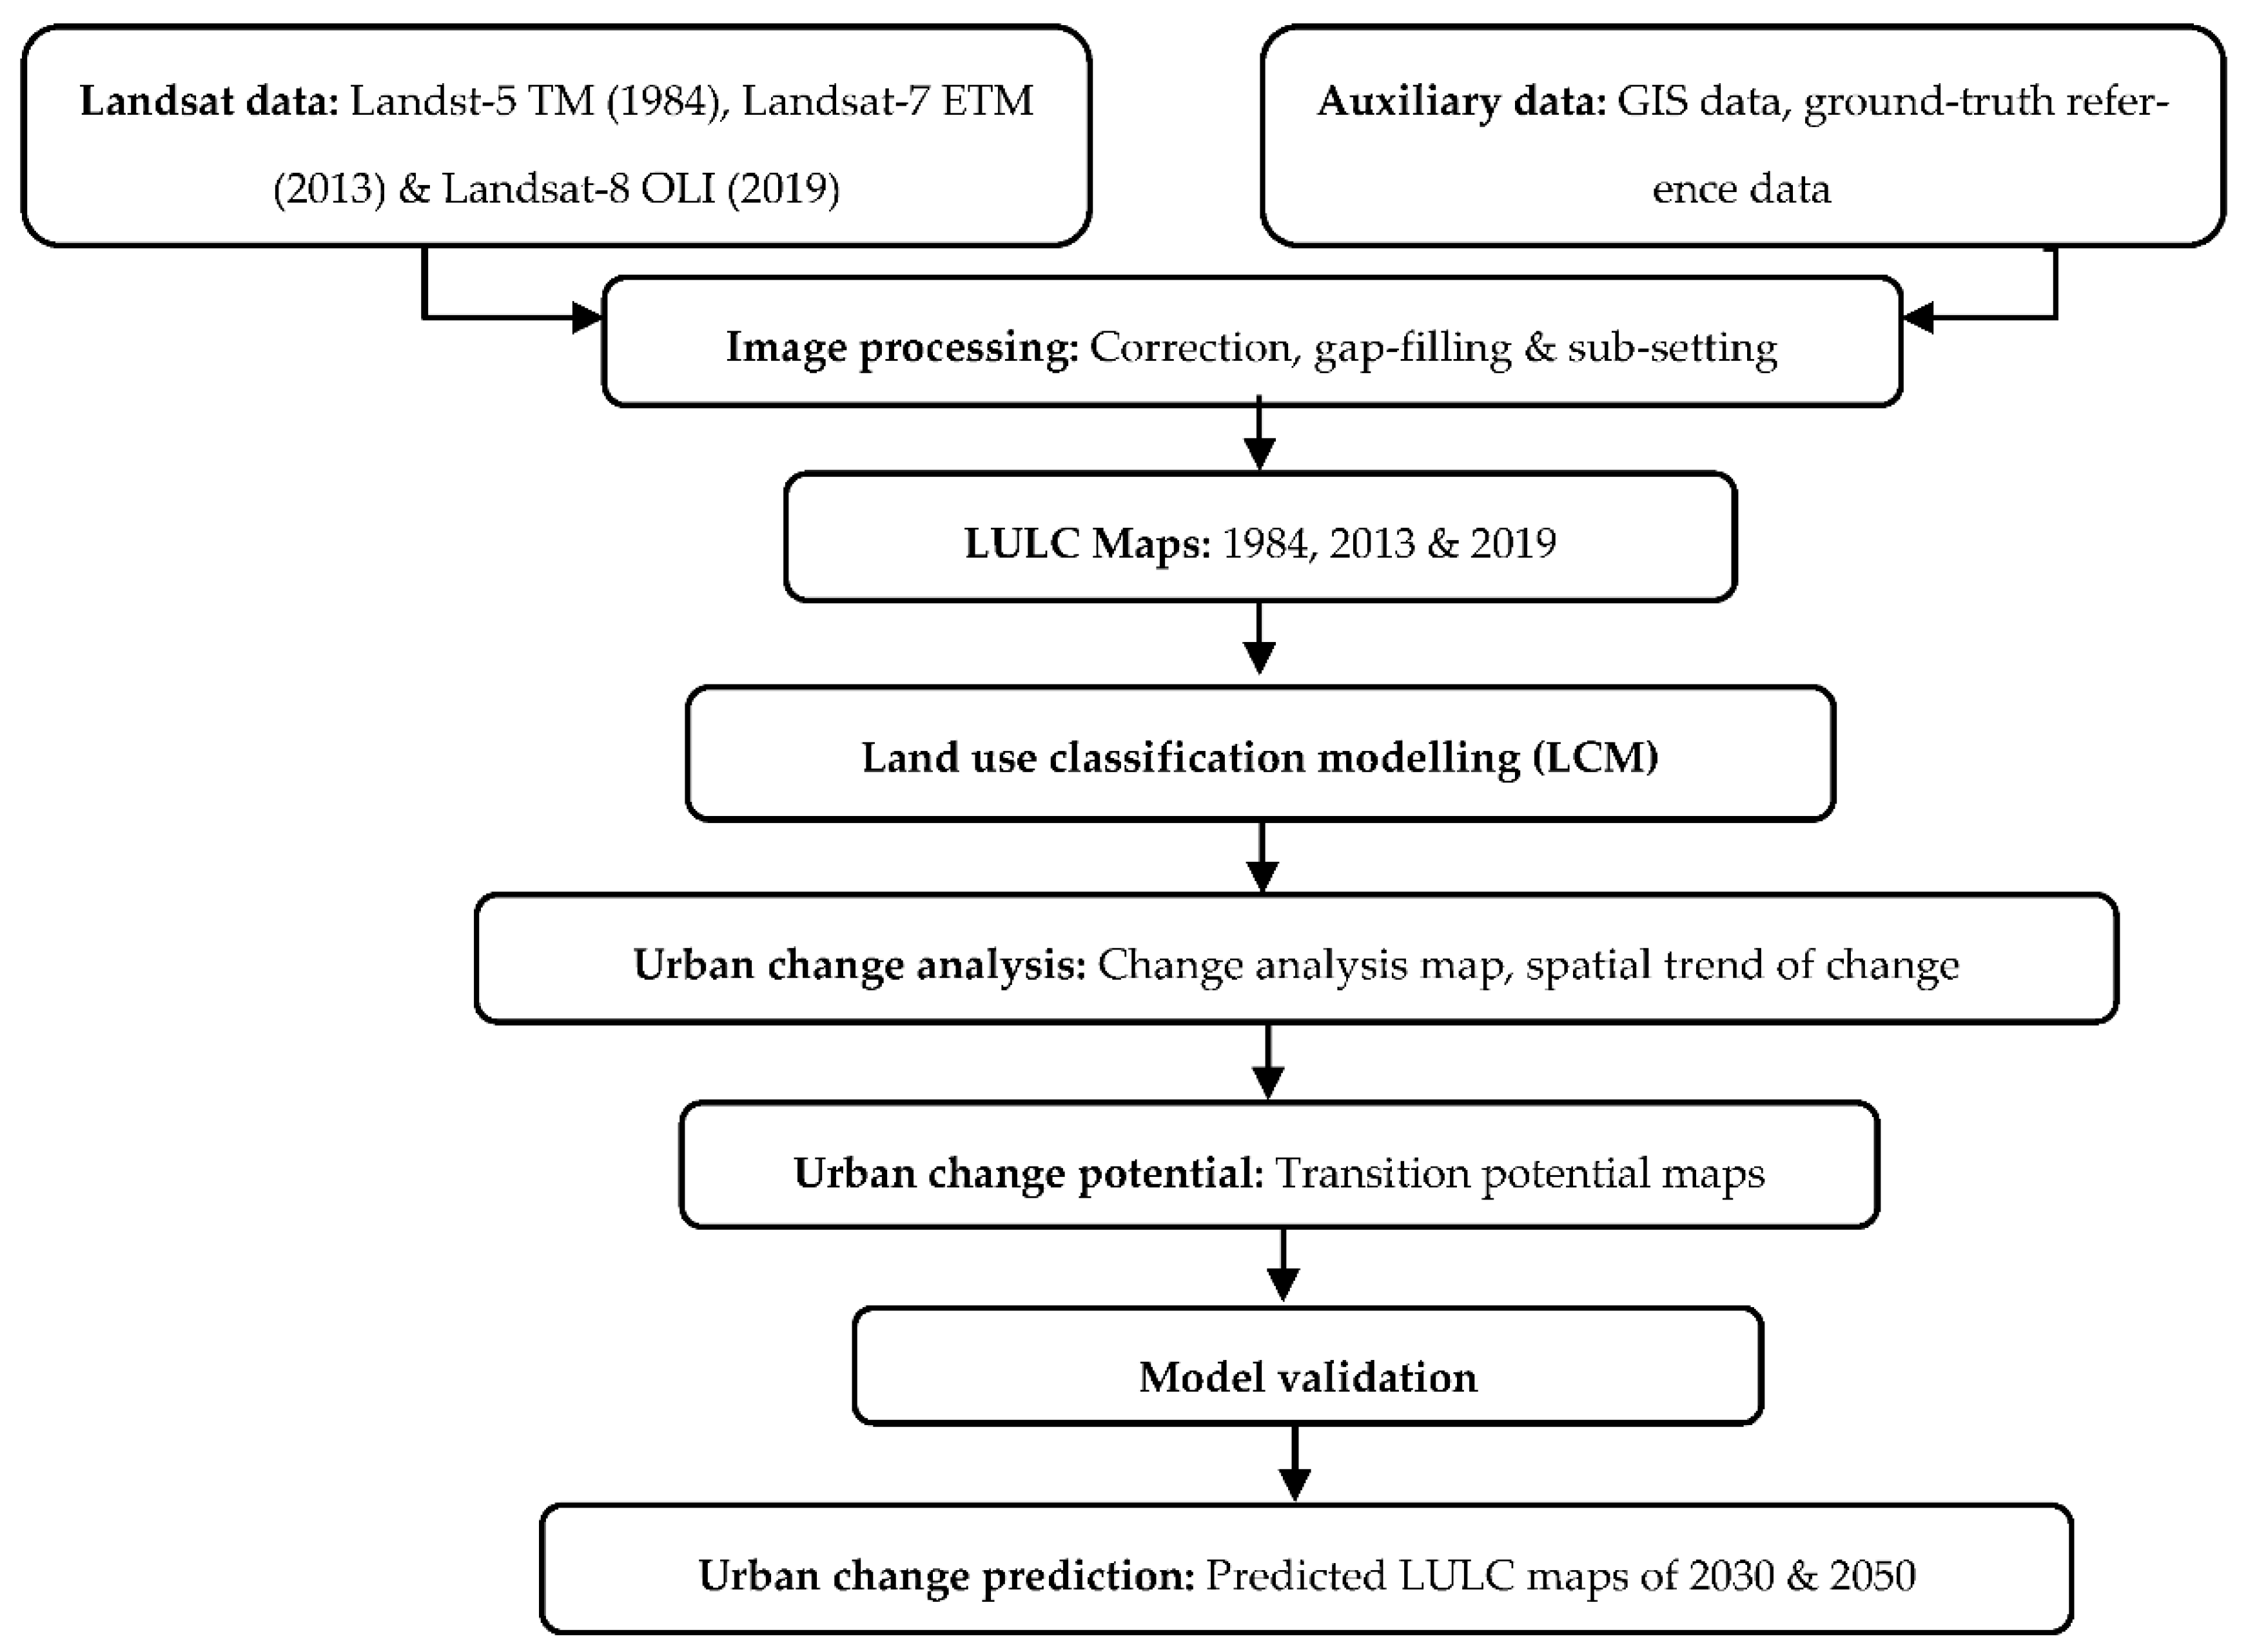
The methodology involves using hybrid GIS and CA-Markov for assessing and examining LULC modeling and predicting transport system infrastructure demand in Kano metropolis. Before implementing algorithms for LULC change detection, a series of pre-processing measures were carried out for Landsat images, including atmospheric correction, cloud and atmosphere recognition, and composite fusion metric techniques [32,33]. The methodological algorithm of the hybrid model is shown Figure 1.
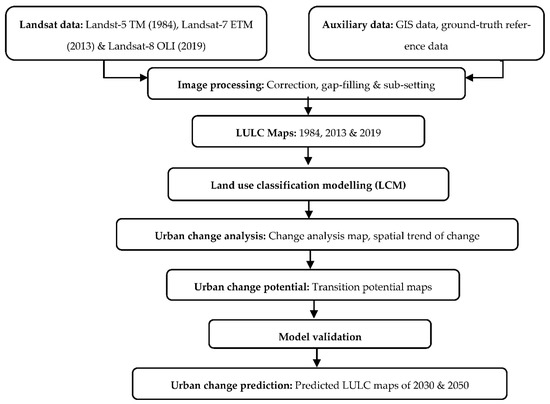
Figure 1.
Methodology land-use/land-cover (LULC) change modeling.
2.1. The Study Area
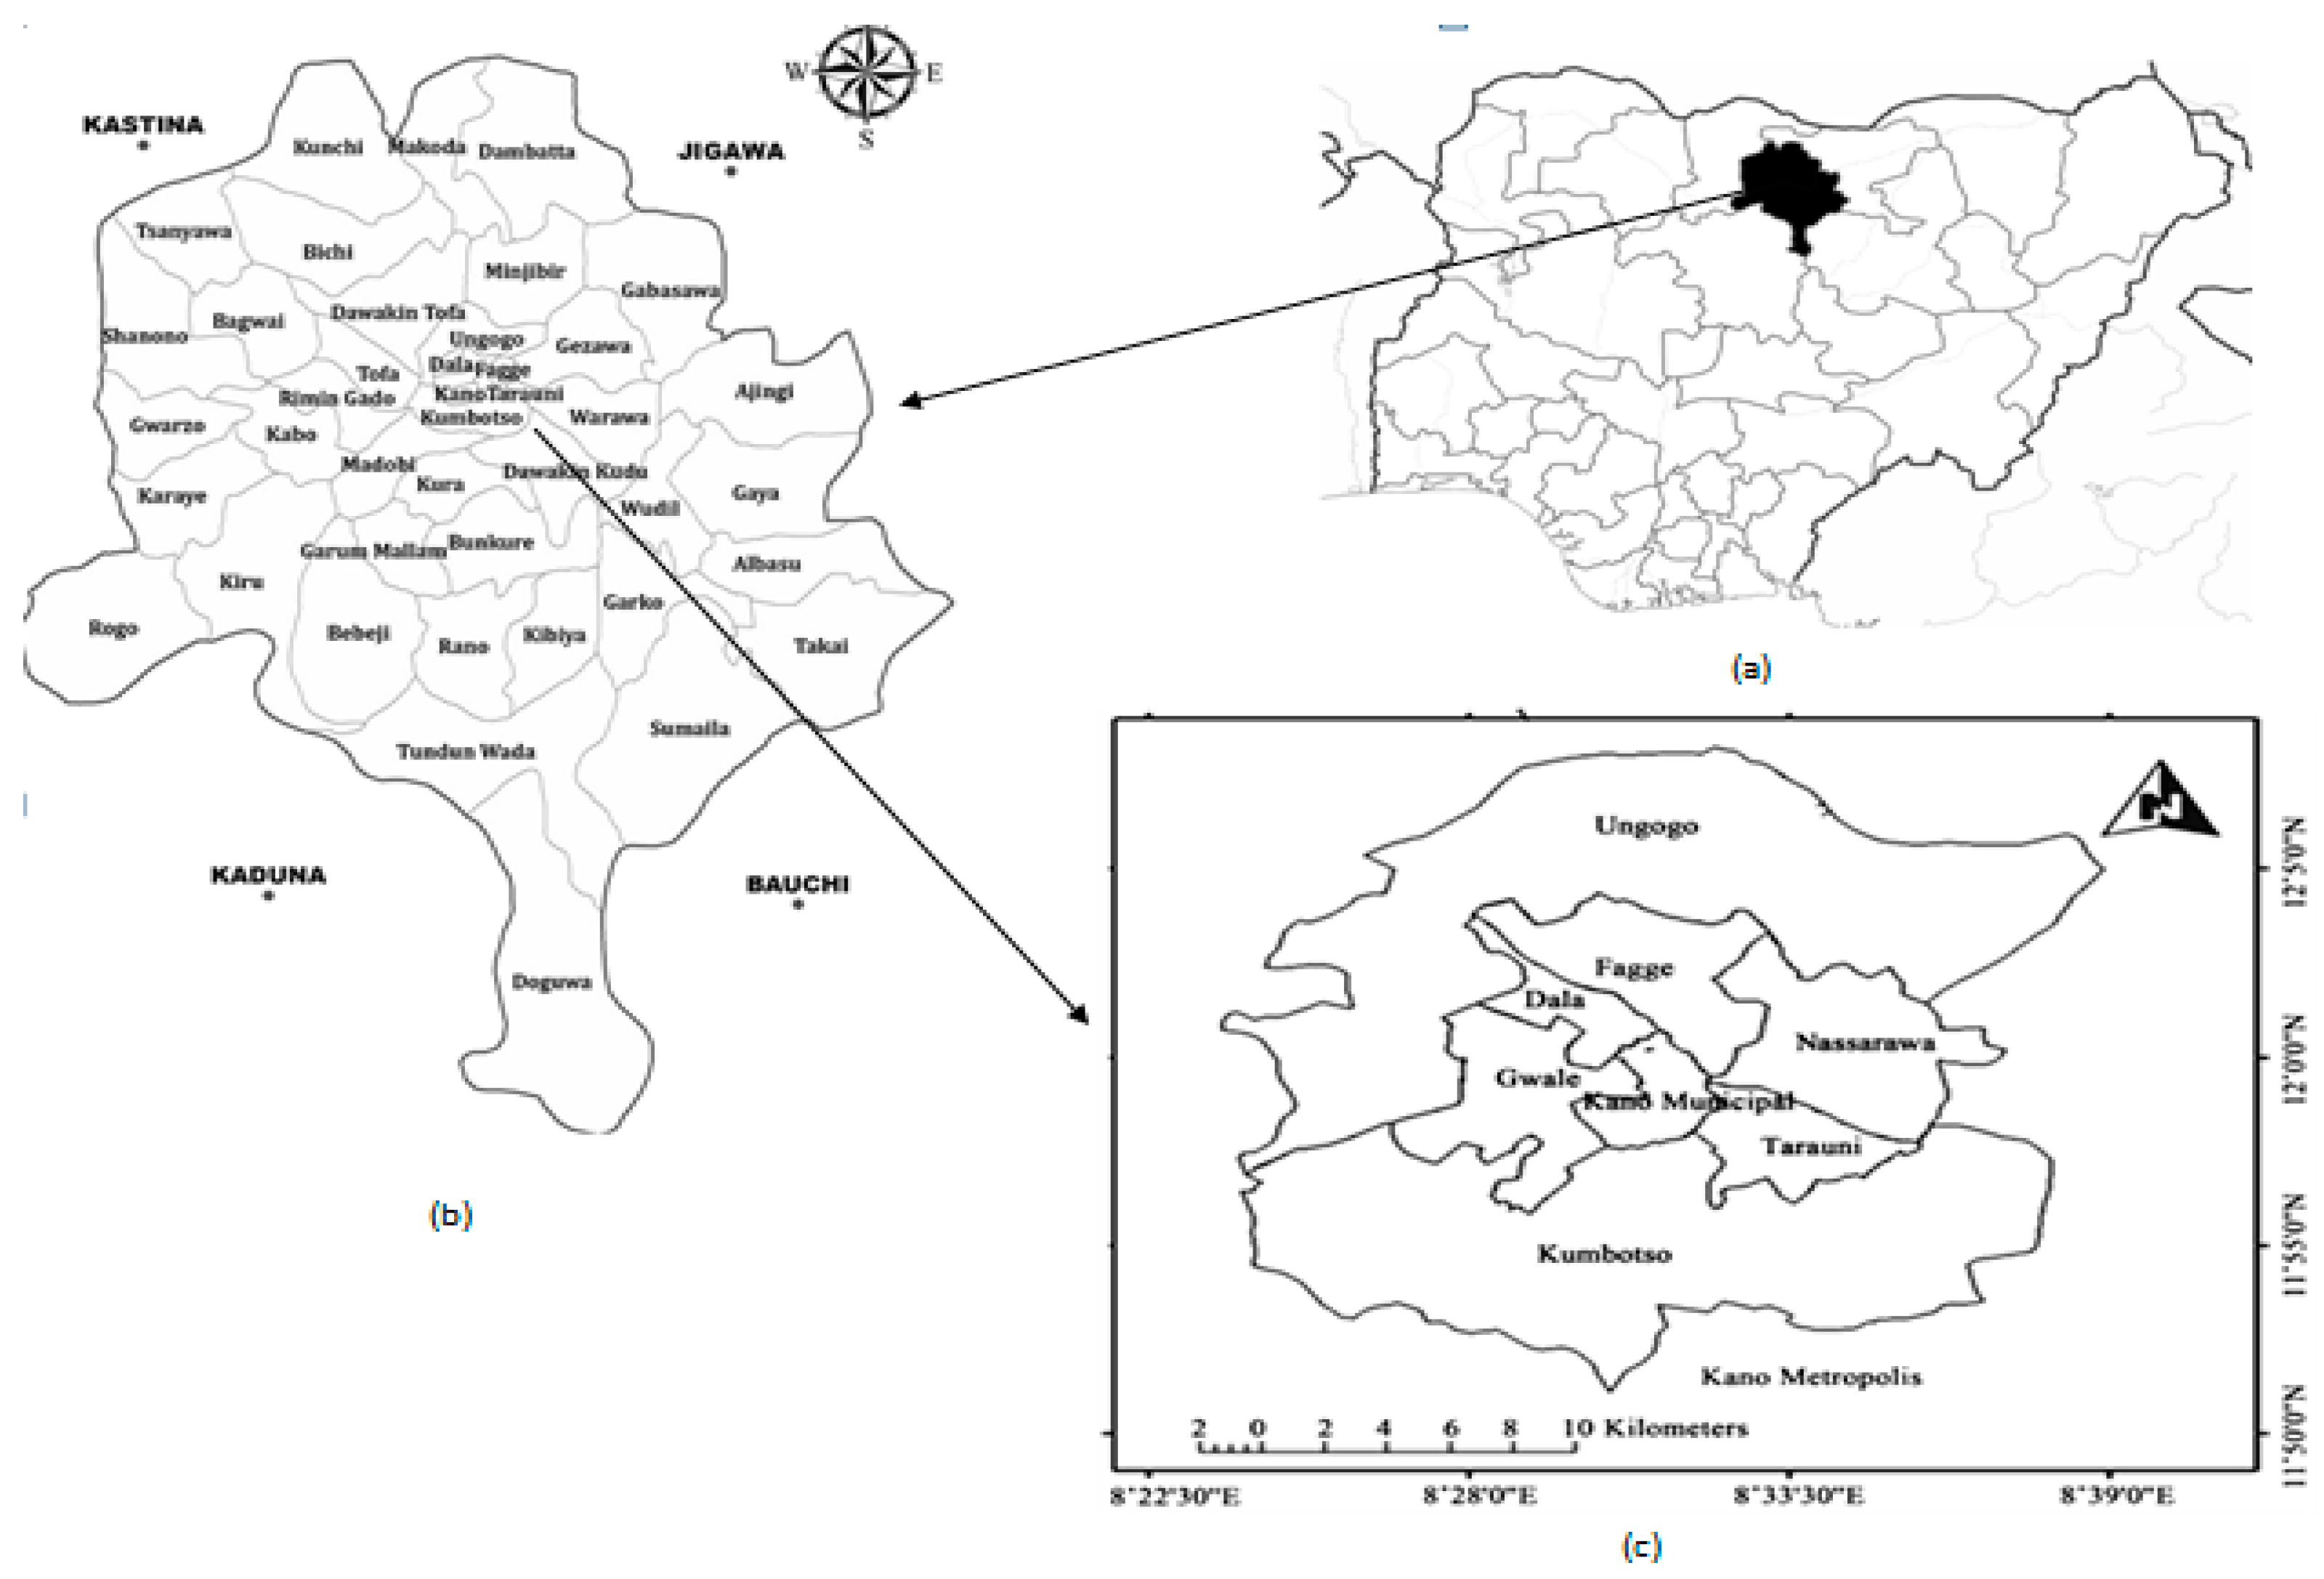
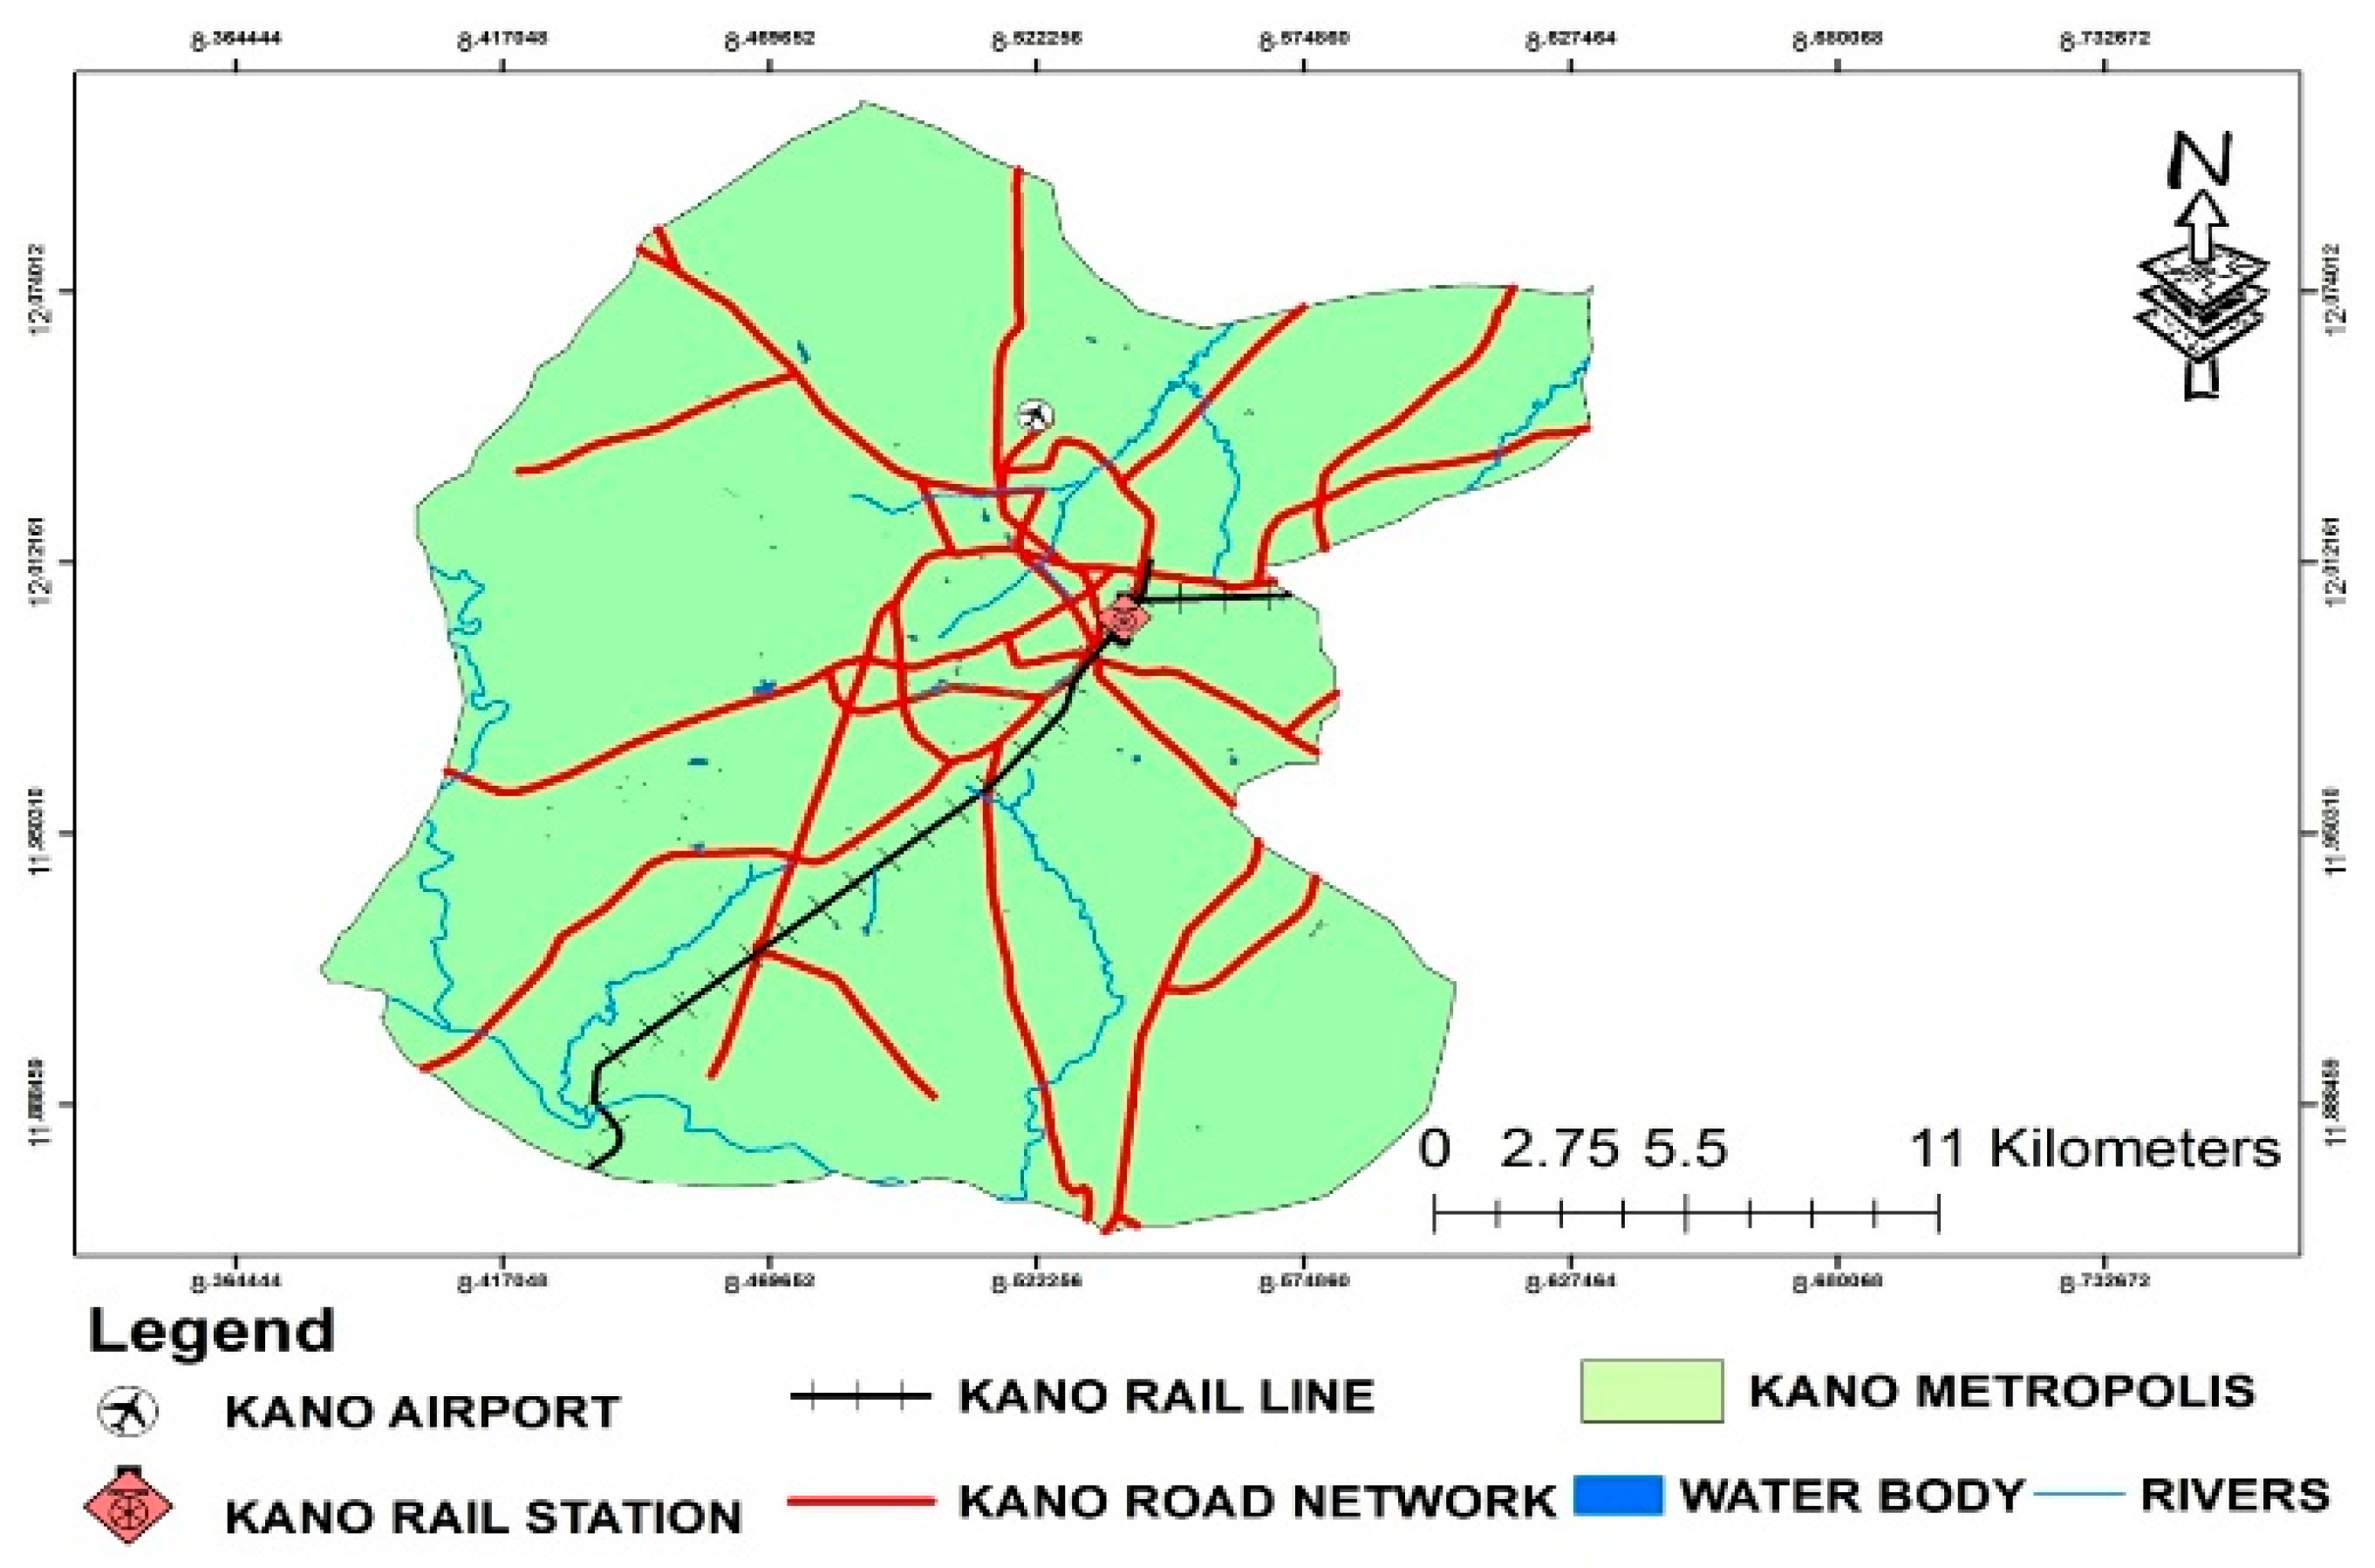
Kano city is an urban conurbation of eight (8) Local Government Areas (LGAs) (Dala, Fagge, Gwale, Kano Municipal, Nassarawa, Tarauni, Ungogo and Kumbotso), located between latitudes 11°25′ N to 12°47′ N and longitude 8°22′ E to 8°39′ E on 472 m above sea level in the Sahel desert. It is the commerce nerve center of the northern country due to its long flourishing marketing (and dominant economic) activities. Nevertheless, agriculture is a second means of employment on the savannah vegetation with Jakara and Challawa rivers being the main water bodies draining the city catchment area [34]. Figure 2 shows the location map of the city metropolitan study area and Figure 3 is the digitized map of major transport infrastructure.
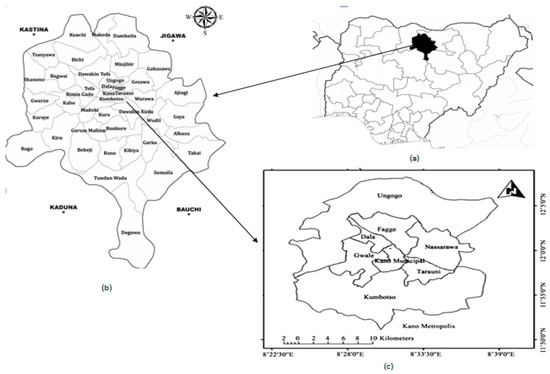
Figure 2.
Map of Kano State showing the study area: (a) Nigeria (b) Kano State (c) Kano city.
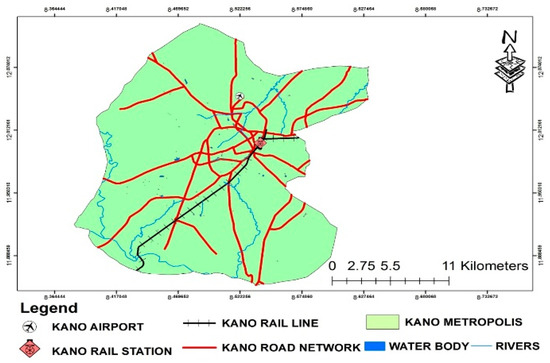
Figure 3.
Digitized map of major transport infrastructure in Kano metropolis [35].
2.2. Sources of Data and Image Processing
The geo-referenced data used are the United States Geological Survey (USGS) Landsat (https://earthexplorer.usgs.gov/) imageries—thematic mapper TM (Landst-5 TM), enhanced thematic mapper ETM (Landsat-7 ETM) and operational land imager OLI (Landsat-8 OLI) respectively for 1984, 2013 and 2019 temporal milestones. Also, other ancillary data obtained are land use maps obtained from the Nigerian National Space Research and Development Agency (NASRDA (https://nasrda.gov.ng)), high resolution Google Earth photo and physical landmarks from knowledge of the area for verifying and delineating major transport infrastructure including roads, airports and railway lines. Table 1 provides detailed attributes of the Landsat data used LULC transition analysis.

Table 1.
Description of Landsat data for analysis of Kano LULC change.
Data files in tagged image file (TIF) format was downloaded with less than 10 percent cloud cover and imported as raster using ERDAS IMAGINE 2014 software. The raster format is registered image-to-image based on similar projection system and re-sampled to a spatial resolution of 30 × 30 m. The sequence of digital image processing includes correction of the atmosphere, radiometry error and the geometry, as well as image gap filling, area of interest sub-setting and band selection.
The digital elevation model (DEM) data collection of the Advanced Space-borne Thermal Emission and Reflection Radiometer (ASTER) repository at the USGS website was used for the land areas in 30 m spatial resolution posting for the surface elevation and topography extraction. Cloud constitutes a very critical barrier to remote sensing and optical quality, especially in some humid tropical environments, thus, cloud cover effect is a key requirement for land cover dynamics. To guarantee the accuracy of atmospheric correction, level 2 atmospherics with geometric and radiometric pre-corrected Landsat imageries were obtained from USGS Earth Explorer and with delineated conversion scale factor into surface reflectance.
In May 2003, a scan line corrector (SLC) compensating for the satellite forward motion of Landsat 7 Enhanced Thematic Mapper Plus (ETM+) failed, thereby imposing a state of “fill-no-data” otherwise called data “gap” on image scenes especially in heterogeneous landscapes. From the date henceforth, gap filling processing for Landsat 7 ETM+ SLC-off became necessary. In the current research, the gap filling software approach involves Interactive Data Language (IDL 7.0) (https://glovis.usgs.gov/). Therefore, three further images were required to fill the “no-data” areas: (1) an anchor fill in the image (2) an image obtained before May 2003 (3) an image obtained post anchor.
Spatial transformation was carried out by manual image registration adopted to match images of the same scene from the different satellite imageries using Landsat 5TM (for 1984) as master control points. With these control points, the alignment of image scenes also involves stacking other satellite imageries (Landsat 7 ETM and Landsat 8 OLI) and compared with referenced auxiliary data. The transformation matched points yielded error average (root mean squared error (RMSE) = 0.12 pixels) at a resolution of 30m is a good match iteration being less than the suggested literature threshold of RMSE <0.5 pixel [36,37].
Predictive modelling of LULC change is an increasingly growing research field due to its significance in identifying the anthropogenic and ecological impact of human activities. LULC change has a direct impact on global change, including biodiversity, water and biological cycles and ecological systems. These changes are typically triggered by human activities (e.g., urbanization, deforestation, mining, overgrazing and agriculture intensification), and other natural causes relating to cosmic radiation and climate change. In view of the strategic importance, scientists have formed an international LULC organization linked to the International Geosphere Biosphere Program (IGBP) and the International Human Dimensions of Global Change Program (IHDGCP) both founded in 1987 [38].
In the study of LULC transition, several different modelling techniques have been implemented, land use conversion and its drivers have dominated the discourse. The models provide a probabilistic estimate of where the changes might potentially occur by understanding the factors driving them [39,40]. Several methods have been developed involving computer implemented algorithms for accuracy, speed and ease of handling big data in land use modelling and prediction. Prediction models have been categorized into four groups—dynamic (process-based), optimization, stochastic and empirical–statistical based techniques [41].
Cellular automata (CA) are one of the modelling algorithms which is a time and space based discrete dynamic system that obeys specific rules on a uniform space grid. Due to its ability to depict a complex system using a series of small collection of rules and states for detecting spatial-temporal behavior, it is particularly selected for LULC modelling. Markov chain analysis involves a stochastic modelling for the study of the dynamic transition process of land use at various spatial and temporal scales based on the assumption that the physical state can be determined if an earlier state is known. CA incorporates transformation rules that are used to describe a certain cell’s state. CA-Markov was compiled as one of the powerful models in IDRISI SELVA software for spatial interaction and modelling simulation [42].
2.3. Image Classification and Accuracy
The quantitative aspects of LULC transition monitoring and analysis are precision driven, as the quality of various LULC mapping application algorithms are vital to the potential dynamic change modeler. Application of different classification algorithms, namely—maximum likelihood classifier (MLC), support vector machine (SVM), random forest (RF), decision tree (DT), Mahalanobis distance (MD), artificial neural networks, spectral angle mapper (SAM), Fuzzy logic adaptive resonance theory-multi-agent process (Fuzzy ART—MAP) and genetic algorithms produced satisfactory accuracies (i.e., Kappa value > 84%) [43,44].
In order to appropriately classify the individual Landsat images, a widely adopted method of supervised maximum likelihood classifier (MLC) was used to generate the relevant land-use classes and to evaluate urban expansion including transport spatial evolution. MLC is commonly adopted because of its ease of parametric convergence as many of the other classifiers usually take time to optimize.
The algorithm also assumes that the data is normally distributed and predicts a high probability that a certain pixel is placed into the right class. Additionally, it has a high probability of quantifying minority groups within the appropriate pixel spectral class without being mis-classified into the larger LULC classes during model training. Landsat image classification was carried out using ARC-GIS 10.7 based on supervised classification of maximum likelihood where each pixel was classified into one of the following land use classes: transport infrastructure, built-up areas, farmland, vegetation, bare land and water. The distribution maps were classified into the six LULC categories including its spatial extent, based on the characteristics displayed directly in remote-sensing images (e.g., size, form, texture and hue etc.). Post-classification change detection was implemented in IDRISI Selva 17 pro version software, which requires two classified images to be compared with details on pixel-based transition [45].
Since there are uncertainties embedded in every stochastic process, a confusion matrix was created to check for classification and transition change detection accuracies. For instance, while the software user accuracy describes the likelihood that a pixel is actually a particular land-use class or landmark on the ground image, product accuracy defines the probability that a pixel (or raster) is correctly categorized.
A complete pixel-by-pixel ‘ground truth’ map is not feasible; it is important to provide a sufficient selection or sampling pixels to ensure robust accuracy assessment of a classification. An appropriate sampling methodology must be employed that satisfies statistical needs. The amount of reference pixels needed for accuracy evaluation depends on the minimum accuracy level required—e.g., 80% to 85% minimum accuracy is recommended by Jensen (1986) [46].
We computed the optimal number of pixel sample points for overall classification accuracy evaluation at 85% minimum accuracy level. The number of appropriate sample points decreased as acceptable error increased. Using stratified random sampling, the total sample (204-pixel points in Equation (1)) was further delineated by thematic classification into at least 30 pixels per LULC class to avoid any form of bias. Van Genderen and Lock (1977) recommended a minimum of 20 observation pixels per referenced LULC class for 85% classification accuracy and 30% minimum pixel points per land-use class for 90% observed accuracy.
where = Total number of sampled pixel points; = Expected accuracy (%); ; = 2 (standard normal deviate of 1.96 for 95% confidence level); = allowable error (usually 5 to 10%)
To check for model reliability, we estimate the value for Cohen’s Kappa Index of Agreement given by Equation (5). The approximate minimum value of 80% is a substantial agreement between simulated and actual data and an indication that the prediction model fits well [47].
where is the number of times there are relative agreements among the layers of raters; is the hypothetical probability of agreement by chance.
Out of 204 selected training sites identified based on image recognition keys as ground-truthing points, 122-pixel points (60%) were used for training. Validation by Kappa reliability assessment checks was carried out based on 82-pixel points (40% ground reference). The general LULC map trends showed a variable rate of change between different LULC classes in the area of study.
2.4. Transition by Markov Chain Process
A Markov chain process could be defined as a process with changing sets of states, . The process changes from one state to another by scales called steps. We may scale the measure of state transition based on temporal time scales (t), whereby the current state () changes to another state () by likelihood transition probability (). If the case is otherwise, where the system remains in a stationary state (), then, the probability of that state is given by ().
The probability of a shift or conversion of land use from one state to another is dependent only in a set of discrete-time steps if the times are sequentially arranged such that the transition probability matrix is given by:
Empirical findings by researchers [48,49], suggested three basic conditions necessary for Equation (3) to converge: firstly, , such that (. Second, the assumption should hold that the transition probabilities remain unchanging. Thirdly, the Markov chains are regarded as a model of first order, which only makes the situation of the transient system contingent on the former. If we denote the transient phase time series as and the initial period as T, Markov stochastic process theory may be used to calculate the state transition probabilities given from the initial state to the state, as well as a stable state. Thus, Markov transition probability for is given by the relationship:
where m = number of columns or rows and the transition probability matrix at stage is equal to the power of the first-stage transition probability matrix.
2.5. Cellular Automata-Markov (CA-Markov) Prediction
The CA-Markov specifically uses the transition script in the Markov chain output analysis to apply a contiguity filter which allows creation of land-use characteristics from time-to-time. Based on initial state matrix and stage transition probability , we can estimate transport infrastructure land area and indeed, other land-use transition in Kano metropolis by applying a Markov simulation model in Equation (6):
3. Results
3.1. Land-Use/Land-Cover (LULC) Mapping
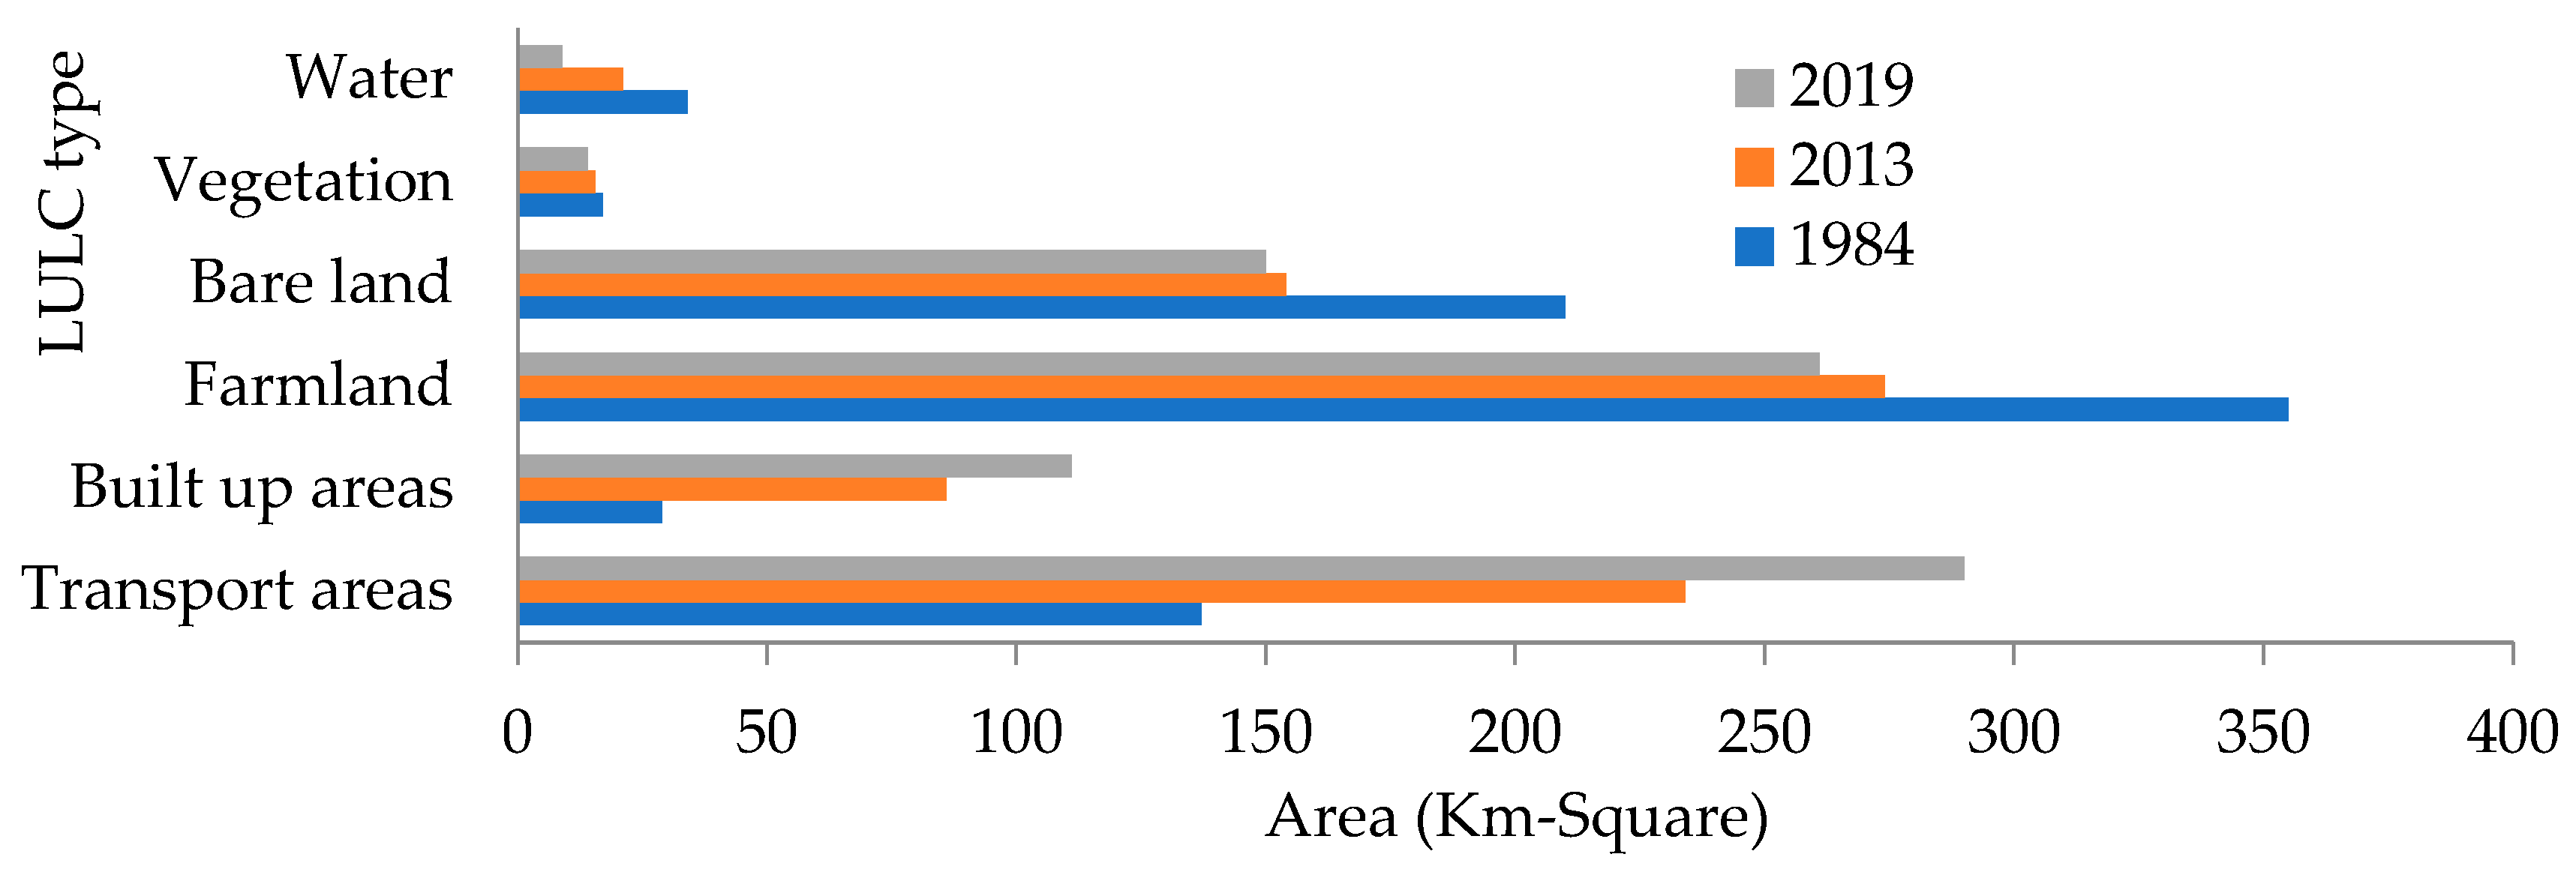
The LULC transition retrospective trend is shown in Figure 4 by the spatial-temporal shifts from 1984 to 2019. Table 2 provides remote-sensing data on Kano land-use and spatial patterns for 1984, 2013 and 2019 respectively. During 1984 to 2013, urbanization had gathered momentum as evident in transport and built-up areas which recorded noticeable spatial growth of 97 km2 (70.8%) and 57 km2 (196.6%), respectively. In the same 29-year period, other land use classes had suffered spatial losses and receded in sizes—farmland (−81 km2), bare land (−56 km2), vegetation (−1.5 km2) and water (−12.9 km2) respectively. In these four land-use classes, the bulk of the spatial reductions is mainly attributed to significant gains in both transport and built-up areas.
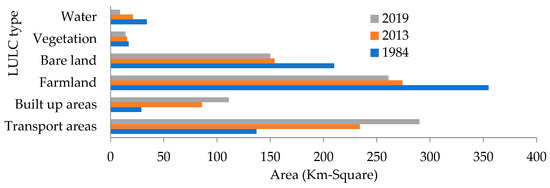
Figure 4.
LULC temporal changes from 1984–2019.

Table 2.
Land use area distribution in Kano metropolis.
It can be argued to a reasonable degree that vegetation and water losses are not only due to urbanization alone. The effects of the Sahel Savannah Africa’s severe climatic conditions (drought, desert encroachment, etc.) and other anthropogenic activities - erosion, mining, bush burning, and pastoral farming have been stressed for the changing landscape and loss of flora and fauna in the region [50,51,52]. Similar patterns of spatial transition gains and losses occurred in 2013 to 2019. Transport and built-up areas recorded transition gains of 56 km2 (23.9%) and 25 km2 (29.1%) respectively, while other LULC classes (farmland, bare-land, vegetation and water) receded by −25 km2 (−29.1%), −5 km2 (−2.6%), −1.5 km2 (−9.7%), and −12.1 km2 (−57.4%), respectively.
3.2. Model Validation
An appropriate precision assessment technique is needed to ensure that remotely sensed data are really useful and efficient. Accuracy evaluation could be defined as a comparison between a map produced by remotely sensed data and another referenced source map. We used the Cohen’s Kappa coefficient estimate to check for the agreement or otherwise. The visual change agreements in terms of geospatial and temporal transformations between classified land use and referenced ground maps were assessed using the following four dimensions of accuracy checks—producer accuracy, user accuracy, overall accuracy and Kappa index of agreement.
- The producer accuracy (PA) of software manufacture is the ratio of samples correctly classified LULC pixels in the same class to the row total of pixel samples in that class. It is an omission error between observed features in the ground reference missing in classified image, i.e., PA = (100 − error of omission)%.
- The user accuracy (UA) is the ratio of samples correctly classified LULC pixels in the same class to the column total of pixel samples in that class. It is a commission error of the wrong classification types between classified and ground images, i.e., UA = (100%—error of commission)%.
- Overall accuracy (OA) is the total pixel of correctly classified samples in the diagonal cell diagonal matrix divided by the overall pixel total sample.
- Kappa index of agreement () provides check for accuracy of classification between remote sensing classified images and referenced ground maps.
In this study, the classification model was validated in terms of its ability to simulate spatial transition patterns of land use and land cover changes in Kano city using the classified transition base map in the temporal series—1984, 2013 and 2019. The level of agreement between actual and simulated landscape areas of the base map is a test of the reliability upon which Markov chain transition probability matrix scalability in the future LULC prediction of Kano metropolis is dependent.
The validation involves cross-tabulation of the error or confusion matrix for checking the reliability of agreement between classified LULC and ground reference. A confusion matrix calculates the identifiable land-use areas on the classified maps as row matrix, the ground reference images as column matrix and the pixel samples in the cells of a diagonal matrix are the correctly categorized LULC classes.
We evaluated how close the two LULC maps are to the degree that the VALIDATE module created a Kappa coefficient to test the model’s goodness. The results in Table 3 indicate a satisfactory prediction for the three temporal time series of classified images.

Table 3.
Accuracy checks for classified LULC maps.
The observed spatial data and the classified maps compare reasonably well producing the following Kappa indices of agreement— for the three-temporal series: 1984, 2013 and 2019, respectively. The values are higher than the 80% minimum suggested in the literature [53], and we can pre-judge that the calibration model is a good predictor of future LULC transition analysis (e.g., 2030 and 2050).
3.3. Model Application
3.3.1. The Initial State
Based on 1984 spatial areas of LULC classes—transport infrastructure, built-up areas, farmland, vegetation, bare land and water, the initial state matrix given by can be built into mutually evolving land use areas depicted by Equation (7). The land-use areas’ initial state transition matrix for the first-time step, 1984 to 2013, is shown in Table 4.

Table 4.
Areas of initial state transition matrix for 29 years—1984 to 2013 (km2).
3.3.2. The Transition State Probability Matrix
The transition probability matrix is determined using LULC landscape classes from 1984 and 2013 as base map. We superposed the raster maps of the landscape and extracted the respective properties in the overlay database using ArcGIS software application. Thus, the initial state transition probability matrix (), was calculated between 1991–1999 (Table 5) and then, further into the current year (2013–2019) as shown by the result in Table 6.

Table 5.
Initial transition probability matrix from 1984 to 2013.

Table 6.
Transition probability matrix from 2013 to 2019.
The prediction model results in Table 7 displayed transport infrastructure and built-up areas as the sole gainers of LULC dynamic transition, other land classes (farmland, bare-land, vegetation and water) are expected to recede significantly. A spatial land-use expansion of 55 km2 (19%) is expected for transport infrastructure from 2019 to 2030 and a further 65 km2 (18.8%) in 2050. Similarly, built-up area is predicted to grow by 29 km2 (26.0%) in 2030 and 15 km2 (10.7%) in 2050.

Table 7.
Markov chains predicted areas for 2030 and 2050 (km2).
4. Discussion
4.1. LULC Maps
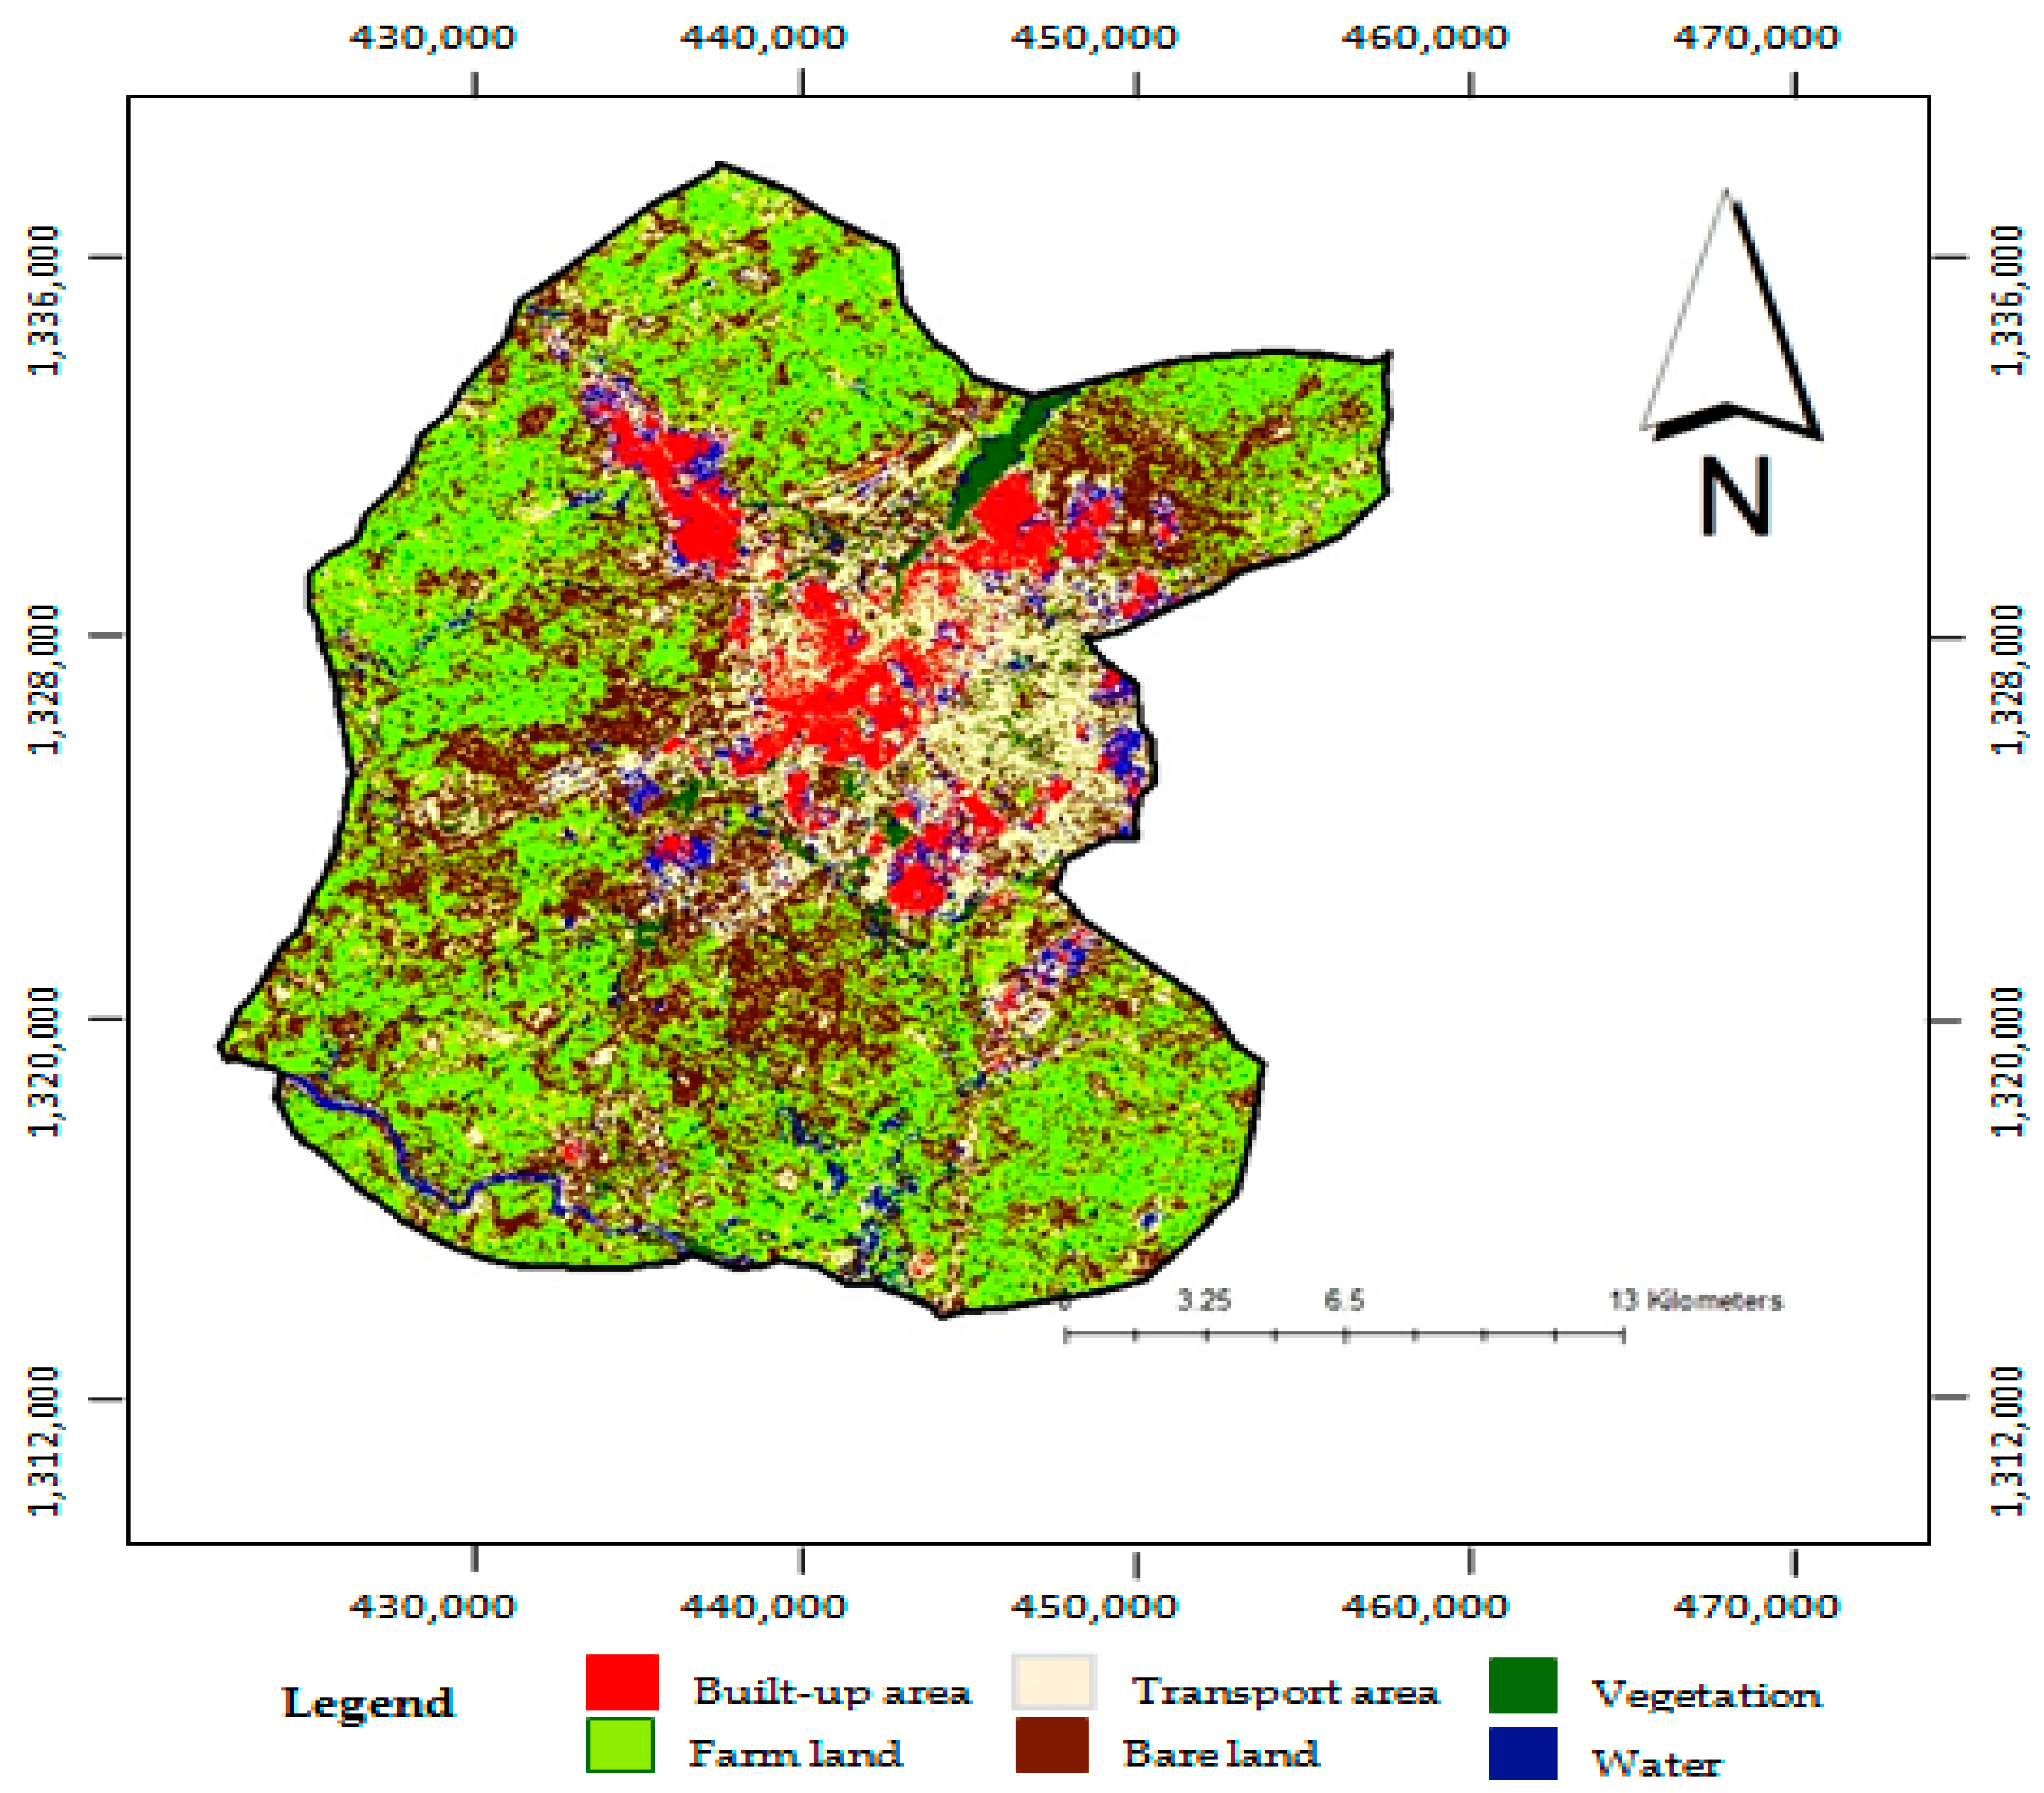
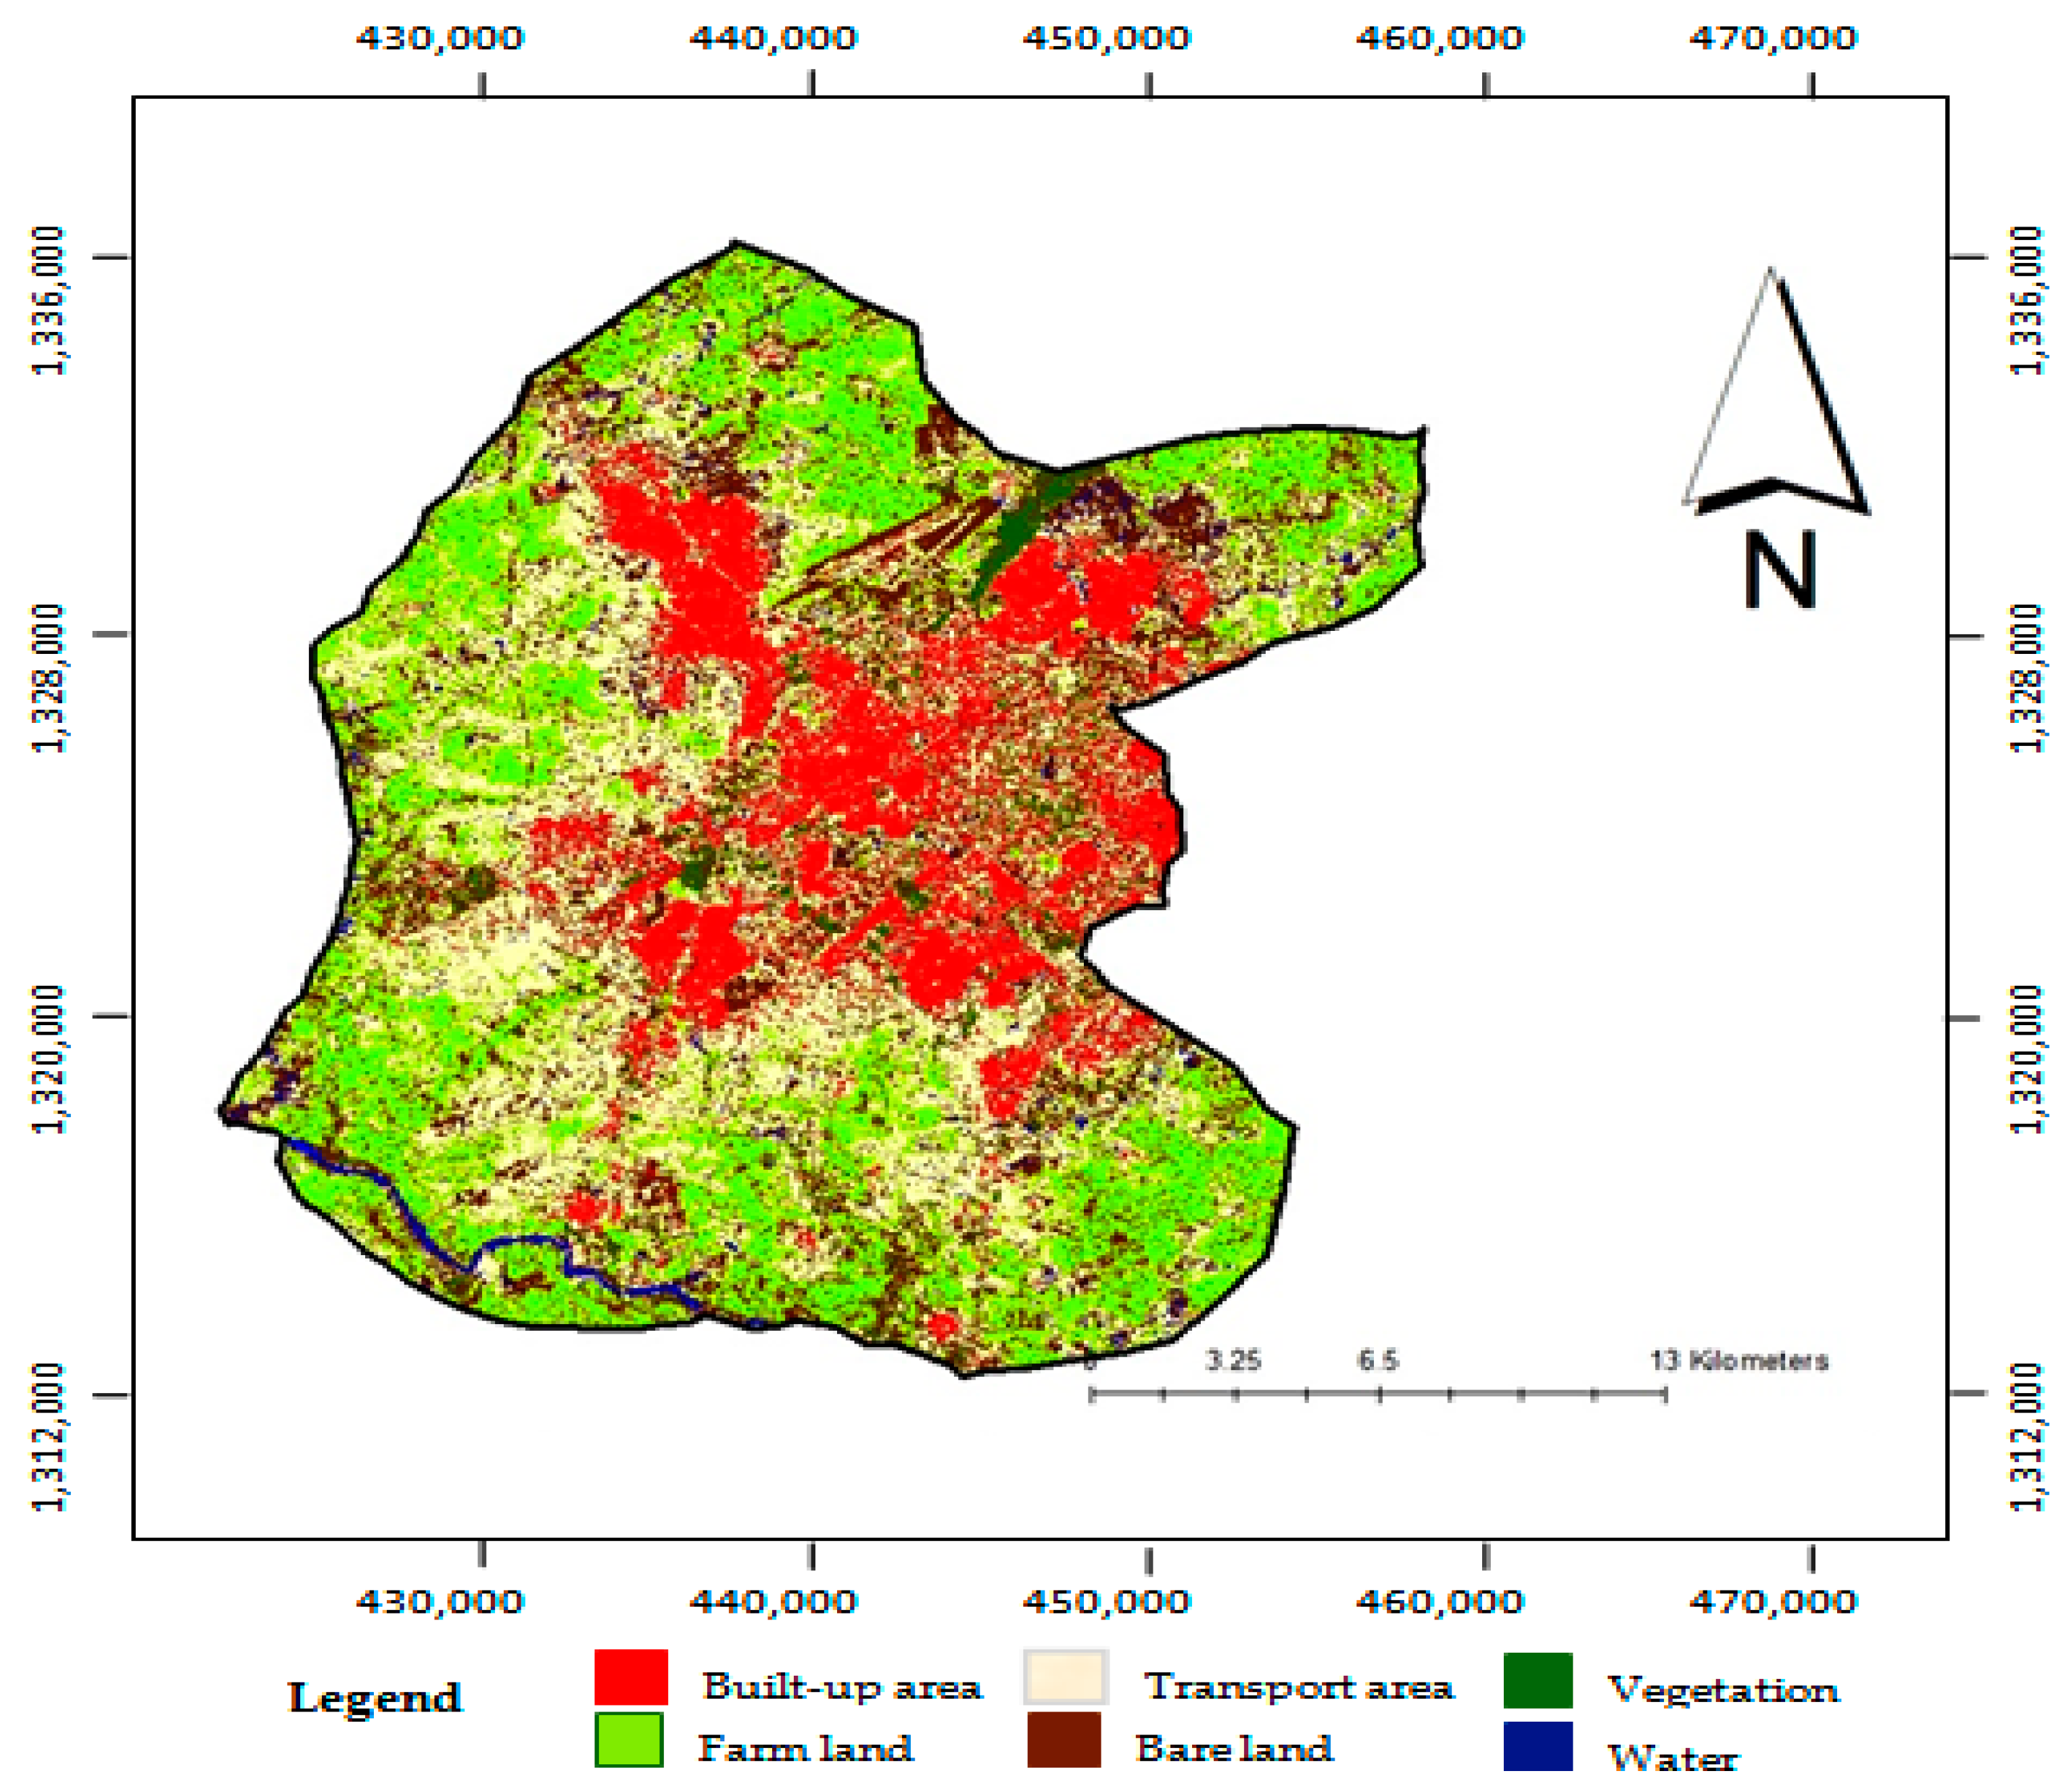
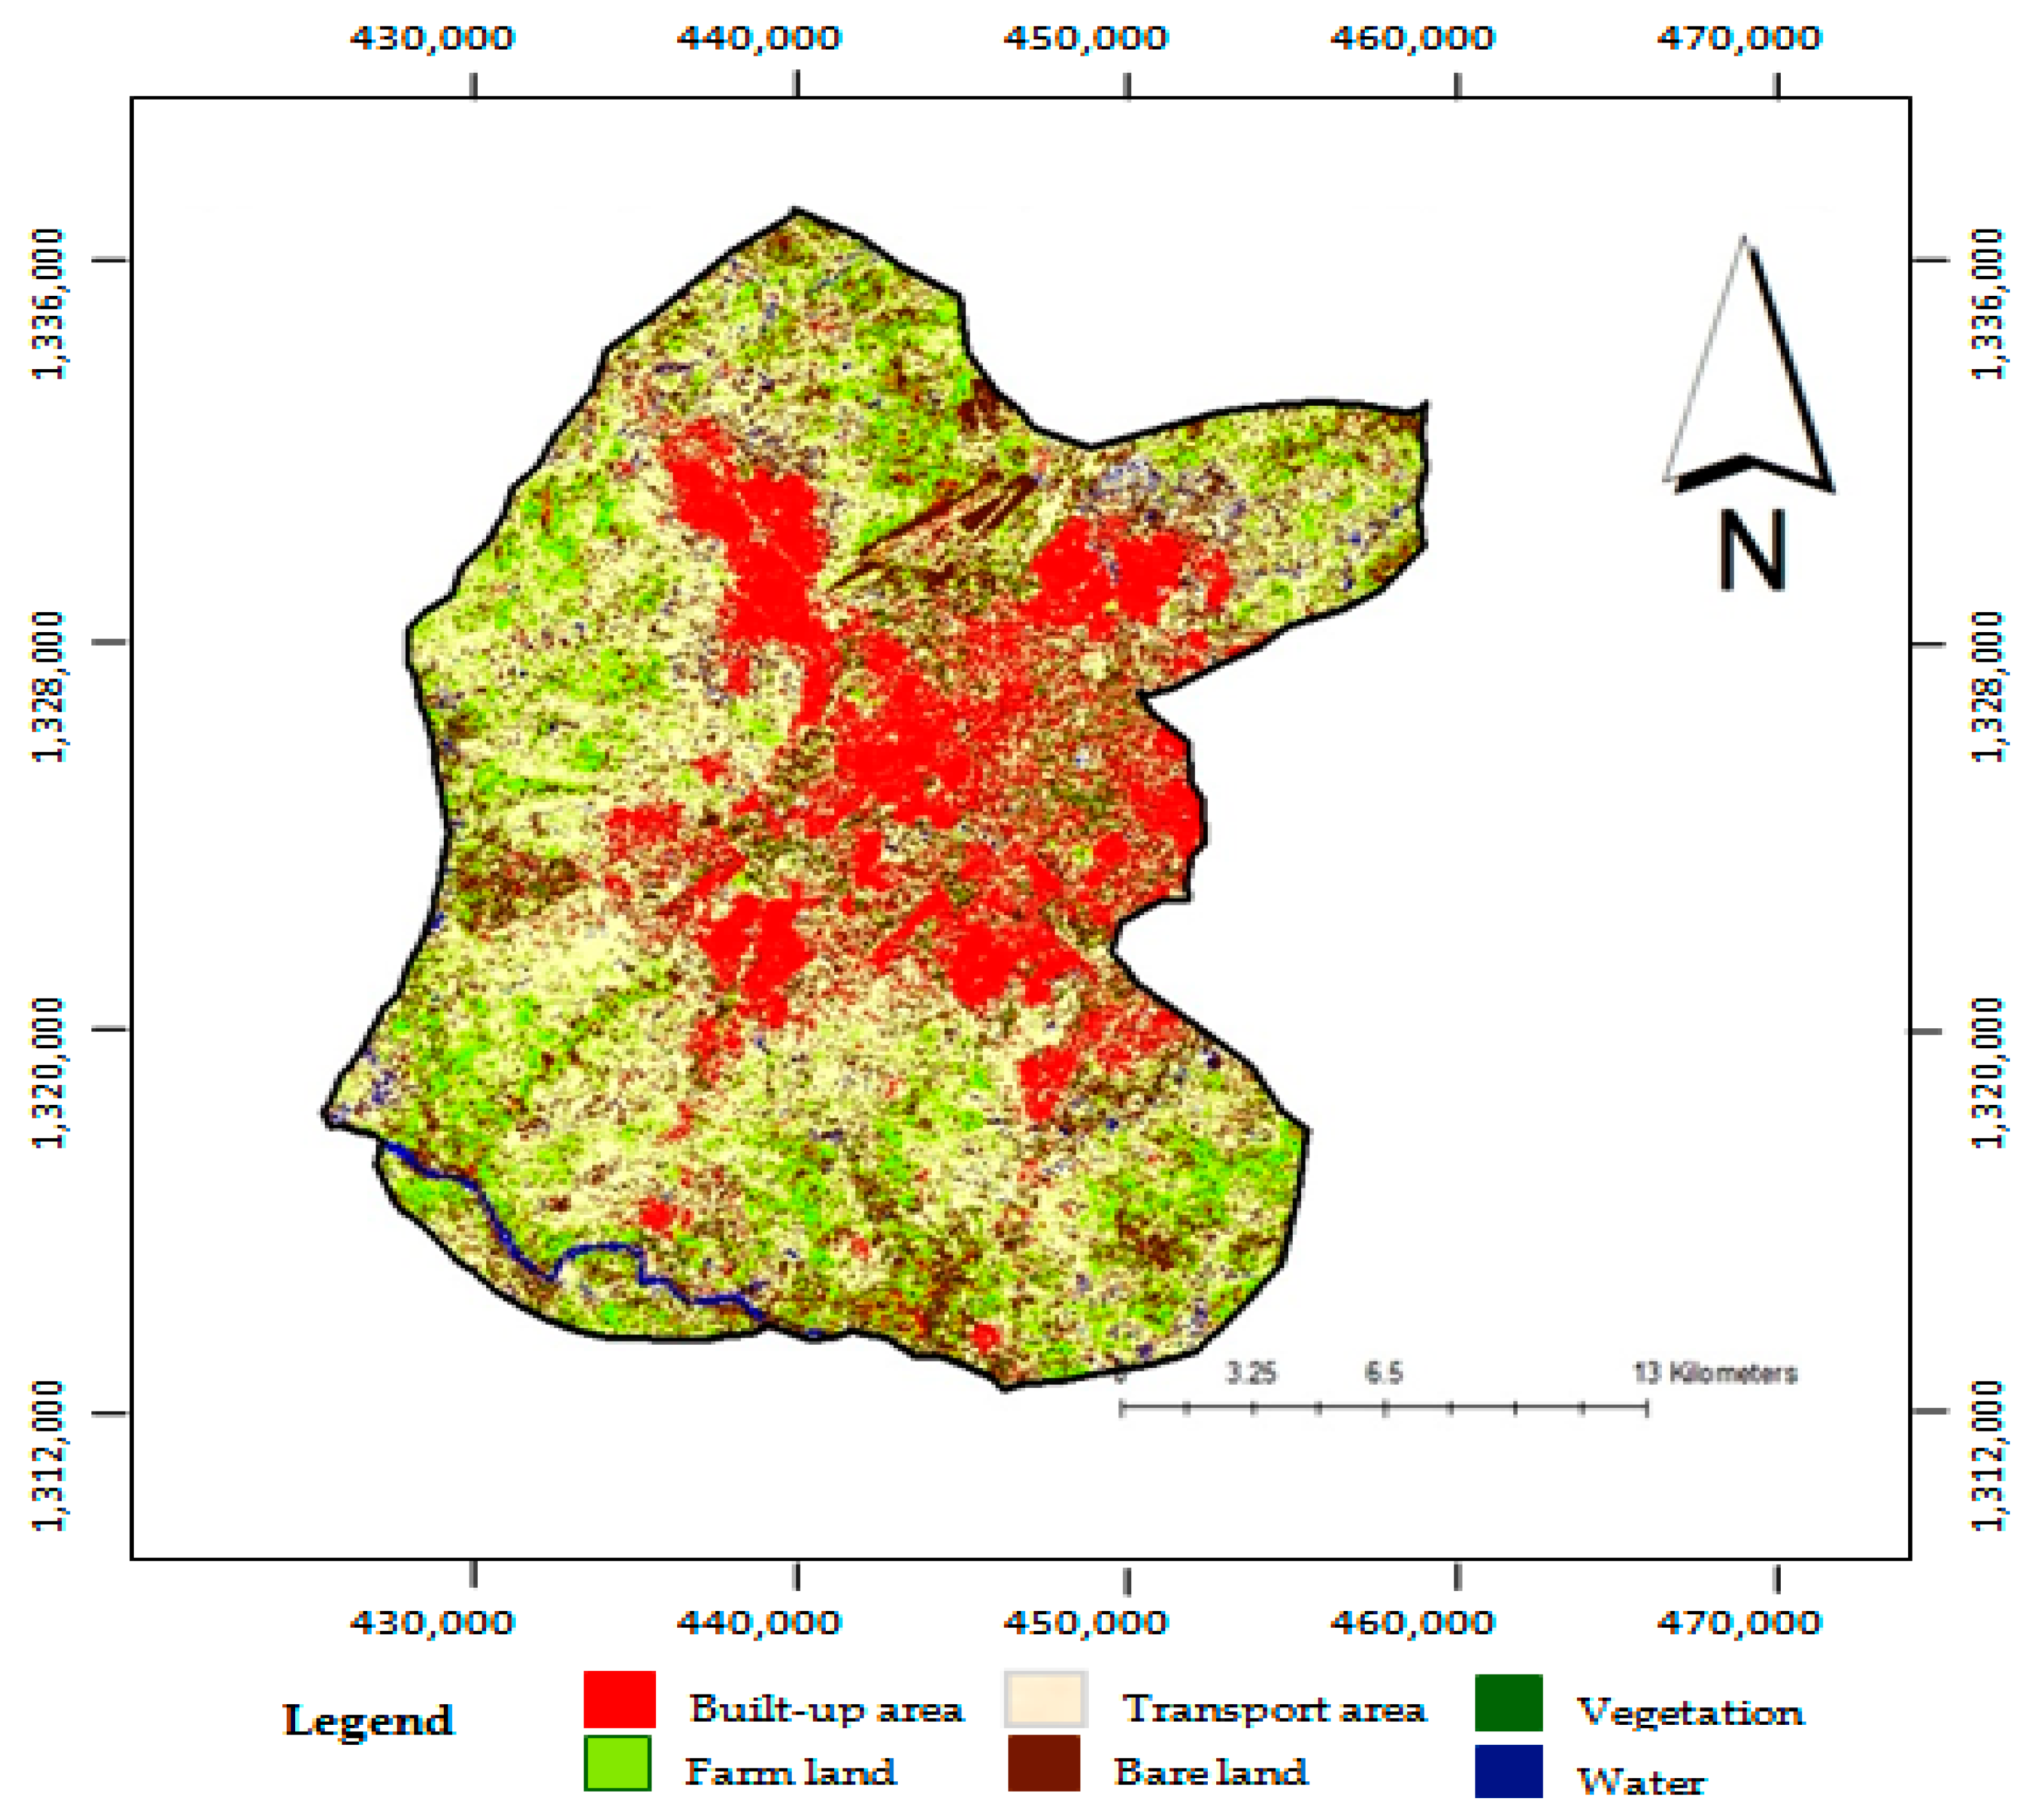
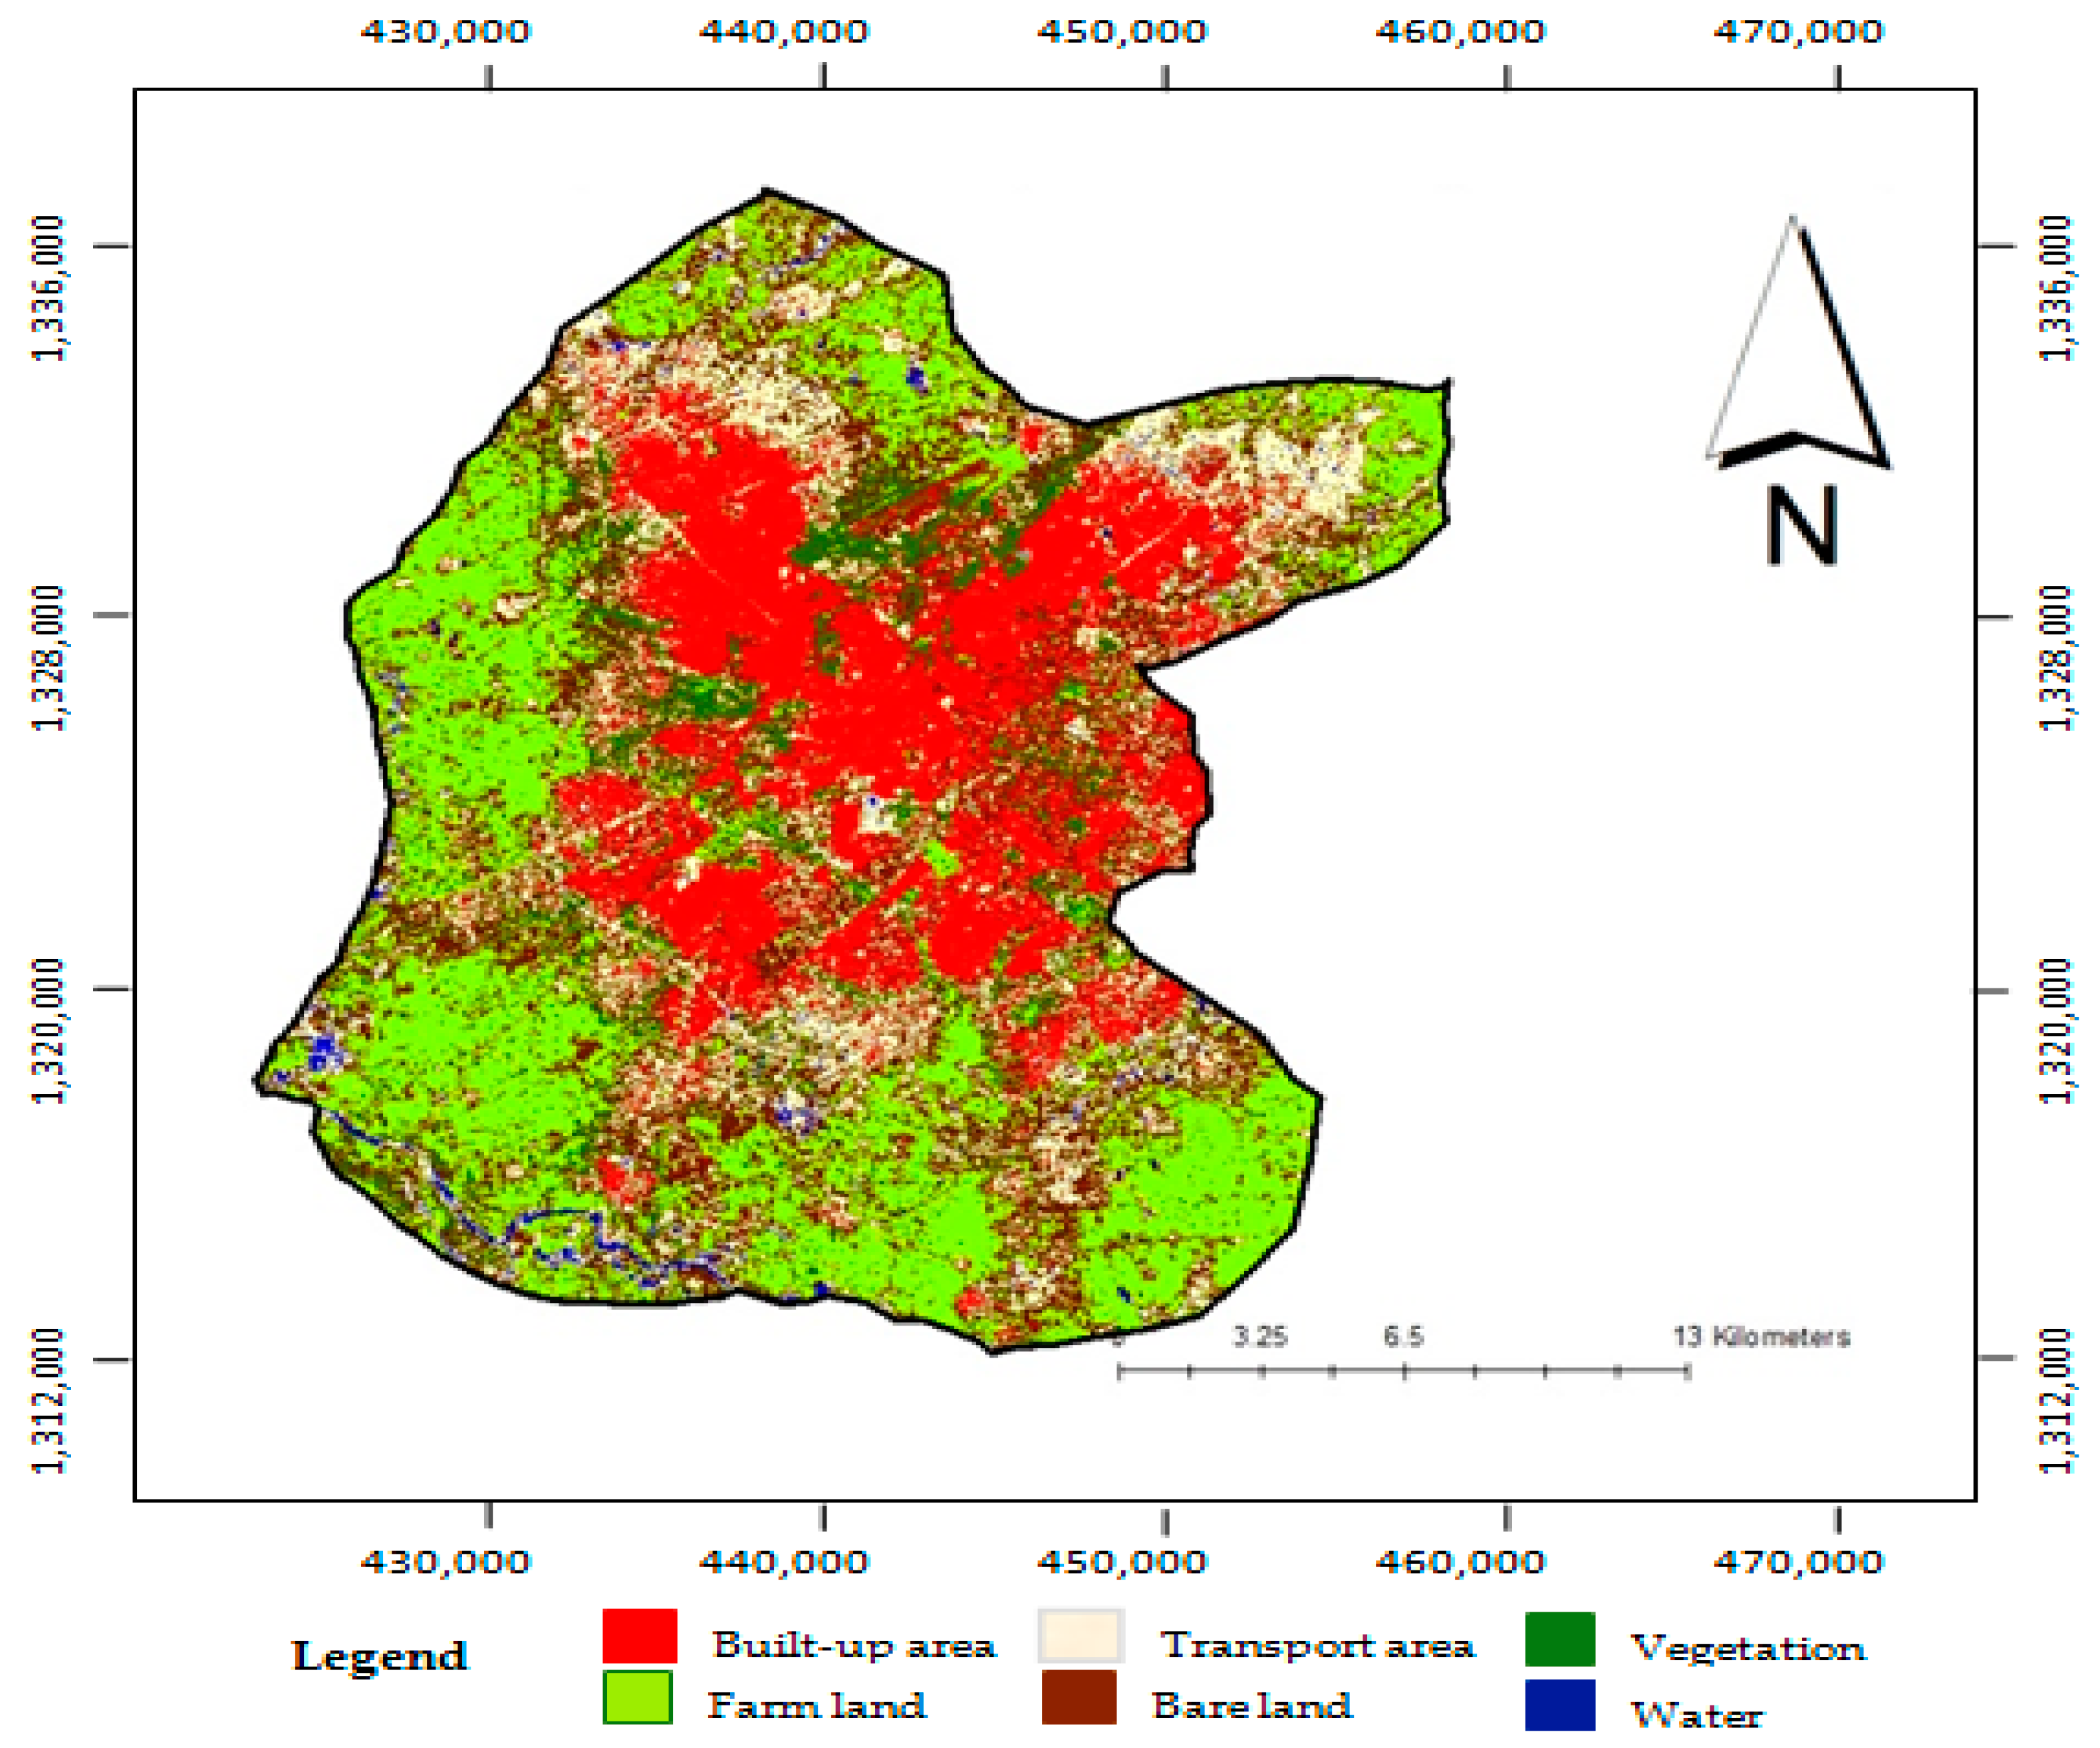
Land-use classification maps for 1980, 2013 and 2019 time series in Kano metropolitan respectively are shown in Figure 5, Figure 6 and Figure 7. Evidence of increasing of urbanization is apparent in continuously increasing agglomeration within Kano as shown in the LULC spatial expansion and transition gains in transport infrastructure and built-up areas in the two-time series (1984–2013 and 2013–2019), respectively. The spatial and temporal changes in the urban landscape are likely to be attributed to high indices of population and migration—the main factor for the emergence of the scattered mosaic of many urban slums especially on the fringes of Kano metropolis.
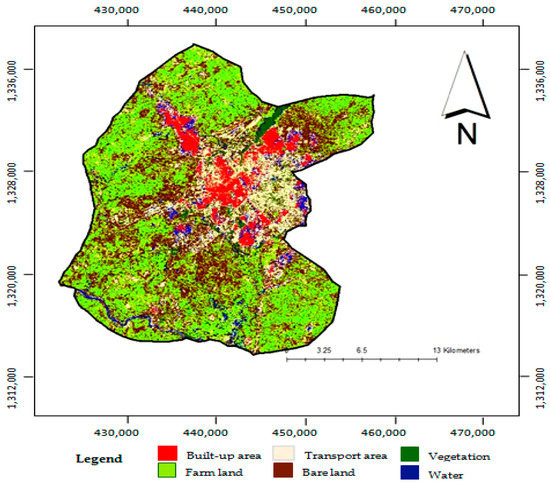
Figure 5.
Kano city classified LULC map of 1984.
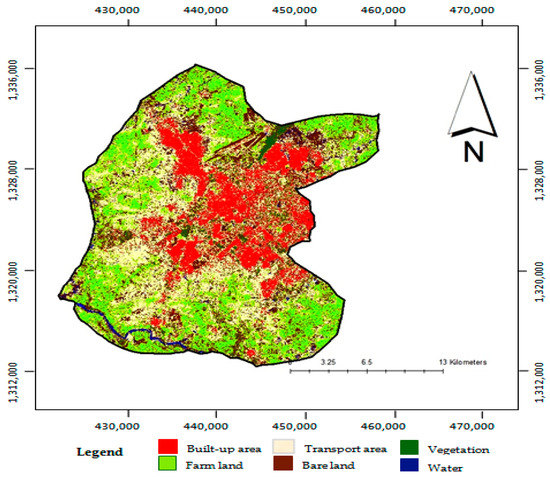
Figure 6.
Kano city classified LULC map of 2013.
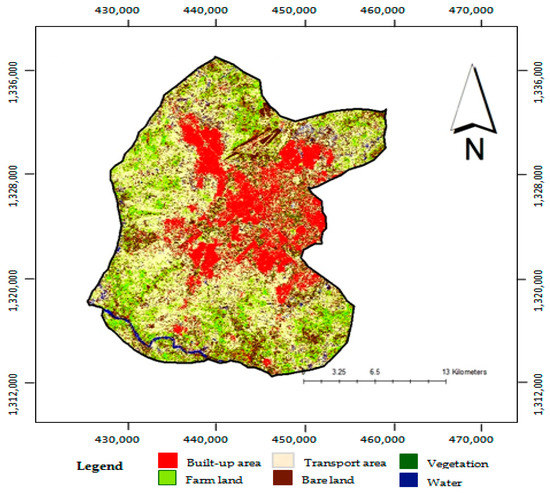
Figure 7.
Kano city classified LULC map of 2019.
Many researchers have found a similar link between high urbanization rates with economic growth to provide basic infrastructure development in many cities in Sub-Saharan Africa [16,54,55]. This inequitable expansion continues to pose serious commuting challenges to the urban population who have to navigate through exhaustive daily congestion experience in the city’s dilapidated and inadequate infrastructures of the single road transport mode, predominantly cars.
4.2. Markov Land-Use Prediction
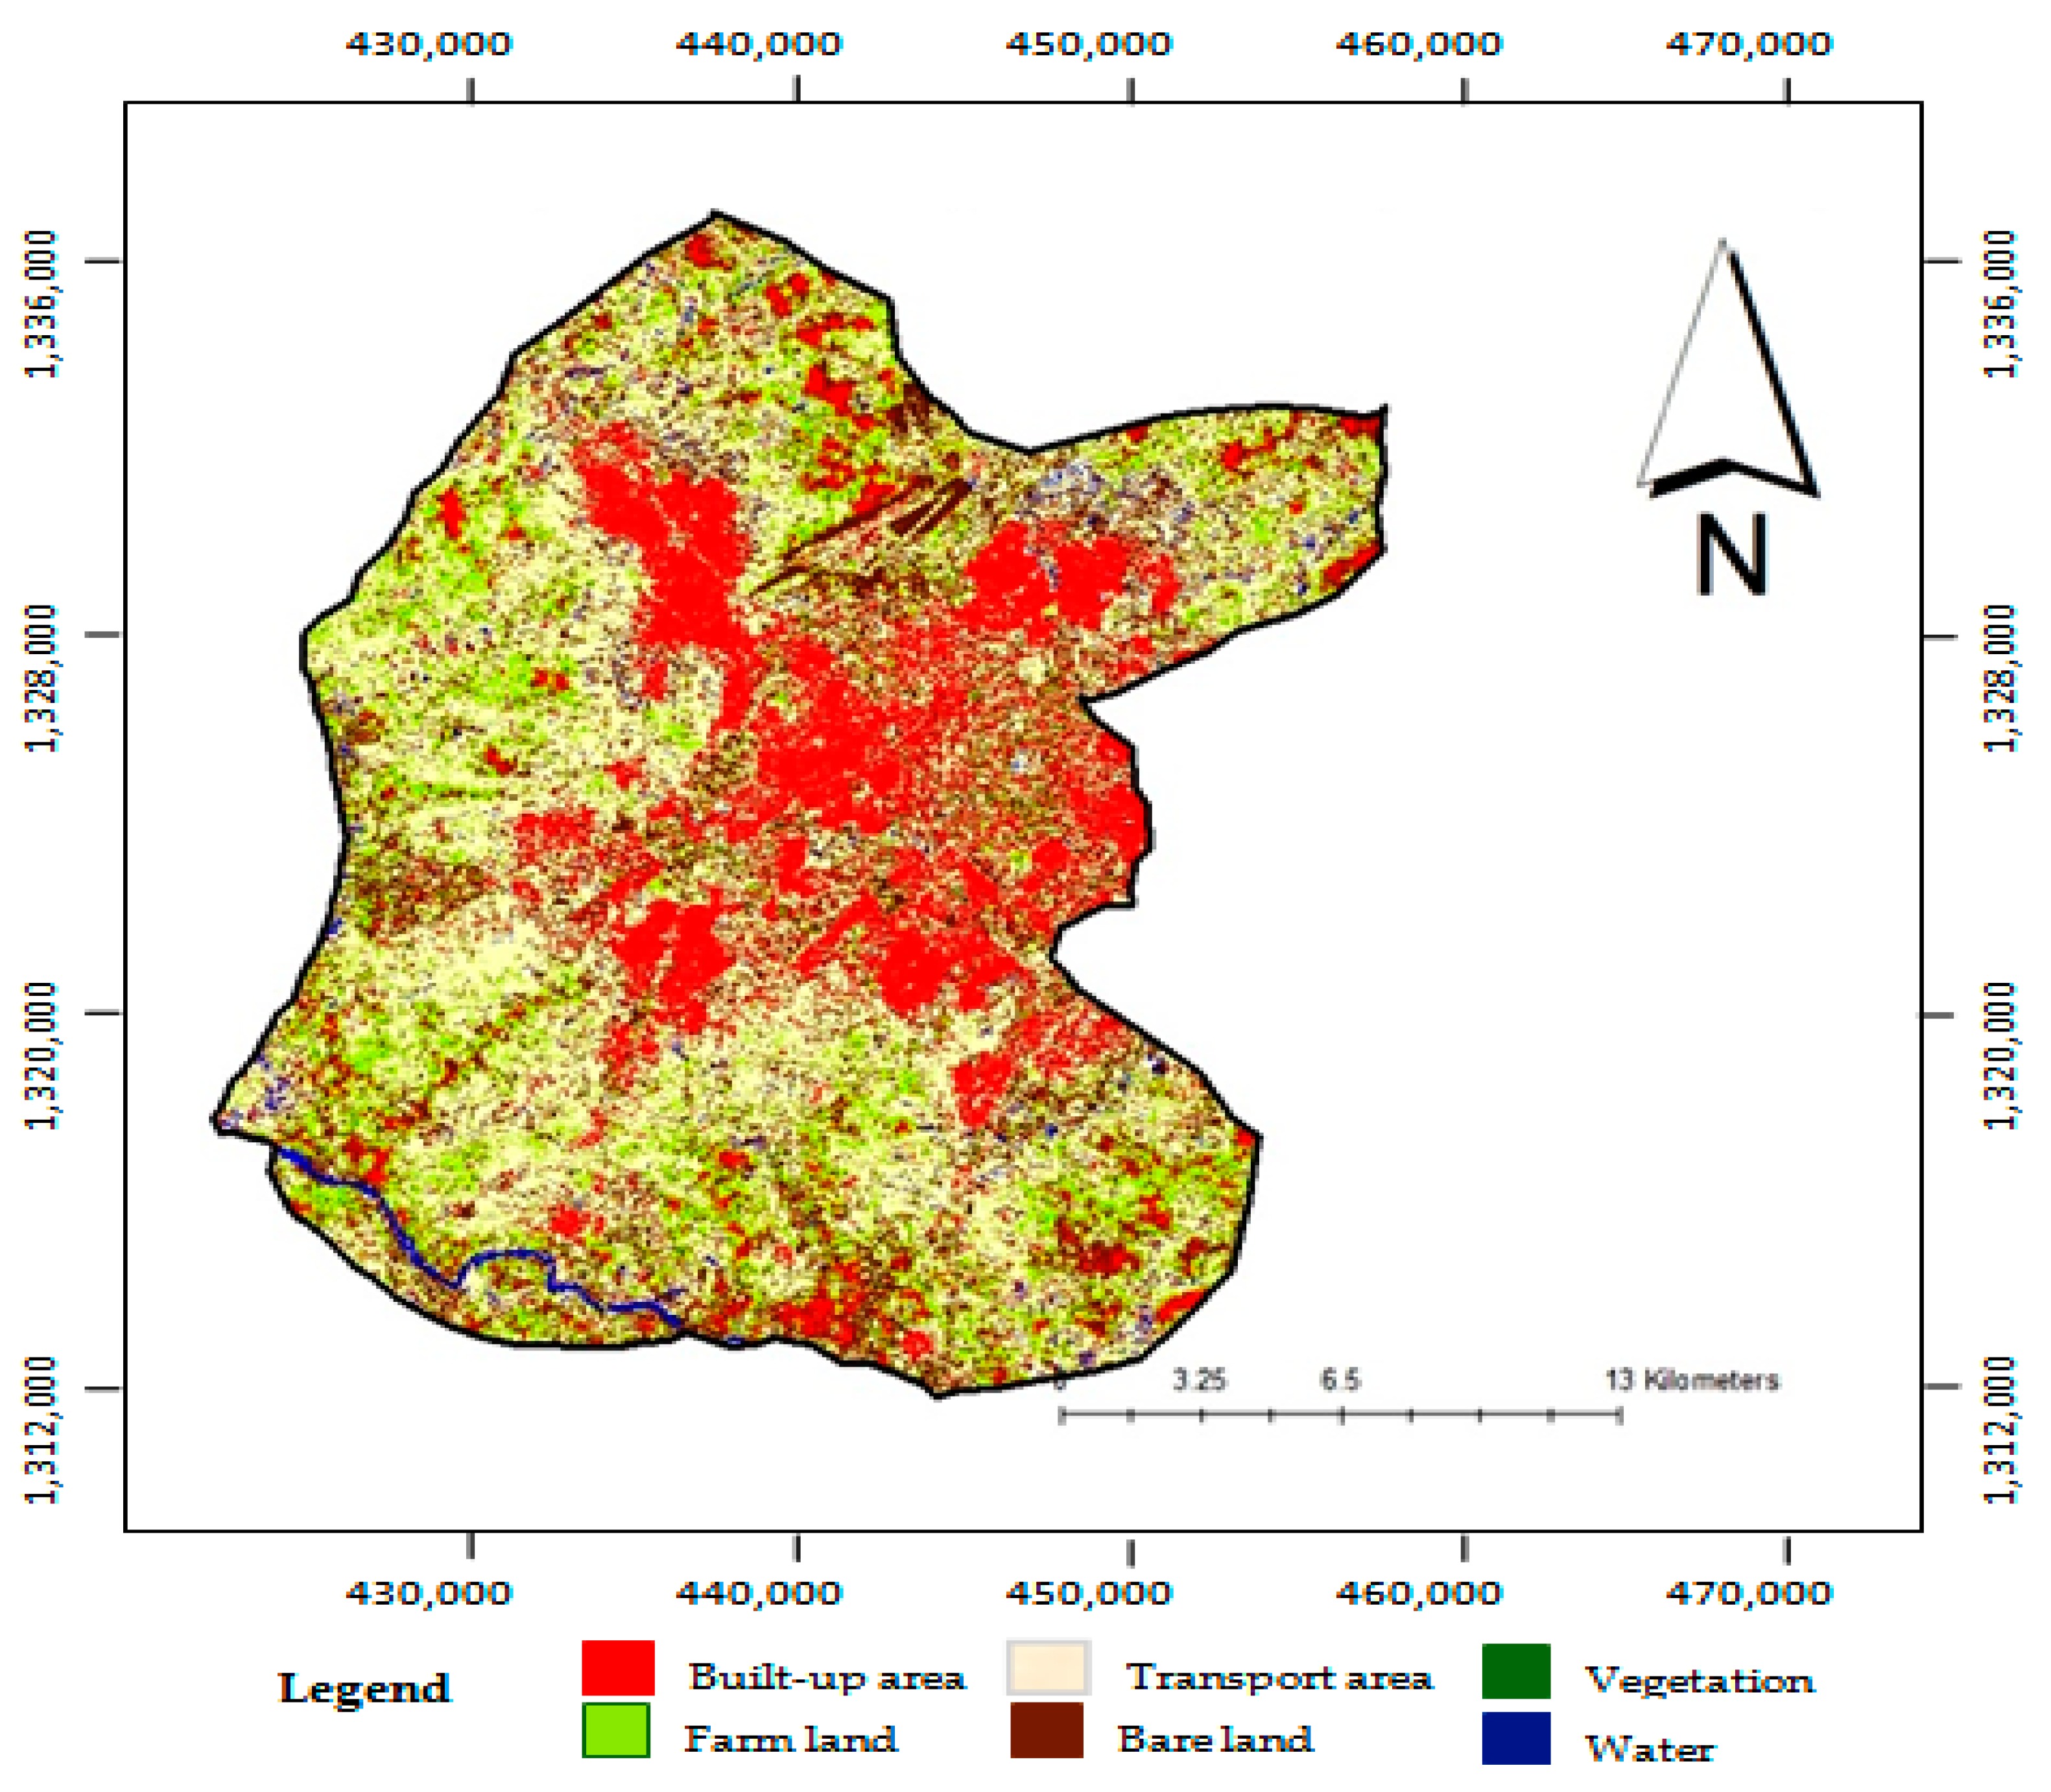
The model is used in the forecasting of future growth of the land dynamics, and is called Markov land-use prediction (MLP) after calibration and validation. The steps include defining, standardizing and aggregating defined criteria in the decision wizard module of IDRISI Selva 17.0 to area maps for LULC transition changes. To predict future urban land-use distribution at discrete time scales, we substitute inputs of initial state matrix areas (Equation (7)) and initial state transition matrix (Table 4) into a Markov simulation model in Equation (6). Transition distribution maps in Figure 8 and Figure 9 are the outcomes of the Markov chain prediction of urban landscape evolving trends in the Kano metropolitan environment for 2030 and 2050, respectively.
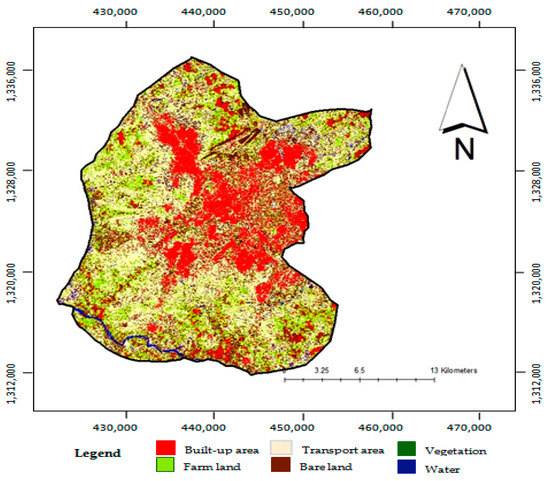
Figure 8.
Predicted LULC map of 2030.
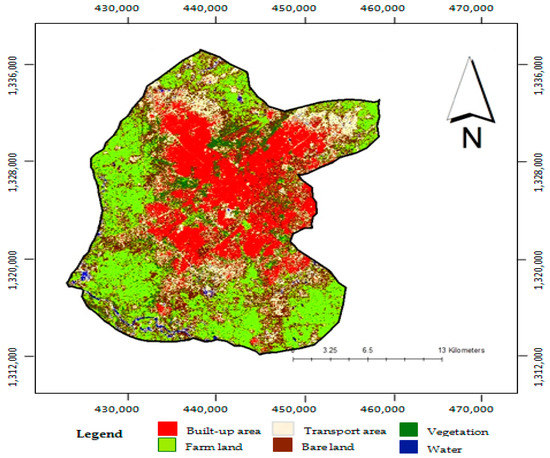
Figure 9.
Predicted LULC map of 2050 (Source: Authors, 2019).
Future prospects of these spatial-temporal growth indicators may be more realistic for built-up areas than transport infrastructure. The developments in the Nigerian built environment could be guaranteed as traditional land title holders, estate developers, businessmen and other private interests are the main purveyors of the sector. Huge infrastructure gaps were created by the legally binding roles of municipal governments representing various government levels (federal, state and local authorities), often with complex relationships in terms of planning visions, priorities, interests, resources and jurisdictions as the sole provider of urban infrastructures [34]. Nigeria’s dilapidated transport infrastructures—roads, airports and railway system—are the worst affected by multi-level public infrastructure decays due to politics, bureaucracies, and institutional corruption [56].
4.3. Transition Suitability Maps
ArcGIS was used to prepare images taking note of some important factors and constraints. It was further processed by importing into IDRISI were in the form of suitability maps, the CA-Markov chain analysis using multi-criteria evaluation (MCE) to produce decision rules. MCE involves a predictive decision technique that introduces an aspect of spatial contiguity and distribution of transition analysis in the Markov chain process. It involves using Boolean overlays to reduce criteria to suitability logical statements and combining statements by logical operators, i.e., union (OR) and intersection (AND). The modules incorporate factors (criteria) and trade-offs for creating suitability maps and to address the multi-objective decisions. The various factors (rules) and constraints were used to create a single evaluation index [57]. The factors display the level of suitability of the conversion area while constraints are depicted in the form of standardized Boolean maps where zero (0) values were the less acceptable regions and values close to one (1) were the most suitable LULC projected conversion areas [53,58].
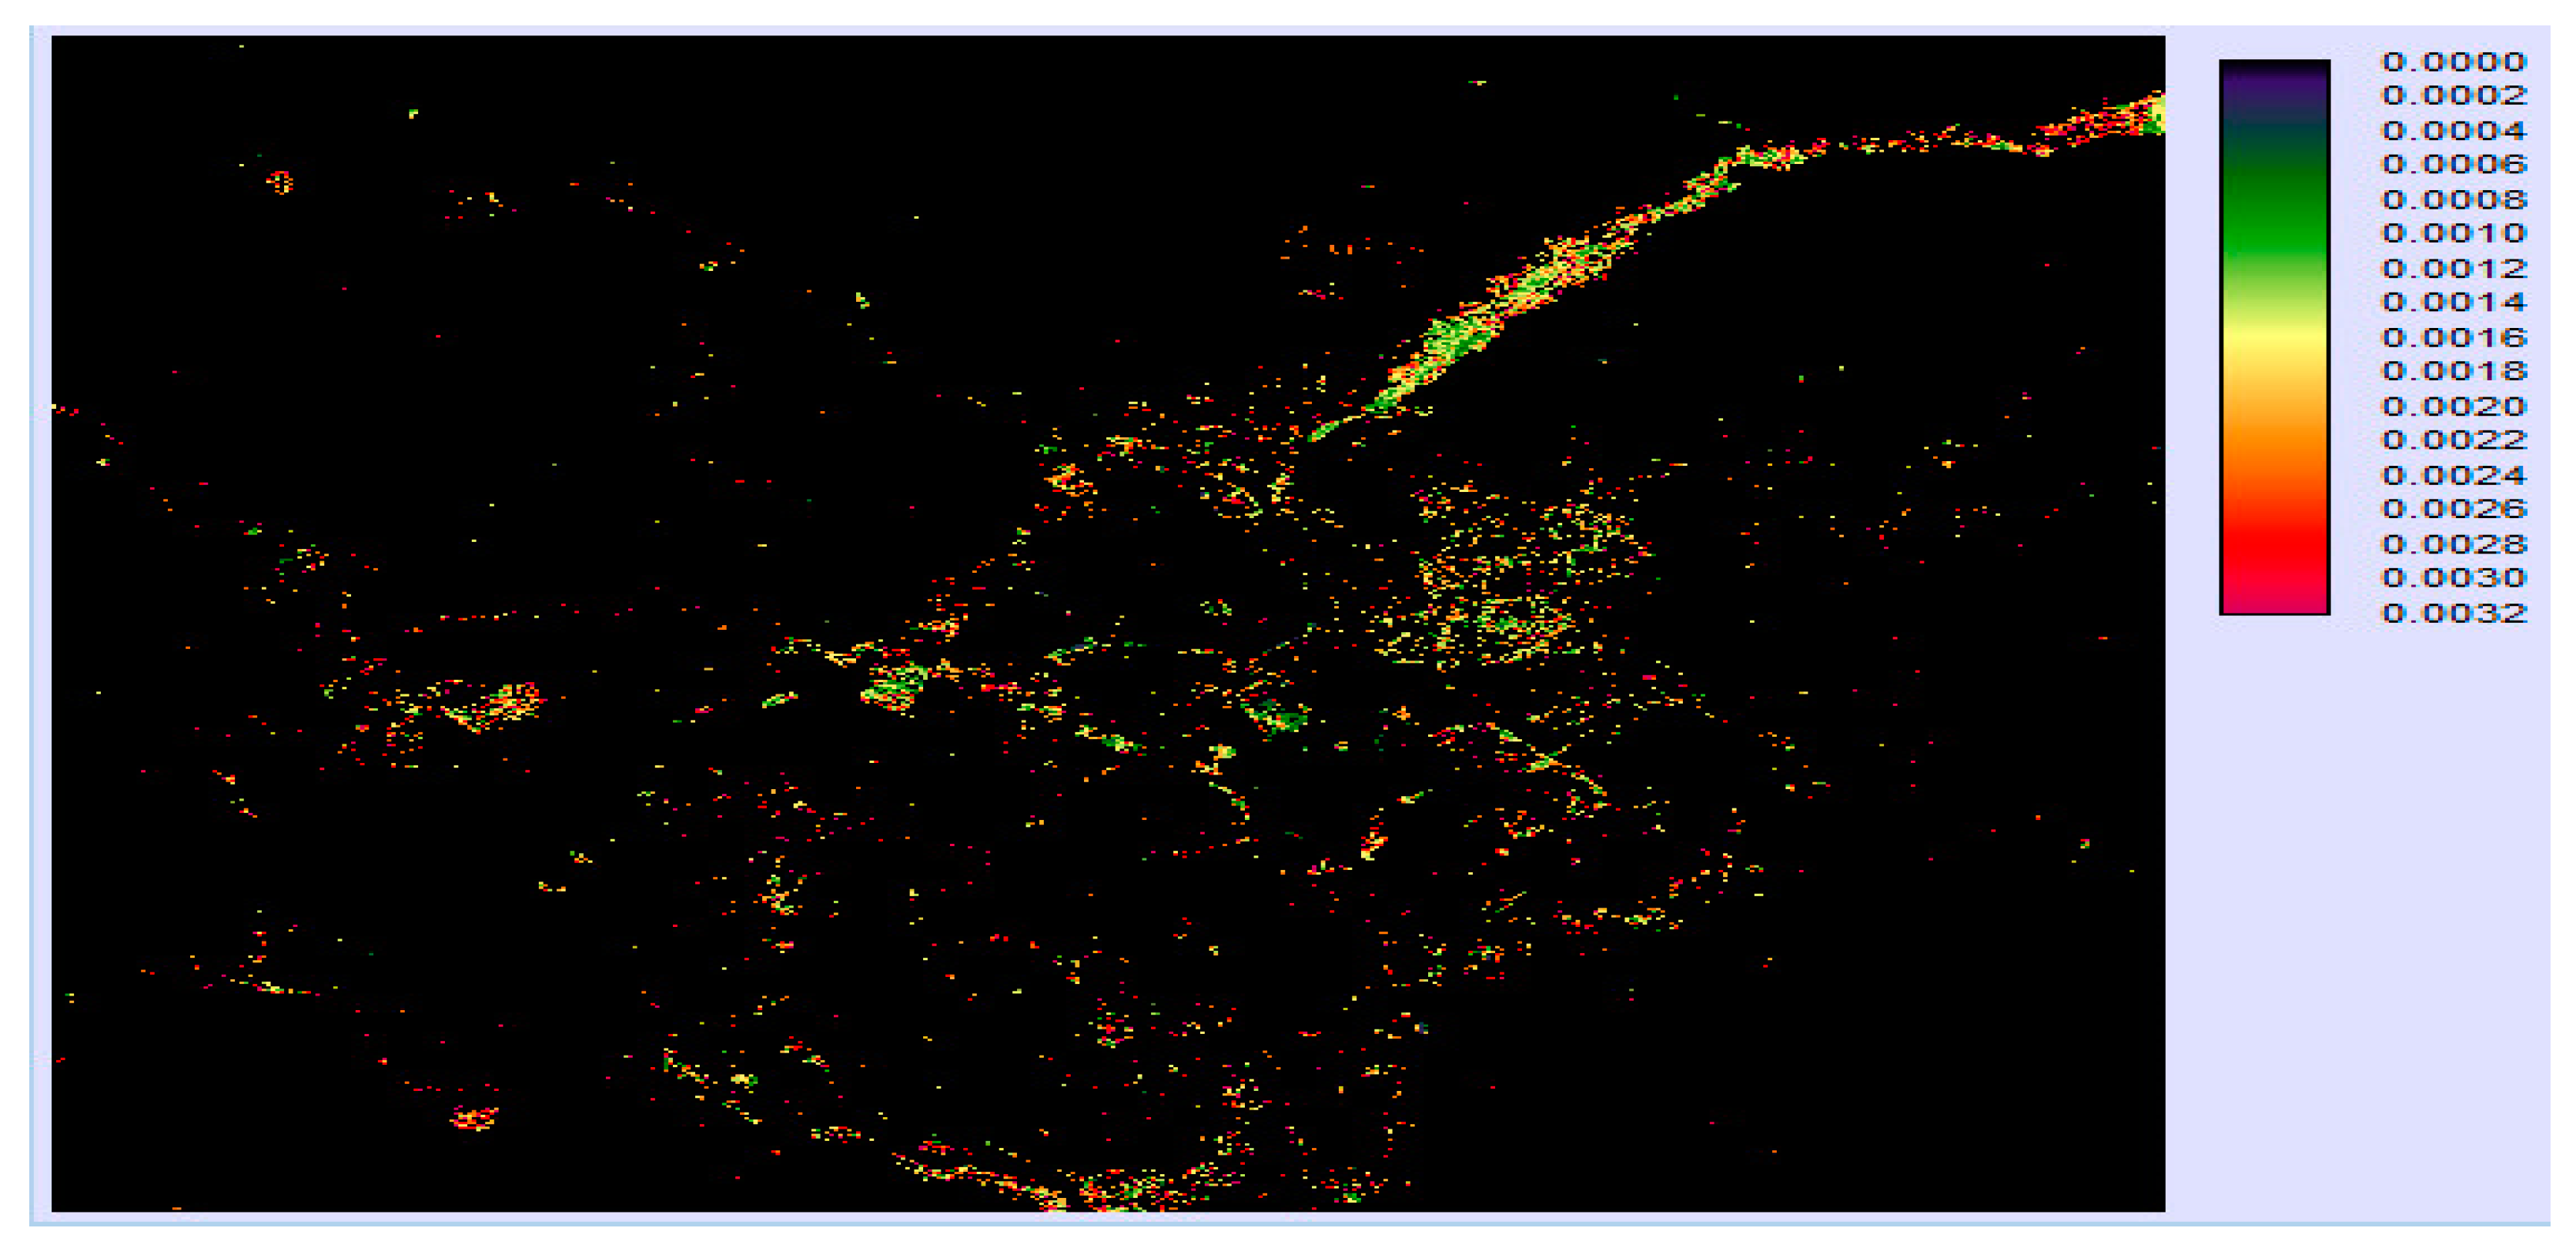
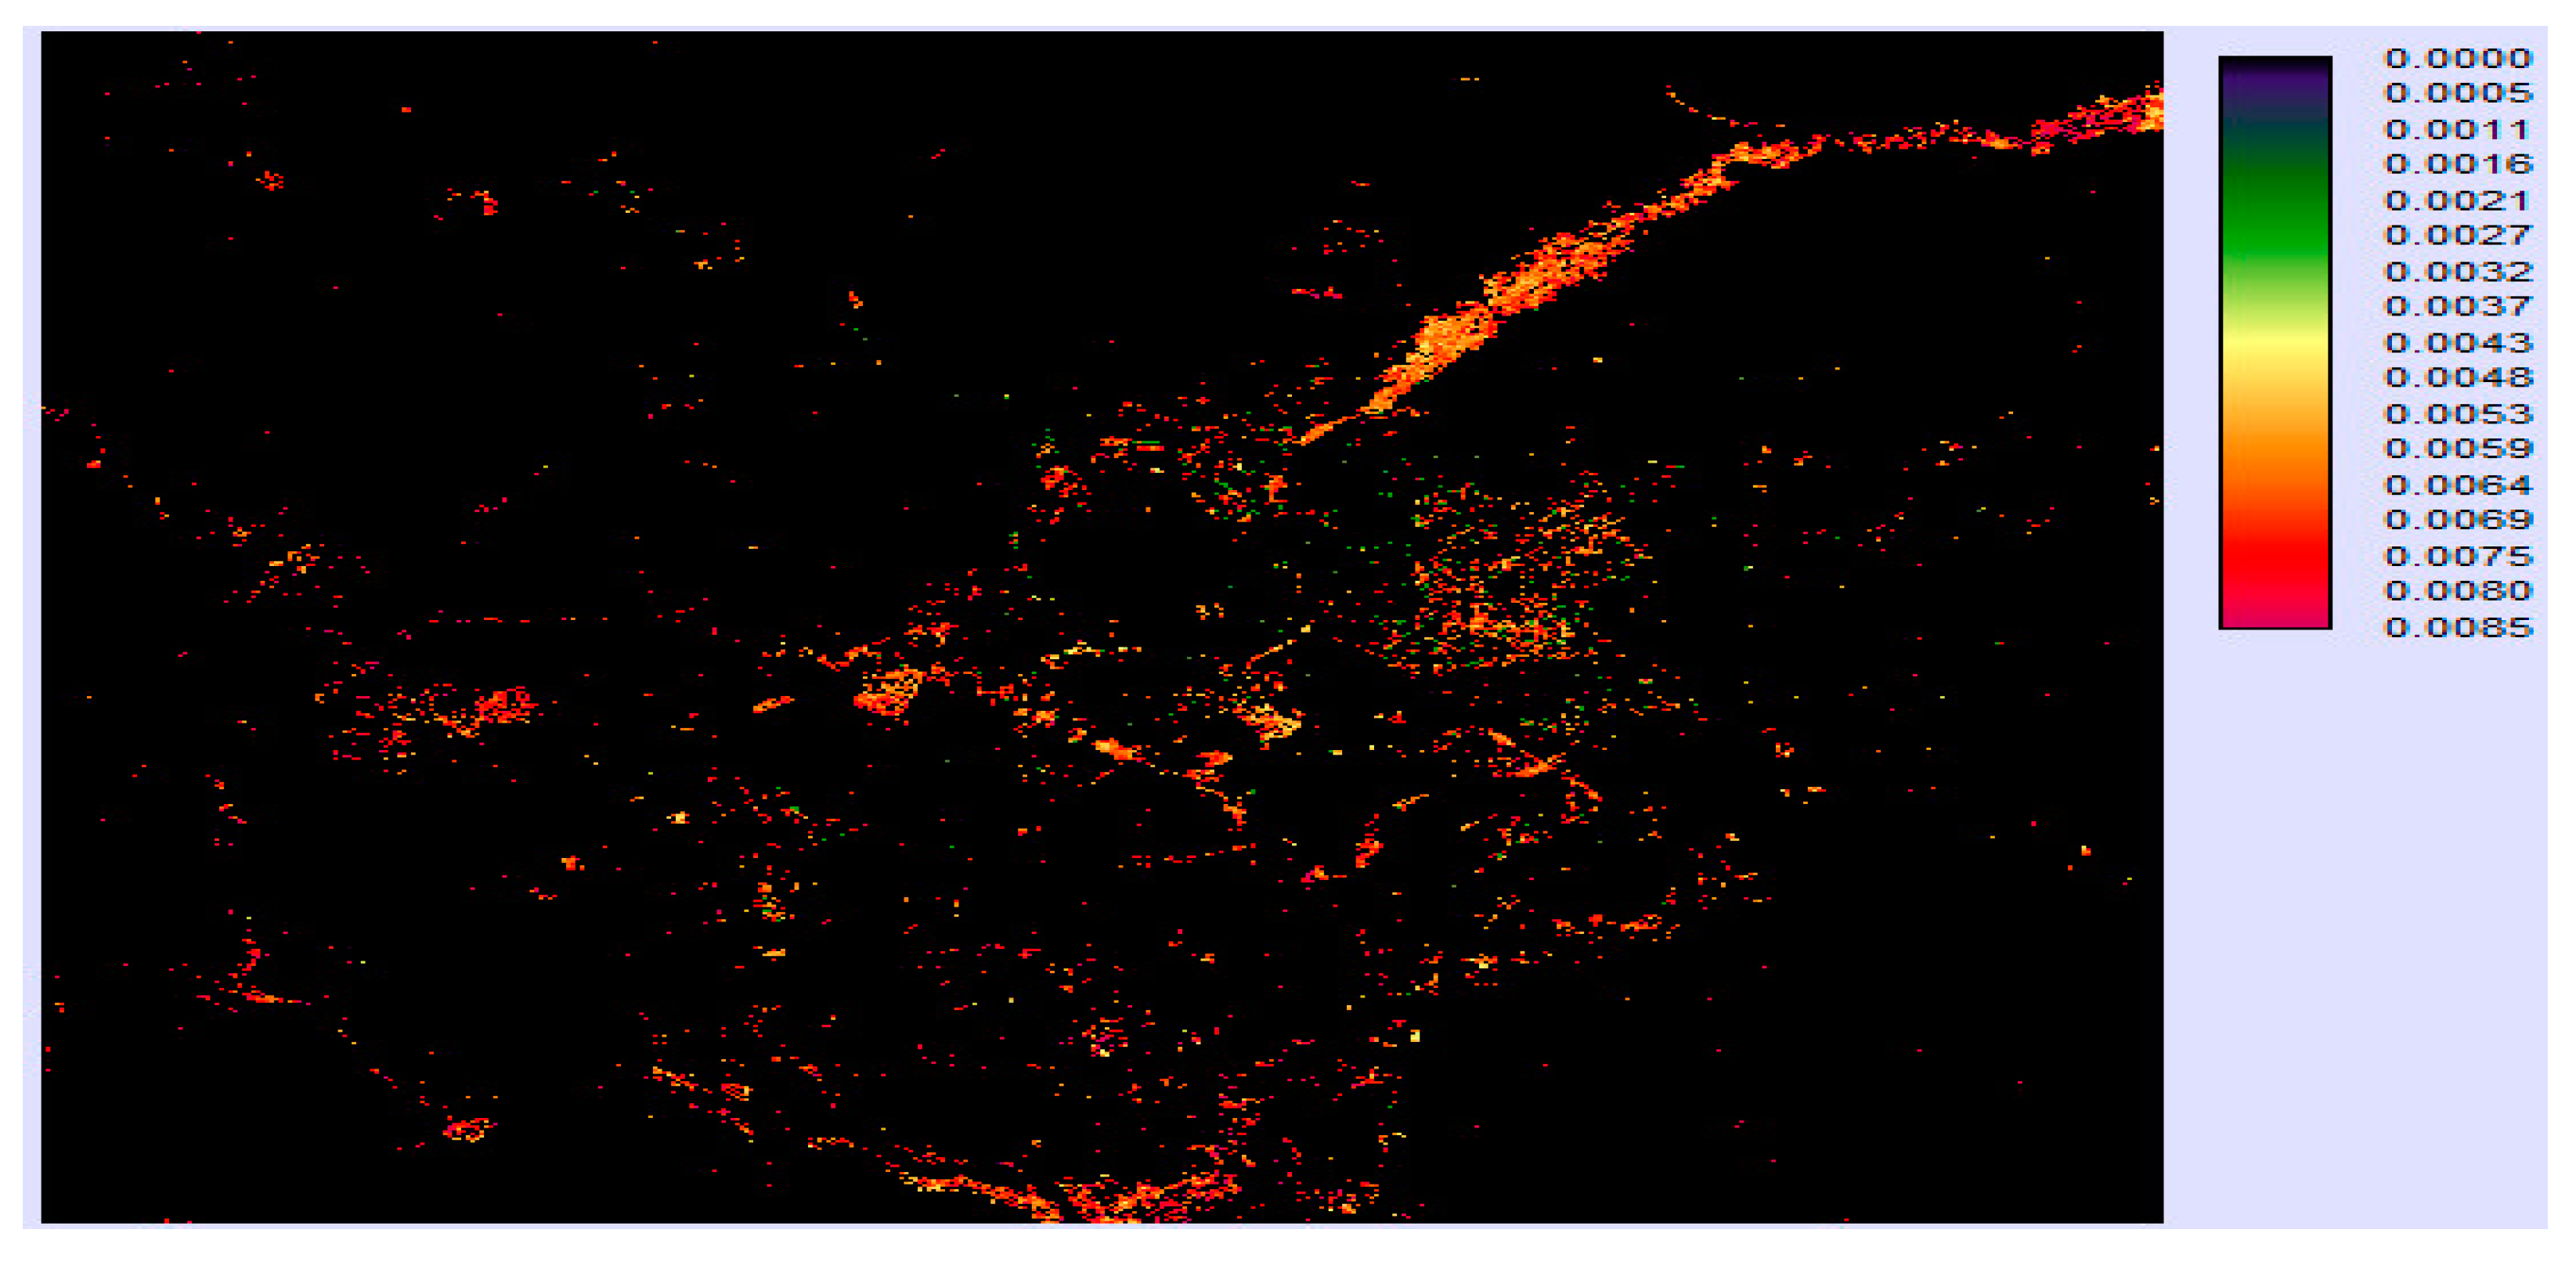
The study considered a set of factors that impact LULC transition rule, including transport facilities, demography, settlement, forest, urbanization, market, vegetation and agriculture etc. Infrastructure construction and water bodies were set as constraints and a Fuzzy function was used to process the standard factors in combination with the weighted linear combination (WLC) at different functions and control points. Using the WLC method, factors or criteria are standardized into similar numeric range, and combined by weighted average. In the WLC module, the weights of the factors were extracted from the analytic hierarchy process (AHP) function. The MCE module used the constraints, factors, and weights to extract a suitability map of land-use types while IDRISI Collection Editor derives suitability atlas. Transition potential suitability maps in Figure 10 and Figure 11 for 2030 and 2050 have parameters closer to zero, an indicator of a general lack of acceptable or suitable future change.
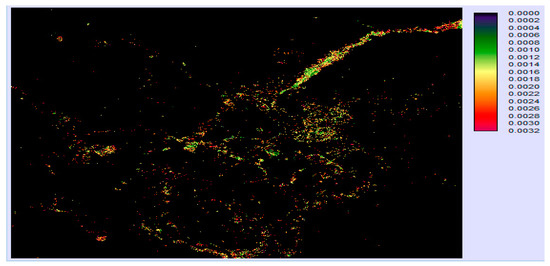
Figure 10.
Transition potential suitability map for 2030 (Source: Authors, 2019).
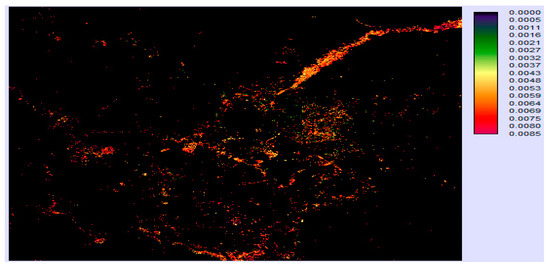
Figure 11.
Transition potential suitability map for 2050 (Source: Authors, 2019).
These images are evidence of some inequalities in spatial-temporal developments, unsustainable locations and susceptible LULC shifts requiring policy reorientation and focused attention on sustainable development of the city. Urban spaces are continuously littered with portfolios of poor quality, and decayed and abandoned transport infrastructure investments due to under-funding and bureaucratic corruption [55,59]. A more holistic approach to solving Kano city’s perennial transport problems is recommended, one that will include improving both the quality and quantity of transportation infrastructure, regional cooperation, transport demand management (TDM) and resiliently engineered and sustainable planning developments.
5. Conclusions
The findings from the research revealed the following:
The research has shown that future LULC transition and transport infrastructure spatial demand can be easily predicted using GIS and CA-Markov. Knowledge of the factors driving LULC shift is very critical for precise future outcomes and weighted suitability maps of the MCE process. During the past decades from 1984–2019, urbanization has increased unsuitable LULC changes by exerting demands that aided the spatial transformation of the transport area and built environment, and depleted other land uses. The results of Kappa classification accuracies ranging from 85% to 88% are within the range of 80–85% suggested in the literature.
According to the predictive models of transport infrastructure and metropolitan built-up areas will respectively experience spatial expansion by 345 km2 and 410 km2 from 2019 to 2030. Following the same trend, the prediction estimated a further 140 km2 land area conversion for transport infrastructure and 155 km2 for built-up areas in 2050. These spatial figures established a strong connection between LULC changes and unsuitable urbanization growth, especially in transport systems and built-up areas. LULC losses of farmland, bare land, vegetation and water LULC dynamic transition over the temporal time series pose a significant threat to biodiversity, the climate and environmental disharmony in Kano City.
The Arc-GIS CA-Markov hybrid model is spatially explicit and well-integrated as a means of isolating transport spatial, temporal development of other infrastructure and provides alternative pathways quantitative track evolution of urban process. Over the last three decades (1984–2019) under study, the developmental practices adopted have culminated in fragmented land use in Nigerian cities. The research will serve as a guide for spatial-temporal monitoring and to explore a sustainable approach to improving the relationship between land use and demand for urban transport facilities in many cities.
Although, the forecast of increasing transportation infrastructure could improve urban mobility frustration, congestion, and quality of life, sustained urbanization and population growths are likely to exacerbate the problem. While it is evident that Kano’s population and urbanization booms will continue to grow, exploring the various dimensions of integrated urban planning, sustainable transportation, transport demand management and inter-regional development cooperation could stem down urbanization and improve the wellbeing of urban society.
It is proposed that these future research studies use more comprehensive socioeconomic and environmental variables to enhance understanding of the causes, patterns and regional demographic influences to effectively guide transport and urban planning. Further studies may also attempt to determine possible changes in the intensification of land use resulting from changes in management of land-use resources.
Author Contributions
The authorship contribution CRediT taxonomy are “Conceptualization, S.H.O., D.V.L.H., and I.J.; methodology, S.H.O.; software, S.H.O.; validation, S.H.O.; formal analysis, S.H.O.; investigation, S.H.O.; resources, S.H.O., D.V.L.H., and I.J.; data curation, S.H.O., D.V.L.H., and I.J.; writing—original draft preparation, S.H.O.; writing—review and editing, D.V.L.H., and I.J.; visualization, S.H.O.; supervision, D.V.L.H., and I.J.; project administration, S.H.O., D.V.L.H., and I.J.; funding acquisition, S.H.O., D.V.L.H., and I.J. All authors have read and agreed to the published version of the manuscript.
Funding
This research was funded by the Petroleum Trust Development Fund (PTDF), Nigeria (https://ptdf.gov.ng/), who sponsored the doctoral study fellowship of Suleiman Hassan Otuoze. The APC was funded by the UK Engineering and Physical Sciences Research Council (EPSRC) under grant EP/J017698/1 (Transforming the Engineering of Cities to Deliver Societal and Planetary Wellbeing) for Dexter V. L. Hunt.
Institutional Review Board Statement
Not applicable.
Informed Consent Statement
Not applicable.
Data Availability Statement
Data sharing not applicable.
Acknowledgments
The authors would like to thank the staff and management of University of Birmingham, United Kingdom for the various support during the fellowship experience. Also, we wish to appreciate the management of Ahmadu Bello University for granting study leave for Suleiman Hassan Otuoze.
Conflicts of Interest
The authors declare no conflict of interest.
References
- Satterthwaite, D.; McGranahan, G.; Tacoli, C. Urbanization and its implications for food and farming. Philos. Trans. R. Soc. B Biol. Sci. 2010, 365, 2809–2820. [Google Scholar] [CrossRef]
- Rimal, B.; Zhang, L.; Stork, N.E.; Sloan, S.; Rijal, S. Urban Expansion Occurred at the Expense of Agricultural Lands in the Tarai Region of Nepal from 1989 to 2016. Sustainability 2018, 10, 1341. [Google Scholar] [CrossRef]
- Singh, S.K.; Srivastava, P.K.; Szabó, S.; Petropoulos, G.P.; Gupta, M.; Islam, T. Landscape transform and spatial metrics for mapping spatiotemporal land cover dynamics using Earth Observation data-sets. Geocarto. Int. 2016, 32, 1–15. [Google Scholar] [CrossRef]
- EEA. Transport Greenhouse Gas Emissions: The Seventh Environment Action Programme (7th EAP). EEA Environmental Indicator Report 2018, Coppenhagen, Denmark. 2018. Available online: https://www.eea.europa.eu/airs/2018/resource-efficiency-and-low-carbon-economy/transport-ghg-emissions (accessed on 2 August 2020).
- Asamoah, E.F.; Zhang, L.; Liu, G.; Owusu-Prempeh, N.; Rukundo, E. Estimating the “Forgone” ESVs for Small-Scale Gold Mining Using Historical Image Data. Sustainability 2017, 9, 1976. [Google Scholar] [CrossRef]
- Basommi, L.P.; Guan, Q.; Cheng, D.; Singh, S.K. Dynamics of land use change in a mining area: A case study of Nadowli District, Ghana. J. Mt. Sci. 2016, 13, 633–642. [Google Scholar] [CrossRef]
- Duraisamy, V.; Bendapudi, R.; Jadhav, A. Identifying hotspots in land use land cover change and the drivers in a semi-arid region of India. Environ. Monit. Assess. 2018, 190, 1–21. [Google Scholar] [CrossRef]
- Ejaro, S.P.; Abdullahi, U. Spatiotemporal analyses of land use and land cover changes in Suleja Local Government Area, Niger State, Nigeria. J. Environ. Earth Sci. 2013, 3, 72–83. [Google Scholar]
- Hassan, Z.; Shabbir, R.; Ahmad, S.S.; Malik, A.H.; Aziz, N.; Butt, A.; Erum, S. Dynamics of land use and land cover change (LULCC) using geospatial techniques: A case study of Islamabad Pakistan. SpringerPlus 2016, 5, 1–11. [Google Scholar] [CrossRef]
- Khan, S.; Qasim, S.; Ambreen, R.; Syed, Z.-U.-H. Spatio-Temporal Analysis of Landuse/Landcover Change of District Pishin Using Satellite Imagery and GIS. J. Geogr. Inf. Syst. 2016, 8, 361–368. [Google Scholar] [CrossRef]
- Okoli, I.E.; Okoro, C.B.; Adekitan, R.A. The economic effect of urbanization to sustainable food production and development. Int. J. Sch. Res. 2016, 11, 50–62. [Google Scholar]
- Weng, Q. A remote sensing? GIS evaluation of urban expansion and its impact on surface temperature in the Zhujiang Delta, China. Int. J. Remote Sens. 2001, 22, 1999–2014. [Google Scholar] [CrossRef]
- Barredo, J.I.; Demicheli, L.; LaValle, C.; Kasanko, M.; McCormick, N. Modelling Future Urban Scenarios in Developing Countries: An Application Case Study in Lagos, Nigeria. Environ. Plan. B Plan. Des. 2004, 31, 65–84. [Google Scholar] [CrossRef]
- Mundia, C.N.; Aniya, M. Dynamics of landuse/cover changes and degradation of Nairobi City, Kenya. Land Degrad. Dev. 2006, 17, 97–108. [Google Scholar] [CrossRef]
- Prasad, V.K.; Stinner, B.; Stinner, D.; Cardina, J.; Moore, R.; Gupta, P.K.; Tsuruta, H.; Tanabe, K.; Badarinath, K.V.S.; Hoy, C. Trends in food production and nitrous oxide emissions from the agriculture sector in India: Environmental implications. Reg. Environ. Chang. 2003, 3, 154–161. [Google Scholar] [CrossRef]
- Farrell, K. An Inquiry into the Nature and Causes of Nigeria’s Rapid Urban Transition. Urban Forum 2018, 29, 277–298. [Google Scholar] [CrossRef]
- Jiboye, A.D. Sustainable Urbanization: Issues and Challenges for Effective Urban Governance in Nigeria. J. Sustain. Dev. 2011, 4, 211. [Google Scholar] [CrossRef]
- Ujoh, F.; Kwabe, I.D.; Ifatimehin, O. Understanding urban sprawl in the Federal Capital City, Abuja: Towards sustainable urbanization in Nigeria. J. Geogr. Reg. Plan. 2010, 2, 106–113. [Google Scholar]
- Fox, S.; Bloch, R.; Monroy, J. Understanding the Dynamics of Nigeria’s Urban Transition: A Refutation of the ’Stalled Urbanisation’ Hypothesis. Urban Stud. 2018, 55, 947–964. [Google Scholar] [CrossRef]
- Mukhtar, S. Land use land cover change detection through remote sensing approach in Kano State Nigeria. Pyrex J. Geogr. Reg. Plan. 2016, 2, 16–28. [Google Scholar]
- Suleiman, M.S.; Wasonga, O.V.; Mbau, J.S.; Elhadi, Y.A. Spatial and temporal analysis of forest cover change in Falgore Game Reserve in Kano, Nigeria. Ecol. Process. 2017, 6, 11. [Google Scholar] [CrossRef]
- Jianping, L.; Bai, Z.; Feng, G. RS-and-GIS-supported forecast of grassland degradation in southwest Songnen plain by Markov model. Geo-Spatial Inf. Sci. 2005, 8, 104–109. [Google Scholar] [CrossRef]
- Zhang, Y.; Odeh, I.O.; Ramadan, E. Assessment of land surface temperature in relation to landscape metrics and fractional vegetation cover in an urban/peri-urban region using Landsat data. Int. J. Remote Sens. 2012, 34, 168–189. [Google Scholar] [CrossRef]
- García-Mora, B.; Santamaría, C.; Navarro, E.; Rubio, G. Modeling bladder cancer using a Markov process with multiple absorbing states. Math. Comput. Model. 2010, 52, 977–982. [Google Scholar] [CrossRef]
- Munthali, M.; Mustak, S.; Adeola, A.; Botai, J.; Singh, S.; Davis, N. Modelling land use and land cover dynamics of Dedza district of Malawi using hybrid Cellular Automata and Markov model. Remote Sens. Appl. Soc. Environ. 2020, 17, 100276. [Google Scholar] [CrossRef]
- Beall, J.; Guha-Khasnobis, B.; Kanbur, R. Introduction: African Development in an Urban World: Beyond the Tipping Point. Urban Forum 2010, 21, 187–204. [Google Scholar] [CrossRef]
- United Nations. World Urbanization Prospects 2018: Highlights (ST/ESA/SER.A/421). United Nations Department of Economic and Social Affairs Population Division (UN DESA-PD). 2019. Available online: https://population.un.org/wup/Publications/Files/WUP2018-Highlights.pdf (accessed on 15 April 2019).
- Turok, I.; McGranahan, G. Urbanization and economic growth: The arguments and evidence for Africa and Asia. Environ. Urban. 2013, 25, 465–482. [Google Scholar] [CrossRef]
- Angel, S.; Parent, J.; Civco, D.L. The fragmentation of urban landscapes: Global evidence of a key attribute of the spatial structure of cities, 1990–2000. Environ. Urban. 2012, 24, 249–283. [Google Scholar] [CrossRef]
- Jāhāna, S. Human Development Report 2016: Human Development for Everyone; United Nations Development Programme: New York, NY, USA, 2016; Available online: http://hdr.undp.org/en/2016-report (accessed on 15 February 2020).
- Wang, S.; Zheng, X.; Zang, X. Accuracy assessments of land use change simulation based on Markov-cellular automata model. Procedia Environ. Sci. 2012, 13, 1238–1245. [Google Scholar] [CrossRef]
- Chander, G.; Markham, B.L.; Helder, D.L. Summary of current radiometric calibration coefficients for Landsat MSS, TM, ETM+, and EO-1 ALI sensors. Remote Sens. Environ. 2009, 113, 893–903. [Google Scholar] [CrossRef]
- Zhu, Z. Change detection using landsat time series: A review of frequencies, preprocessing, algorithms, and applications. ISPRS J. Photogramm. Remote Sens. 2017, 130, 370–384. [Google Scholar] [CrossRef]
- Ibrahim, A.M.; Mohammed, M.A. Road network: The silent treasures of Kano metropolis. Bayero J. Pure Appl. Sci. 2016, 9, 87. [Google Scholar] [CrossRef]
- Kibon, U.A.; Ahmed, M. Distribution of Primary Health Care Facilities in Kano Metropolis Using GIS (Geographic Information System). Res. J. Environ. Earth Sci. 2013, 5, 167–176. [Google Scholar] [CrossRef]
- Fonseca, L.M.G.; Costa, M.H.M. Automatic registration of satellite images. In Proceedings of the X Brazilian Symposium on Computer Graphics and Image Processing, Campos do Jordao, Brazil, 14–17 October 1997; pp. 219–226. [Google Scholar]
- Lamine, S.; Petropoulos, G.P.; Singh, S.K.; Szabó, S.; Bachari, N.E.; Srivastava, P.K.; Suman, S. Quantifying land use/land cover spatio-temporal landscape pattern dynamics from Hyperion using SVMs classifier and FRAGSTATS®. Geocarto Int. 2018, 33, 862–878. [Google Scholar] [CrossRef]
- Halmy, M.W.A.; Gessler, P.E.; Hicke, J.A.; Salem, B.B. Land use/land cover change detection and prediction in the north-western coastal desert of Egypt using Markov-CA. Appl. Geogr. 2015, 63, 101–112. [Google Scholar] [CrossRef]
- Srivastava, P.K.; Han, D.; Rico-Ramirez, M.A.; Bray, M.; Islam, T. Selection of classification techniques for land use/land cover change investigation. Adv. Space Res. 2012, 50, 1250–1265. [Google Scholar] [CrossRef]
- Hadi, S.J.; Shafri, H.Z.M.; Mahir, M.D. Modelling LULC for the period 2010–2030 using GIS and Remote sensing: A case study of Tikrit, Iraq. In Proceedings of the IOP Conference Series: Earth and Environmental Science, 7th IGRSM International Remote Sensing & GIS Conference and Exhibition, Kuala Lumpur, Malaysia, 22–23 April 2014; Volume 20, p. 012053. [Google Scholar]
- Lambin, E.; Rounsevell, M.; Geist, H. Are agricultural land-use models able to predict changes in land-use intensity? Agric. Ecosyst. Environ. 2000, 82, 321–331. [Google Scholar] [CrossRef]
- Omar, N.Q.; Sanusi, S.; Hussin, W.M.W.; Samat, N.; Mohammed, K. Markov-CA model using analytical hierarchy process and multiregression technique. In Proceedings of the IOP Conference Series: Earth and Environmental Science, 7th IGRSM International Remote Sensing & GIS Conference and Exhibition, Kuala Lumpur, Malaysia, 22–23 April 2014; Volume 20, p. 012008. [Google Scholar]
- Raj, P. Evaluation of Different Techniques to Detect Land Use/Land Cover Change Over an Area. Ph.D. Thesis, Department of Civil Engineering, NIT Rourkela, Odisha, India, 2017. [Google Scholar]
- Talukdar, S.; Singha, P.; Mahato, S.; Pal, S.; Liou, Y.A.; Rahman, A. Land-Use Land-Cover Classification by Machine Learning Classifiers for Satellite Observations—A Review. Remote Sens. 2020, 12, 1135. [Google Scholar] [CrossRef]
- Mahmud, A.; Achide, A.S. Analysis of land use/land cover changes to monitor urban sprawl in Keffi-Nigeria. Environ. Res. J. 2012, 6, 130–135. [Google Scholar]
- Jensen, J.R.; Lulla, K. Introductory digital image processing: A remote sensing perspective. Geocarto Int. 1987, 2, 65. [Google Scholar] [CrossRef]
- Behera, M.D.; Borate, S.N.; Panda, S.N.; Behera, P.R.; Roy, P.S. Modelling and analyzing the watershed dynamics using Cellular Automata (CA)—Markov model—A geo-information-based approach. J. Earth Syst. Sci. 2012, 121, 1011–1024. [Google Scholar] [CrossRef]
- Li, S.T.; Cheng, Y.C. A Hidden Markov Model-Based Forecasting Model for Fuzzy Time Series; WSEAS: Stevens Point, WI, USA, 2006; Volume 5, pp. 1919–1924. [Google Scholar] [CrossRef]
- Zhang, R.; Tang, C.; Ma, S.; Yuan, H.; Gao, L.; Fan, W. Using Markov chains to analyze changes in wetland trends in arid Yinchuan Plain, China. Math. Comput. Model. 2011, 54, 924–930. [Google Scholar] [CrossRef]
- Adepoju, K.A.; Adelabu, S.; Fashae, O. Vegetation Response to Recent Trends in Climate and Landuse Dynamics in a Typical Humid and Dry Tropical Region under Global Change. Adv. Meteorol. 2019, 2019, 1–15. [Google Scholar] [CrossRef]
- Ibrahim, Y.Z.; Balzter, H.; Kaduk, J. Land degradation continues despite greening in the Nigeria-Niger border region. Glob. Ecol. Conserv. 2018, 16, e00505. [Google Scholar] [CrossRef]
- Nwaogu, C.; Okeke, O.J.; Fadipe, O.O.; Bashiru, K.A.; Pechanec, V. Is Nigeria losing its natural vegetation and landscape? Assessing the landuse-landcover change trajectories and effects in Onitsha using remote sensing and GIS. Open Geosci. 2017, 9, 707–718. [Google Scholar] [CrossRef]
- Liping, C.; YuJun, S.; Saeed, S. Monitoring and predicting land use and land cover changes using remote sensing and GIS techniques—A case study of a hilly area, Jiangle, China. PLoS ONE 2018, 13, e0200493. [Google Scholar] [CrossRef] [PubMed]
- Madugu, Y.U. Filling the mobility gaps: The shared taxi industry in Kano, Nigeria. J. Transp. Hist. 2018, 39, 41–54. [Google Scholar] [CrossRef]
- Onatere, J.O.; Nwagboso, C.; Georgakis, P. Performance indicators for urban transport development in Nigeria. WIT Trans. Built Environ. 2014, 138, 14. [Google Scholar] [CrossRef]
- Ojo, A.; Papachristodoulou, N.; Ibeh, S. The Development of an Infrastructure Quality Index for Nigerian Metropolitan Areas Using Multivariate Geo-Statistical Data Fusion. Urban Sci. 2018, 2, 59. [Google Scholar] [CrossRef]
- El-Hallaq, M.A.; Habboub, M.O. Using GIS for Time Series Analysis of the Dead Sea from Remotely Sensing Data. Open J. Civ. Eng. 2014, 4, 386–396. [Google Scholar] [CrossRef]
- Mishra, V.N.; Rai, P.K. A remote sensing aided multi-layer perceptron-Markov chain analysis for land use and land cover change prediction in Patna district (Bihar), India. Arab. J. Geosci. 2016, 9, 1–18. [Google Scholar] [CrossRef]
- Onolememen, M.O. The Impact of Leadership on the Governance of Infrastructure Development in Nigeria. Ph.D. Thesis, Walden University, Washington, WA, USA, 2015. [Google Scholar]
Publisher’s Note: MDPI stays neutral with regard to jurisdictional claims in published maps and institutional affiliations. |
© 2020 by the authors. Licensee MDPI, Basel, Switzerland. This article is an open access article distributed under the terms and conditions of the Creative Commons Attribution (CC BY) license (http://creativecommons.org/licenses/by/4.0/).

