Article

Neural Network Approach to Modelling Transport System Resilience for Major Cities: Case Studies of Lagos and Kano (Nigeria)

by
Suleiman Hassan Otuoze
1,2,*,
Dexter V. L. Hunt
1 and
Ian Jefferson
1
1
Department of Civil Engineering, University of Birmingham, Edgbaston B15 2TT, UK
2
Department of Civil Engineering, Ahmadu Bello University, Zaria 810107, Nigeria
*
Author to whom correspondence should be addressed.
Sustainability 2021, 13(3), 1371; https://doi.org/10.3390/su13031371
Submission received: 1 January 2021 / Revised: 17 January 2021 / Accepted: 23 January 2021 / Published: 28 January 2021

Abstract

:
Congestion has become part of everyday urban life, and resilience is very crucial to traffic vulnerability and sustainable urban mobility. This research employed a neural network as an adaptive artificially-intelligent application to study the complex domains of traffic vulnerability and the resilience of the transport system in Nigerian cities (Kano and Lagos). The input criteria to train and check the models for the neural resilience network are the demographic variables, the geospatial data, traffic parameters, and infrastructure inventories. The training targets were set as congestion elements (traffic volume, saturation degree and congestion indices), which are in line with the relevant design standards obtained from the literature. A multi-layer feed-forward and back-propagation model involving input–output and curve fitting (nftool) in the MATLAB R2019b software wizard was used. Three algorithms—including Levenberg–Marquardt (LM), Bayesian Regularization (BR), and a Scaled Conjugate Gradient (SCG)—were selected for the simulation. LM converged easily with the Mean Squared Error (MSE) (2.675 × 10⁻³) and regression coefficient (R) (1.0) for the city of Lagos. Furthermore, the LM algorithm provided a better fit for the model training and for the overall validation of the Kano network analysis with MSE (4.424 × 10⁻¹) and R (1.0). The model offers a modern method for the simulation of urban traffic and discrete congestion prediction.

1. Introduction

The network of the transport system facilitates people’s mobility, enhances their social interaction, and improves their quality of life. Globally, man-made and natural disasters pose increasing vulnerability challenges to transport infrastructure networks in many cities. The capacity of transport networks to recover from challenges and cope with competing users’ demands is important. In addition to threat and vulnerability, the resilience concept has an incorporated cost, planning, management and adaptive strategy to cope with pressure and uncertainties [1]. In the early 1970s, ecological research showed that resilience is essential to our lifespan, or else survival, as academics realized the essential nature of their capacity to adapt, to survive, and to evolve in the face of adversity [2]. Due to urban vulnerabilities and the congestion impediment—an increasing concern in the development of transport resilience—various debates and discussions among scholars, analysts, industry, experts and public officials were ignited [3,4].
The world population surpassed the 7.5 billion mark in 2017, with projections to reach its numerical milestone of 9.7 billion in the year 2050 [5]. The rising urban population seriously confounds the ease of mobility of urban dwellers, and more importantly the socioeconomic accomplishment of the city. Congestion has become part of everyday life of the more urban population in cities and towns. The causes, regulations and modulation of road traffic congestion have been analyzed by various models, algorithms, statistical methods and prediction models. The inputs into the congestion forecast models may include the traffic volume, speed, occupancy, quality of infrastructure, and demographic parameters [6,7].
Naturally, every system has its problems, as the notion of perfection—not least in the field of transport planning—is hardly achievable. Like every system, the pressures on critical infrastructure come in the form of turbulence, disruption, or damage, but the overall concept that really defines resilience is the capacity to recover, rebound, or withstand the problem and maintain the functionality without further truncation [8]. Where adversity arises, structures or properties must not be fragile, decimated, or impaired, but should be resilient, tolerable, safe and mitigable, with a capacity to return to normality and functionality [9]. In keeping pace with sustainable culture due to the demand of a growing urban population, migration, security risk, natural occurrences, weather problems and environmental pollution, the resilience concept has been reshaped and adopted into the engineering, technology, planning, design, construction, operation and management of urban infrastructures [10].
In the last decades, urban commuting and freighting has become a serious challenge for infrastructure, in part because of rapid urban growth and socioeconomic developments in many fast-growing cities of both developed and developing countries. These phenomenal growths in the populations of cities have been attributed to population growth, combined with migration or population drift, socioeconomic reasons, and the biased disposition of policies in favour of cities [11]. The spatial–temporal transformations and growth of cities is highly complex, with transport infrastructure at the heart of physical planning and socioeconomic development [12]. Urbanization and population growth are two phenomena that are linked to the emergence of many mega-cities (urban demographics of more than 10 million people), with the deepening complexity of urban interaction, and inadequate transport infrastructure and services leading to a declining transport quality index in the developing countries [13].
With the rising multi-scale challenges to transport infrastructures and mobility in most cities, resilience thinking remains a key underpinning component of the achievement of functional environments that are both fit-for-purpose and fit-for-future. Transport resilience highlights the pathways for cities’ survival against growing scenarios of congestion, delays, and socioeconomic losses due to natural and artificially induced challenges (e.g., climate change, environmental pollution, earth tremors, deforestation, erosion, and degradation from mining activities). A number of resilience analytical tools—e.g., artificial intelligence and agent-based modelling techniques, including artificial neural networks (ANN) [14], fuzzy systems (FS) [15], adaptive network-based inference systems (ANFIS) [16] and genetic algorithms [17]—have been deployed for the analysis and prediction of complex system resilience. On the basis of the demographic information, inventory of transport infrastructure and mobility data available, resilient models may be fitted with artificial neural networks (ANN) in order to forecast the resilience of transport services in the Nigerian cities (Kano and Lagos as a case study). Figure 1 and Figure 2 are the digitized maps of the main statistical areas constituting the urban conurbations of Kano and Lagos, respectively.

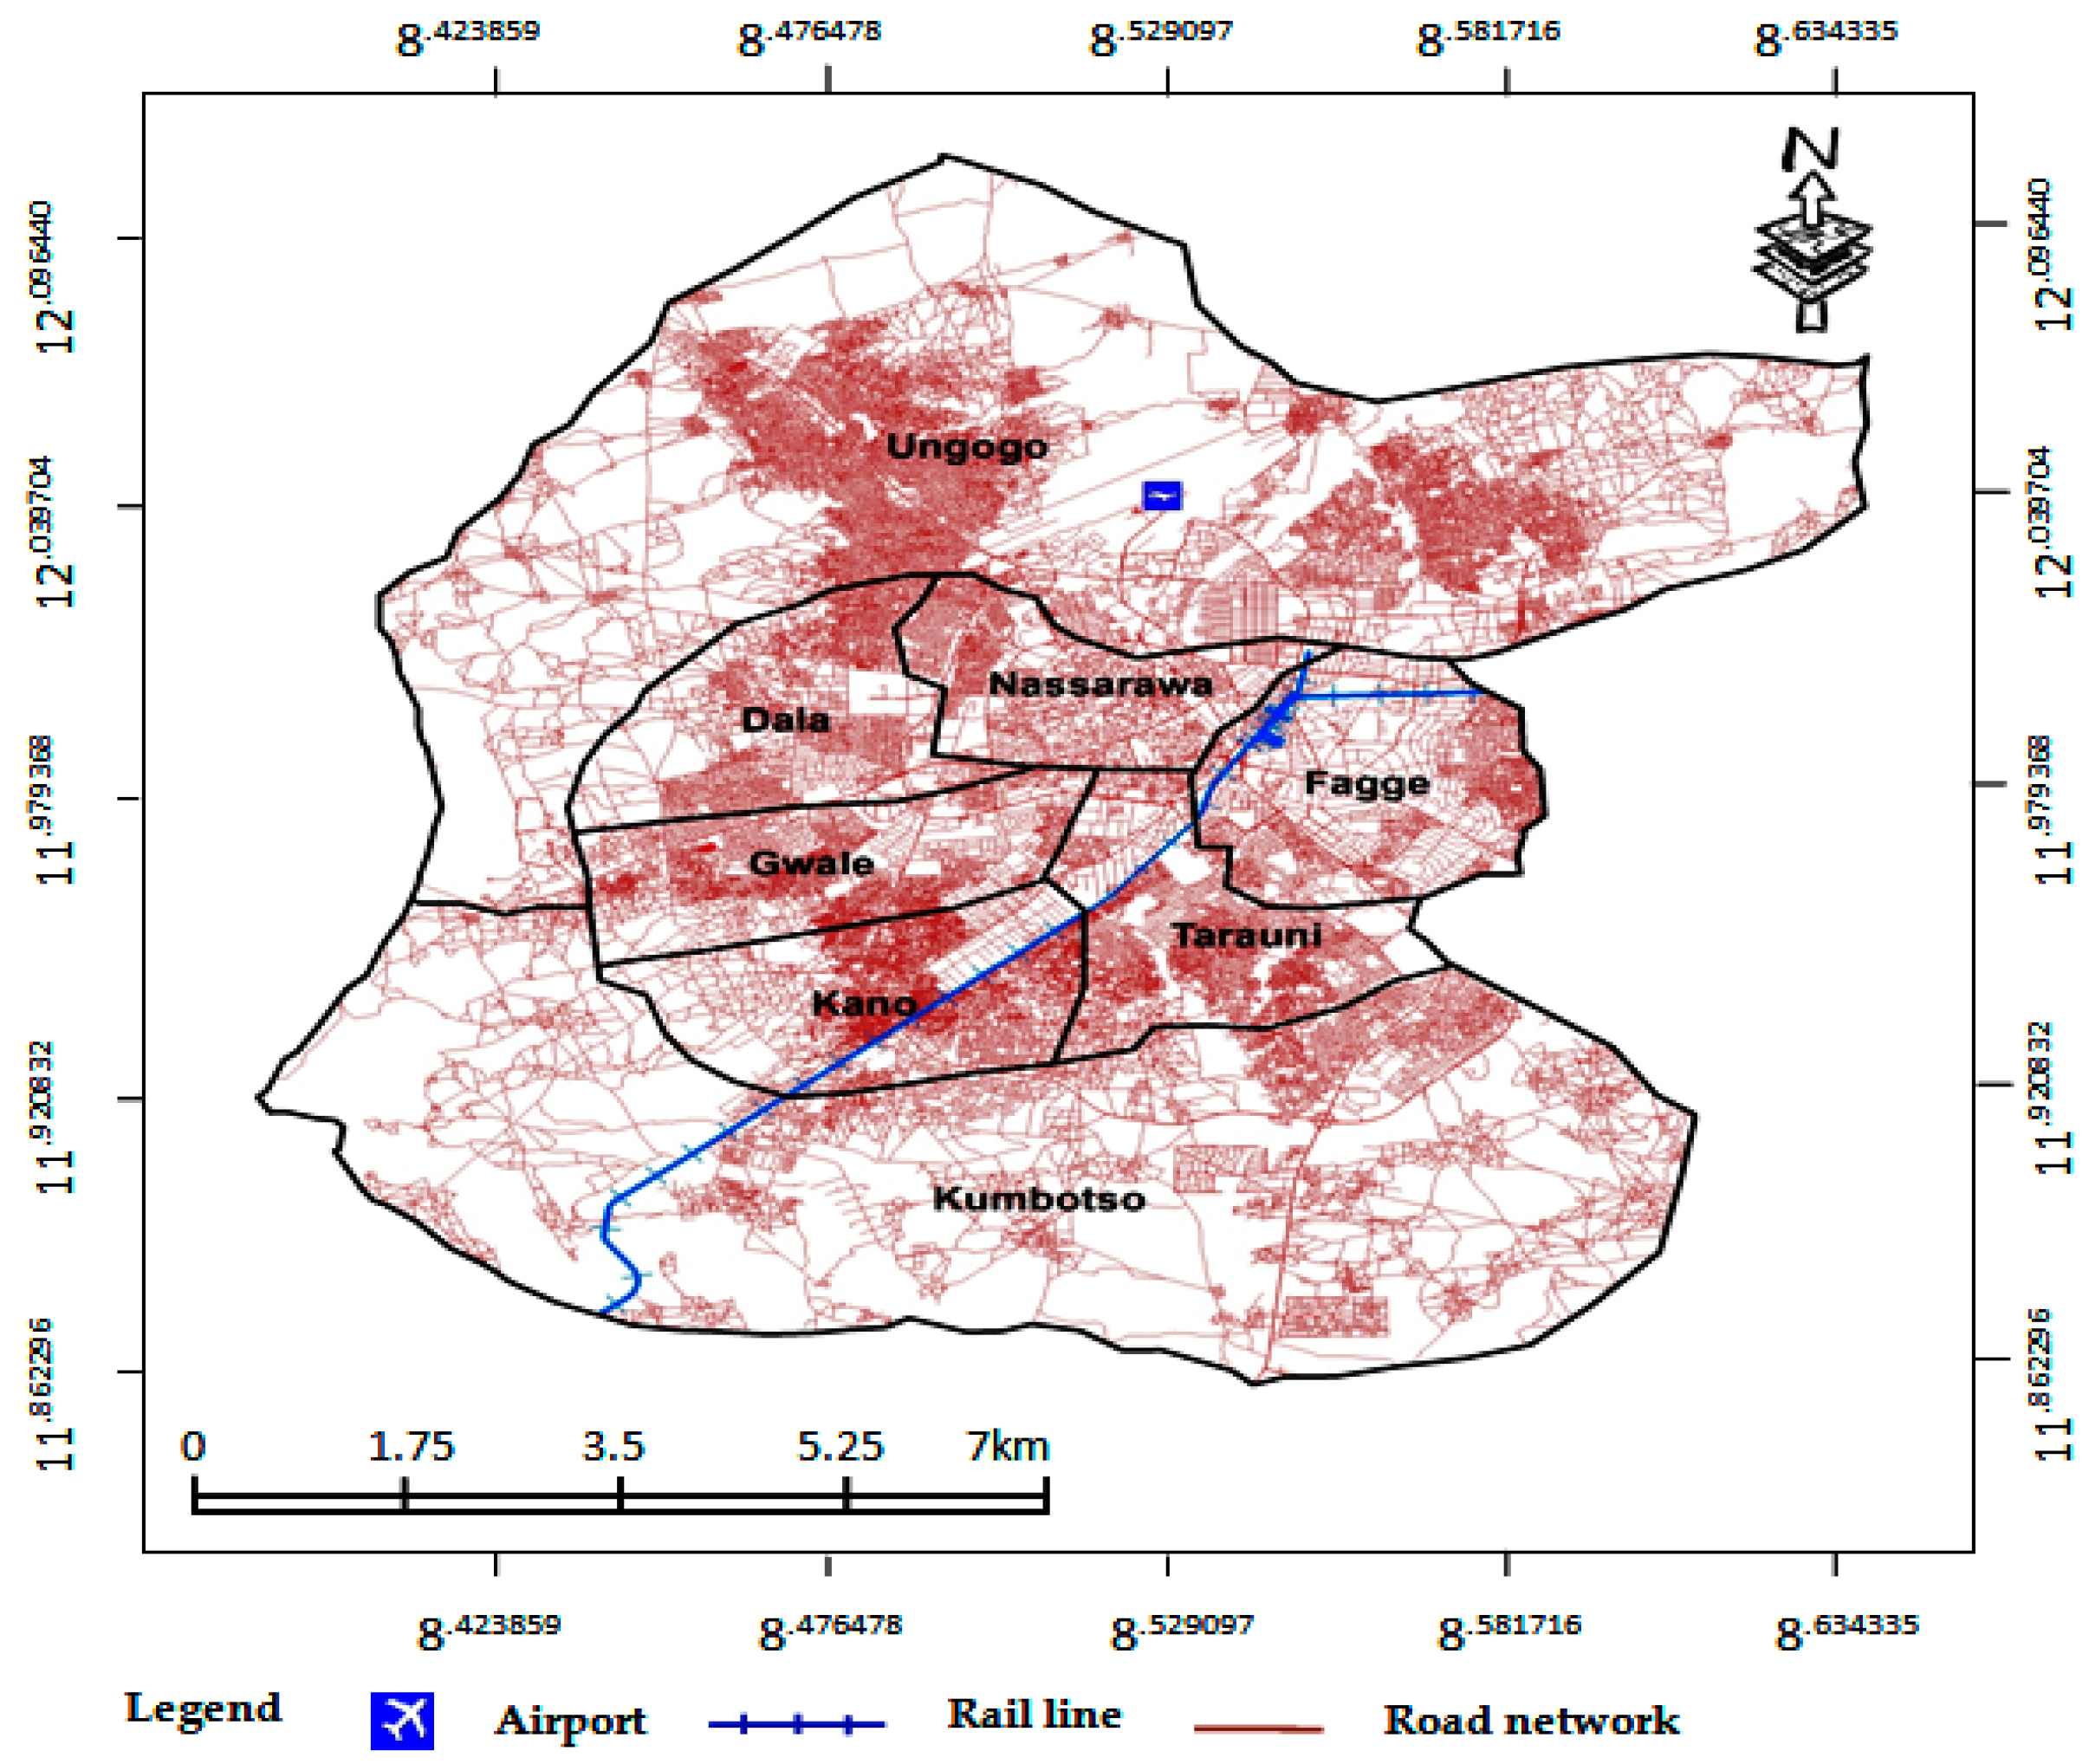
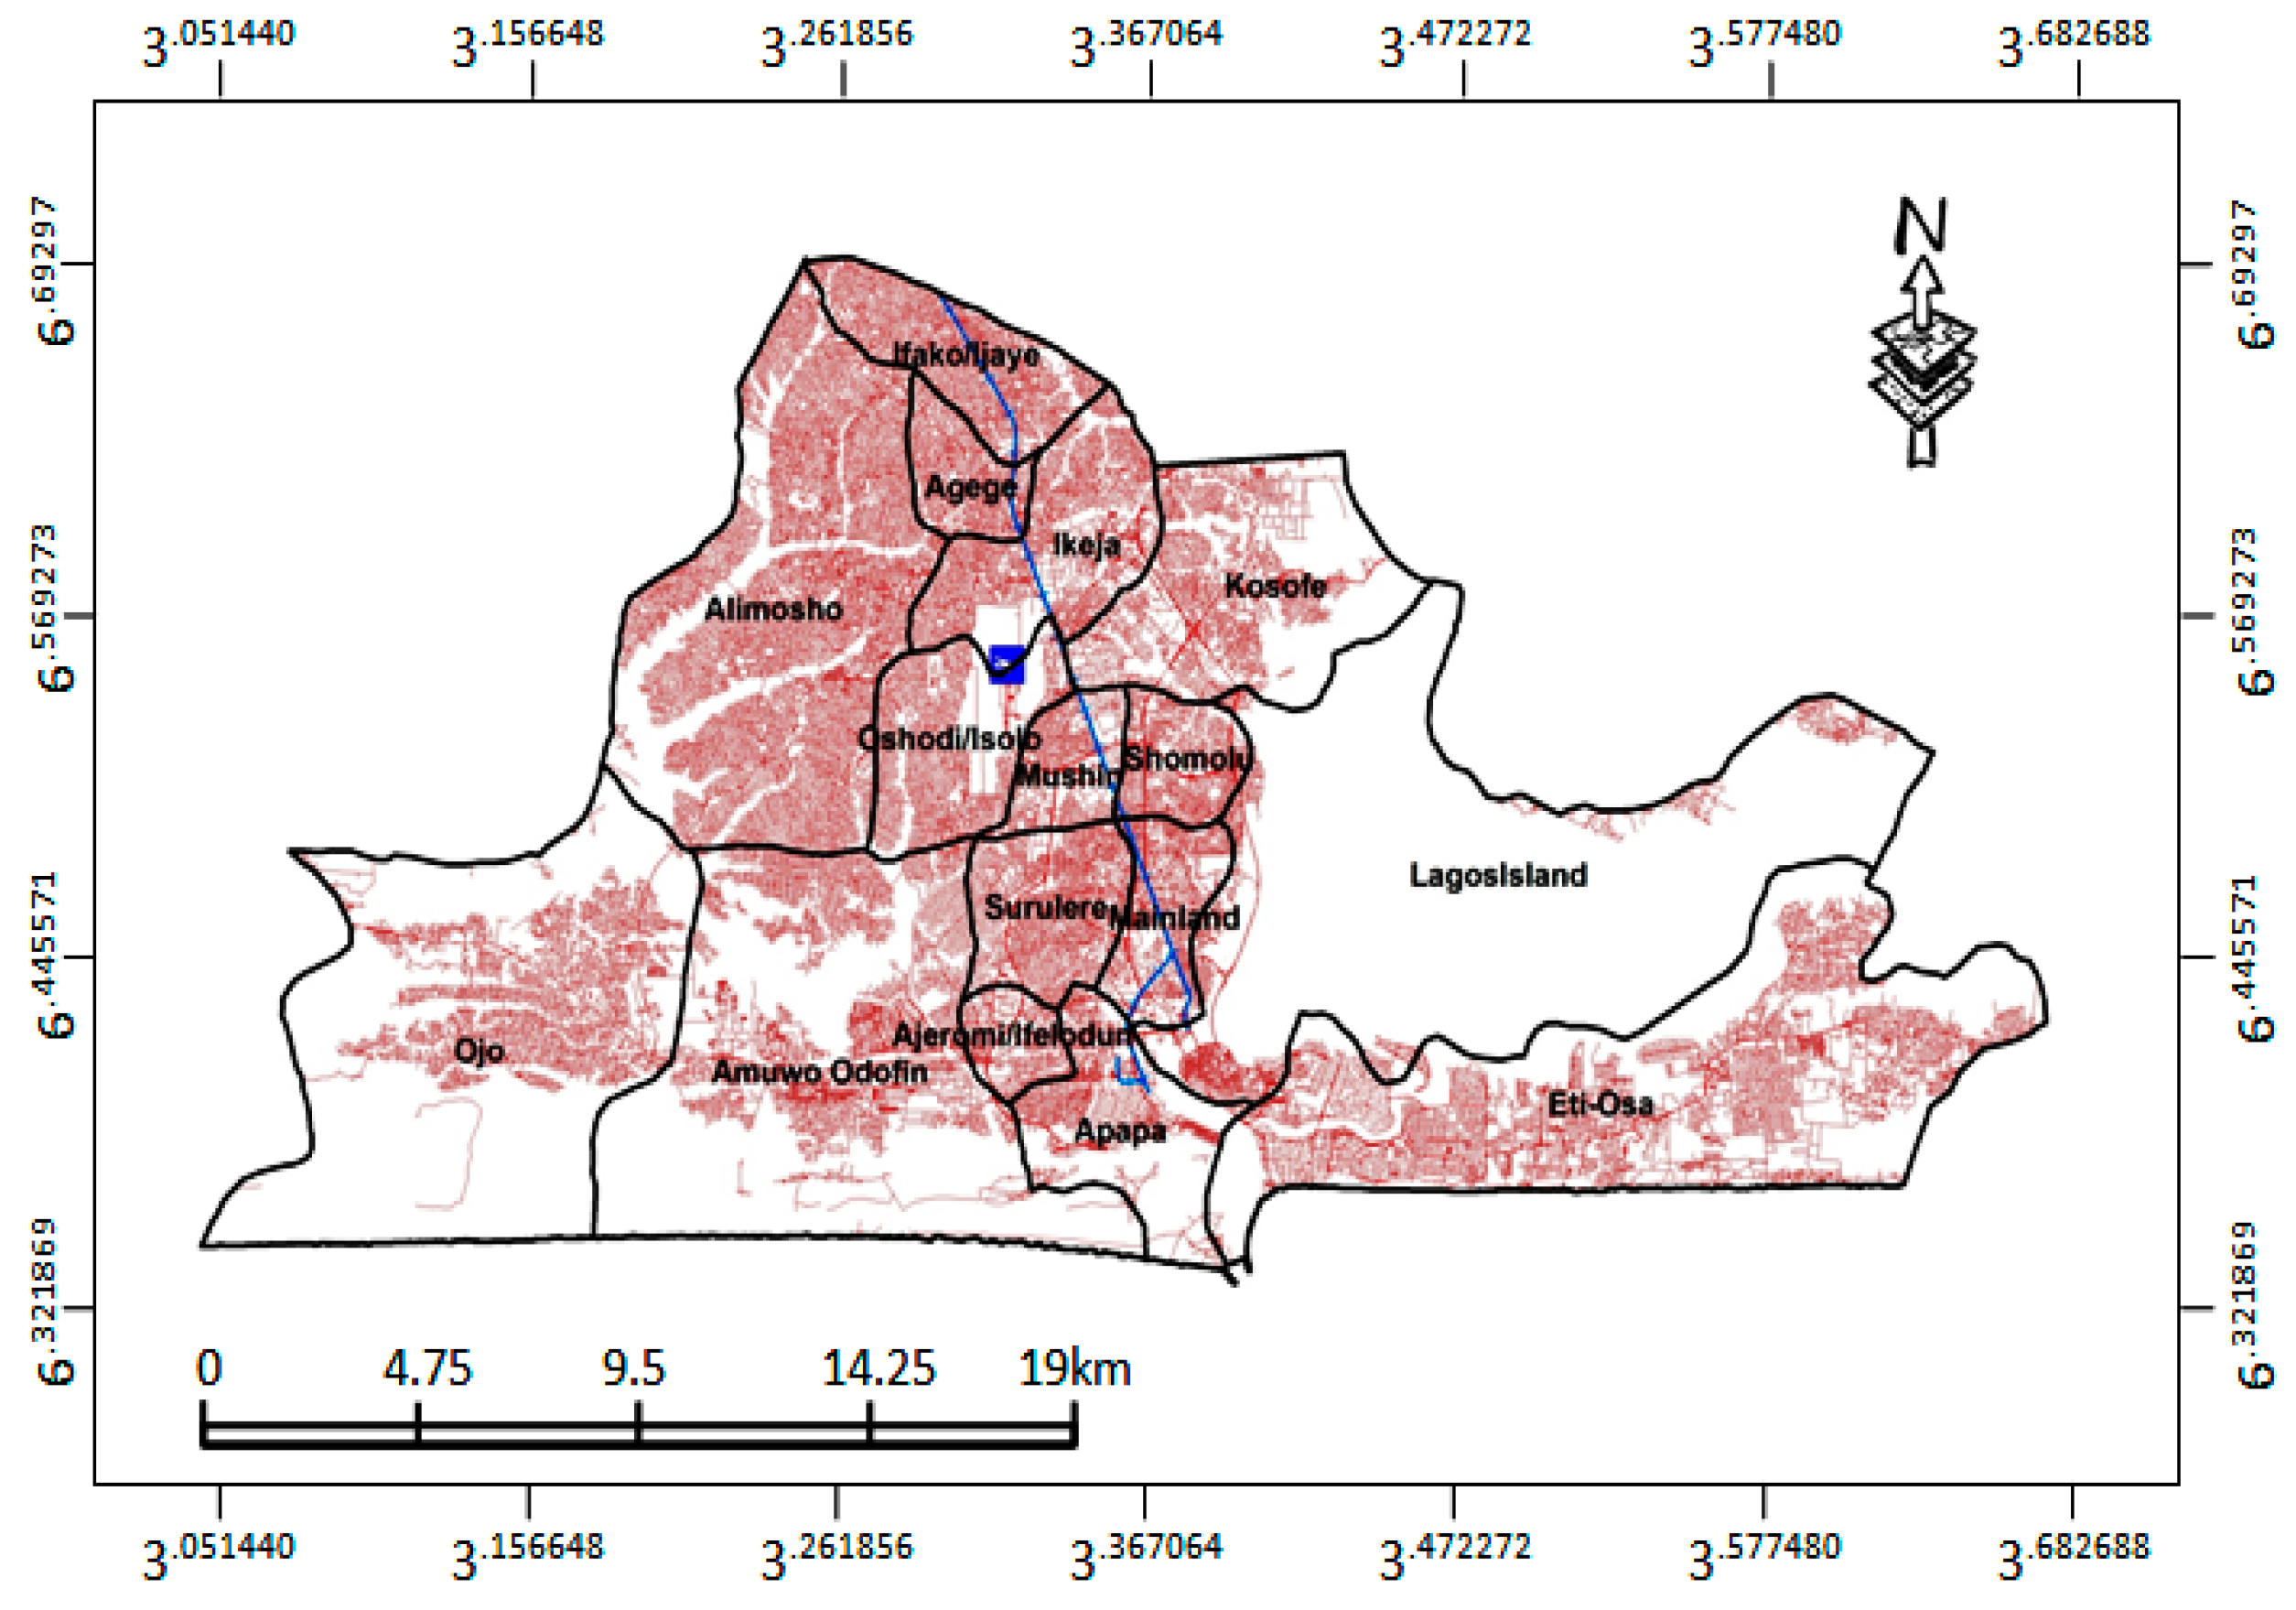
Traffic Congestion and Resilience Mapping of Nigerian Cities

The hallmark of sustainable, livable cities lies in the effectiveness, efficiency and resilience of their transport infrastructure and services. Whilst most cities in developed countries are in the terminal phase of urban transition, African and Asian cities will be the culmination of future urban growth potential from 2030 to 2050, when most of the world’s leading mega-cities (cities with a population of over 10 million people) will arise. The rapid pace of urban growth in Africa has sprouted several ‘accidental’ mega-cities, leaving gaps in the development of critical infrastructure. The Nigerian city of Lagos became the 14th largest mega-city in the world, with an urban population of more than 15 million in 2013. Kano Metropolis is the regional commercial capital of Northern Nigeria, and is second to Lagos, with a population of 4 million [12]. The rising trajectories of urbanization/population potentials have compounded the infrastructure problem, with about 67.1% of the predicted 450 million population in 2050 becoming urbanized [18].
According to the World Economic Forum 2016–2017 report, Nigeria’s poorly-rated physical infrastructure ranks 132nd amongst a cohort of 138 countries surveyed; this huge deficit accounts for the greatest drag to economic, human and social developments [19]. While the infrastructure deficits have increased congestion, and impeded connectivity and socioeconomic growth, the mobility problem of the two cities has also been exacerbated by heavy motorization and the drag on the development of the railway transport system. Traffic congestion is one of the major stressors of the urban ecological environment, albeit that weather factors, security, and safety have expanded the scale and dimension of what constitutes urban transport resilience. Congestion is defined as a situation in which “the demand exceeds the capacity of the road” [20]. Not only has congestion increased emissions, fuel consumption and travel costs, it also has a direct impact on speed, travel time delays and service quality.
Congestion imposes pressure on and vulnerability of infrastructure due to the asymmetry between the rising demand for services and the infrastructures that are available to cater for commuters’ needs. The nature of the transport system in Nigeria is largely road-biased, making an assessment of its scale, attributes, topology and resilience a much more complex phenomenon. Lagos and Kano are Northern and Southern Nigeria’s respective regional geopolitical, commercial and industrial strategic hubs. Urban transport in many developing countries is becoming increasingly complex due to the fewer modal options available for the multitude of rounds of origin and destination trips produced and the volume of traffic involved [21].
Lagos is estimated to generate 7–10 million daily passenger and freight trips, with the share of these road transport modes (private cars, taxis, buses, trucks, motorized and non-motorized bikes) accounting for approximately 95% of all trips [22]. Farah [23] reported the generally poor state of transport infrastructure in Kano metropolis, which was struggling to cope with the exponentially-growing passengers and freight trips brought on by urban agglomeration spikes. Out of more than 7,600,000 vehicles registered in 2008, about 10% were different categories of haulage trucks exerting irrecoverable maximum fatigue damages on the 193,200 km total road length in the country. An average of 5000 daily single trips was recorded in wet tanker trailer haulage services moving petroleum products [24].
The perennial congestion in many port cities has also been linked to the extended dwelling times of ships due to port disruptions, berth scheduling issues, higher numbers of mega ships, and insufficient infrastructure to increase the demand for cargo handling [25,26]. These reasons perhaps explain why road clusters around Apapa, where the Port Authority of Nigeria is located, experience worse traffic congestion than the rest of the development areas in the city of Lagos. In both emerging and industrialized economies, Albayrak et al. [27] describe the closely-related determinants of air traffic volume, i.e., population, proximity to other transport networks, economy, tourism, distance to alternative airports, tourism, leading cities, urbanization, and migration.
A transition to a resilient and sustainable ‘shared mobility’ framework has been proposed by researchers in order to mitigate urban congestion problems [28]. The context of traffic congestion and urban mobility resilience are complex in a sector such as passenger and freight transport, in which significant socioeconomic, environmental, behavioral and technological inputs are considered in a sound predictive methodology. Therefore, the problem is now more related to which primary performance metrics need to be used and how the data can be collected, aggregated, formulated and analyzed in order to predict vulnerability and extreme congestion scenarios in the emerging developing countries’ mega-cities.
Vulnerability is a common feature of poor and inadequate infrastructures, and defective policies in terms of planning, regulation and management. Vulnerability, according to Knoop et al. [29], is negatively related to resilience, and is defined as the “reduction of system performance as a consequence of dynamic factors, including flow length, free flow and congestion density which pressure the system”. Equation (1) shows that transient loss of resilience (TLR) determines the level of vulnerability, and is related to functionality within the system; that is:
T R L = t 0 t 1 [ 100 Q ( t ) d t
where Q ( t ) is the quality of functionality under the pressure time step t 0 to t 1 .
The index of resilience in Equation (2) is a normalized metric ranging from 0 and 1, and is determined from the recovery curve of functionality [30].
R = t 0 t h Q ( t ) d t t h t 0
According to Aftabuzzaman [31], it is possible to relate resilience to the congestion index of a travel corridor or an area based on the assessment criteria of speed, flow, and other related data. The assessment metric of the congestion threshold and index development are related to population, travel infrastructure, traffic, and motorization indices. The scope of resilience is currently not domiciled in the traditional field of ecology, but rather has spurned burgeoning research interests in engineering and technological innovation, environmental studies, economic solutions, business, and institutional cooperation. The definition of vulnerability in the transport system may be related to reduced accessibility and connectivity, likely due to natural causes and the exogenous impacts of human activities that are harmful to the urban environment [30].
In this context, a resilient evaluation is an integrated way of evaluating the causal effects of various factors and occurrences affecting functionality and the transport system’s spatial diversities. The measure(s) of resilience in a system are numerous, but the three overarching concepts enumerated by Holling [32] include vulnerability, resource available, and the degree of internal controllability, in addition to interdependency (i.e., between the various components of the transport system). Travel time is a very significant factor affecting commuters’ choice of travel, which could be used as an appropriate indicator of a transport system’s reliability and quality.
The relevant aspects that impact transport resilience are: the network capacity [3]; economy, pricing and financing [33]; and logistics and freight [34]. Due to the widening scale and necessity of system survival, transport resilience research has also been extended to transport communication and information [35], community resilience [36], transport demand management [37], and natural disasters and exogenous impacts [38]. The problem of the undifferentiated lumping of critical infrastructure development in Nigeria has perhaps created many gaps in terms of the quantity and quality of infrastructure allocation to the transport sector, and remains the biggest challenge to the ease of mobility and interaction in many cities. This study provides a framework for the assessment of the transport resilience of the two major cities through indices of congestion and accessibility, and the critical position of physical transport infrastructure stock, using an Artificial Neural Network (ANN).

2. Materials and Methods

In order to alleviate complex infrastructure problems, innovative solutions are required to address the range of challenges. This requires a global approach using implicit surrogate estimators of resilience models and repeated evaluations over time. ANN can be applied for prediction even where the detailed characteristics of the system are not available. It is a machine learning algorithm that is capable of solving complex problems using random function approximation combined with the application of nonlinear statistical models that display the input–outputs of complex relationships in order to develop a model solution [39]. By means of model calibration, validation, and forecasting, ANN may learn from example data set(s) and provide answers to many problems, including machine translation, pattern recognition, fault detection, prediction, and decision processes (Silva et al., 2017). Structurally, ANN models consist of three components: inputs, hidden layer(s), and outputs (Figure 3). The input layers are the information receiver of the example data set. The numerical computation and pattern recognition are carried out by the hidden layer(s), and the output layers display the results.
The parameters that affect the output are the learning rate, batch size, weights, biases, optimizer, epoch, width, and depth. Every node within the network allocates some weights, and the weighted sum of the inputs and the bias is determined using a transfer function. Then, the activation function which obtains the output result releases the most acceptable result from the node based on the received data [40]. Some of the commonly-used activation functions in ANN include Sigmoid, RELU, Softmax, and Tanh, etc. Figure 4 shows the architecture that accompanies the typical ANN model previously shown in Figure 3.
Feed-forward and feed-backward loops can be adopted by ANNs. Feed-forward typically uses a unidirectional loop for supervised learning, in which data, such as facial recognition, are sequential. Feed-backward, or back-propagation, has a feedback loop suited for memory retention in sequential or time-dependent data sets [41]. Depending on the network type, it is possible to measure the differences between the expected output and the resulting output with error functions, and then to modify the weights of the NN through the back-propagation process.
Unfortunately, benchmarked cases of transport resilience for the management of the complex systems are not available in many developing countries. As such, this research aims to assess the efficacy of an Artificial Neural Network (ANN) surrogate model to determine the resilience of transport system networks in the cities of Nigeria. Based on literature knowledge, the preliminary testing was undertaken with some arbitrarily-defined network architecture with a ‘trial and error’ approach in order to select the optimal parameters for the most reliable predictions (see, for example Abduljabbar et al. [42]; Mattsson and Jenelius [43]). Table 1 and Table 2 were extracted for further study from the traffic and demographic data and the inventories of transport infrastructure.
The methodological scheme for the ANN model prediction is shown in Figure 5. Importantly, the optimization of the performance of neural networks requires the exploration of many variants of the traditional back-propagation training algorithm on the basis of some heuristic and numerical optimization methods. The algorithms for multi-layer feedback propagation with input and curve fitting (“nftool”), are defined as follows:
(a)
Levenberg–Marquardt (LM) algorithm (trainlm): this is the speediest training algorithm for a moderately-sized network; when the training set is large, it has memory reduction function to use.
(b)
Bayesian regularization (BR) algorithm (trainbr): this is a mathematical method which transforms a nonlinear regression in the manner of a peak regression into a ‘well-posed’ statistical problem.
(c)
Scaled conjugate gradient (SCG) algorithm (trainscg): this is the only algorithm with a conjugate gradient that needs no line search, which is excellent for general-purpose algorithm training.
In order to determine the vehicular traffic spatial variance and congestion pattern, representative development area congestion level measurements using the traffic saturation degree on some selected main road corridors could be deployed in order to measure congestion patterns in Kano and Lagos. Based on the evaluation, the average degree of saturation and level of service of urban roads can be obtained. The saturation degree compares the actual field traffic volume in a particular period to the designed traffic capacity in a typically-designed roadway. For a two- or three-lane highway in Nigeria, a standardized capacity volume of 2000 cars per hour, a typical-design hourly factor of 10%, and a directional split factor of 60% are recommended by the Highway Capacity Manual (HCM [47]), and are usually adopted for design purposes. Based on the respective acceptable traffic parameters—an urban speed limit of 40 km per hour and a minimum speed of 10 km per hour—typically used for Nigerian road design ([48]), the value of the congestion index measurement (x) on a scale ranging from 2 to 10 could be estimated using Equation (3) (as proposed by Wang et al.) [49].
C i n d e x = { x 0.4 2 ;   x 0.4 { ( x 0.4 0.2 ) 2 } + 2 ;   0.4 x 0.6 { ( x 0.6 0.15 ) 2 } + 4 ;   0.6 x 0.75 { ( x 0.75 0.15 ) 2 } + 6 ;   0.75 x 0.9 { ( x 0.9 0.2 ) 2 } + 8 ;   0.9 x 1.0 10 ;   x > 1.0

3. Results

3.1. Congestion Pattern

Lagos and Kano have 16 and 8 development area councils, respectively, representing the number of MSA clusters of the two cities. Equation (3) was applied to each cluster in order to provide some scalar representations for congestion rating with the traffic volume and the degree of traffic saturation. Table 3 and Table 4 contain the relevant prediction input data, including the transport infrastructure, demographics, and traffic congestion indices. The results of the congestion indices for Lagos and Kano cities, using Equation (3) (Wang et al. [49]) showed that the two cities currently face extreme traffic regimes. This is, perhaps, due to the combined factors of mono-modal transport development tilted in favor of the road mode, the poor quality of the transport infrastructure, and disjointed transport policies.
According to the congestion index ( C i n d e x ), most Lagos road networks are experiencing traffic bottlenecks, which is otherwise called a ‘jam’ situation. The same dire situation is endured in all but two local development areas in Kano, which includes chronic traffic dilemmas and accessibility disruptions across the city. Currently, the reprehensible traffic congestion situations in Lagos and Kano have cascaded beyond the maximum design thresholds. The results of the traffic and congestion indices for Kano and Lagos exceeded the 2000 vehicles per hour adopted for the design capacity [47], and the values for tolerable or ‘moderate’ congestion profiles ( C i n d e x = 6 9 ) recommended by Wang et al. [49]. The most common ‘extreme’ congestion situations ( C i n d e x = 10 ) in the Metropolitan Statistical Areas (MSA) have over-stretched supporting infrastructures and are constant sources of mobility dilemmas across the cities.

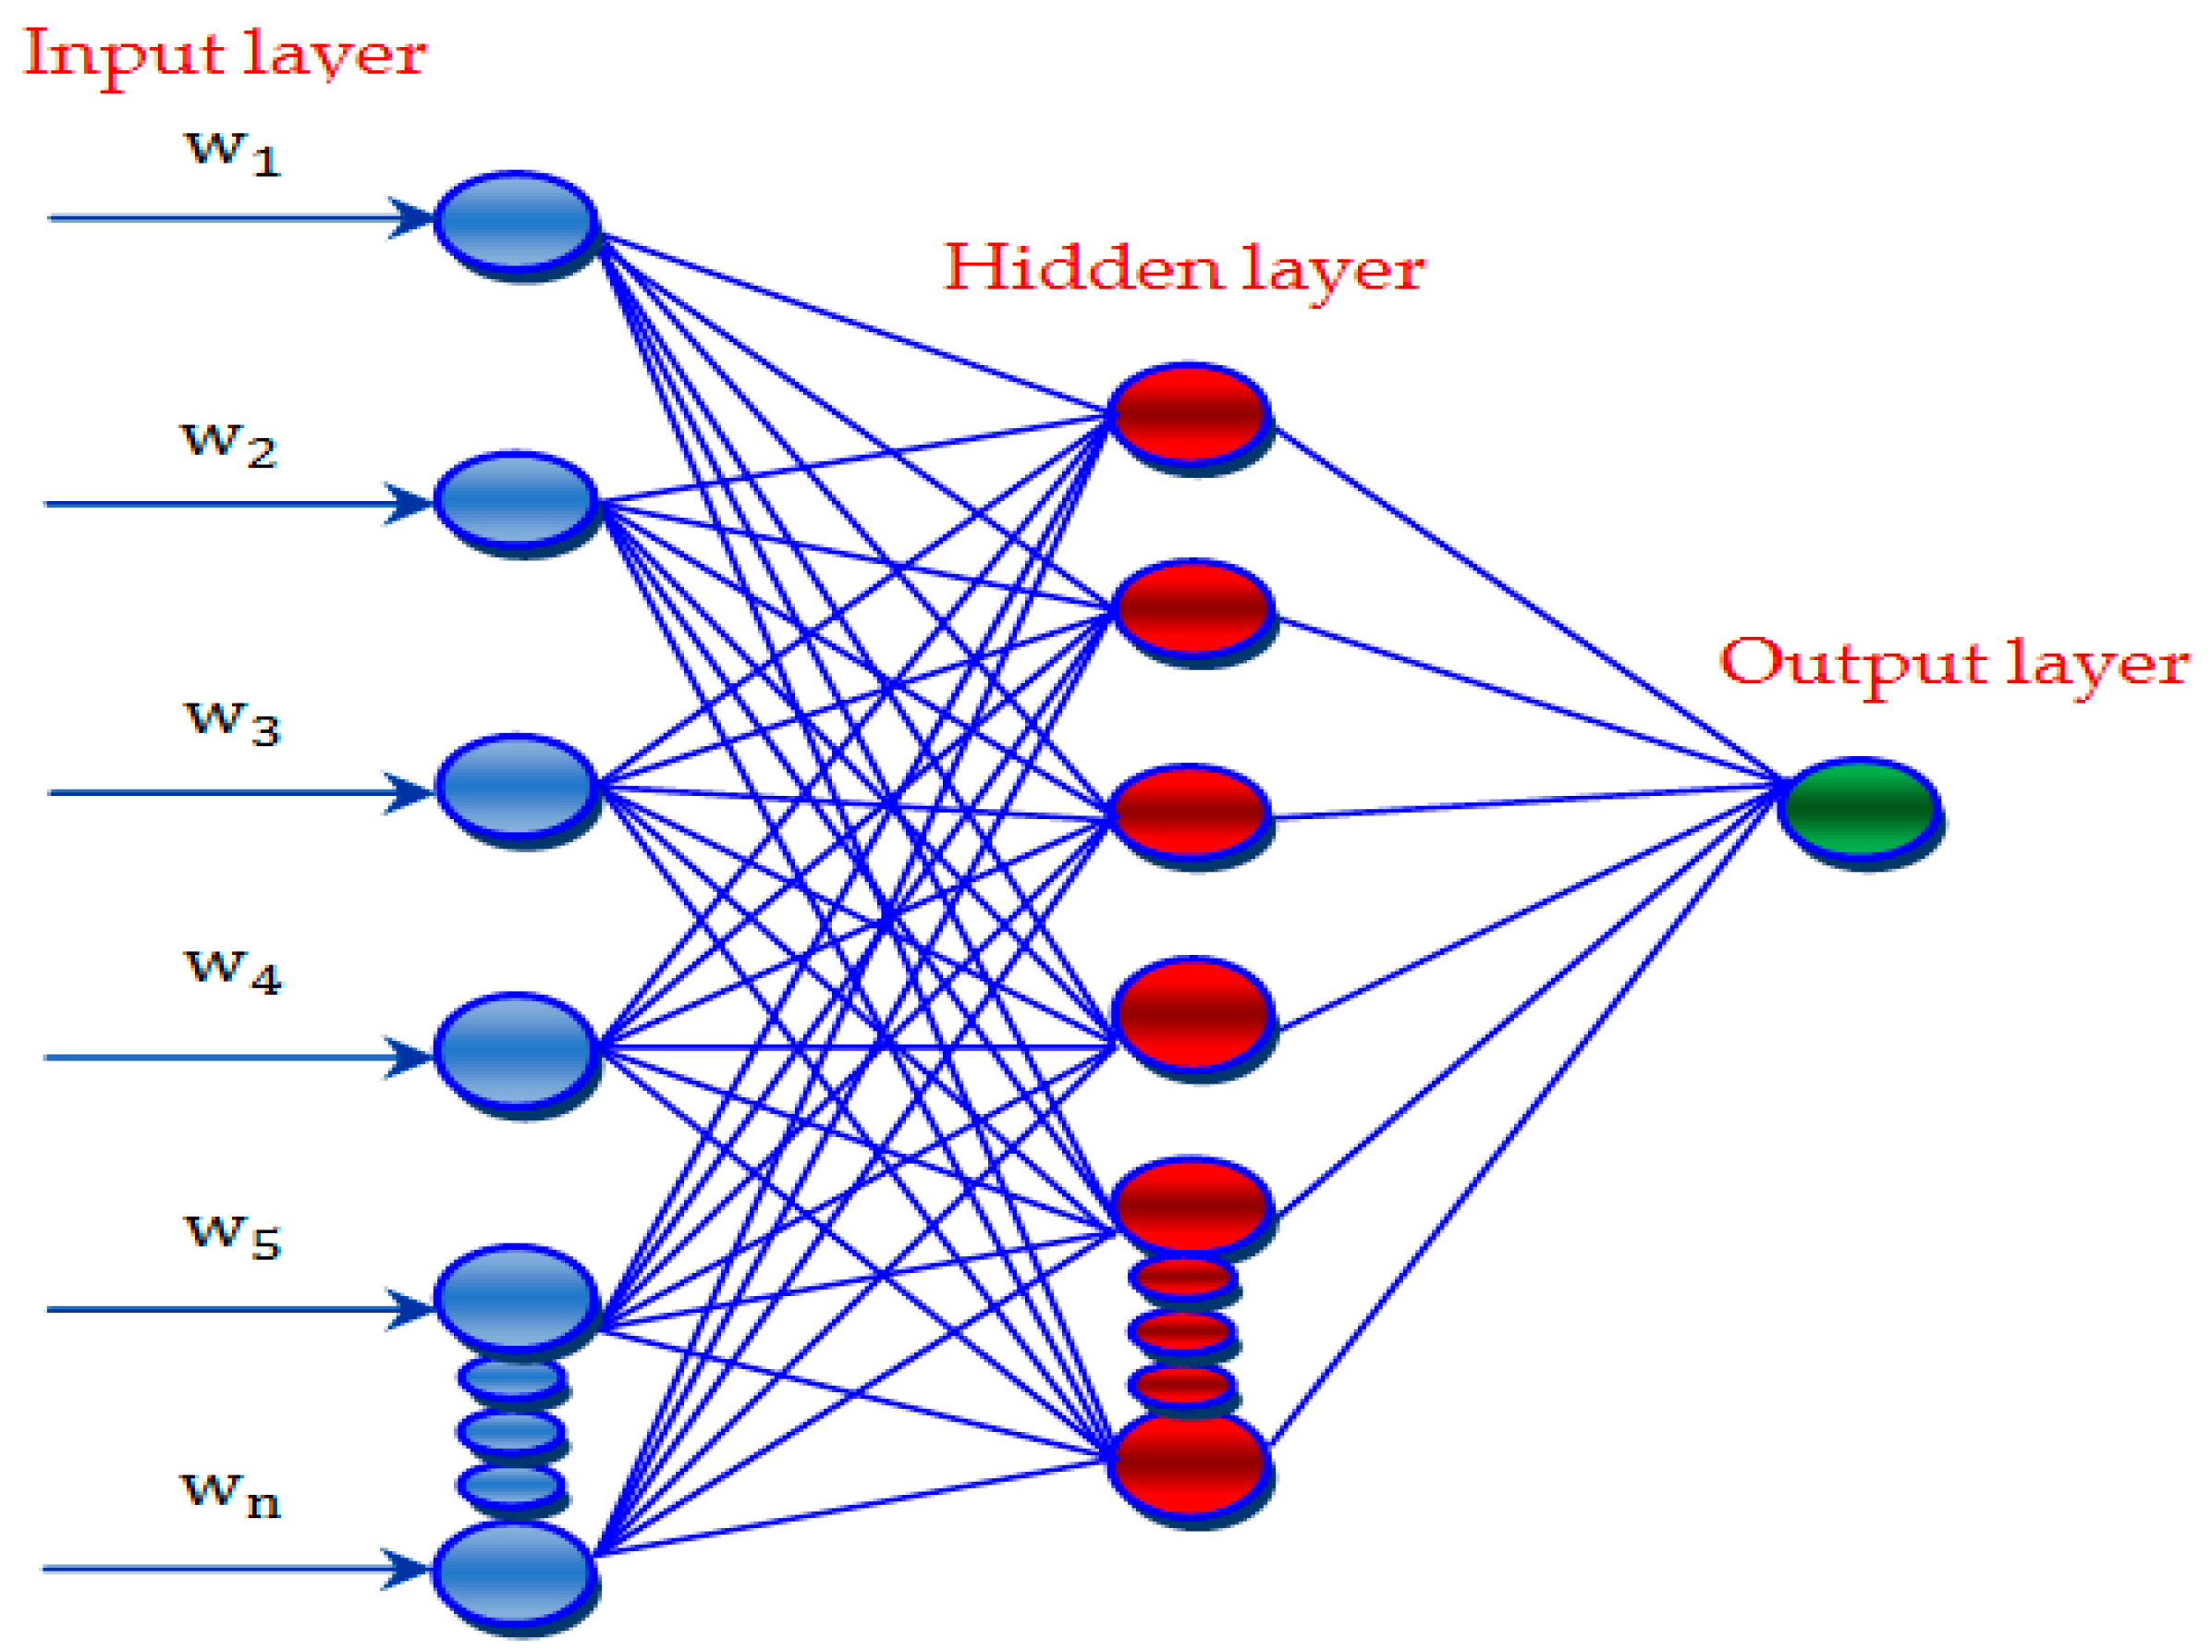
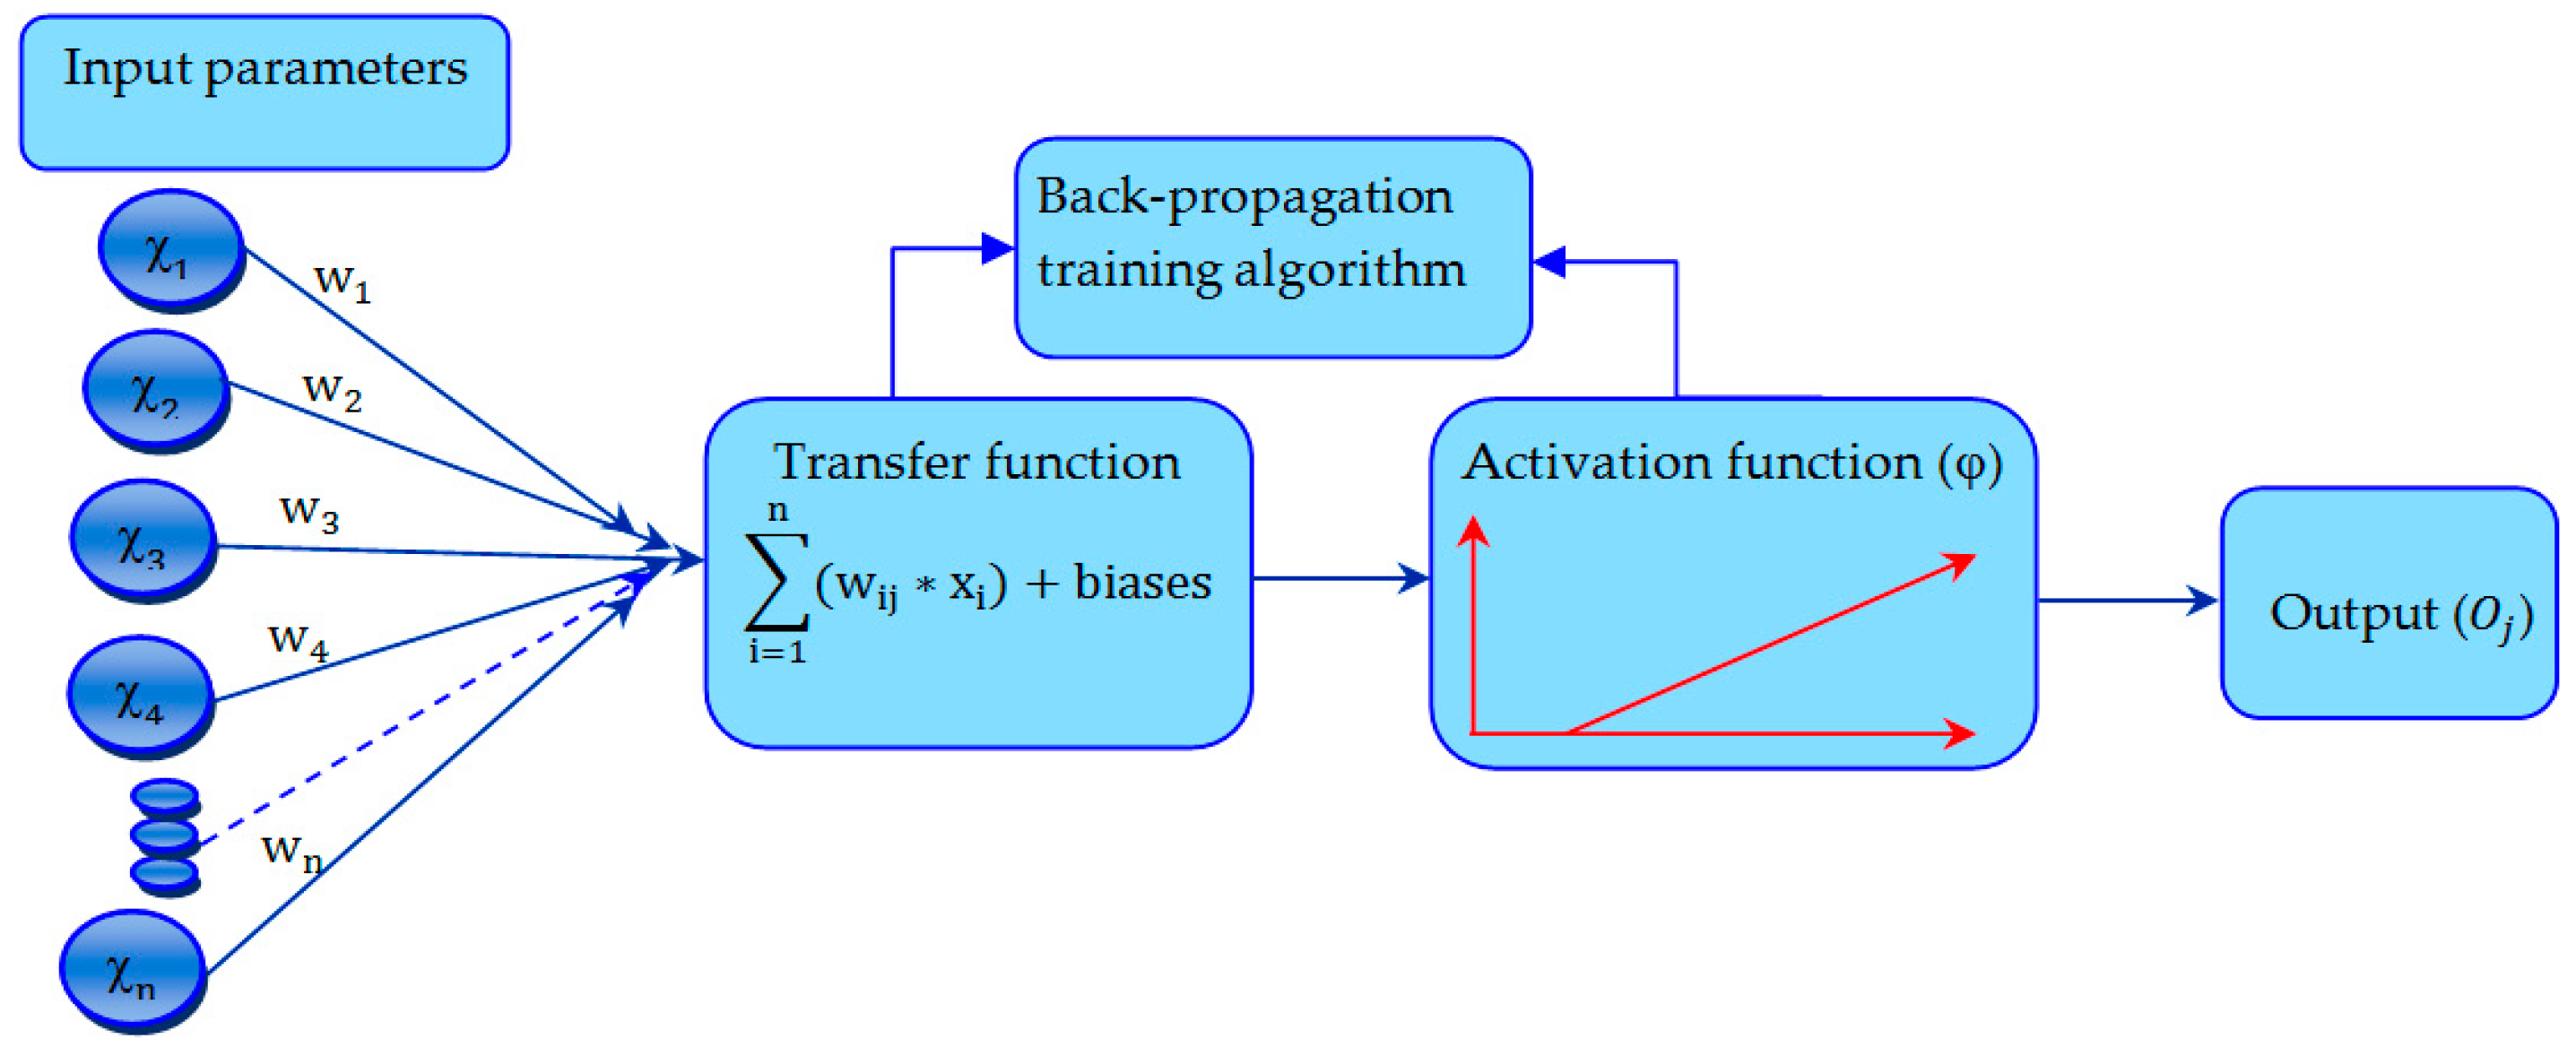
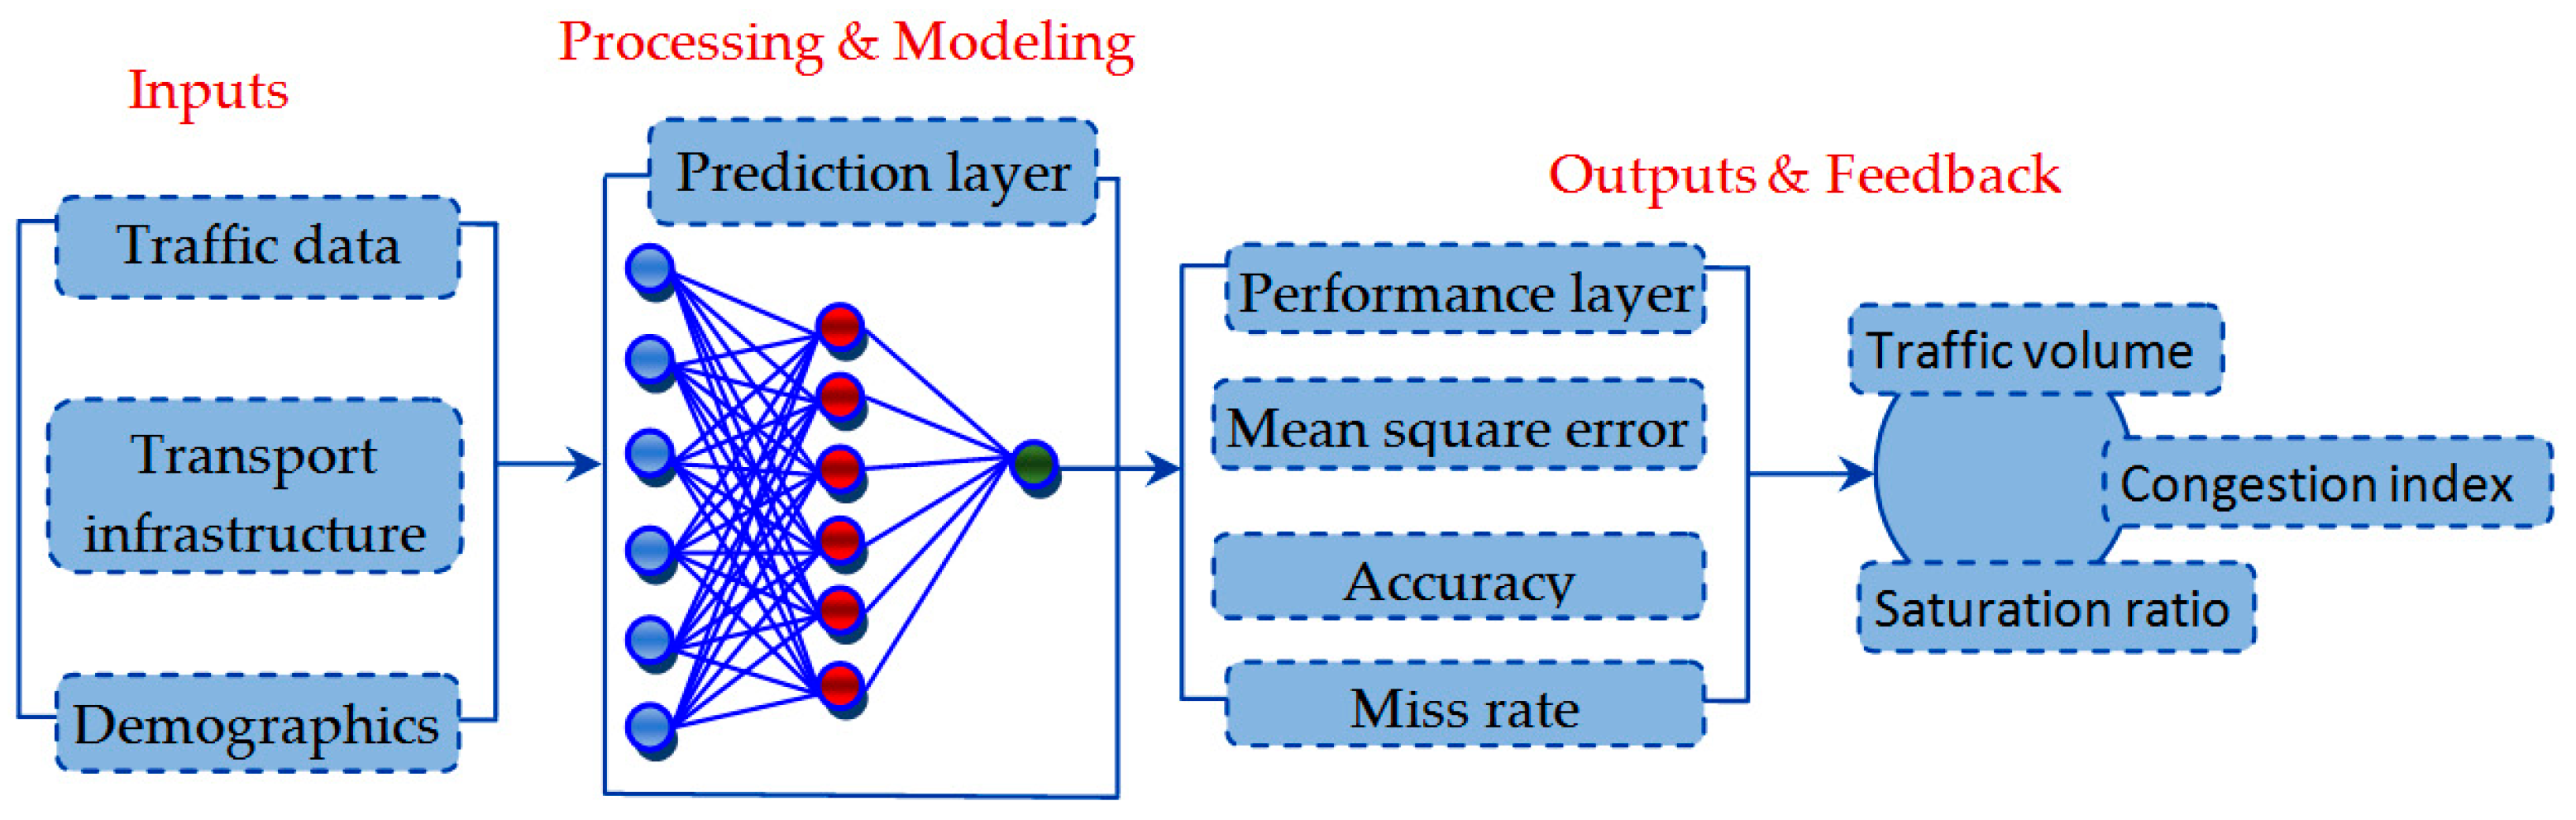
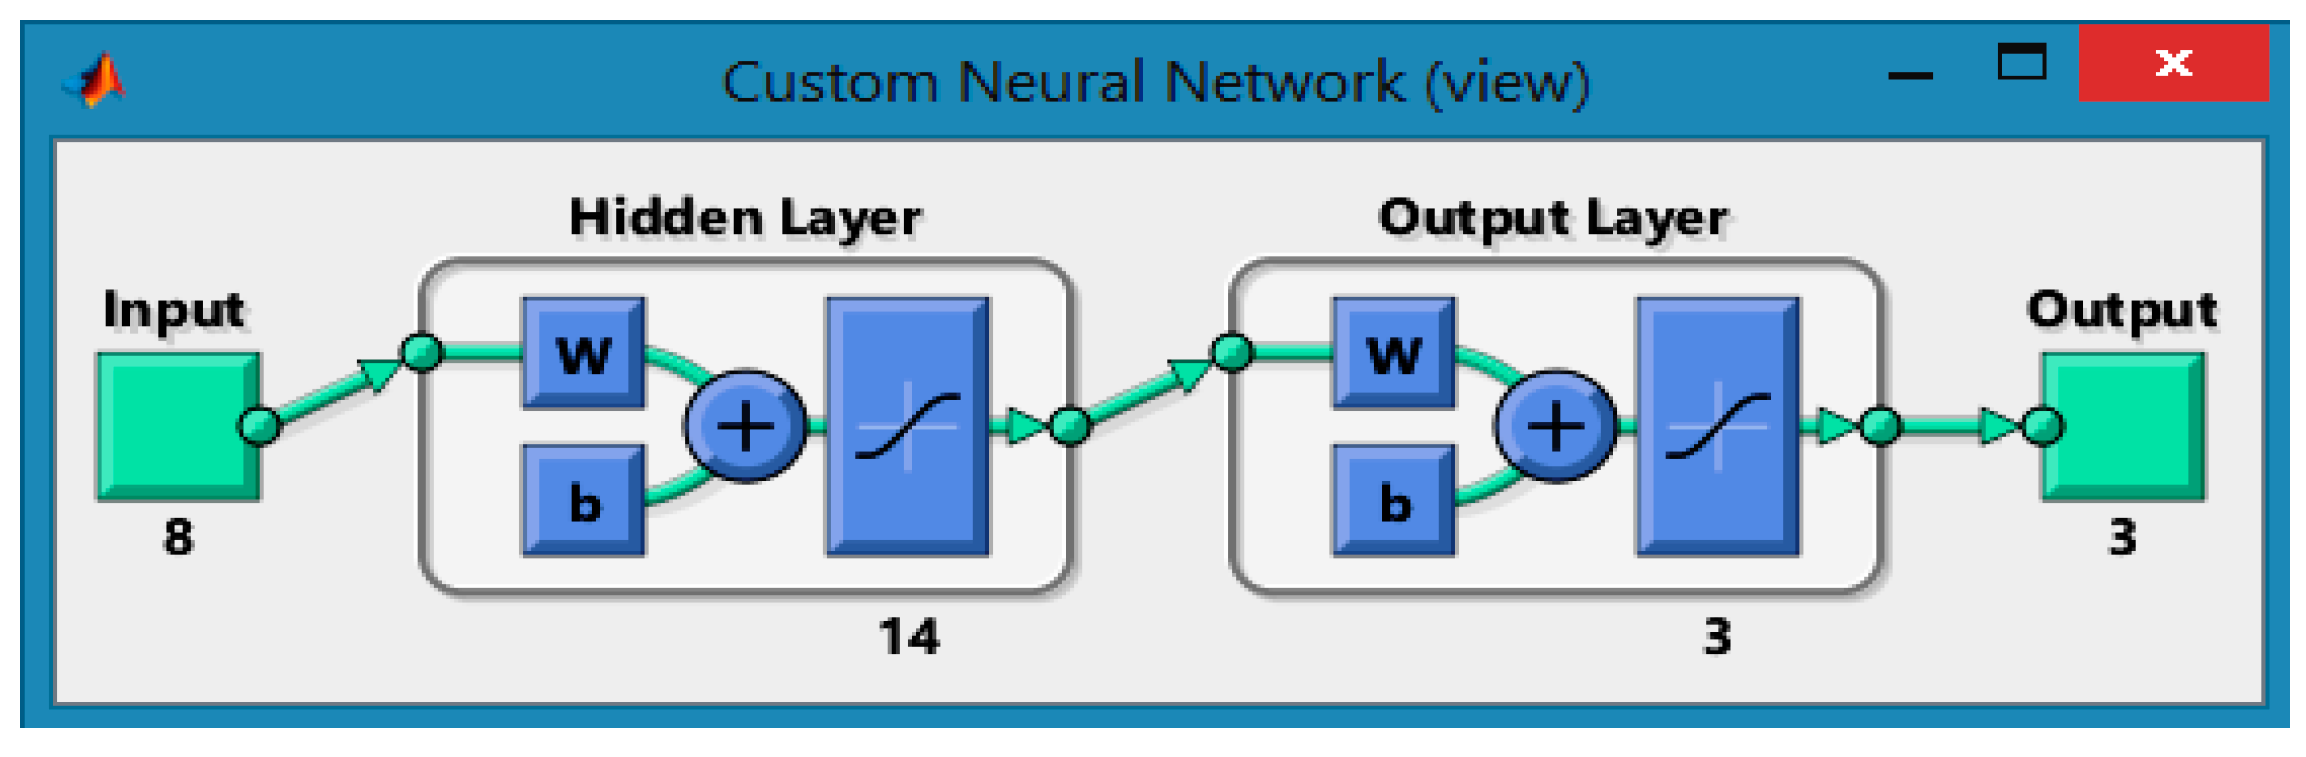
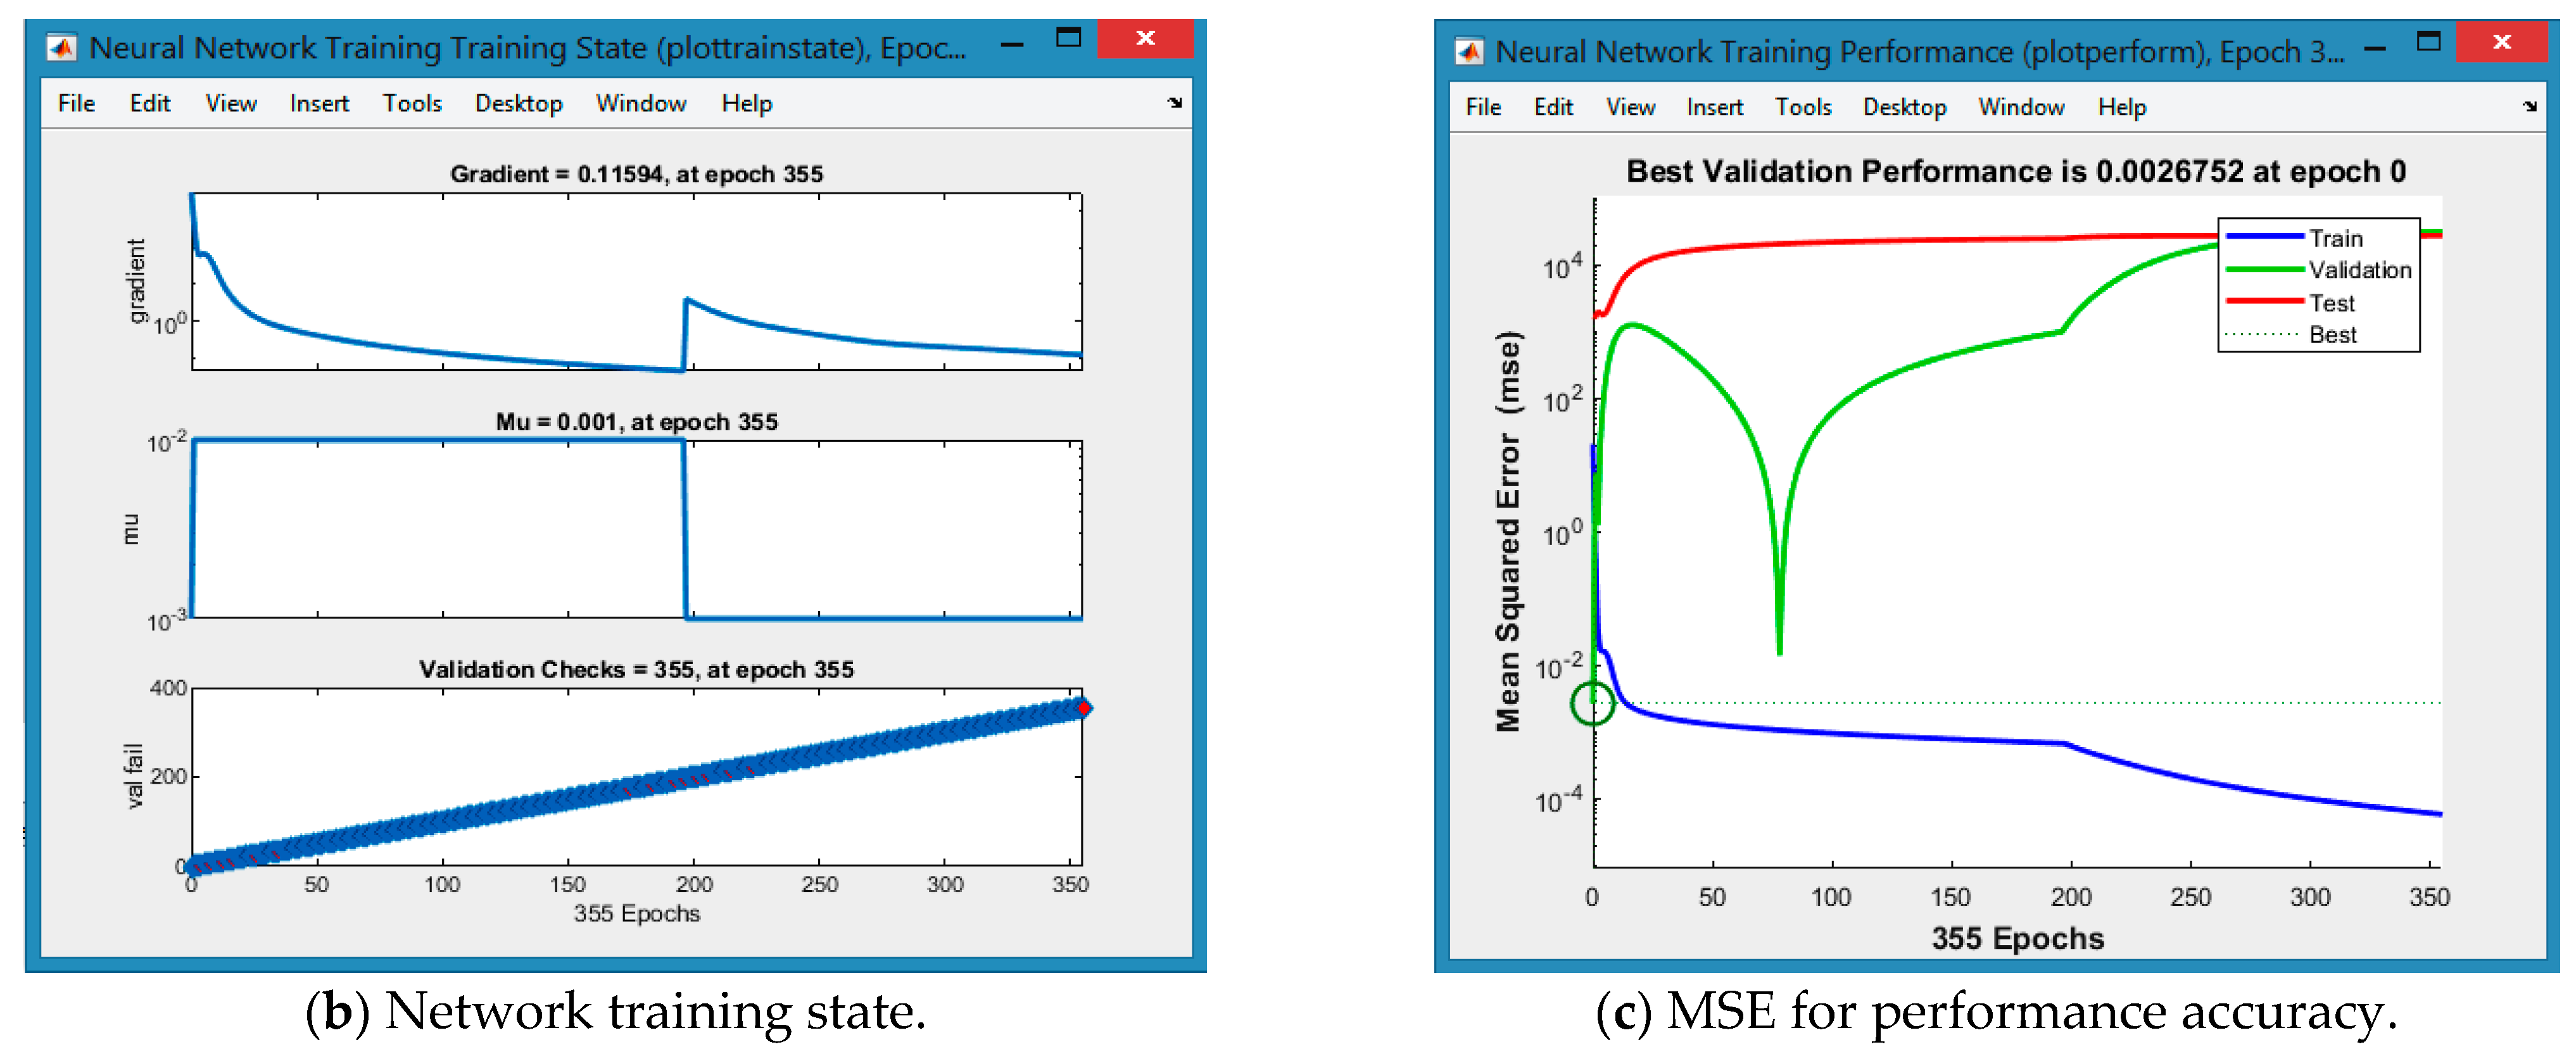
3.2. Modeling Traffic Resilience Using a Neural Network

In this study, the MATLAB R2019b software wizard was adopted in order to integrate the training model—a multi-layer feed-forward back-propagation involving an input–output and curve fitting (nftool). The model fitting tool is a versatile mapping facility applied between the numeric input and target data sets for the assessment of the compatibility of a prediction in which Nonlinear Autoregressive Network with Exogenous Input Neural Network (NARX-NN) inputs are not available [50]. Unfortunately, the authorities of the two cities have not been keeping adequate track of the temporal and spatial data of the elements contributing to the perennial traffic congestion problems in the two cities. In the current analysis, NARX-NN could not be considered as predictor of the dynamic or recurrent time series because of the dearth of the input time-step traffic data pool for the predictive modeling. NARX is a recurrent neural network (RNN) model analysis tool for the prediction and forecasting of chaotic time series dynamic systems [51].
The n f t o o l model proposed could provide a real-time input–output network quality scenario analysis that is useful for congestion management, vehicle scheduling, and routing systems. By developing scripts and using a graphical user interface on a case-by-case basis, and by providing training to solve problems of approximation, a quality predictor can be created for spatial and temporal predictions of problems of urban environments [52,53]. As the model is populated with more data, future research may incorporate the model (multi-layer feed-forward back-propagation) into a genetic algorithm or other optimization algorithms in order to better improve the transport service and prediction qualities.
In the MATLAB R2019b platform, the most suitable algorithms were used to train the best possible solutions within the ANN’s n n t o o l or n n s t a r t command window, and to further predict outcomes. In order to create the nftool fitting model, three algorithms (i.e., Levenberg-Marquardt (LM), Bayesian Regularization (BR) and Scaled Conjugate Gradient (SCG)) were trained to compare the best network outputs. Based on the results, the algorithm that produced the best output metrics was selected. Within this process, it was necessary to look for the algorithm which minimized the mean-standard-error (MSE) and maximized regression (R) between the network outputs and the target in order to enhance the generalization of the chosen network topology [54]. The input data ( x 1   t o   x 8 ) in Table 3 and Table 4 define the traffic characteristics which impact on the congestion indices of the cluster population of the metropolitan areas in the two cities. Table 5 is the network training target characteristics data ( t 1 ,   t 2   &   t 3 ), i.e., arrays of random numbers generated from the recommended standards. Table 5 shows an example of the random numbers used as the target training for the traffic saturation degree generated by the command prompt in the MATLAB command window. The results (Table 6 and Table 7) are shown and discussed in detail in Section 3.3.

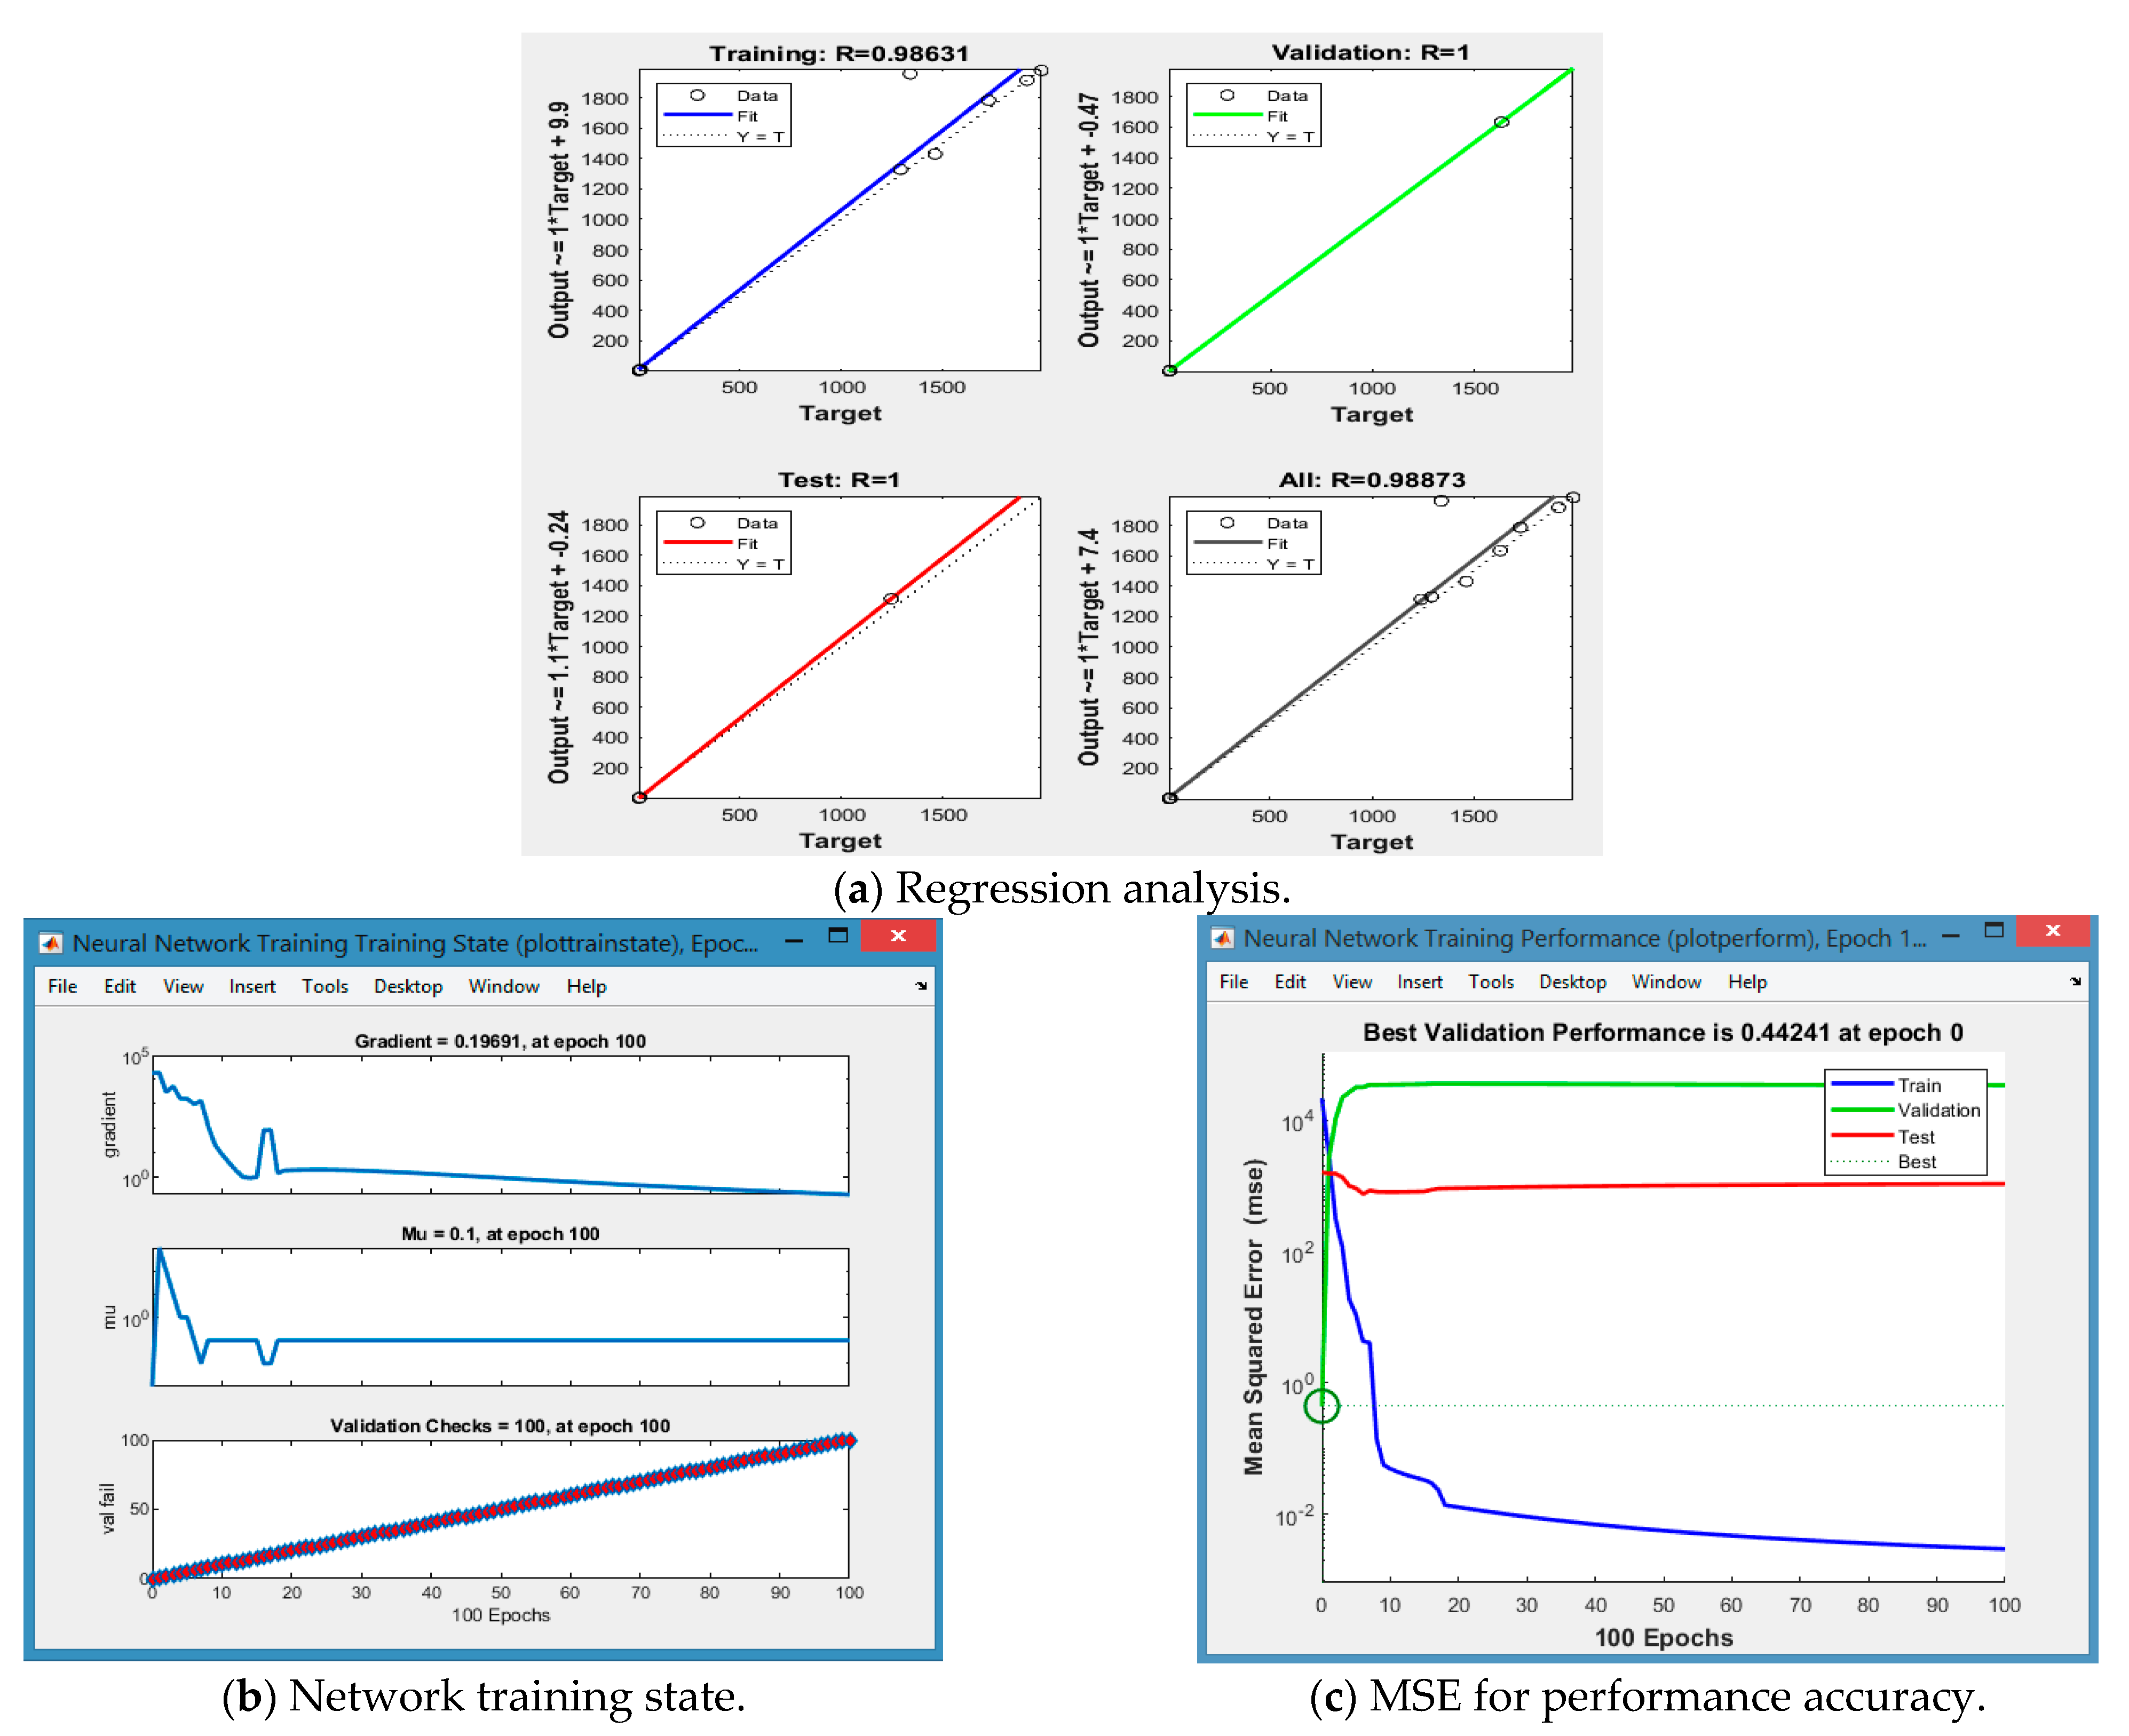
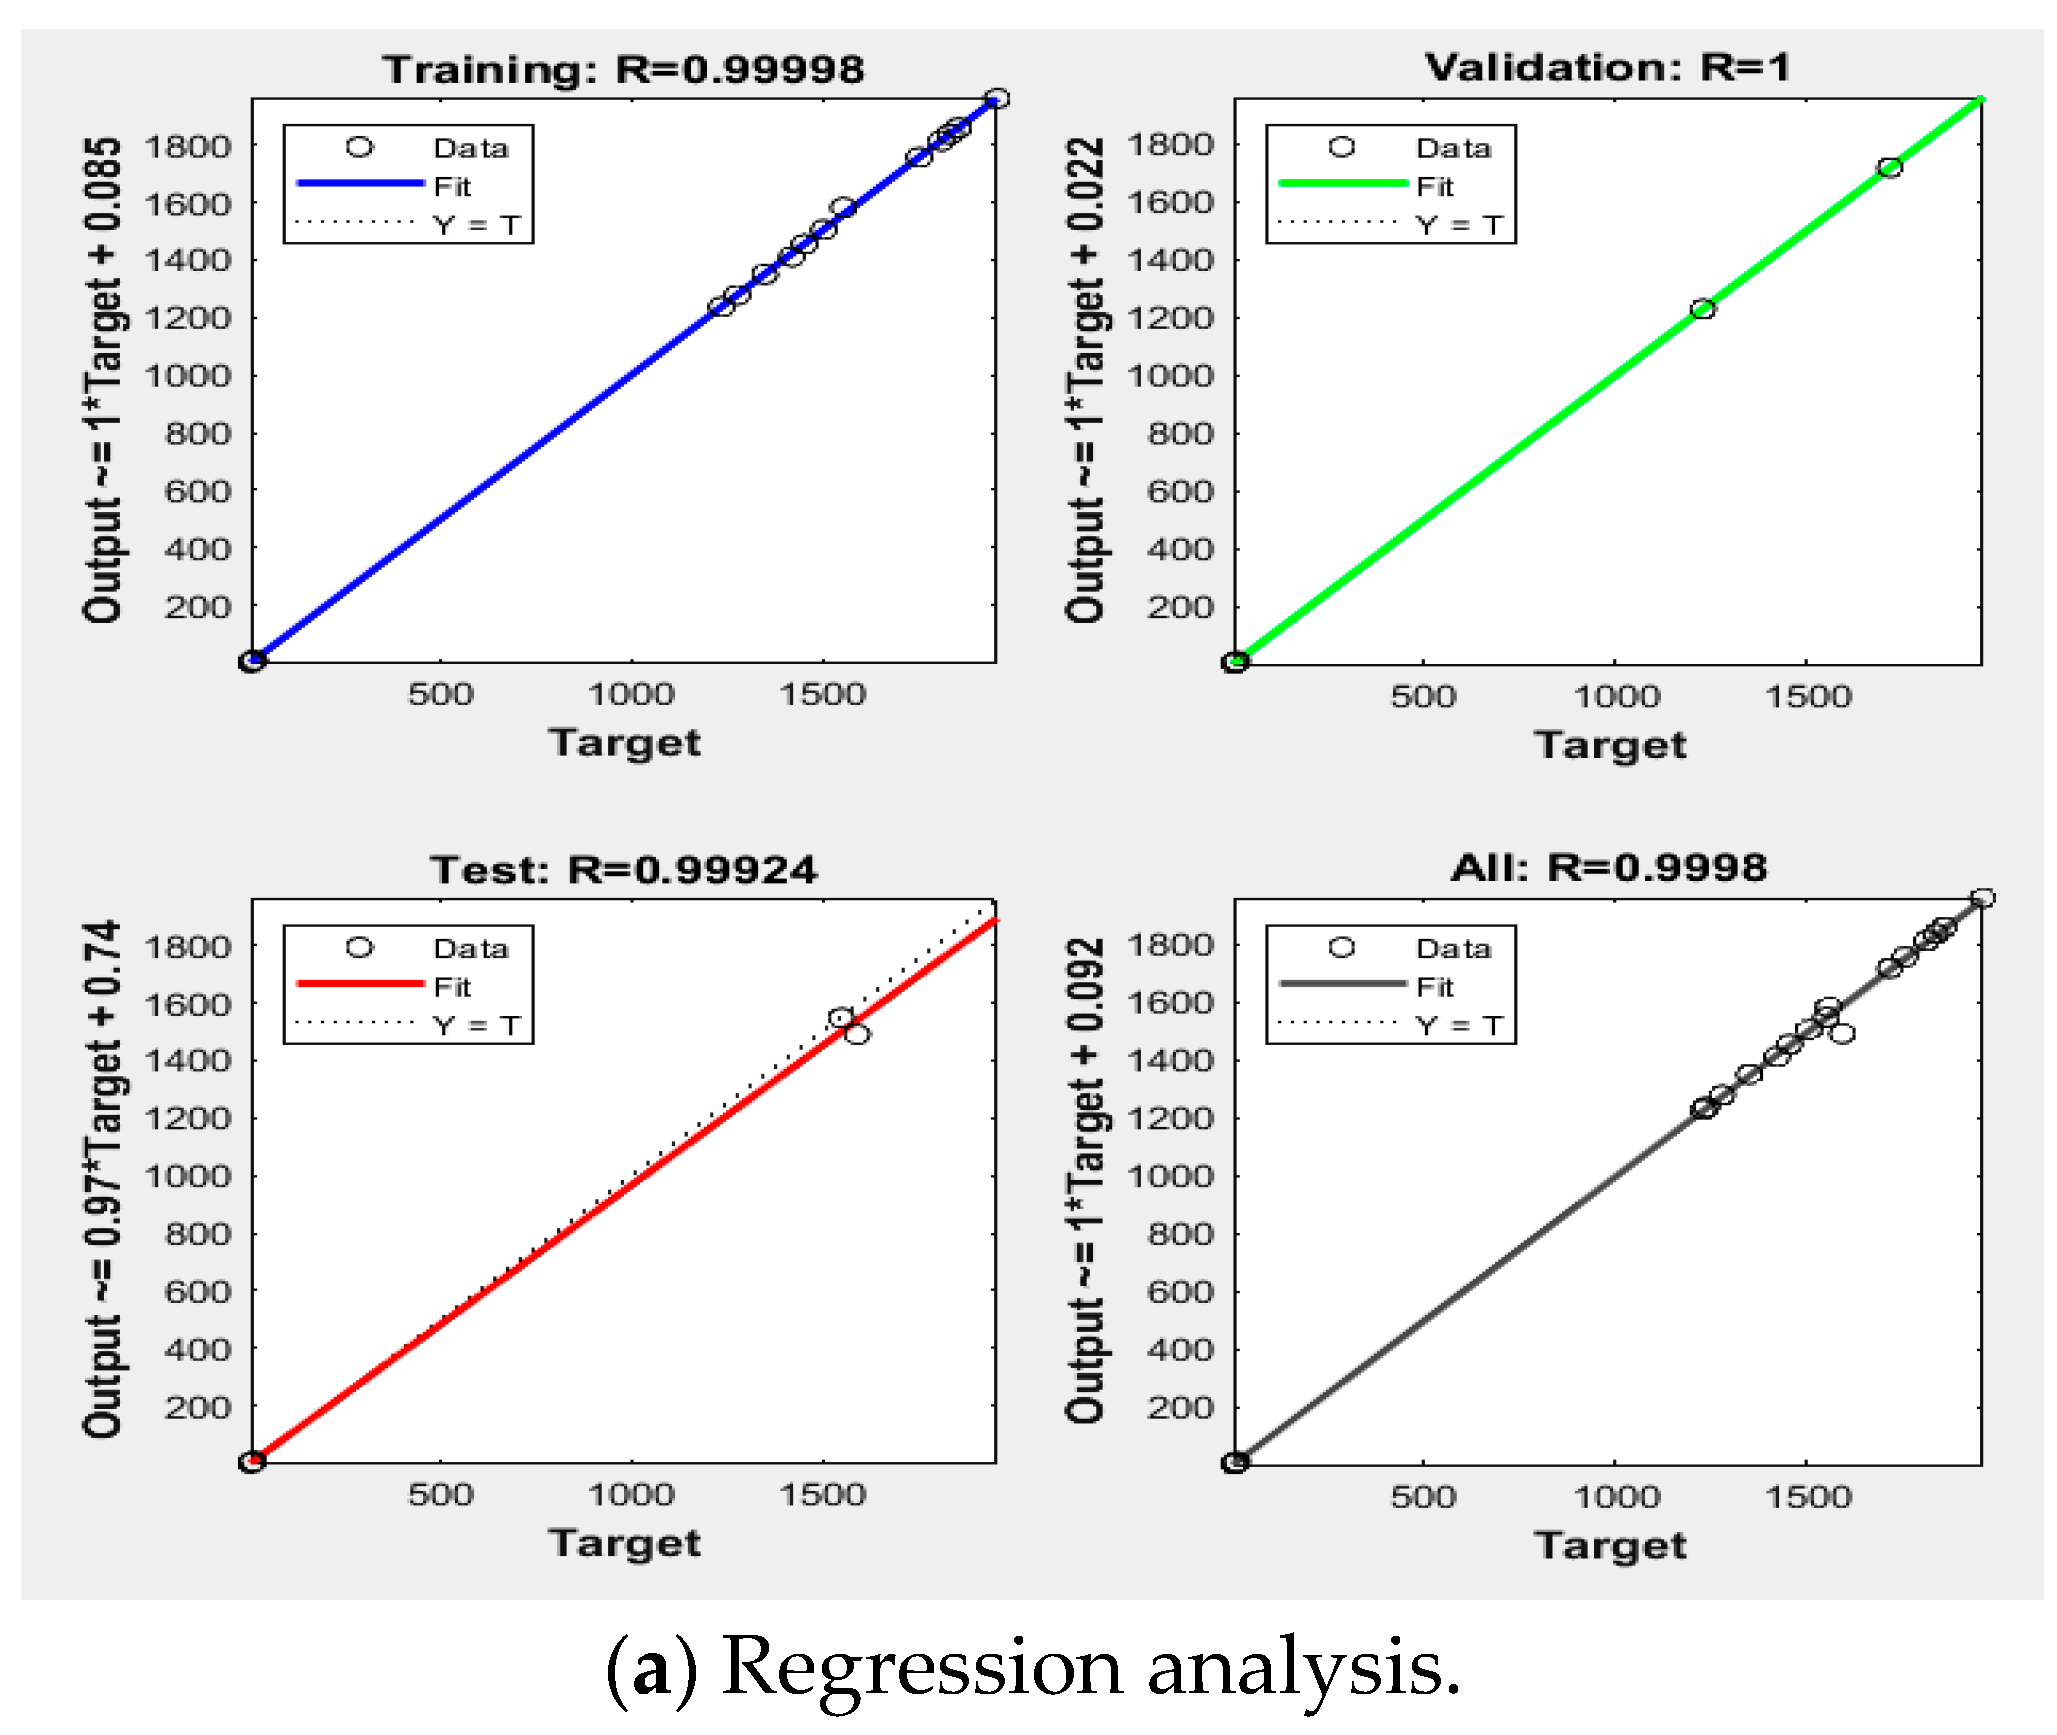
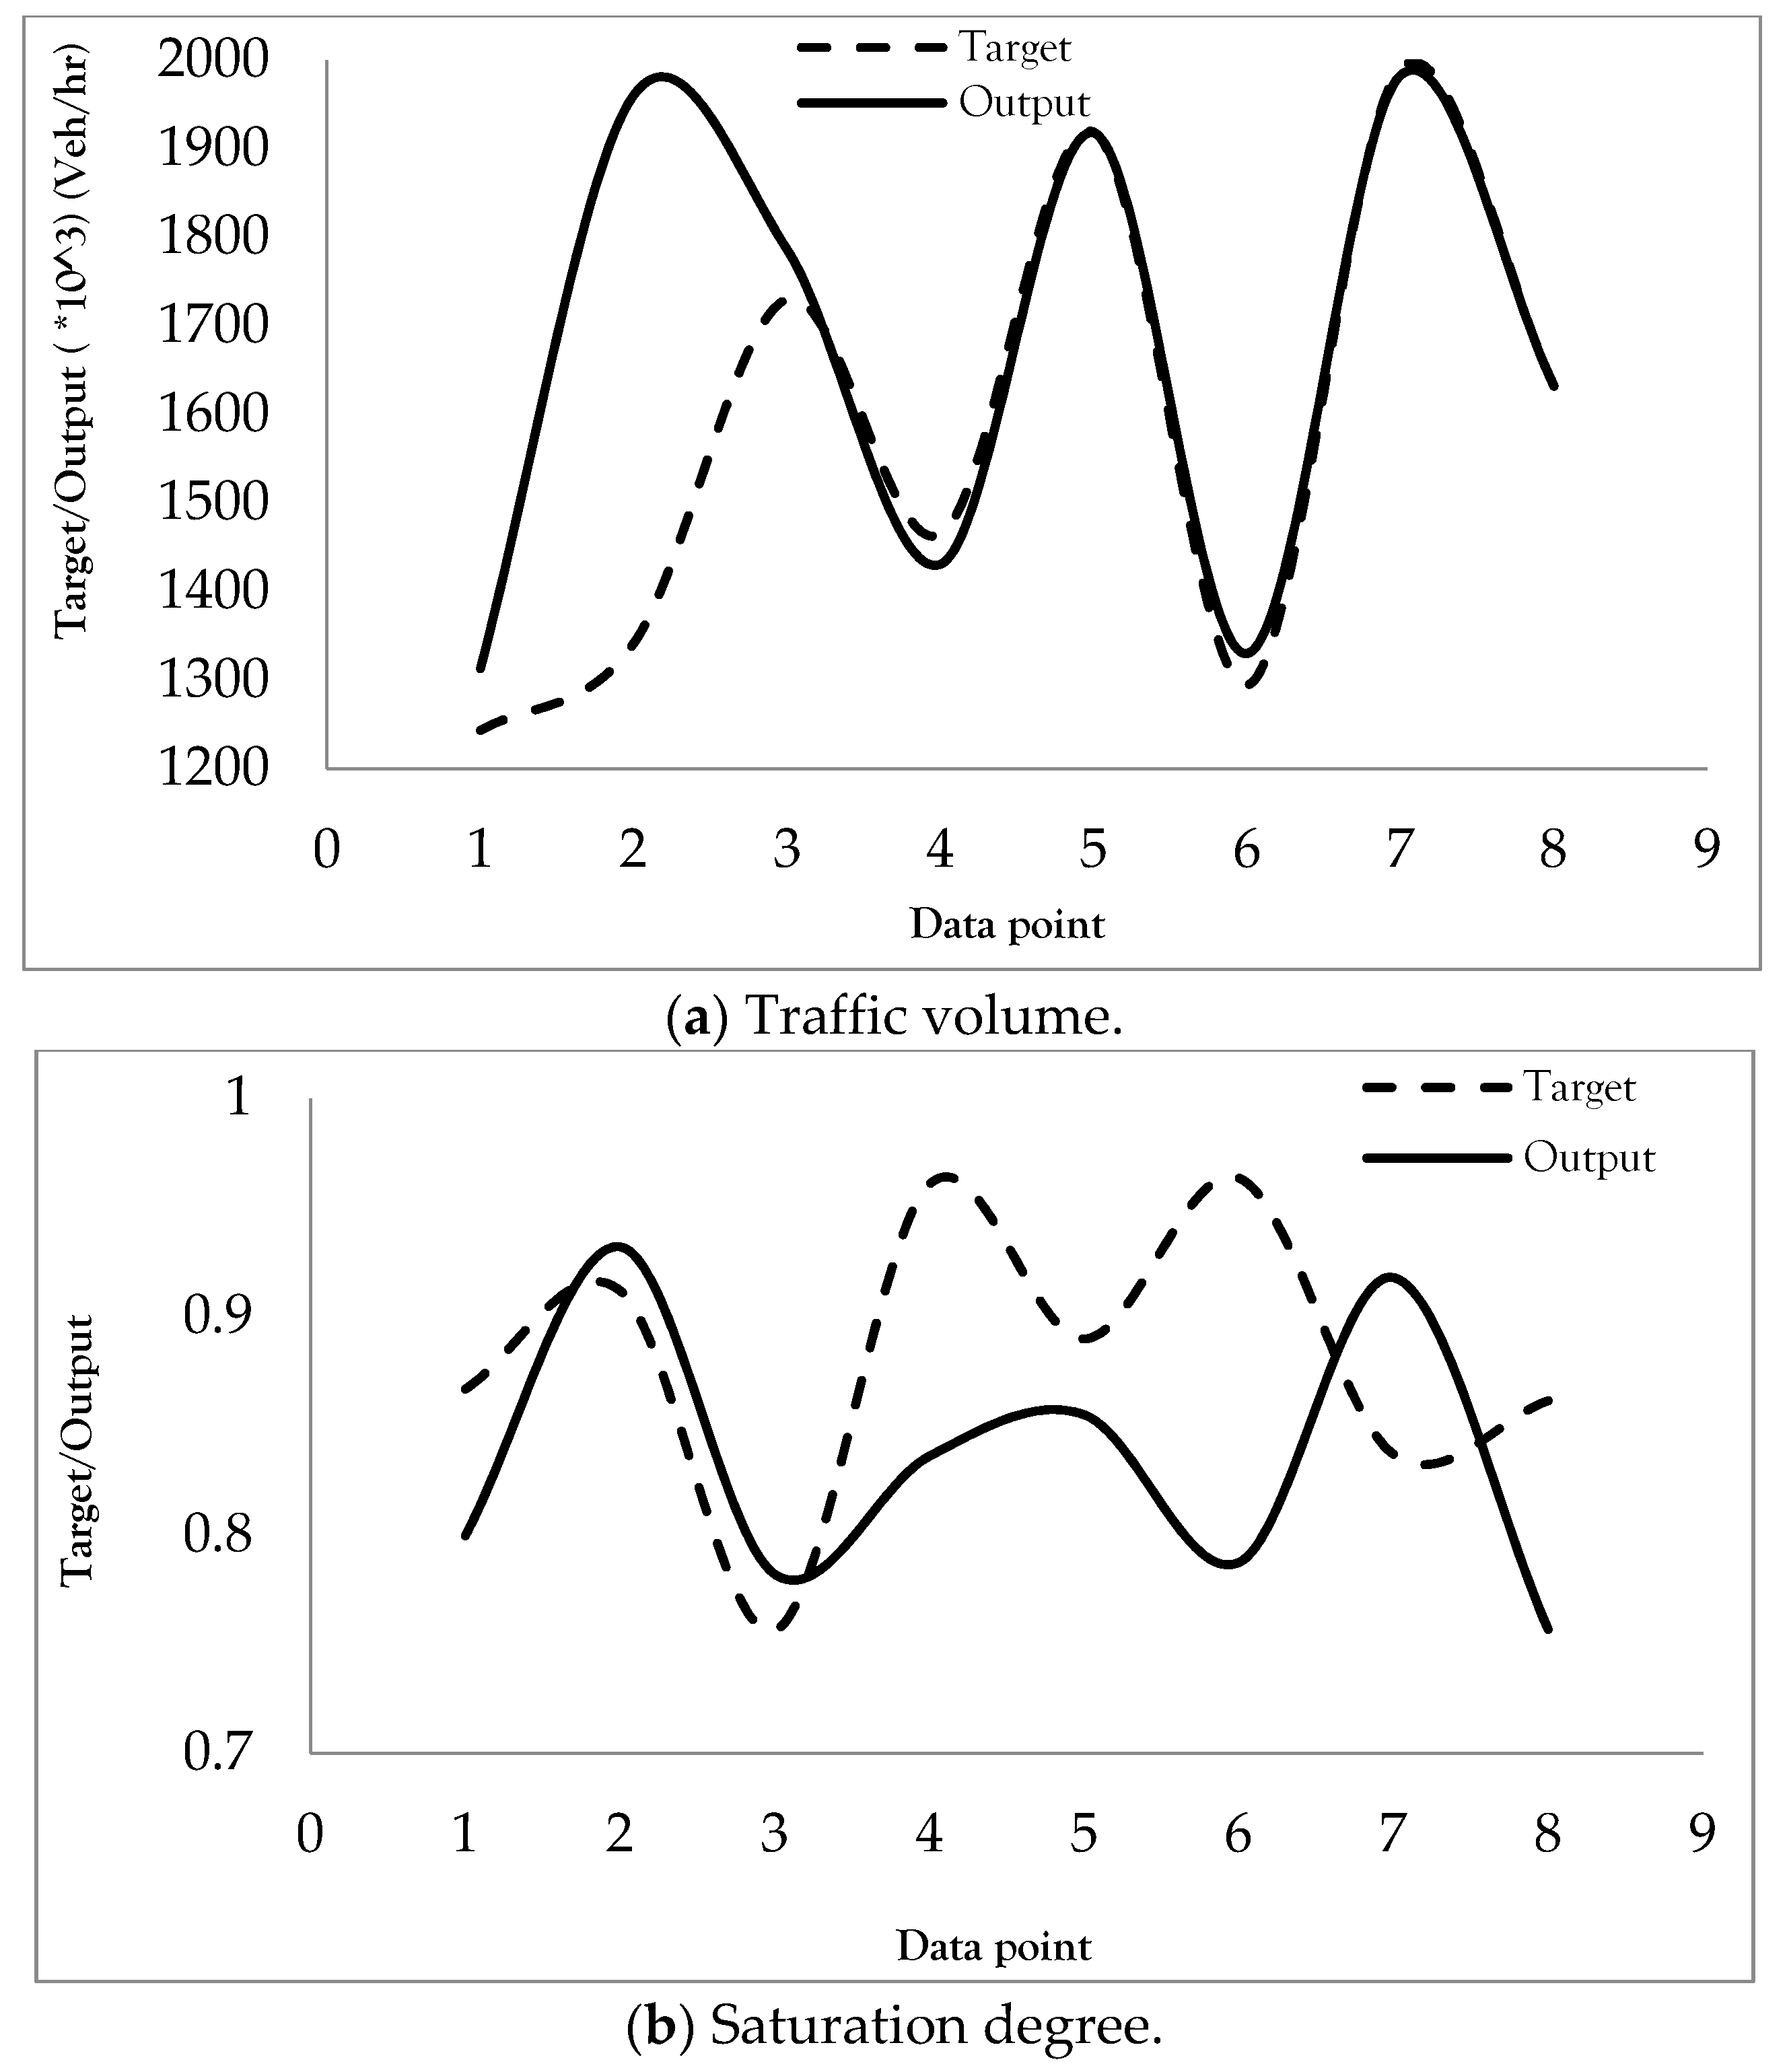
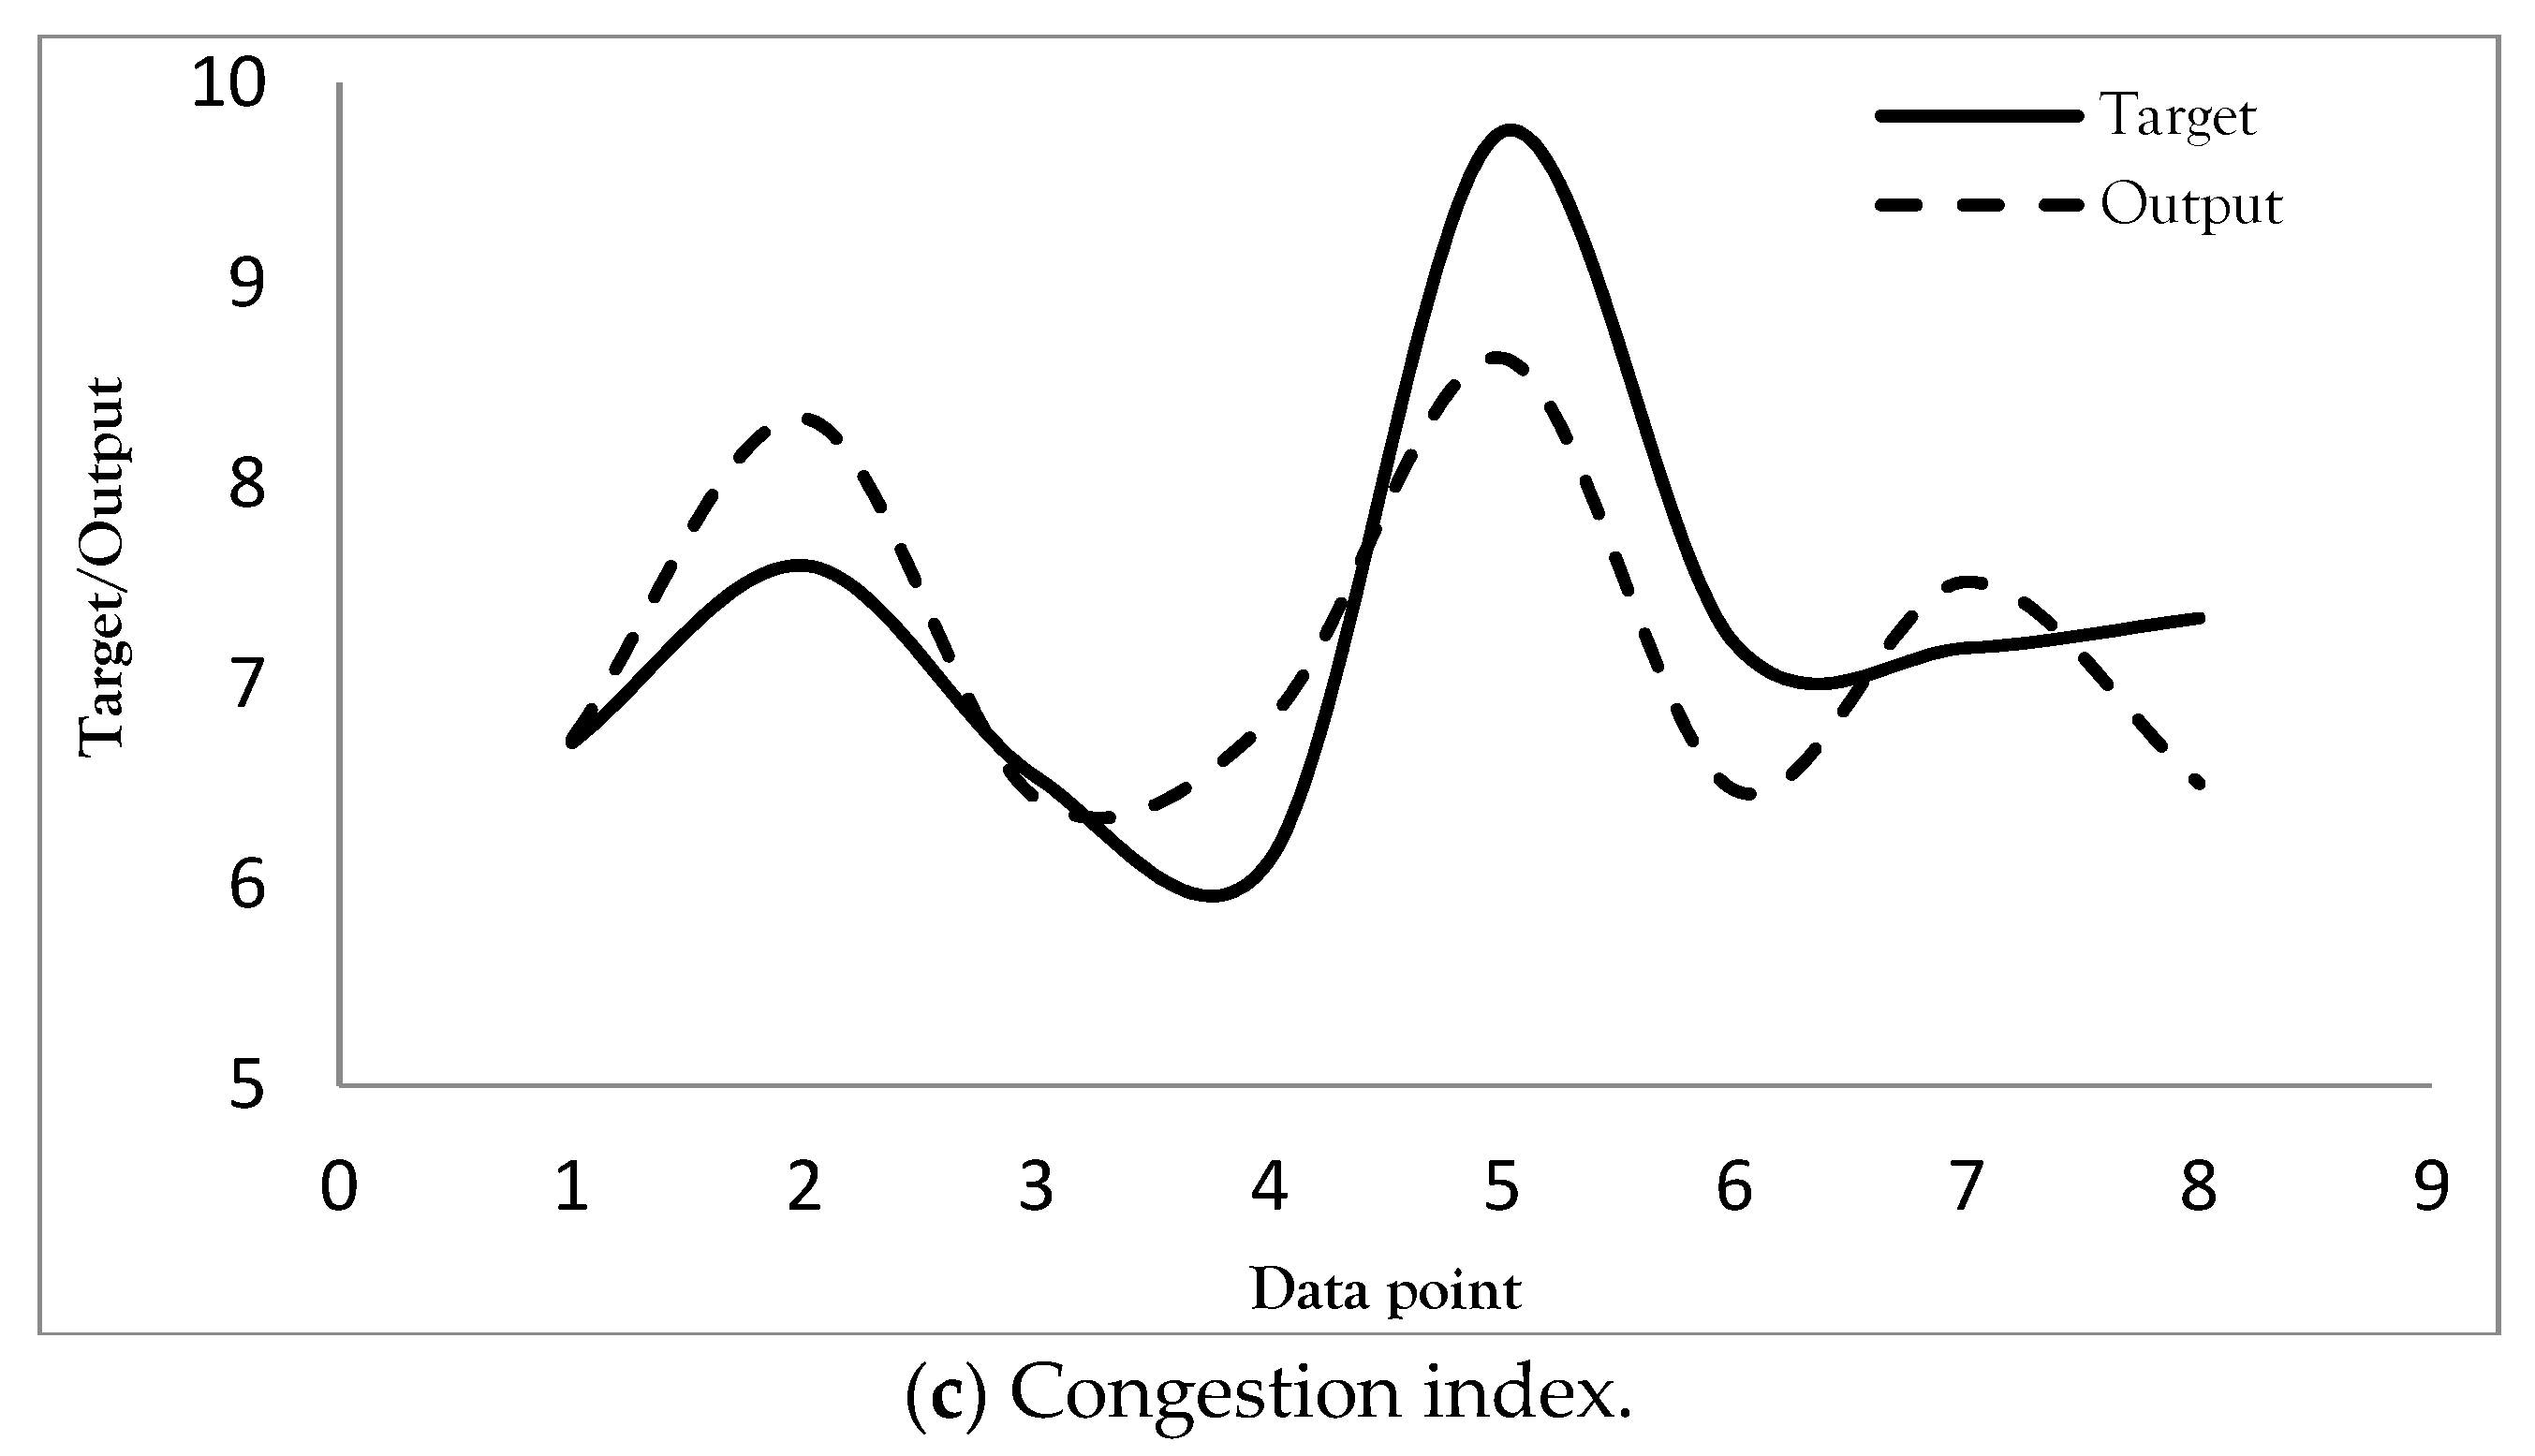
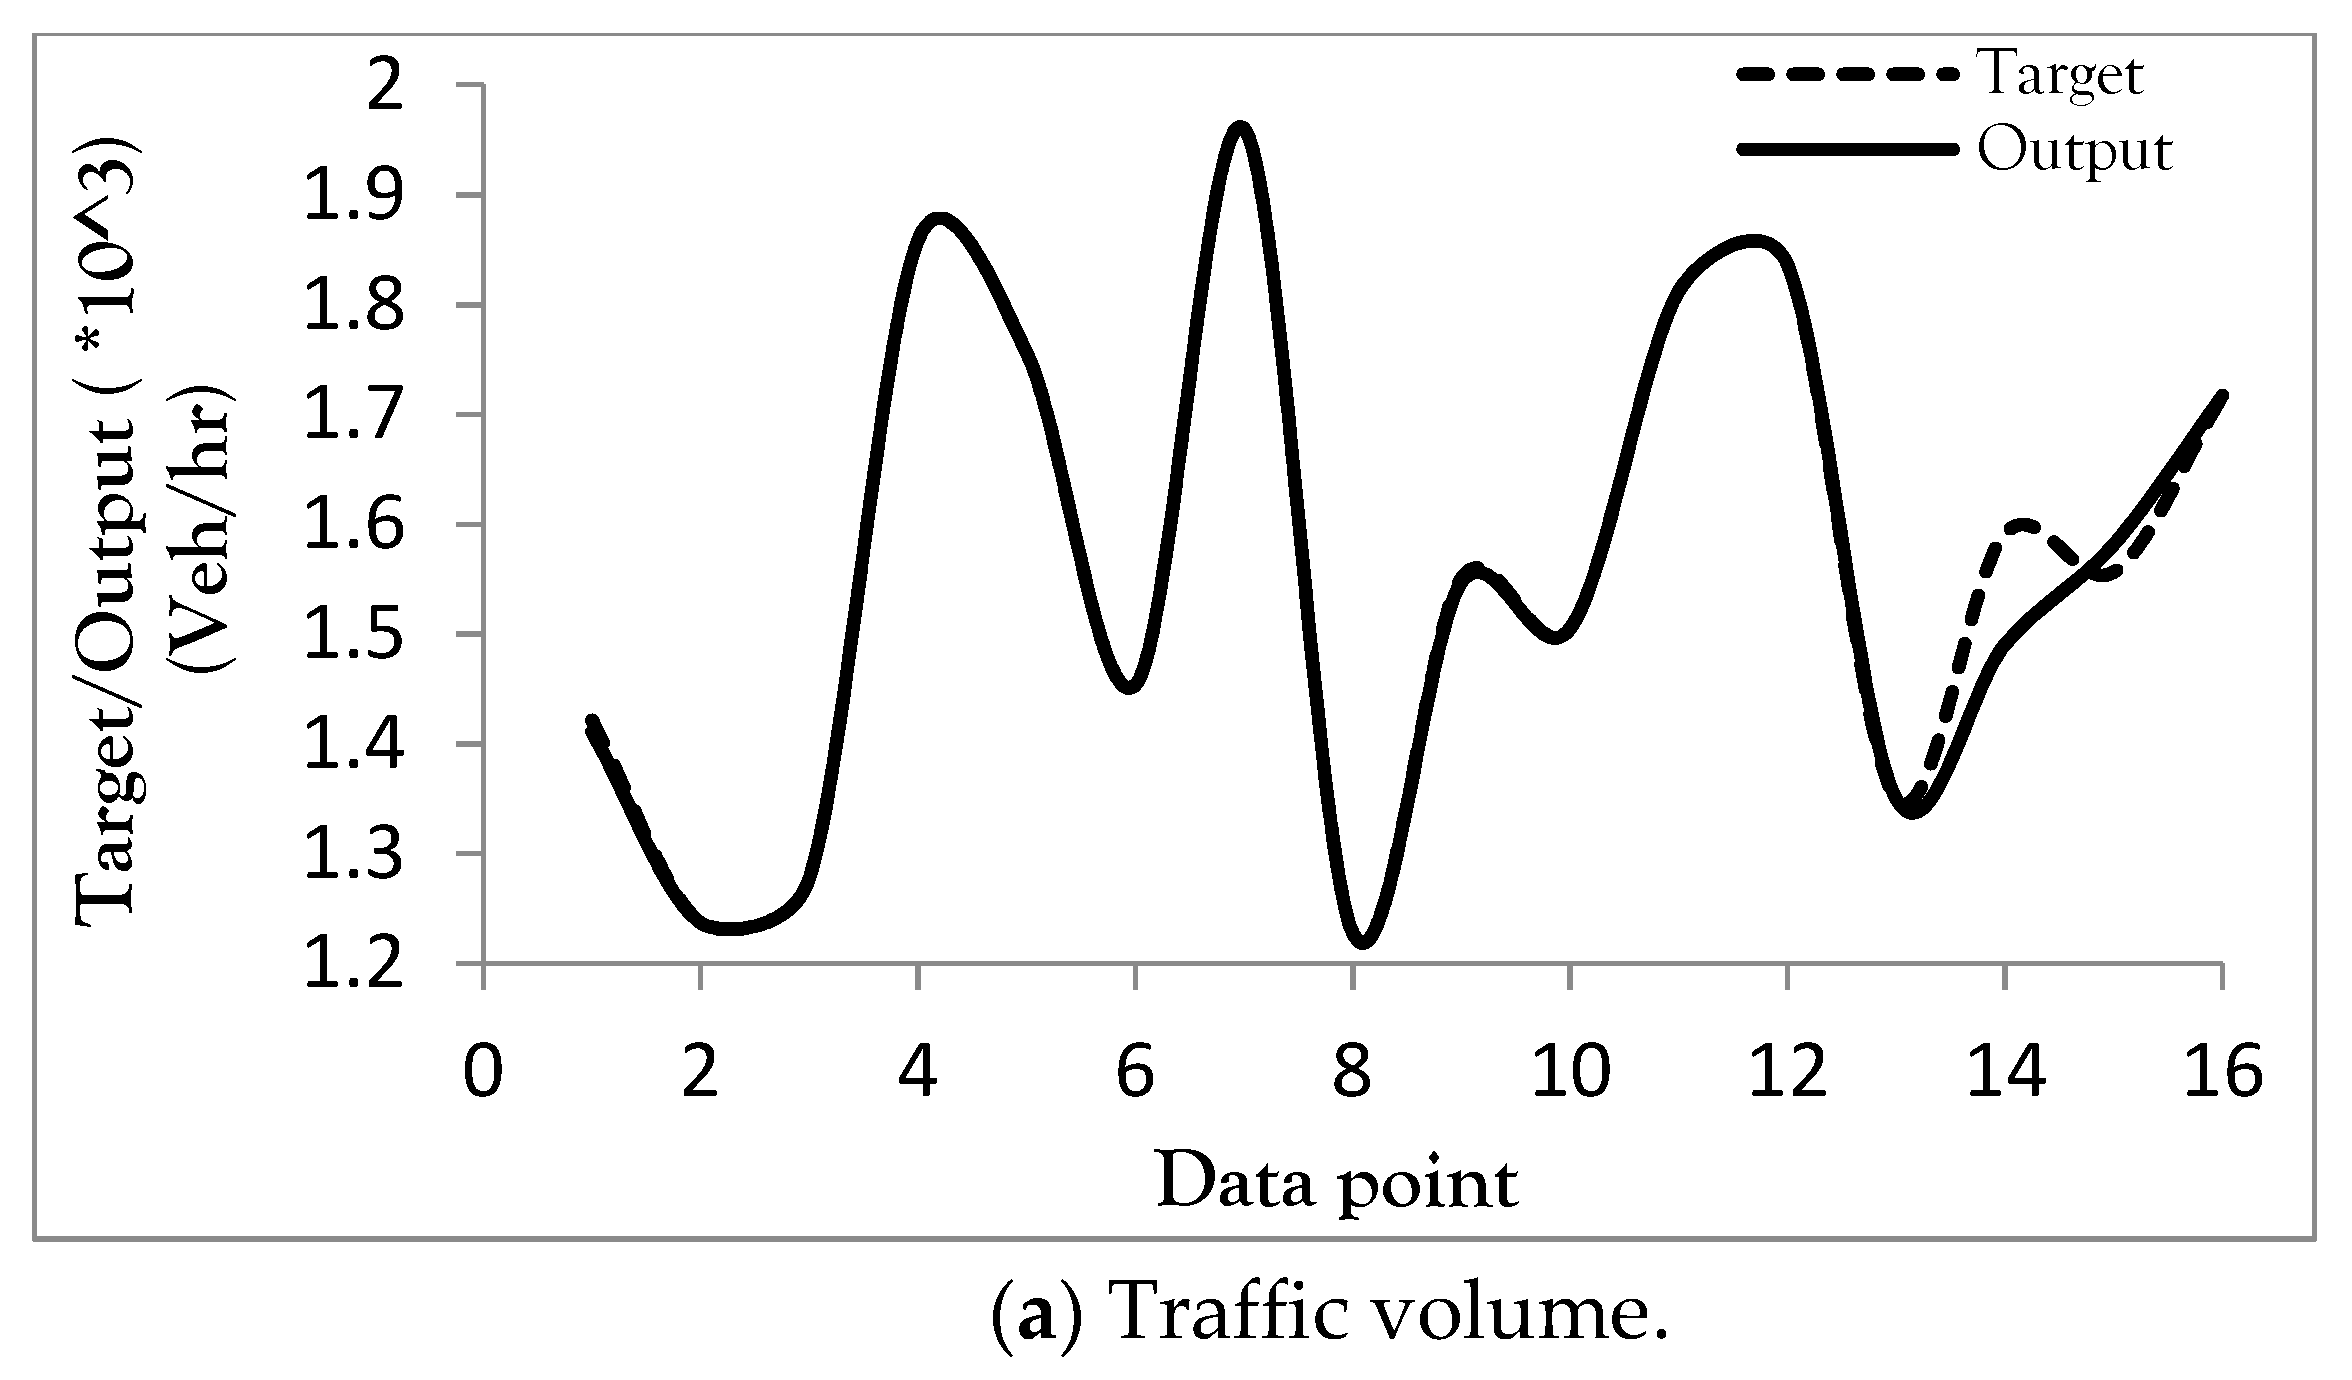
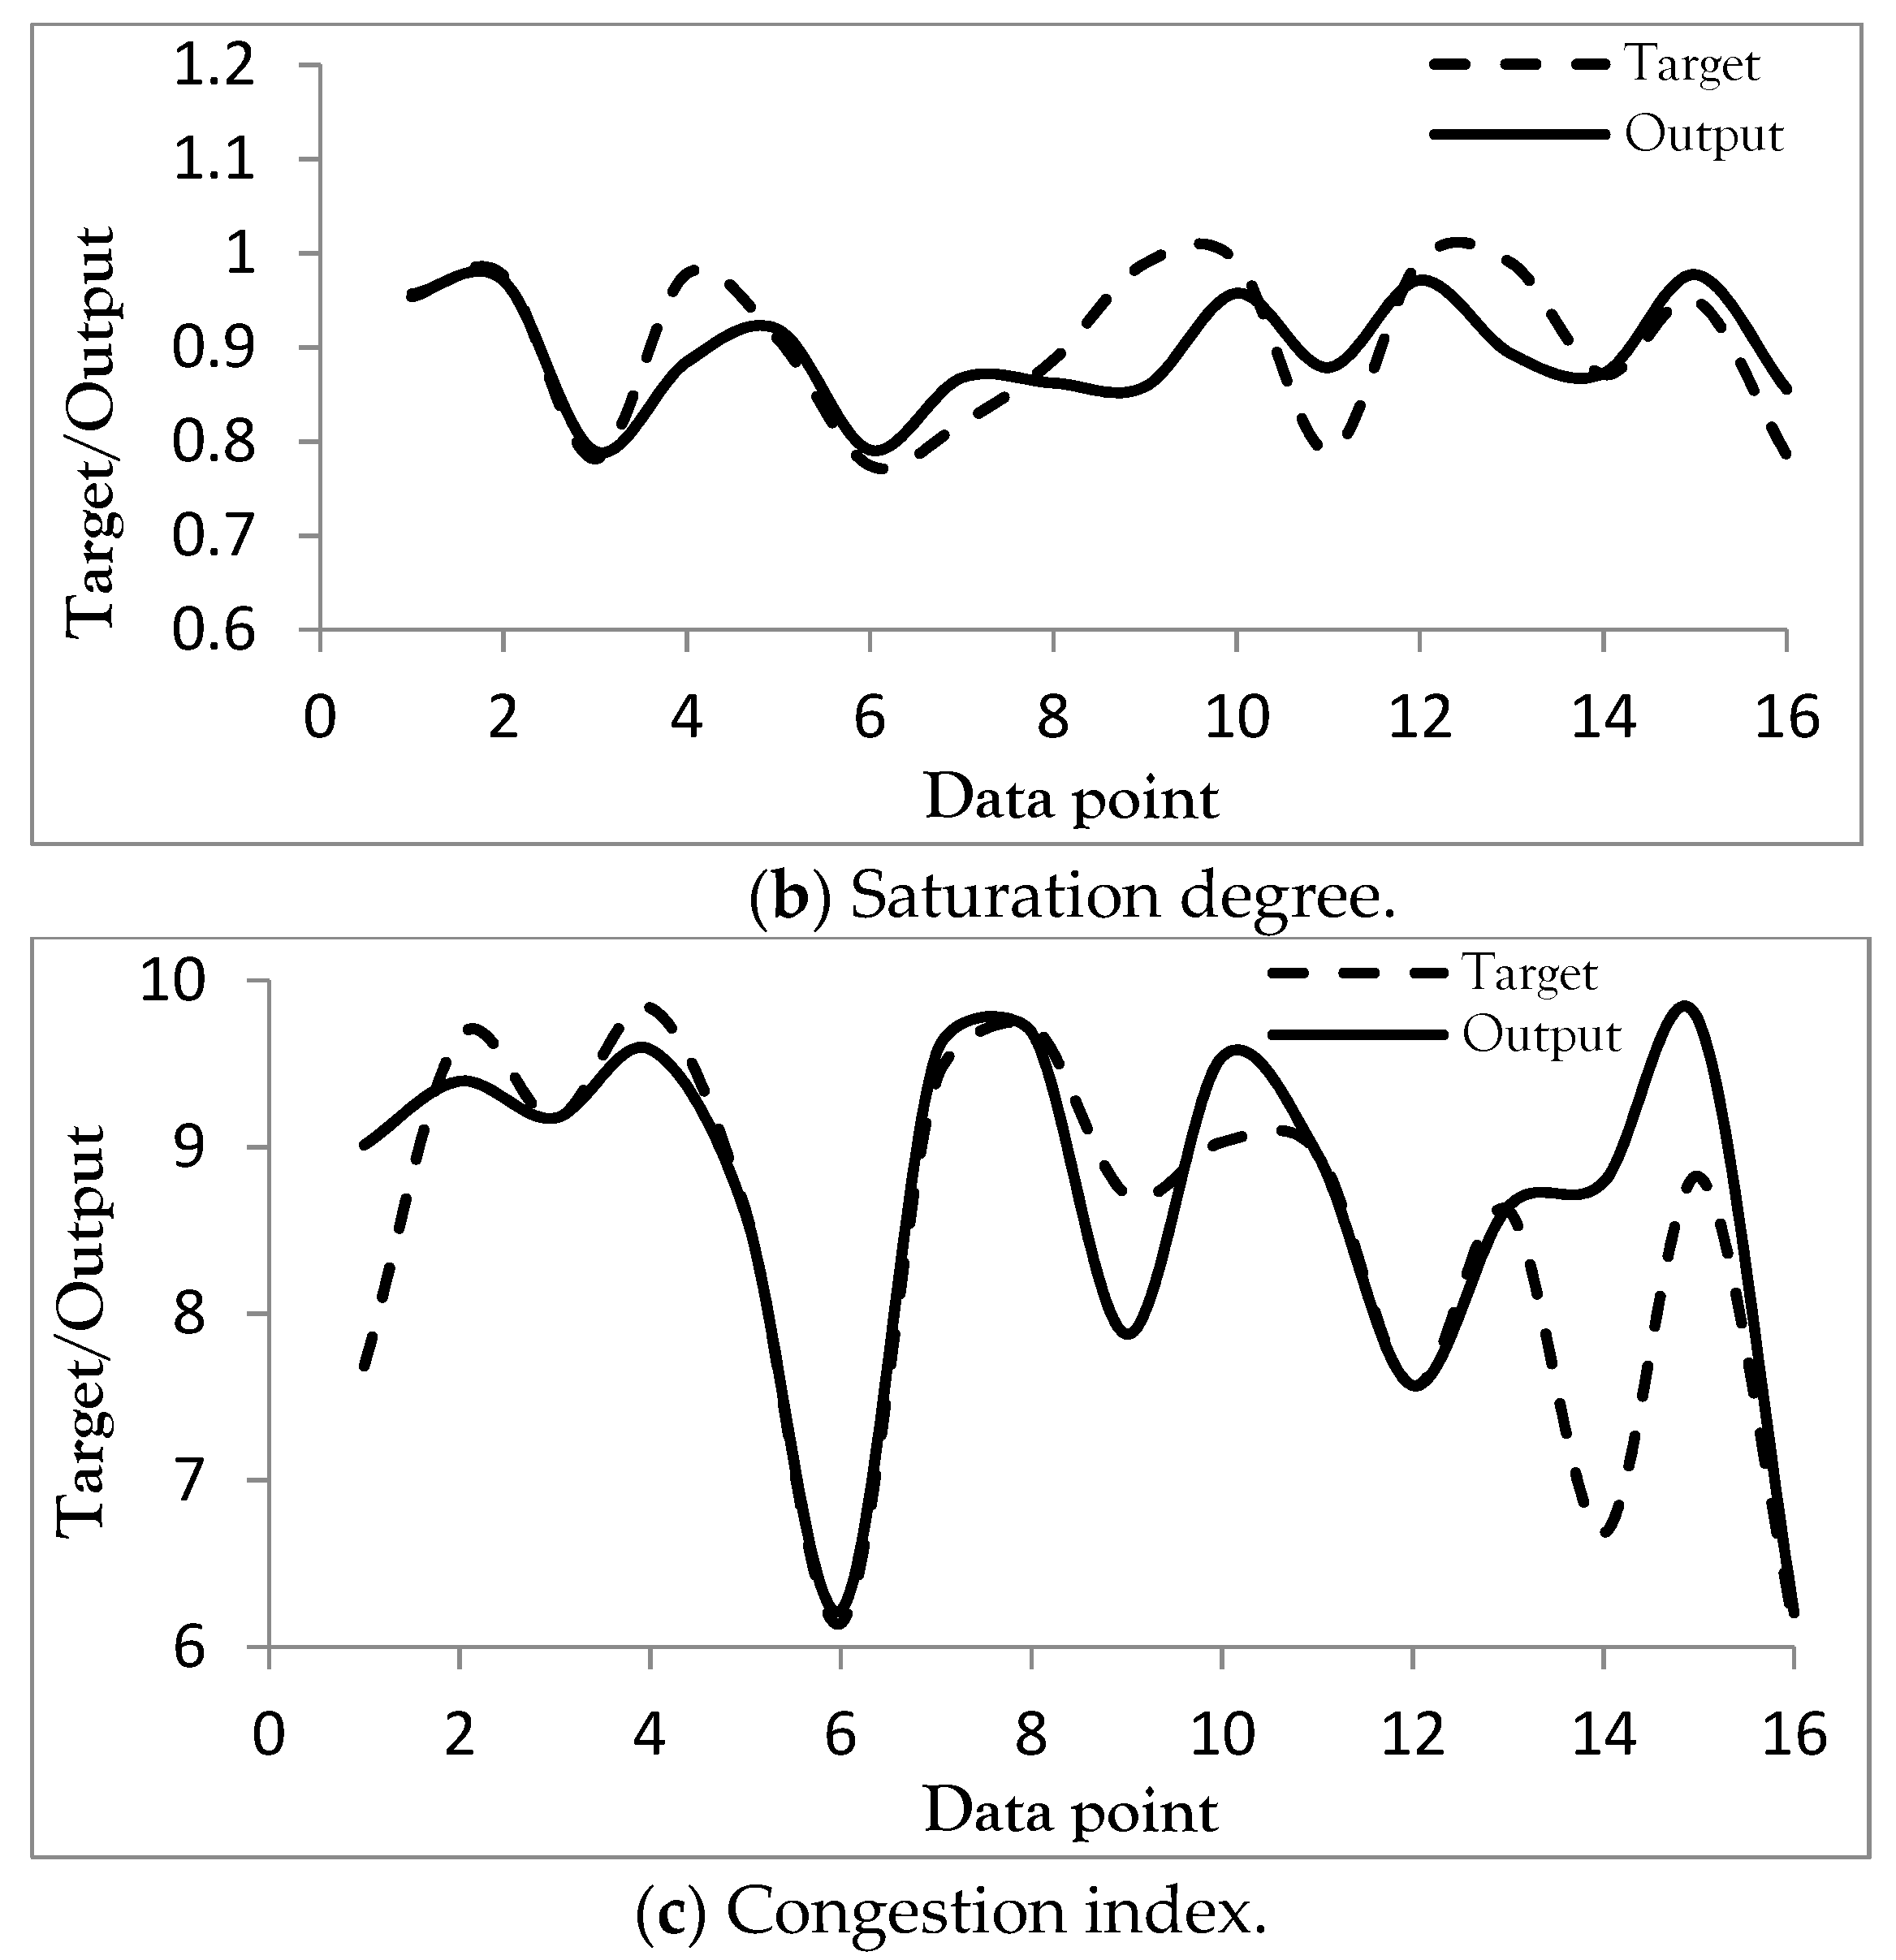
3.3. Model Simulation and Validation

The proposed model testing and simulation requires correlation and the use of the mean squared error (MSE), representing the error calculated from the network output and the targets for the assessment of the performance function of the network. The MSE is the performance function that measures the accuracy of the model’s prediction error, and it can control the extent of the correlation between the real and the forecast values, which is otherwise known as the Pearson Correlation Coefficient. In order to mitigate model over-fitting, a widely-used approach during the training of models of NN was adopted, in which the data are randomly split into three phases: training, validation and testing [55]. As such, the data were randomly divided into 70%, 15%, and 15% sets for the training, testing and validation, respectively, with a maximum of 1000 epochs. Figure 6 shows a custom view of the nftool fitting model adopted. Table 7 and Table 8 are the MSE, R and forecasting equations for the various algorithms used for the prediction. Figure 6 and Figure 7 show the accuracy of the regression plots for the Levenberg–Marquardt (LM) model, which fits better than other the algorithms, i.e., Bayesian Regularization (BR) and the Scaled Conjugate Gradient (SCG).

4. Discussion

The relationship between one or more predictor (input) variables and a response (output) variable is compared by regression models. The most widely-used evaluation metrics for this comparison are Pearson’s correlation coefficient and the mean squared error (MSE) [56]. The simulated output points of the experiment may or may not likely match the real ones due to the confounding random and calculation errors or selection biases. The MSE quantifies the square error equivalent to the prediction sums of the variances and square biases existing between the observed experimental data and the ground truth, as shown in Equation (4):
MSE = 1 n f = 1 n ( θ ^ ( f ) θ ( f ) ) 2 = σ θ ^ 2 ( [ θ ^ θ ] ) 2 = ( RMSE ) 2
in which θ ^ symbolizes the experimental prediction data, θ is the reference ground truth, RMSE is the acronym for root mean squared error, and E is the operator of the expected value.
The statistical reliability is determined by Pearson’s correlation coefficient (COR or R), which compensates for the agreement between the ground truth and the prediction defined in Equation (5). The correlation coefficient measures how well a model correlates by minimizing the error between the experimental observation and model’s predicted data; the value ranges between 0 (no goodness of fit) and 1 (perfect agreement) [57].
COR ( θ ^ , θ ) COV { θ ^ , θ } σ θ ^ σ θ = E [ ( σ θ ^ μ θ ^ ) ( σ θ μ θ ) ] σ θ ^ σ
in which COV is the covariance, σ represents the standard deviation, and μ stands for the expected value (mean).
Table 6 and Table 7 are evidence that LM provides a better approximation compared to the other two algorithms. Table 8 and Table 9 are the summaries of the NN output simulation with the normalized target forecast. Figure 8 and Figure 9 provide a comparison of the target network and the predicted output values of the traffic volume, saturation degree and congestion indices. The high regression values for the LM for the two cities ( R = 1.000 ) shows the suitability of the model and the better performance of LM ahead of BR and SCG [58].
Out of three algorithms for the (NFTOOL) fitting model used, LM performed better than BR and SCG both in terms of MSE and R. The high regression values for LM for the two cities ( R = 1.000 ) adjudges the suitability of the model and the better performance of LM ahead of BR and SCG. For instance, the model fitting for Kano produced LM’s MSE = 4.424 × 10 1 and R = 1.000, while a similar result was replicated in the modelling of the data collected from Lagos (LM’s MSE = 2.675 × 10 3 and R = 1.000). Furthermore, BR produced equally-minimal MSE values of 8.253 × 10 1 and 6.473 × 10 3 for Kano and Lagos, respectively; their various regressions are also within the range adjudged as a perfect model in the literature (R = 0.932 for Kano and 0.9312 for Lagos). Thirdly, the SCG algorithm fits the same way as the two previous algorithms; the MSEs for Kano and Lagos are 5.337 × 10 1 and 4.582 × 10 3 , while their R values are 0.928 and 0.909, respectively.
The regression analysis lent towards the empirical scalar response, and supported the optimization process for the prediction of the variables. For instance, the target moderate congestion was set at C i n d e x = 6 out of 10, in order to guarantee that the traffic facilities will function optimally during the model simulation (Wang et al., 2018). The LM algorithm forecasting equation for the congestion indices of Kano and Lagos cities are ( O u p u t = 1.0 T a r g e t + 0.47 ) and ( O u p u t = 1.0 T a r g e t + 0.022 ) , respectively. These equations are conditional upon good input parameters (i.e., to maximize the input from transport infrastructure, and to minimize both the traffic and demography) in order to deliver on the long-term goals of sustainability and resilience.
In this study, the COR or R values revealed a good assessment of the comparison between the prediction and the ground reference, indicating that the data exhibited linear structural prediction patterns. The visualization trends of the traffic and congestion simulations showed some random variations, which may depend on the cluster’s trip generation, infrastructure quality, and temporal dimensions. Although the three NN algorithms—LM, BR and SCG—are good congestion predictors, [59] argued that traffic congestion will continue to beset the developing countries’ cities due to poor investment in infrastructure. The economic losses and escalating environmental problems are major sources of worry.
The provision of infrastructure is arguably a temporary congestion relief, and often time will lead to a complicated result, as drivers are inevitably drawn to unregulated good road facilities, and may exacerbate congestion issues instead of ameliorating them. Researchers have questioned the factual assumptions underpinning infrastructure without a sustainable transport outlook [60,61]. As such, the maxim “You can’t build your way out of congestion” revealed a paradigm shift from the dilemma towards a two-way (infrastructure-cum-access control) congestion mitigation approach [62].
In order to attain the role of the de facto economy which is currently the hallmark of sustainable cities, a holistic policy on transport infrastructure investment and sustainable transport development must include public transport. Although Lagos, Abuja and Kano have pioneered Bus Rapid Transport (BRT) to a lesser extent, development policy needs to focus more on public transport facilities and services, and to prioritize non-motorized transport in order to resolve the current difficult situation.
In Figure 9 and Figure 10, the predicted values are moderately close to the target values, and could represent accurate predictions for the monitoring of the persistent congestion of the road traffic in Nigerian cities. The figures show that the model is very accurate in terms of calibration and prediction accuracy because the relative errors are small. The prediction, as demonstrated, is very useful for neural networks, such that a preprocessing of the real data is applied in order to predict the congestion rating as an indicator of transport service and infrastructure qualities. In both cities, the poorly-defined and complex areas of mobility resilience reveal substantial deficiencies in the complementary role of urban spatial dynamics, policy targets and benchmarks, traffic demand, public transit strategy, and low sustainability. In their various synoptic applications of ANN, researchers have observed that a multi-layer feed-forward back-propagation model provides a better fitting quality for traffic congestion, but lacks the capacity for a time series forecast in which a large pool of data is not available [63,64].

5. Conclusions

The research findings can be summarized as follows. The prediction model implemented in the input–output and curve fitting (NFTOOL) model of the neural network has successfully connected the congestion profiles of the two cities to their infrastructure, urban traffic regimes, and demography. The present work has applied novel deep-learning modeling techniques for transport resilience forecasting. The methodology has provided a ‘smart’ means for traffic and transport-related analytics and prediction. The model offers novel approach to the prediction of the traffic and congestion profiles of cities in real-time, and with quality and precision. The model, above all, provides a persistent learning process by constantly upgrading the input variables, thus providing a larger database to properly train and test the ANNs so that accurate predictions can be created in the future.
In the survey of the two most populous Nigerian cities (Kano and Lagos), the congestion indices are higher than the threshold for ‘moderate’ congestion ( C index = 6 ) suggested in the literature (Table 5). The capacities of the road facilities are overstretched by the ‘extreme’ traffic situations with target and output counts greater than 2000 vehicles per hour, as suggested in the design manual from which the roads were constructed. These results are evidence of many multifaceted and multi-dimensional cycles of failures. Nigerian cities, like many developing countries, are riddled with incomplete transport infrastructures, low quality portfolios of construction, unsafe urban sprawls, and a lack of effective planning and control policies. Other issues include political interference, financial corruption, and bureaucratic bottlenecks.
Whilst most cities are assuming the role of the de facto country’s economy, urban transport, especially in the generation of the rapidly-evolving mega-cities of developing countries, require smart transport systems for effective mobility and congestion control. This is necessary, especially in the face of the prevalent public health and safety risks, environmental pollution, and socioeconomic losses due to congestion problems. The implementation of the intelligent technology and deep learning techniques carried out in this research would contribute to the academic discourse on urban transport resilience and, importantly, ensure that urbanization goes in tandem with equity, social and economic inclusion, and environmental stewardship.
Transport systems and their associated infrastructures are vital to both the growth and prosperity of modern societies. Risk, uncertainties, and perturbations have cascaded the capacity and boundaries of the resilience and survival of transport systems in developing countries due to population growth, urbanization, and sprawling settlements, not least around urban fringes. An increased emphasis on network throughput and resilience would not only reduce the economic maladies of congestion, but would also boost safety, accessibility, and critical cyber-physical asset protection.
The consequences of urban growth and spatial inequality have resulted in several unbelievable and ‘unsustainable’ cities with little capacity to muffle or resist any known and unknown systemic problems. In order to address current and future challenges, this study recommends a policy reorientation through the enhancement of public transport facilities and the strengthening of the drive for sustainable transport development. In addition to this, future studies need to explore the temporal and economic dimensions of traffic congestion with inputs that aggregate big data for predictive real-time analytics and retrospective insights.

Author Contributions

Conceptualization, S.H.O., D.V.L.H. and I.J.; methodology, S.H.O.; software, S.H.O.; validation, S.H.O.; formal analysis, S.H.O.; investigation, S.H.O.; resources, S.H.O., D.V.L.H. and I.J.; data curation, S.H.O., D.V.L.H. and I.J.; writing—original draft preparation, S.H.O.; writing—review and editing, D.V.L.H. and I.J.; visualization, S.H.O.; supervision, D.V.L.H. and I.J.; project administration, S.H.O., D.V.L.H. and I.J.; funding acquisition, S.H.O., D.V.L.H. and I.J. All authors have read and agreed to the published version of the manuscript.

Funding

This research was funded by the Petroleum Trust Development Fund (PTDF), Nigeria (https://ptdf.gov.ng/), which sponsored the doctoral study fellowship of Suleiman Hassan Otuoze. The APC was funded by the UK Engineering and Physical Sciences Research Council (EPSRC) under grant EP/J017698/1 (Transforming the Engineering of Cities to Deliver Societal and Planetary Wellbeing) for Dexter V.L. Hunt.

Institutional Review Board Statement

Not applicable.

Informed Consent Statement

Not applicable.

Data Availability Statement

Data sharing not applicable.

Acknowledgments

The authors would like to thank the staff and management of the University of Birmingham, United Kingdom, for their various support during the fellowship experience. Furthermore, we wish to show our appreciation of the management of Ahmadu Bello University for granting study leave for Suleiman Hassan Otuoze.

Conflicts of Interest

The authors declare no conflict of interest.

References

  1. Nogal, M.; O’Connor, A.; Caulfield, B.; Martinez-Pastor, B. Resilience of traffic networks: From perturbation to recovery via a dynamic restricted equilibrium model. Reliab. Eng. Syst. Saf. 2016, 156, 84–96. [Google Scholar] [CrossRef]
  2. Folke, C.; Jansson, Å.; Rockström, J.; Olsson, P.; Carpenter, S.R.; Chapin, F.S.; Crépin, A.-S.; Daily, G.; Danell, K.; Ebbesson, J.; et al. Reconnecting to the Biosphere. Ambio 2011, 40, 719. [Google Scholar] [CrossRef] [PubMed] [Green Version]
  3. Cox, A.; Prager, F.; Rose, A. Transportation security and the role of resilience: A foundation for operational metrics. Transp. Policy 2011, 18, 307–317. [Google Scholar] [CrossRef]
  4. Barrett, B.; Ran, B.; Pillai, R. Developing a Dynamic Traffic Management Modeling Framework for Hurricane Evacuation. Transp. Res. Rec. J. Transp. Res. Board 2000, 1733, 115–121. [Google Scholar] [CrossRef]
  5. Moving Frontiers in Population Forecasting and Aging: Sergei Scherbov 65. Annotated Reprints of Key Publications. Available online: http://pure.iiasa.ac.at/id/eprint/14782/ (accessed on 1 May 2020).
  6. Williams, B.M. Multivariate Vehicular Traffic Flow Prediction: Evaluation of ARIMAX Modeling. Transp. Res. Rec. 2001, 1776, 194–200. [Google Scholar] [CrossRef]
  7. Zhong, M.; Sharma, S.; Lingras, P. Short-Term Traffic Prediction on Different Types of Roads with Genetically Designed Regression and Time Delay Neural Network Models. J. Comput. Civ. Eng 2005, 19, 94–103. [Google Scholar] [CrossRef] [Green Version]
  8. Blockley, D.; Agarwal, J.; Godfrey, P. Infrastructure resilience for high-impact low-chance risks. Proc. Inst. Civ. Eng. Civ. Eng. 2012, 165, 13–19. [Google Scholar] [CrossRef]
  9. McDaniels, T.; Chang, S.; Cole, D.; Mikawoz, J.; Longstaff, H. Fostering resilience to extreme events within infrastructure systems: Characterizing decision contexts for mitigation and adaptation. Glob. Environ. Chang. 2008, 18, 310–318. [Google Scholar] [CrossRef]
  10. Juan-García, P.; Butler, D.; Comas, J.; Darch, G.; Sweetapple, C.; Thornton, A.; Corominas, L. Resilience theory incorporated into urban wastewater systems management. State of the art. Water Res. 2017, 115, 149–161. [Google Scholar] [CrossRef] [Green Version]
  11. Oses, U.; Rojí, E.; Gurrutxaga, I.; Larrauri, M. A multidisciplinary sustainability index to assess transport in urban areas: A case study of Donostia-San Sebastian, Spain. J. Environ. Plan. Manag. 2017, 60, 1891–1922. [Google Scholar] [CrossRef]
  12. Otuoze, S.H.; Hunt, D.V.L.; Jefferson, I. Predictive Modeling of Transport Infrastructure Space for Urban Growth Phenomena in Developing Countries’ Cities: A Case Study of Kano—Nigeria. Sustainability 2021, 13, 308. [Google Scholar] [CrossRef]
  13. Han, J.; Hayashi, Y.; Cao, X.; Imura, H. Application of an integrated system dynamics and cellular automata model for urban growth assessment: A case study of Shanghai, China. Landsc. Urban Plan. 2009, 91, 133–141. [Google Scholar] [CrossRef]
  14. Momeni, E.; Nazir, R.; Armaghani, D.J.; Maizir, H. Prediction of pile bearing capacity using a hybrid genetic algorithm-based ANN. Measurement 2014, 57, 122–131. [Google Scholar] [CrossRef]
  15. Groumpos, P.P. Fuzzy Cognitive Maps: Basic Theories and Their Application to Complex Systems. In Fuzzy Cognitive Maps; Springer: Berlin/Heidelberg, Germany, 2010; pp. 1–22. [Google Scholar]
  16. Jang, J.-S.R. ANFIS: Adaptive-network-based fuzzy inference system. IEEE Trans. Syst. Man Cybern. 1993, 23, 665–685. [Google Scholar] [CrossRef]
  17. McCall, J. Genetic algorithms for modelling and optimisation. J. Comput. Appl. Math. 2005, 184, 205–222. [Google Scholar] [CrossRef]
  18. Population Prospects: The 2015 Revision, Methodology of the United Nations Department of Economic and Social Affairs Population Division (UN DESA-PD. Available online: https://esa.un.org/unpd/wpp/publications/Files/WPP2015_Methodology.pdf (accessed on 3 August 2020).
  19. World Economic Forum (WEF). The Global Enabling Trade Report: A joint publication of the World Economic Forum and the Global Alliance for Trade Facilitation; World Economic Forum: Cologny, Switzerland, 2016. [Google Scholar]
  20. Afrin, T.; Yodo, N. A Survey of Road Traffic Congestion Measures towards a Sustainable and Resilient Transportation System. Sustainability 2020, 12, 4660. [Google Scholar] [CrossRef]
  21. Belokurov, V.; Spodarev, R.; Belokurov, S. Determining passenger traffic as important factor in urban public transport system. Transp. Res. Procedia 2020, 50, 52–58. [Google Scholar] [CrossRef]
  22. Salau, T. Public transportation in metropolitan Lagos, Nigeria: Analysis of public transport users’ socioeconomic characteristics. Urban Plan. Transp. Res. 2015, 3, 132–139. [Google Scholar] [CrossRef]
  23. The Economic Cost and Policy Implications of Heavy Goods Vehicles Road Traffic Accidents in Nigeria. Available online: http://eprints.hud.ac.uk/id/eprint/34524 (accessed on 15 January 2021).
  24. Olagunju, K. Articulated lorries management in nigeria: Road safety perspective. In Road Safety Forum Organised by the International Road Safety Organisation on 6th May 2011 at Ladi Kwali Hall, Sheraton Hotel and Towers, Abuja; Nigeria Ltd.: Abuja, Nigeria, 2011. [Google Scholar]
  25. Dulebenets, M.A. An Adaptive Island Evolutionary Algorithm for the berth scheduling problem. Memetic Comput. 2020, 12, 51–72. [Google Scholar] [CrossRef]
  26. Pasha, J.; Dulebenets, M.A.; Kavoosi, M.; Abioye, O.F.; Theophilus, O.; Wang, H.; Kampmann, R.; Guo, W. Holistic tactical-level planning in liner shipping: An exact optimization approach. J. Shipp. Trade 2020, 5, 8. [Google Scholar] [CrossRef]
  27. Kağan Albayrak, M.B.; Özcan, I. Çağrı; Can, R.; Dobruszkes, F. The determinants of air passenger traffic at Turkish airports. J. Air Transp. Manag. 2020, 86, 101818. [Google Scholar] [CrossRef]
  28. Enoch, M.P.; Cross, R.; Potter, N.; Davidson, C.; Taylor, S.; Brown, R.; Huang, H.; Parsons, J.; Tucker, S.; Wynne, E.; et al. Future local passenger transport system scenarios and implications for policy and practice. Transp. Policy 2020, 90, 52–67. [Google Scholar] [CrossRef]
  29. Knoop, V.L.; Van Lint, H.; Hoogendoorn, S.P. Traffic dynamics: Its impact on the Macroscopic Fundamental Diagram. Phys. A Stat. Mech. Appl. 2015, 438, 236–250. [Google Scholar] [CrossRef]
  30. Reed, D.A.; Kapur, K.C.; Christie, R.D. Methodology for Assessing the Resilience of Networked Infrastructure. IEEE Syst. J. 2009, 3, 174–180. [Google Scholar] [CrossRef]
  31. Aftabuzzaman, M. Measuring traffic congestion-a critical review. In 30th Australasian Transport Research Forum; ETM GROUP: London, UK, 2007. [Google Scholar]
  32. Holling, C.S. Understanding the Complexity of Economic, Ecological, and Social Systems. Ecosystems 2001, 4, 390–405. [Google Scholar] [CrossRef]
  33. Praks, P.; Kopustinskas, V.; Masera, M. Monte-Carlo-based reliability and vulnerability assessment of a natural gas transmission system due to random network component failures. Sustain. Resilient Infrastruct. 2017, 2, 97–107. [Google Scholar] [CrossRef]
  34. Mansouri, M.; Nilchiani, R.; Mostashari, A. A policy making framework for resilient port infrastructure systems. Mar. Policy 2010, 34, 1125–1134. [Google Scholar] [CrossRef]
  35. Comfort, L.K.; Haase, T.W. Communication, Coherence, and Collective Action:The Impact of Hurricane Katrina on Communications Infrastructure. Public Work. Manag. Policy 2006, 10, 328–343. [Google Scholar] [CrossRef]
  36. Bruneau, M.; Chang, S.E.; Eguchi, R.T.; Lee, G.C.; O’Rourke, T.D.; Reinhorn, A.M.; Shinozuka, M.; Tierney, K.; Wallace, W.A.; von Winterfeldt, D. A Framework to Quantitatively Assess and Enhance the Seismic Resilience of Communities. Earthq. Spectra 2003, 19, 733–752. [Google Scholar] [CrossRef] [Green Version]
  37. Black, C.S.; Schreffler, E.N. Understanding Transport Demand Management and Its Role in Delivery of Sustainable Urban Transport. Transp. Res. Rec. 2010, 2163, 81–88. [Google Scholar] [CrossRef]
  38. Carreno, M.L.; Cardona, O.D.; Barbat, A.H. A disaster risk management performance index. Nat. Hazards 2007, 41, 1–20. [Google Scholar] [CrossRef]
  39. Liu, Z.; Liu, Y.; Meng, Q.; Cheng, Q. A tailored machine learning approach for urban transport network flow estimation. Transp. Res. Part C Emerg. Technol. 2019, 108, 130–150. [Google Scholar] [CrossRef]
  40. Tahmassebi, A.; Gandomi, A.H.; Fong, S.; Meyer-Baese, A.; Foo, S.Y. Multi-stage optimization of a deep model: A case study on ground motion modeling. PLoS ONE 2018, 13, e0203829. [Google Scholar] [CrossRef] [PubMed] [Green Version]
  41. Gokmen, T.; Vlasov, Y. Acceleration of Deep Neural Network Training with Resistive Cross-Point Devices: Design Considerations. Front. Neurosci. 2016, 10, 333. [Google Scholar] [CrossRef] [Green Version]
  42. Abduljabbar, R.; Dia, H.; Liyanage, S.; Bagloee, S.A. Applications of Artificial Intelligence in Transport: An Overview. Sustainability 2019, 11, 189. [Google Scholar] [CrossRef] [Green Version]
  43. Mattsson, L.-G.; Jenelius, E. Vulnerability and resilience of transport systems—A discussion of recent research. Transp. Res. Part A Policy Pr. 2015, 81, 16–34. [Google Scholar] [CrossRef]
  44. Federal Republic of Nigeria 2006 Population and Housing Census, Priority Tables Vol. VII Population Distribution by Age, Sex, and Educational Attainment, State and Local Government Area. Available online: http://www.population.gov.ng/images/Vol%2003%20Table%20DSx%20LGAPop%20by%20SDistrict-PDF.pdf (accessed on 24 August 2019).
  45. KNSMLPP. Transport Map. 2018. Available online: https://www.ksblm.com.ng (accessed on 12 December 2018).
  46. LASMT. Road Statistics. 2018. Available online: https://transportation.lagosstate.gov.ng/responsibilities-2/ (accessed on 13 December 2018).
  47. Highway Capacity Manual, Transportation Research Board National Research Council. Available online: http://worldcat.org/issn/07386826 (accessed on 12 December 2019).
  48. Oyedepo, O.S.; Saadu, A.A. Evaluation and analysis of noise levels in Ilorin metropolis, Nigeria. Environ. Monit. Assess. 2009, 160, 563. [Google Scholar] [CrossRef] [Green Version]
  49. Wang, W.-X.; Guo, R.-J.; Yu, J. Research on road traffic congestion index based on comprehensive parameters: Taking Dalian city as an example. Adv. Mech. Eng. 2018, 10, 1687814018781482. [Google Scholar] [CrossRef] [Green Version]
  50. Das, P.; Parida, M.; Katiyar, V.K. Analysis of interrelationship between pedestrian flow parameters using artificial neural network. J. Mod. Transp. 2015, 23, 298–309. [Google Scholar] [CrossRef] [Green Version]
  51. Boussaada, Z.; Curea, O.; Remaci, A.; Camblong, H.; Mrabet, N.B. A Nonlinear Autoregressive Exogenous (NARX) Neural Network Model for the Prediction of the Daily Direct Solar Radiation. Energies 2018, 11, 620. [Google Scholar] [CrossRef] [Green Version]
  52. Islam, S.; Kabir, M.M.; Kabir, N. Artificial Neural Networks based Prediction of Insolation on Horizontal Surfaces for Bangladesh. Procedia Technol. 2013, 10, 482–491. [Google Scholar] [CrossRef] [Green Version]
  53. Silva, N.; Ferreira, L.M.D.; Silva, C.; Magalhães, V.; Neto, P. Improving Supply Chain Visibility With Artificial Neural Networks. Procedia Manuf. 2017, 11, 2083–2090. [Google Scholar] [CrossRef]
  54. Michael, K.; Garcia-Souto, M.; Dabnichki, P. An investigation of the suitability of Artificial Neural Networks for the prediction of core and local skin temperatures when trained with a large and gender-balanced database. Appl. Soft Comput. 2017, 50, 327–343. [Google Scholar] [CrossRef] [Green Version]
  55. Katić, K.; Li, R.; Verhaart, J.; Zeiler, W. Neural network based predictive control of personalized heating systems. Energy Build. 2018, 174, 199–213. [Google Scholar] [CrossRef]
  56. Wei, J.; Chen, T.; Liu, G.; Yang, J. Higher-order Multivariable Polynomial Regression to Estimate Human Affective States. Sci. Rep. 2016, 6, 23384. [Google Scholar] [CrossRef] [PubMed] [Green Version]
  57. Gunes, H.; Schuller, B. Categorical and dimensional affect analysis in continuous input: Current trends and future directions. Image Vis. Comput. 2013, 31, 120–136. [Google Scholar] [CrossRef]
  58. Liping, C.; YuJun, S.; Saeed, S. Monitoring and predicting land use and land cover changes using remote sensing and GIS techniques—A case study of a hilly area, Jiangle, China. PLoS ONE 2018, 13, e0200493. [Google Scholar] [CrossRef]
  59. Fusing Heterogeneous Traffic Data by Kalman Filters and Gaussian Mixture Models. Available online: https://trid.trb.org/view/1349229 (accessed on 26 January 2021).
  60. Duranton, G.; Turner, M.A. The Fundamental Law of Road Congestion: Evidence from US Cities. Am. Econ. Rev. 2011, 101, 2616–2652. [Google Scholar] [CrossRef] [Green Version]
  61. White, C. The conditions of practical action: Neoliberalism and sustainability in the Australian road construction industry. Environ. Plan C Gov. Policy 2016, 34, 1501–1515. [Google Scholar] [CrossRef]
  62. Metz, D. Developing Policy for Urban Autonomous Vehicles: Impact on Congestion. Urban Sci. 2018, 2, 33. [Google Scholar] [CrossRef] [Green Version]
  63. Ata, A.; Khan, M.A.; Abbas, S.; Ahmad, G.; Fatima, A. Modelling smart road traffic congestion control system using machine learning techniques. Neural Netw. World 2019, 29, 99–110. [Google Scholar] [CrossRef] [Green Version]
  64. Pushpi, R.; Shaw, K. Artificial Neural Networks approach induced by fuzzy logic for traffic. J. Eng. Technol. 2018, 1, 15. [Google Scholar] [CrossRef]
Figure 1. Digitized map of the transport infrastructure of Kano metropolis.
Sustainability 13 01371 g001
Figure 2. Digitized map of the transport infrastructure of Lagos metropolis.
Sustainability 13 01371 g002
Figure 3. Structure of the ANN model.
Sustainability 13 01371 g003
Figure 4. Typical architecture of the ANN model.
Sustainability 13 01371 g004
Figure 5. Methodological scheme of traffic and congestion prediction.
Sustainability 13 01371 g005
Figure 6. Custom view of the nftool fitting model.
Sustainability 13 01371 g006
Figure 7. NN parameters for the LM algorithm for the Kano network.
Sustainability 13 01371 g007
Figure 8. NN parameters for the LM algorithm for the Lagos network.
Sustainability 13 01371 g008aSustainability 13 01371 g008b
Figure 9. Comparison of the measured target and the output traffic parameters for Kano city.
Sustainability 13 01371 g009aSustainability 13 01371 g009b
Figure 10. Comparison of the measured target and output traffic parameters for Lagos city.
Sustainability 13 01371 g010aSustainability 13 01371 g010b
Table 1. Demography, traffic parameters and transport infrastructure inventory of Kano city.
Cluster Identity* MSA
Council Area
1Nnpc,20062Nest,20183Zarea
(km2)
4Nroad5Lroad est.
(km)
6Lrail est
(km)
7Typical Route
Traffic Vol. (Veh/hr)
KN1Dala418,777613,34619296221.420.003505
KN2Fagge198,828293,03721209218.8021.354937
KN3Gwale362,059524,05518353252.620.002931
KN4Kano municipal365,525543,74617461284.226.593820
KN5Kumbotso295,979431,185158541594.617.193563
KN6Nasarawa596,669873,53134223188.820.303355
KN7Tarauni221,367324,94228399249.862.884535
KN8Ungogo369,657535,63820412131052.790.002751
Total2,828,8614,139,4804993695306338
* Metropolitan Statistical Area (MSA) constituting Kano city = 8 LGA’s; 1Nnpc,2006: cluster population demography of Kano metropolitan city based on the National Population Census (NPC [44]); 2Nest,2018: cluster population, 2018, estimate of Kano metropolitan city based on NPC, 2006 (Author, 2018); 3Zarea: land area courtesy of Kano State Ministry of Land and Physical Planning (KNSMLPP [45]); 4Nroad: cluster total number of roads (KNSMLPP [45]); 5Lroad est.: estimated total length of all roads within the cluster (KNSMLPP [45]); 6Lrail est: estimated total length of all rails within the cluster (KNSMLPP [45]); 7 traffic volume (KNSMLPP [45]).
Table 2. Demography, traffic parameters, and transport infrastructure inventory of Kano city.
Cluster Identity* MSA
Council Area
1Nnpc,20062Nest,20183Zarea
(km2)
4Nroad5Lroad est.
(km)
6Lrail est
(km)
7Typical Route
Traffic vol. (Veh/hr)
LA1Agege459,939669,57417.01096310.352.514604
LA2Ajeromi-Ifelodun684,105996,62113.9471161.190.003388
L A3Alimosho1,277,7141,913,429137.8893523.800.003952
LA 4Amuwo-Odofin318,166476,988179.1120302.870.003518
LA 5Apapa217,362323,36238.5202129.810.004495
LA 6Eti-osa287,785411,495299.1291187.510.002685
LA 7Ifako-Ijaye427,878620,19043.0133148.126.733929
LA 8Ikeja313,196460,56249.92430316.460.004513
LA 9Kosofe665,393990,09384.4188210.411.043953
LA10Lagos Island209,437308,4109.3311208.350.863170
LA11Lagos Mainland317,720473,72419.2324207.5910.914255
LA12Mushin633,009916,17614.1938351.603.893174
LA13Ojo598,071883,324182.0242383.580.004115
LA14Oshodi-Isolo621,509912,17442.01056362.331.653496
LA15Shomolu402,673585,23214.61077386.260.843820
LA16Surulere503,975729,17127.1507199.845.165275
Total9,013,53411,670,5251171.0282794390.0733.59
* Metropolitan Statistical Area (MSA) constituting Lagos city = 16 LGA’s; 1Nnpc,2006: cluster population demography of Lagos metropolitan city based on the National Population Census (NPC [44]); 2Nest,2018: cluster population, 2018, estimate of Lagos metropolitan city based on NPC, 2006 (Author, 2018); 3Zarea: land area courtesy of Lagos State Ministry of Transport (LASMT [46]); 4Nroad: cluster total number of roads (LASMT [46]); 5Lroad est.: estimated total length of all roads within the cluster (LASMT [46]); 6Lrail est: estimated total length of all rails within the cluster (LASMT [46]); 7 traffic volume (LASMT [46]).
Table 3. Input and target data for the neural network analysis based on the traffic characteristics of Kano city.
Cluster No x 1 x 2 x 3 x 4 x 5 x 6 x = x 7 ( C i n d e x ) = x 8 Congestion Level Based on [49]
KN1613,346221.4232,2810.361029621031.0510Extreme
KN2293,037218.8013,9540.746720929621.4810Extreme
KN3524,055252.6229,1140.482035317590.887.7Moderate
KN4543,746284.2231,9850.522746122921.1510Extreme
KN5431,185594.6127291.379054121381.0710Extreme
KN6873,531188.8225,6920.216222320131.0110Extreme
KN7324,942249.8611,6050.768939927211.3610Extreme
KN8535,6381052.7926261.9655121316510.837.1Moderate
x 1 = population estimate for 2018; x 2 = total road length (km.); x 3 = population density (persons/sq.km.); x 4 = road per population (km./1000persons); x 5 = number of roads; x 6 = traffic volume (veh./hr.); x 7 = saturation degree x (ratio); x 8 = congestion index ( C i n d e x ).
Table 4. Input and target data for the neural network analysis based on the traffic characteristics of Kano city.
Cluster No x 1 x 2 x 3 x 4 x 5 x 6 x = x 7 ( C i n d e x ) = x 8 Congestio Level Based on [49]
LA1669,574310.3539,3870.4635109646042.3010Extreme
LA2996,621161.1971,7000.161747133881.6910Extreme
L A31,913,429523.8013,8860.273789339521.9810Extreme
LA 4476,988302.8726640.63512035181.7610Extreme
LA 5323,362129.8184000.401420244952.2510Extreme
LA 6411,495187.5113760.455729126851.3410Extreme
LA 7620,190148.1214,4240.238813339291.9610Extreme
LA 8460,562316.4692270.687143045132.2610Extreme
LA 9990,093210.4111,7310.212518839531.9810Extreme
LA10308,410208.3533,1630.675631131701.5810Extreme
LA11473,724207.5924,6740.438232442552.1310Extreme
LA12916,176351.6064,9780.383893831741.5910Extreme
LA13883,324383.5848540.434224241152.0610Extreme
LA14912,174362.3321,7190.3972105634961.7510Extreme
LA15585,232386.2640,0850.66107746041.9110Extreme
LA16729,171199.8426,9070.274150733882.6410Extreme
x 1 = population estimate for 2018; x 2 = total road length (km.); x 3 = population density (persons/sq.km.); x 4 = road per population (km./1000persons); x 5 = number of roads; x 6 = traffic volume (veh./hr.); x 7 = saturation degree x (ratio); x 8 = congestion index ( C i n d e x ).
Table 5. Target data to train the desired network output (Kano and Lagos).
Training TargetsRange of Values
Moderate congestion profile ( C i n d e x ) (Wang et al. [49]) t 1 :   6.0 C i n d e x 10.0 )
Moderate saturation index ( x ) (Wang et al. [49]): t 2 : ( 0.75 x 1.0 )
Moderated traffic volume ( v ) (Highway Capacity Manual [47]) t 3 ): ( 1200 v 2000   v e h / h r )
Example of random number generator command prompt for Lagos traffic
Saturation degree ( x ) ; ( n = Number   of   MSA = 16   ( L a g o s )   &   8   ( K a n o )
>> x m i n = 0.75
>> x m a x = 1.00
>> n = 16
>> x = x m i n + r a n d ( 1 , n ) ( x m a x x m i n )
Table 6. Performance evaluation of the NN Resilience model for Kano.
AlgorithmMSERForecasting Equation
Levenberg-Marquardt (LM)4.424 × 10 1 1.000 O u p u t = 1.0 T a r g e t + 0.47
Bayesian Regularization (BR)8.253 × 10 1 0.932 O u p u t = 0.99 T a r g e t + 0.02
Scaled Conjugate Gradient (SCG)5.337 × 10 1 0.928 O u p u t = 1.1 T a r g e t 0.35
Table 7. Performance evaluation of the NN Resilience model for Lagos.
AlgorithmMSERForecasting Equation
Levenberg-Marquardt (LM)2.675 × 10 3 1.000 O u p u t = 1.0 T a r g e t + 0.022
Bayesian Regularization (BR)6.473 × 10 3 0.9312 O u p u t = 0.98 T a r g e t + 0.078
Scaled Conjugate Gradient (SCG)4.582 × 10 3 0.9085 O u p u t = 0.99 T a r g e t + 0.027
Table 8. NN summary of the measured targets and the predicted output (Kano city).
Cluster NumberTraffic VolumeTraffic Saturation DegreeCongestion Index
Target (Veh/hr)Output
(Veh/hr)
Error
(%)
TargetOutputError
(%)
TargetOutputError
(%)
11243.41313.25.320.86680.7997−8.396.71046.73030.30
21341.71960.531.560.91200.93202.157.59448.32718.80
31730.21786.43.150.75630.78213.306.53576.4308−1.63
41464.71430.9−2.360.96060.8361−14.896.12366.825310.28
51918.81917.8−0.050.88980.8551−4.069.75668.6291−13.07
61294.51330.22.680.96350.7874−22.367.20526.4732−11.31
71990.71982.9−0.390.83700.91798.817.18217.51284.40
81632.01632.80.050.86150.7568−13.837.33176.5056−12.70
Table 9. NN summary of the measured targets and the predicted output (Lagos city).
Cluster
Number
Traffic VolumeTraffic Saturation DegreeCongestion Index
Target (Veh/hr)Output
(Veh/hr)
Error
(%)
TargetOutputError
(%)
TargetOutputError
(%)
11421.51410.8−0.760.95370.95670.317.68709.013214.71
21236.91236.90.000.97640.9708−0.589.66299.3970−2.83
31277.71277.6−0.010.78170.78971.019.16889.17560.07
41858.81858.7−0.010.97830.8846−10.599.83809.5884−2.60
51755.91755.90.000.90810.91891.188.62308.5991−0.28
61453.71453.80.010.77440.79092.096.14286.22081.25
71960.21960.1−0.010.81960.86765.539.39659.56141.72
81227.61227.70.010.88670.8623−2.839.7369.6918−0.46
91551.01547.2−0.250.98940.8583−15.278.71497.8775−10.63
101505.21505.0−0.010.99120.9576−3.519.03109.54355.37
111812.41812.40.000.78940.878710.168.97258.9573−0.17
121836.21836.20.000.99260.9715−2.177.56897.57060.02
131349.51349.50.000.98930.8929−10.808.62198.64300.24
141591.81490.5−6.800.87130.87230.116.68478.790123.95
151556.51581.61.590.95010.97732.788.82429.75599.55
161717.11717.10.000.78550.85558.186.12736.20601.27
Publisher’s Note: MDPI stays neutral with regard to jurisdictional claims in published maps and institutional affiliations.

