Analytical Determination of the Optimal Feed Temperature for Hydrogen Peroxide Decomposition Process Occurring in Bioreactor with a Fixed-Bed of Commercial Catalase

Department of Chemical and Biochemical Engineering, UTP University of Science and Technology, 3 Seminaryjna Street, 85-326 Bydgoszcz, Poland
Catalysts 2021, 11(1), 35; https://doi.org/10.3390/catal11010035
Submission received: 9 November 2020
/
Revised: 20 December 2020
/
Accepted: 29 December 2020
/
Published: 30 December 2020
(This article belongs to the Special Issue Enzyme Bioreactor Design)
Abstract
:The hydrogen peroxide-immobilized commercial catalase system was chosen to estimate the optimal feed temperature (OFT) for fixed-bed reactor (FXBR). This feed temperature was obtained based on analytical solution by maximizing the time-averaged substrate conversion under a constant feed flow rate and temperature constraints. In calculations a set of partial differential equations describing the conservation equation for fixed-bed reactor, assuming plug flow and kinetic equation for the rate of enzyme parallel deactivation was taken into account. The model is based on kinetic, and mass-transfer parameters estimated previously in a real decomposition process of hydrogen peroxide (HP). The simulation showed that the OFT is strongly dependent on hydrogen peroxide feed concentration, feed flow rate and diffusional resistances expressed by biocatalyst global effectiveness factor. It has been shown that the more significant diffusional resistances and the higher HP conversions are, the higher the optimal feed temperature is. The calculated values of the OFT were verified with the experimental results obtained in the model reactor at selected values of the feed flow rate. Presented analysis poses a significant simplification in a numerical computational procedure and can be very useful for engineers to select the temperature condition at which bioreactor productivity is expected to be maximal.

1. Introduction
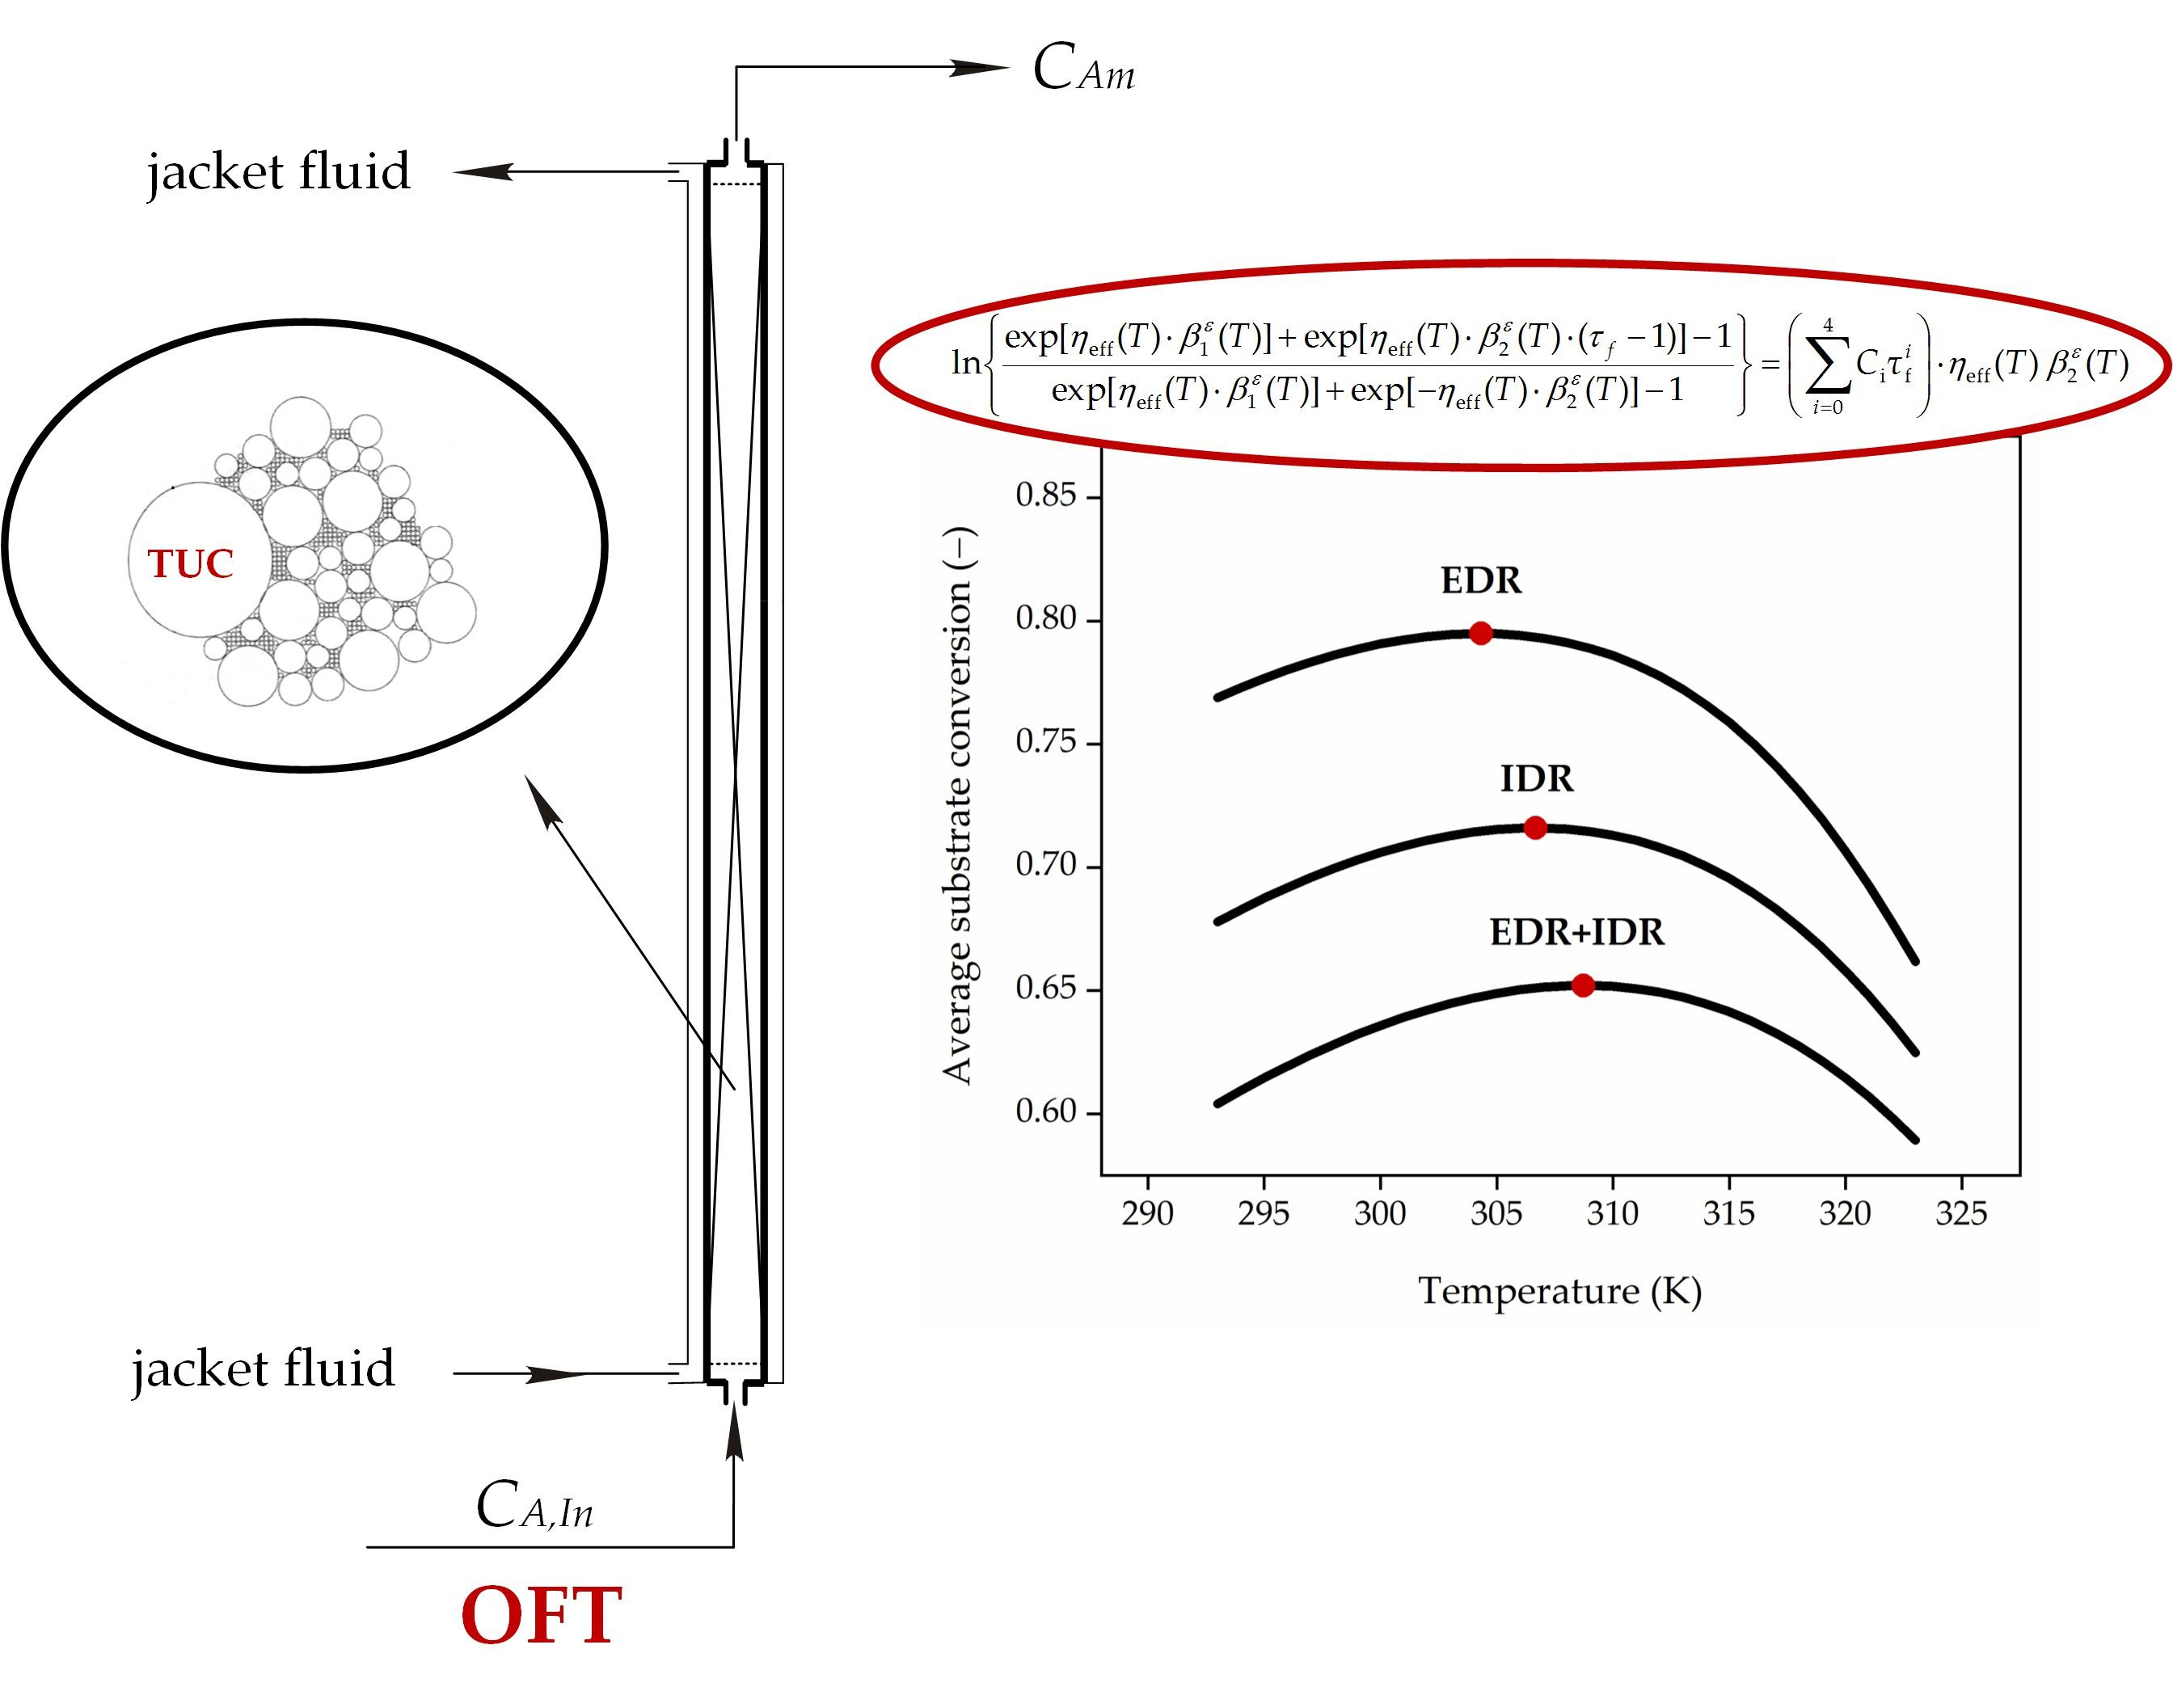
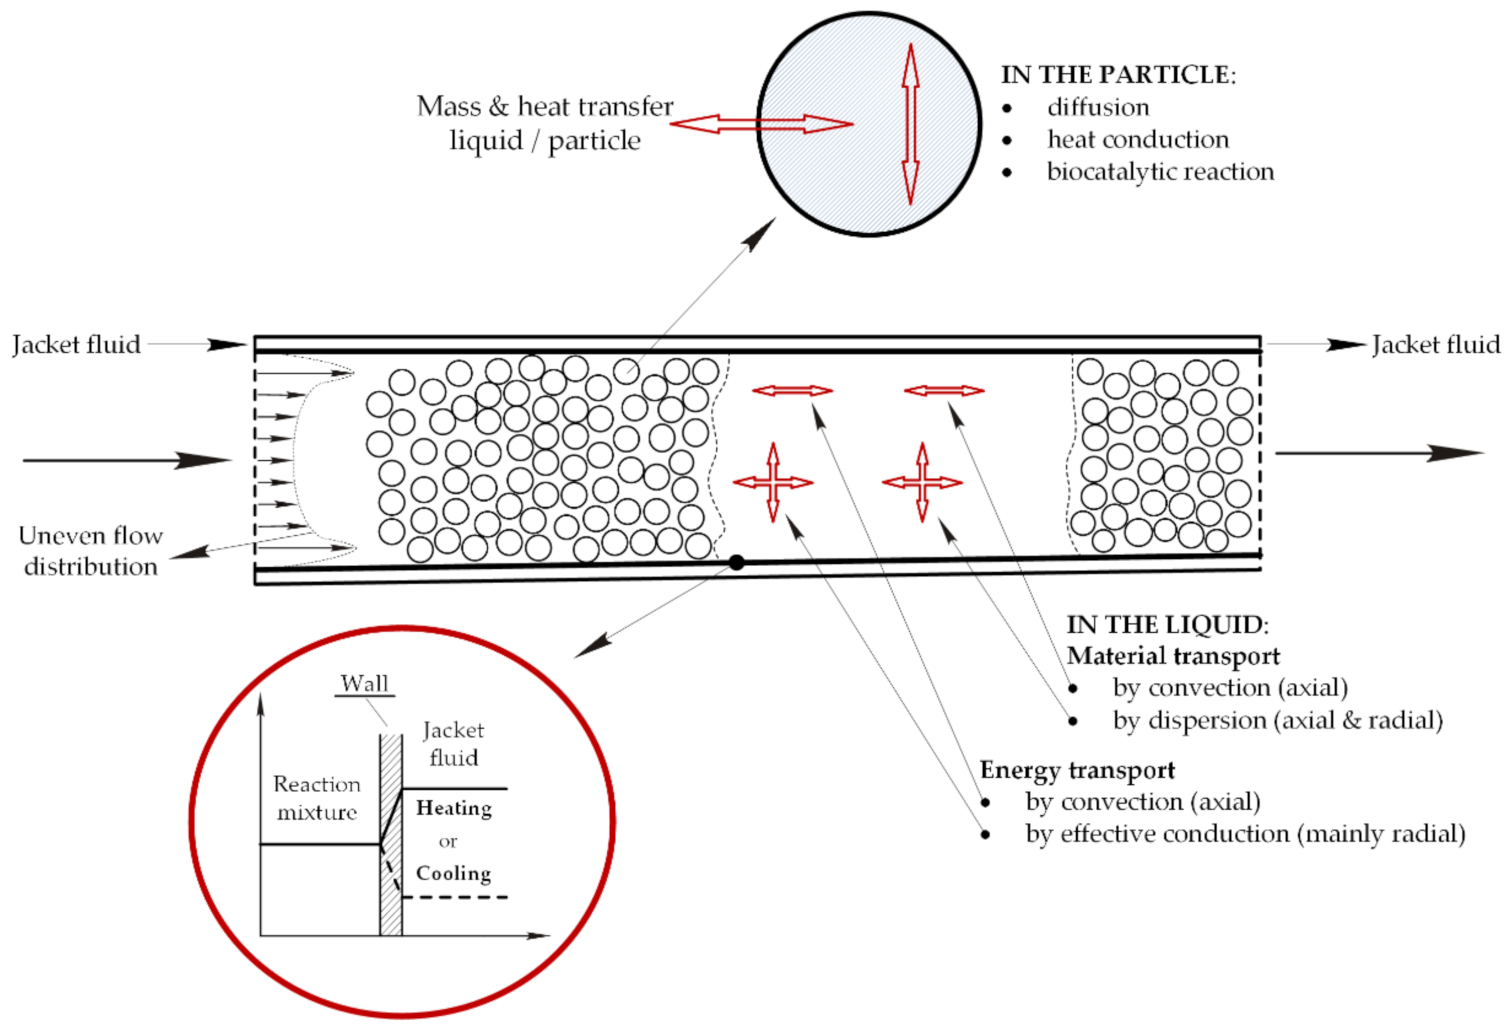
The technology of enzyme immobilization is widely accepted in biocatalysis resulting from the advantages over soluble enzymes and the increasing number of application in this field [1,2,3,4]. Immobilization offers the benefit of enzyme reuse, an easy product separation, increased thermal, chemical and operational stability of enzymes, protection against harmful environmental (mechanical or chemical) stress, and—from an automation viewpoint—a better process control [5,6,7]. In such cases the application of FXBR seems to be a good choice. However, when working with immobilized enzymes internal and/or external diffusional resistances (IDR/EDR) are likely to occur regardless of the method of immobilization [8,9,10]. Thus, the design and optimization of such reactors are not easy tasks compared to the transport mechanism in such a wall-cooled FXBR that consists of convective and dispersive mass transport as well as convective and conductive energy transport in the bulk phase, mass and heat transport between the solid and fluid phase, heat transfer between the reaction mixture and the cooling (heating) agent, dispersive mass and conductive energy transport and biocatalytic conversion in the solid phase (Figure 1) [11,12,13,14].
Additionally—in case of bioprocesses—assurance of the optimal conditions assurance can be a very challenging task because of enzyme deactivation. Such a phenomenon takes place as the factors responsible for this process characteristics can be decisive in choosing the reactor operating mode and optimal operating strategy for the biotransformations course [15,16,17,18].
Biocatalyst deactivation dependent on the substrate concentration (parallel deactivation) is a specific mechanism of deactivation and is related to catalase. This enzyme has been intensively applied for the elimination of residual HP in various domains such as textile, food, and semiconductors industries, as well as waste waters treatment and cosmetics and pharmaceutical formulations in biosensor systems [19,20,21,22].
Practically, in biotransformations running in the FXBR the optimal policy can be achieved mainly in two control modes. The first one is a control of the feed flow rate, and/or the second—by a control of temperature of the liquid phase flowing through the bioreactor. However, in the case of the last control variable an operating strategy can simply be accomplished by searching for a suitable feed temperature (say optimal feed temperature, OFT) yielding a maximum bioreactor productivity, and providing a compromise between the rate of reaction and that of enzyme deactivation.
In accordance to the last case a numerical analysis was previously performed [23] for the HPD process occurring in a bioreactor packed with Terminox Ultra catalase (TUC) immobilized onto the non-porous glass beads. This paper shows a realistic analysis of the non-isothermal packed-bed enzymatic reactor including some fundamental aspects of the process, such as external and internal diffusional limitations, as well as reactor hydrodynamics. In consequence, the numerical analysis had to be performed.
However, it should be mentioned that in industrial application the HPD process runs at the feed HP concentrations lower than 2 × 10⁻² kmol·m−3 [24]. In effect, the heat of reaction and the impact of this heat on reactor performance can be neglected [25] so that the temperature conditions are assumed to be isothermal ones. Furthermore, to minimize the influence of the axial dispersion in the bulk phase or make it to be negligible, when designing reactor its appropriate geometry (DR/dP ≥ 10 and H/dP > 50) should be taken. The length and diameter of a reactor selected in this way enables one to fulfil an assumption of plug flow [26,27]. From the mathematical viewpoint such an assumption is very crucial because then the solution of the optimization problem presented in the previous work [23] can be significantly simplified.
Hence, the aim of the present study was to search for an analytical expression describing the OFT of the fixed-bed reactor with a plug flow for the HPD process occurring in the presence of immobilized TUC undergoing parallel deactivation. The optimal feed temperature has been estimated by maximizing the substrate conversion over a given period at the fixed feed flow rate. The lower Tmin = 293 K and the upper Tmax = 323 K temperature constraints as well as diffusional resistances expressed by the global effectiveness factor were also taken into account.
The paper presents a novel methodology of practical importance that defines the optimal feed temperature as the control variable in the hydrogen peroxide decomposition process running in the fixed-bed enzyme reactor. The advantage of the proposed method is that it requires much less computational effort, and is easier to be implemented in industrial practice than the numerical one. Therefore, the method can be very useful for engineers when evaluating the operational conditions (feed temperature and feed flow rate) at which productivity of the FXBR for industrial process under consideration achieves a maximum or the highest value.
2. Results and Discussion
The algebraic Equation (18) describing the optimal feed temperature maximizing the time-averaged HP conversion was obtained. To perform the calculations the kinetic parameters for reaction and deactivation determined earlier [28] from the data collected during a laboratory study for the process of HPD by TUC immobilized onto non-porous glass beads running in the model fixed-bed reactor were adopted (Table 1).
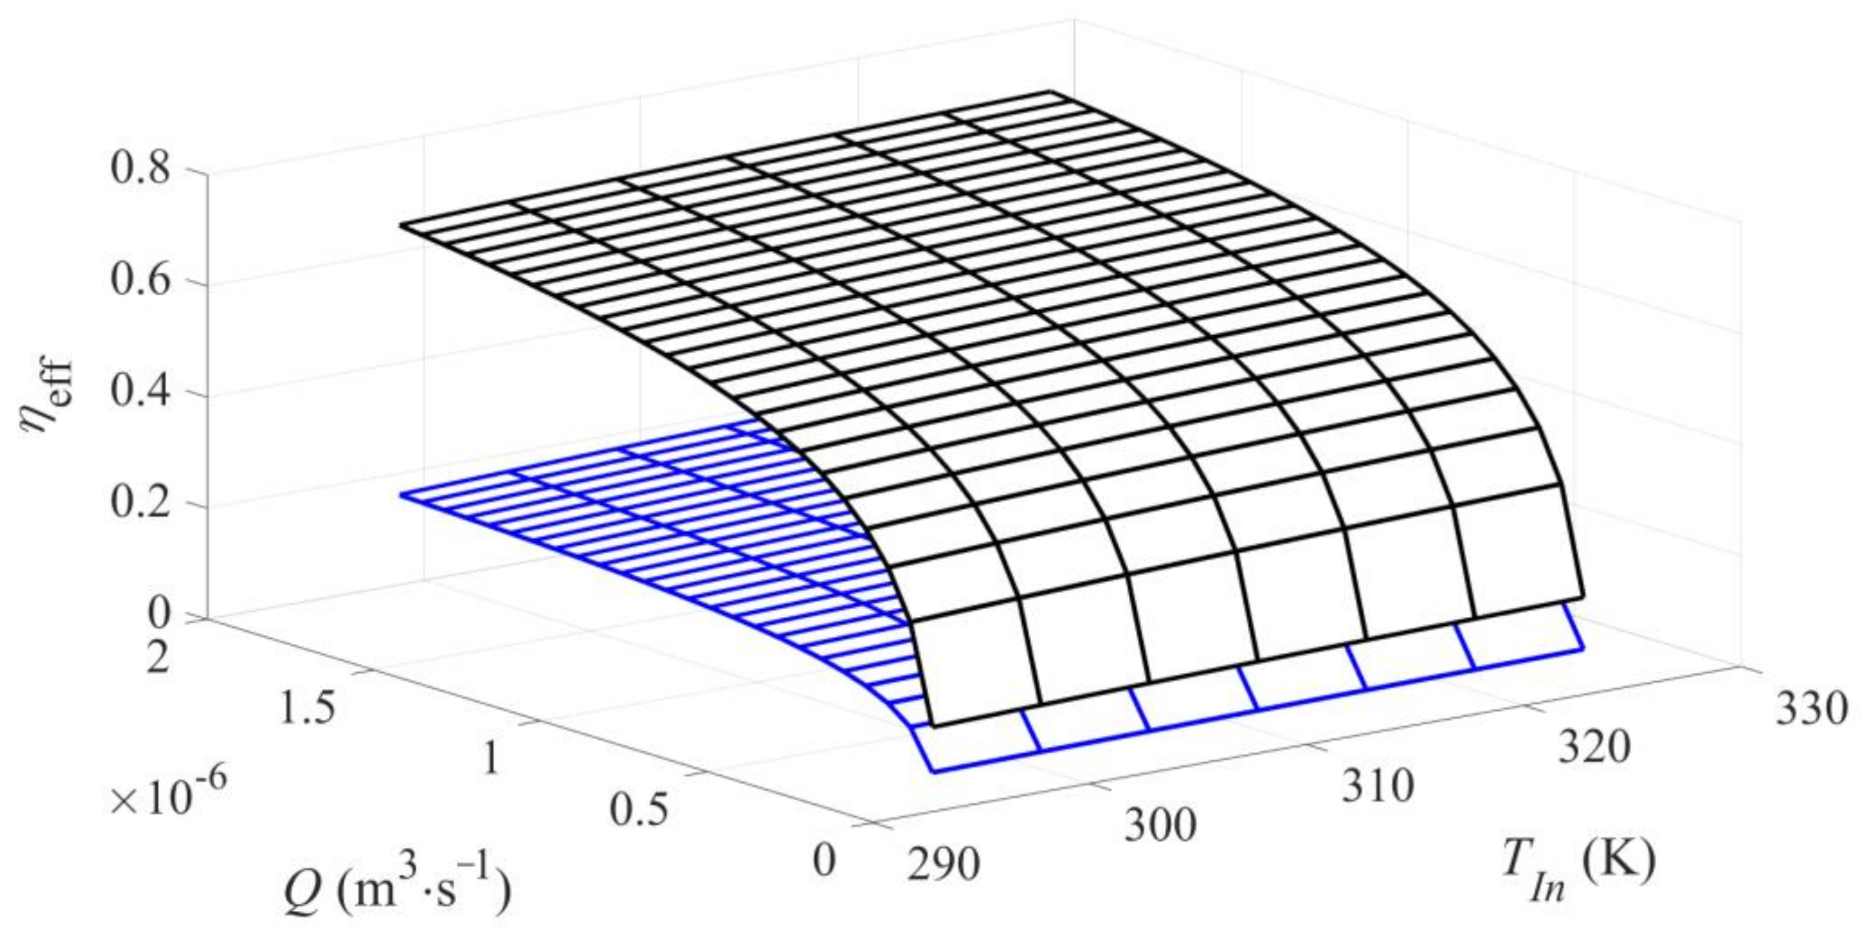
It was shown in the last quoted reference that in the HPD process EDR should not be neglected. Thus, to properly predict the real conditions in the FXBR for HPD operated under the OFT the global effectiveness factor should be used to express a combined effect of EDR and IDR. Although the behaviour of the effectiveness factors under EDR, ηEDR, and the global one, ηG, was illustrated in the earlier work [23] in Figure 2, for clarity of consideration this behaviour is depicted again (Figure 2).
In view of the results presented in Figure 3 it can be stated that in the HPD process occurring under EDR the time-averaged HP conversions obtained theoretically using Equation (16) for OFT described by Equation (20) is convergent to those observed in the model plug-flow reactor operated under OFT with the normalized deviation lower than 5%.
The effect of the feed flow rate, Q, and the feed temperature, TIn, on the changes of time-averaged HP conversion, αm, at the bioreactor outlet have been shown in Figure 4. It can be said that for the analysed values of the kinetic and mass-transfer parameters such a feed temperature can be indicated, for which the time-averaged HP conversion at the reactor outlet achieves a maximum value (Figure 4, lines 2–5) or is the highest one (Figure 4, lines 1 and 6), and is closely related to the feed flow rate, and to the effectiveness factor at the same time. This means that the OFT exists only for a certain value (at least one) of the feed flow rate Q∙. For the feed flow rates higher than Q∙ (Q > Q∙), an average HP conversion decreases with the raising temperature, and then the OFT becomes equal to the lower temperature constraint. On the contrary, for the feed flow rates lower than Q∙ (Q < Q∙), an average HP conversion increases with the raising temperature, and the OFT should be equal to the upper allowable temperature. Thus, there exists such a feed temperature value at which the time-averaged HP conversion is the maximal.
In the case shown in Figure 4 the feed flow rates (Q∙) with time-averaged maximum HP conversions at the reactor outlet remain: αm = 0.689 for Q∙ = 50 × 10−8 m3⋅s−1 correspond to values of η∙EDR = 0.637 and η∙G = 0.254, αm = 0.768 for Q = 40 × 10−8 m3⋅s−1 correspond to values of η∙EDR = 0.603 and η∙G = 0.243, αm = 0.859 for Q∙ = 30 × 10−8 m3⋅s−1 correspond to values of η∙EDR = 0.559 and η∙G = 0.228 as well as αm = 0.949 for Q∙ = 20 × 10−8 m3⋅s−1 correspond to values of η∙EDR = 0.495 and η∙G = 0.205, respectively. Then, it can be noted that for Q > Q∙ (in this case Q > 57 × 10−8 m3⋅s−1, see comment in Figure 4 caption), the time-averaged HP conversion decreases with temperature rise and then, the OFT corresponds to the lower permissible temperature, Tmin. In turn, for Q < Q∙ (in this case Q < 7 × 10⁻⁸ m3⋅s−1, see comment in Figure 4 caption) the time-averaged HP conversion increases when the feed temperature, TIn, grows, and then the OFT equals to the higher permissible temperature, Tmax. It means that in decomposition process of HP when Q > 57 × 10−8 m3⋅s−1 or Q < 7 × 10⁻⁸ m3⋅s−1 the reactor should operate under isothermal conditions at the temperature level of Tmin or Tmax, respectively.
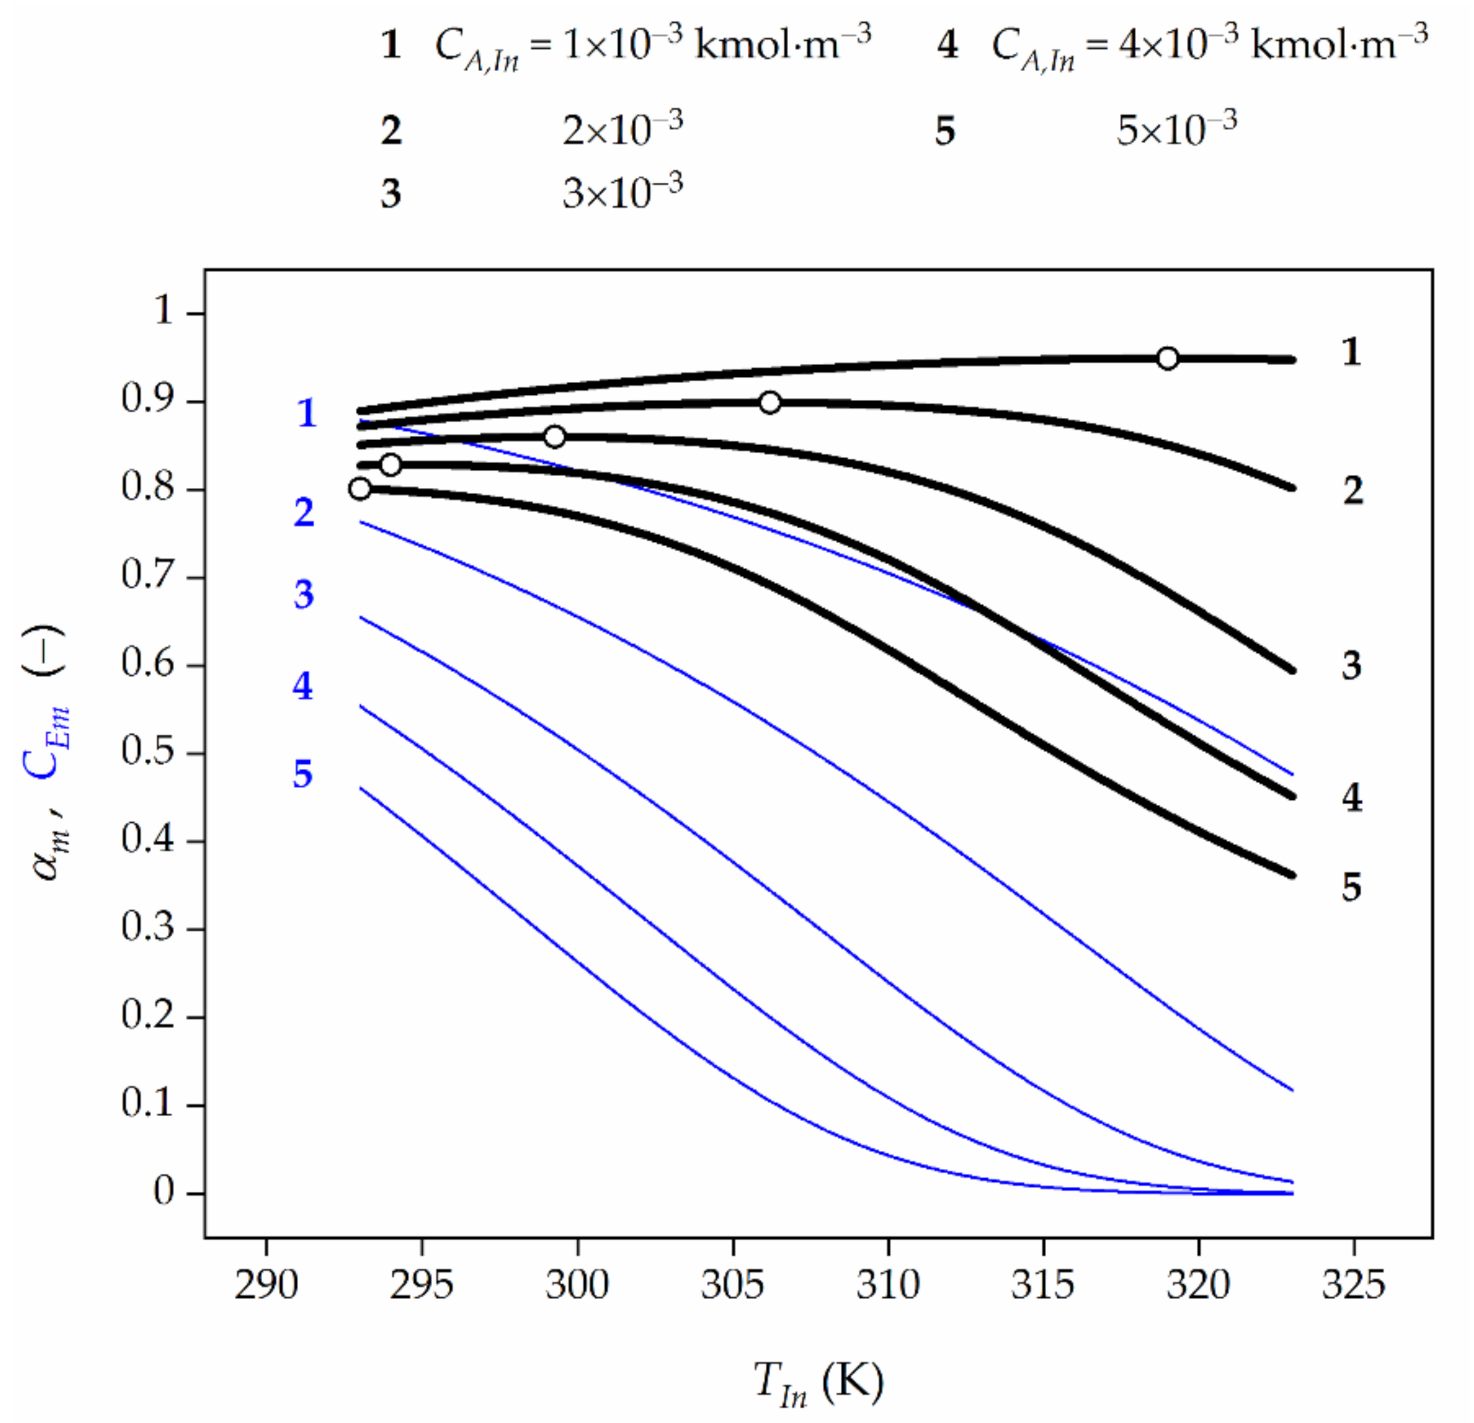
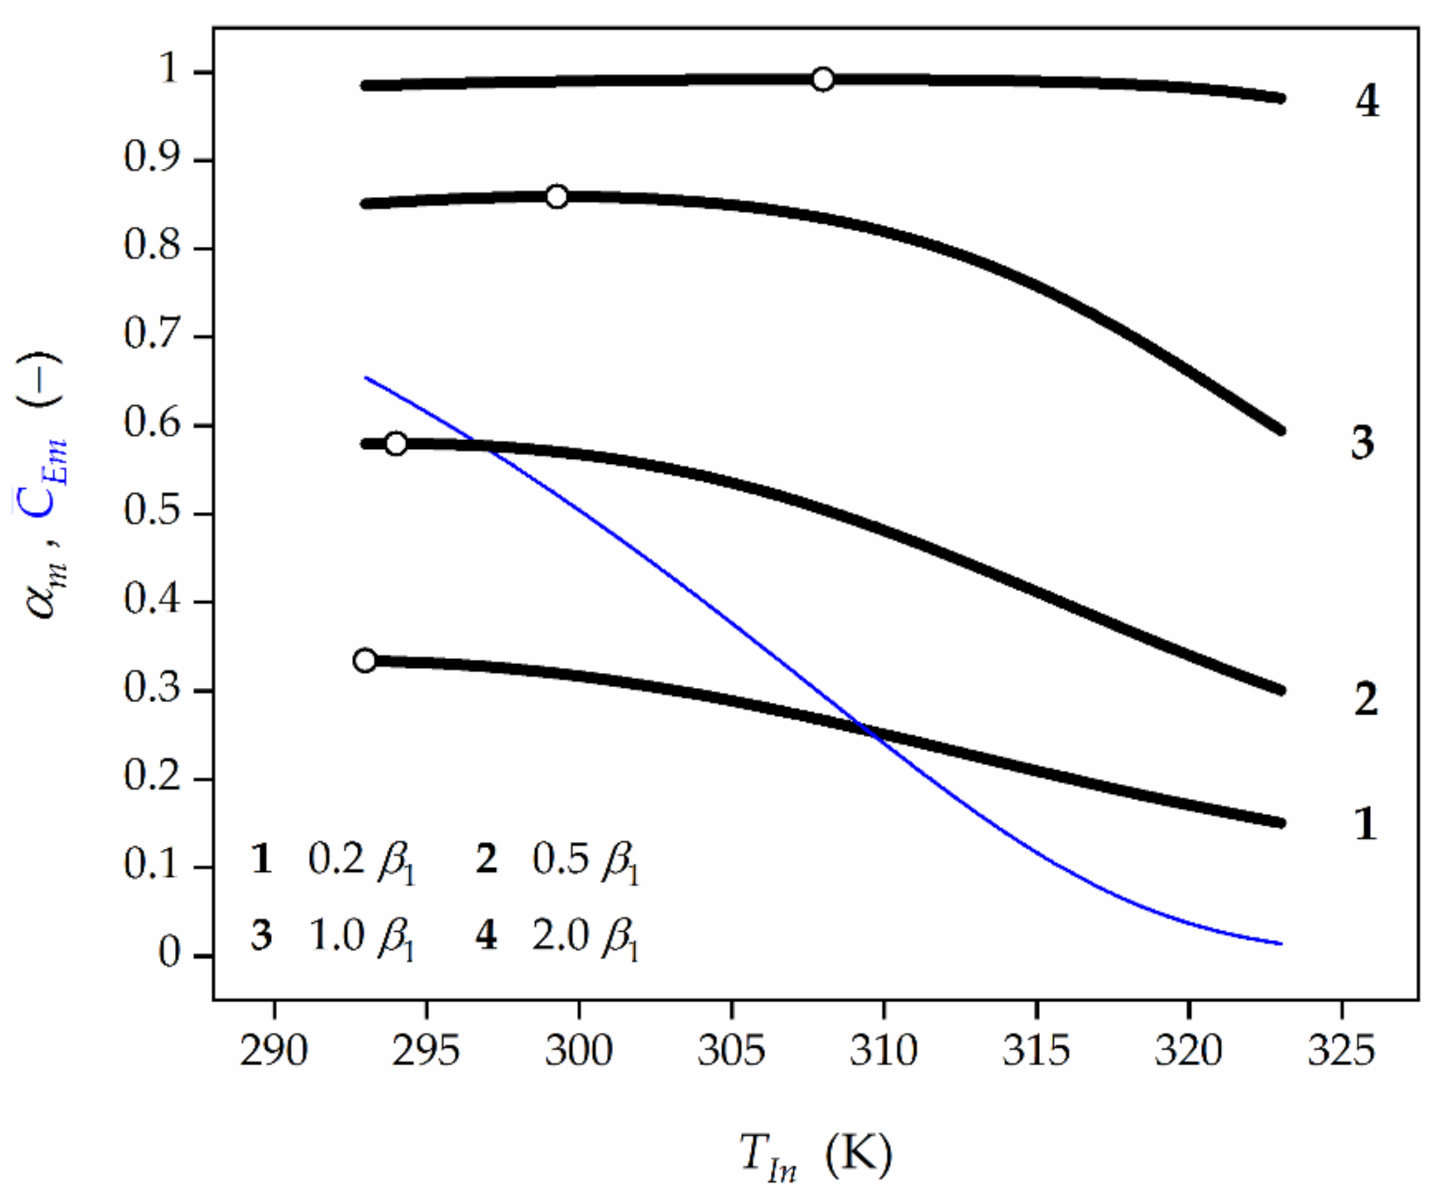
Based on the numerical values provided, the general rule can be indicated, namely, the more significant diffusional resistances (Figure 4), the lower the feed HP concentration (Figure 5), and the higher the TUC activity (Figure 6) are, the higher the OFT is.
It can be concluded that all dependences αm vs. TIn showed in Figure 4, Figure 5, Figure 6 and Figure 7 have a very weak peak. Hence, it should be noted that an inappropriate selection of temperature in the HPD process may lead to a significant decrease of bioreactor efficiency in which this process occurs.
Furthermore, the blue lines in Figure 4, Figure 5 and Figure 6 represent a decline of the average catalase activity along the bioreactor for the final biocatalyst age (τf) and feed flow rates (Q). These Figures show that the lower the feed HP concentration and the feed flow rate, the higher the average HP conversion are expected to be attained. This regularity is the reason for which in the HPD occurring in the presence of TUC undergoing deactivation the operating strategy should be accomplished in such a way that the feed flow rate decreases with time in order to compensate the loss of enzyme activity. The lower the feed flow rate, the more significant the EDR, and then the slower biocatalyst deactivation is to be expected. Consequently, higher time-averaged values of HP conversion at the reactor outlet and biocatalyst activity in the bed are acquired.
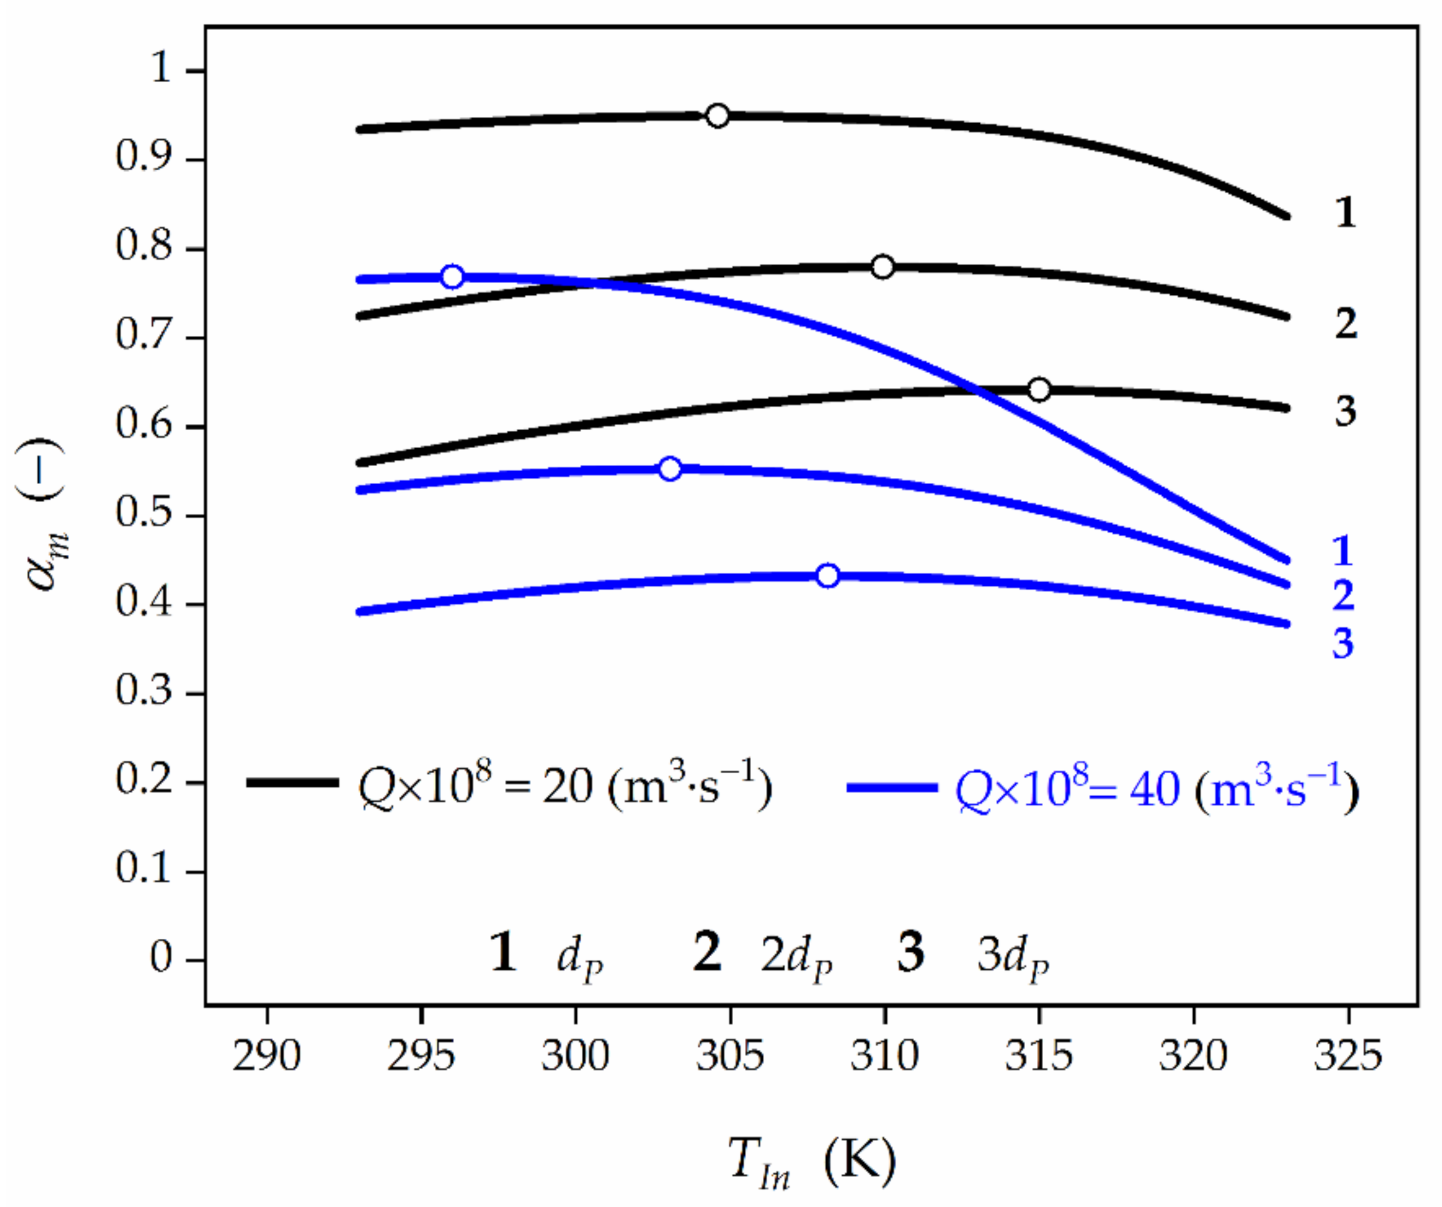
Application of the biocatalyst of larger size (Figure 7) results in the rise of the diffusional restrictions and, consequently, the decrease of the global effectiveness factor, ηG (Table 2). As a result, an increase of OFT value can be expected. In order to provide clarity of the presented analysis, the dependence αm vs. TIn and dP has been shown in the Figure 7. It can be seen that an increase of the biocatalyst pellet diameter from 5 × 10⁻⁴ to 10 × 10−4 m causes the OFT growth from 304.6 K to 309.9 K, respectively, for Q = 20 × 10−8 m3⋅s−1 and from 296.1 K to 303 K, respectively, for Q = 40×10−8 m3⋅s−1. At the same time, the reduction of HP conversion from 0.949 to 0.780, respectively, for Q = 20 × 10−8 m3⋅s−1, and from 0.768 to 0.553, respectively, for Q = 40 × 10−8 m3⋅s−1 can be noticed. An increase in the pellet diameter to 15 × 10−4 m makes the mass-transfer limitations more significant. Consequently, the growth of OFT is expected to 314.4 K for Q = 20 × 10−8 m3⋅s−1 and 308.2 K for Q = 40 × 10−8 m3⋅s−1 yielding the lower HP conversions of 0.642 and 0.432, respectively.
In general, the higher the biocatalyst pellet diameter, the higher Thiele modulus value and more significant IDR are. Consequently, the slower biocatalyst deactivation, and then higher average values of HP conversion at the reactor outlet are to be expected. This phenomenon can be intensified by the EDR (Equation (11)).
When the effect of external film diffusion can be disregarded then the process course is controlled only by IDR related to the mass-transport of HP inside the pores of the support and independent of the feed flow rate (Q). In such a situation the feed temperature ensuring the maximum time-averaged HP conversion should reach the value lower than that required in the biotransformation with the global HP mass-transport. As a result, the higher HP conversion can be anticipated.
3. Materials and Methods
Despite the extensive literature on theoretical and experimental analyses of the HPD process, both the knowledge of the effect of operational conditions on bioreactor behaviour—especially temperature in case of batch processes and feed temperature in case of continuous processes—and development of mathematical methods applied to assess an optimal control variables values ensuring high bioreactor performance are required for efficient design of immobilized enzyme reactor [29,30].
Hence, the investigation was conducted with the aid of a mathematical model describing the kinetics of biocatalytic reactions occurring in plug flow reactor under diffusional resistances and in the presence of immobilized enzyme undergoing deactivation. Due to the low substrate concentration applied in industrial practice the tubular reactor is modelled as isothermal, hence, no heat transfer needs to be considered, and pseudo-homogeneous. The pressure drop along the bed has been neglected in this model.
Other assumptions of the model are:
- Catalyst particles are spherical, symmetrical and uniformly packed inside the reactor;
- volume and density of the reacting medium are constant;
- the effective diffusivity does not change throughout the particles and is independent of the HP concentration.
- process is diffusion-controlled; and
- substrate (HP) transport rate (rm) from the bulk liquid (CA) to the outer surface of the immobilized bead (CAs) is equimolar diffusion described previously ([23], Equation (1));
The above assumptions pose a reasonable trade-off in terms of the model complexity and accuracy.
3.1. Development of the Fixed-Bed Reactor Problem
3.1.1. Kinetic Rate Equations for Reaction and Enzyme Deactivation
Hydrogen peroxide decomposition is well known [20,31,32], and the rate of changes in the substrate concentration (−rA)—after taking into consideration the mass-transfer resistances—can be described by the Michaelis–Menten kinetics:
In industrial practice HPD runs at low HP concentration (lower than or equal to 0.02 kmol⋅m−3), therefore, it can be assumed that CA ≪ KM. Then, Equation (1) can be simplified and expressed as follows [33,34,35]:
Each biotransformation is accompanied by diminishing activity of biocatalyst. Experimental kinetic equation describing the rate of catalase deactivation for the first time was proposed by George [36]:
with a, b, c being experimental constants and theoretically verified by Do and Weiland [37] as well as by Vasudevan and Weiland [38,39]. For theoretical verification it has been assumed that the free enzyme is directly involved in the poisoning process and the rate of formation of the inactive form of enzyme is much slower than any of the steps in the main reactions.
At low HP concentration (CA ≪ b), accounting for the mass transfer restrictions, Equation (3) is approximated by:
Such a form of the enzyme deactivation rate equation can usually be applied in the study of immobilized catalase in a fixed-bed reactor [5,23,40,41,42].
The effects of temperature on the rate constants for reaction kR* (=νR/KM) and deactivation kD (=νD/KD) are described by the Arrhenius equation:
3.1.2. Mathematical Model Approach
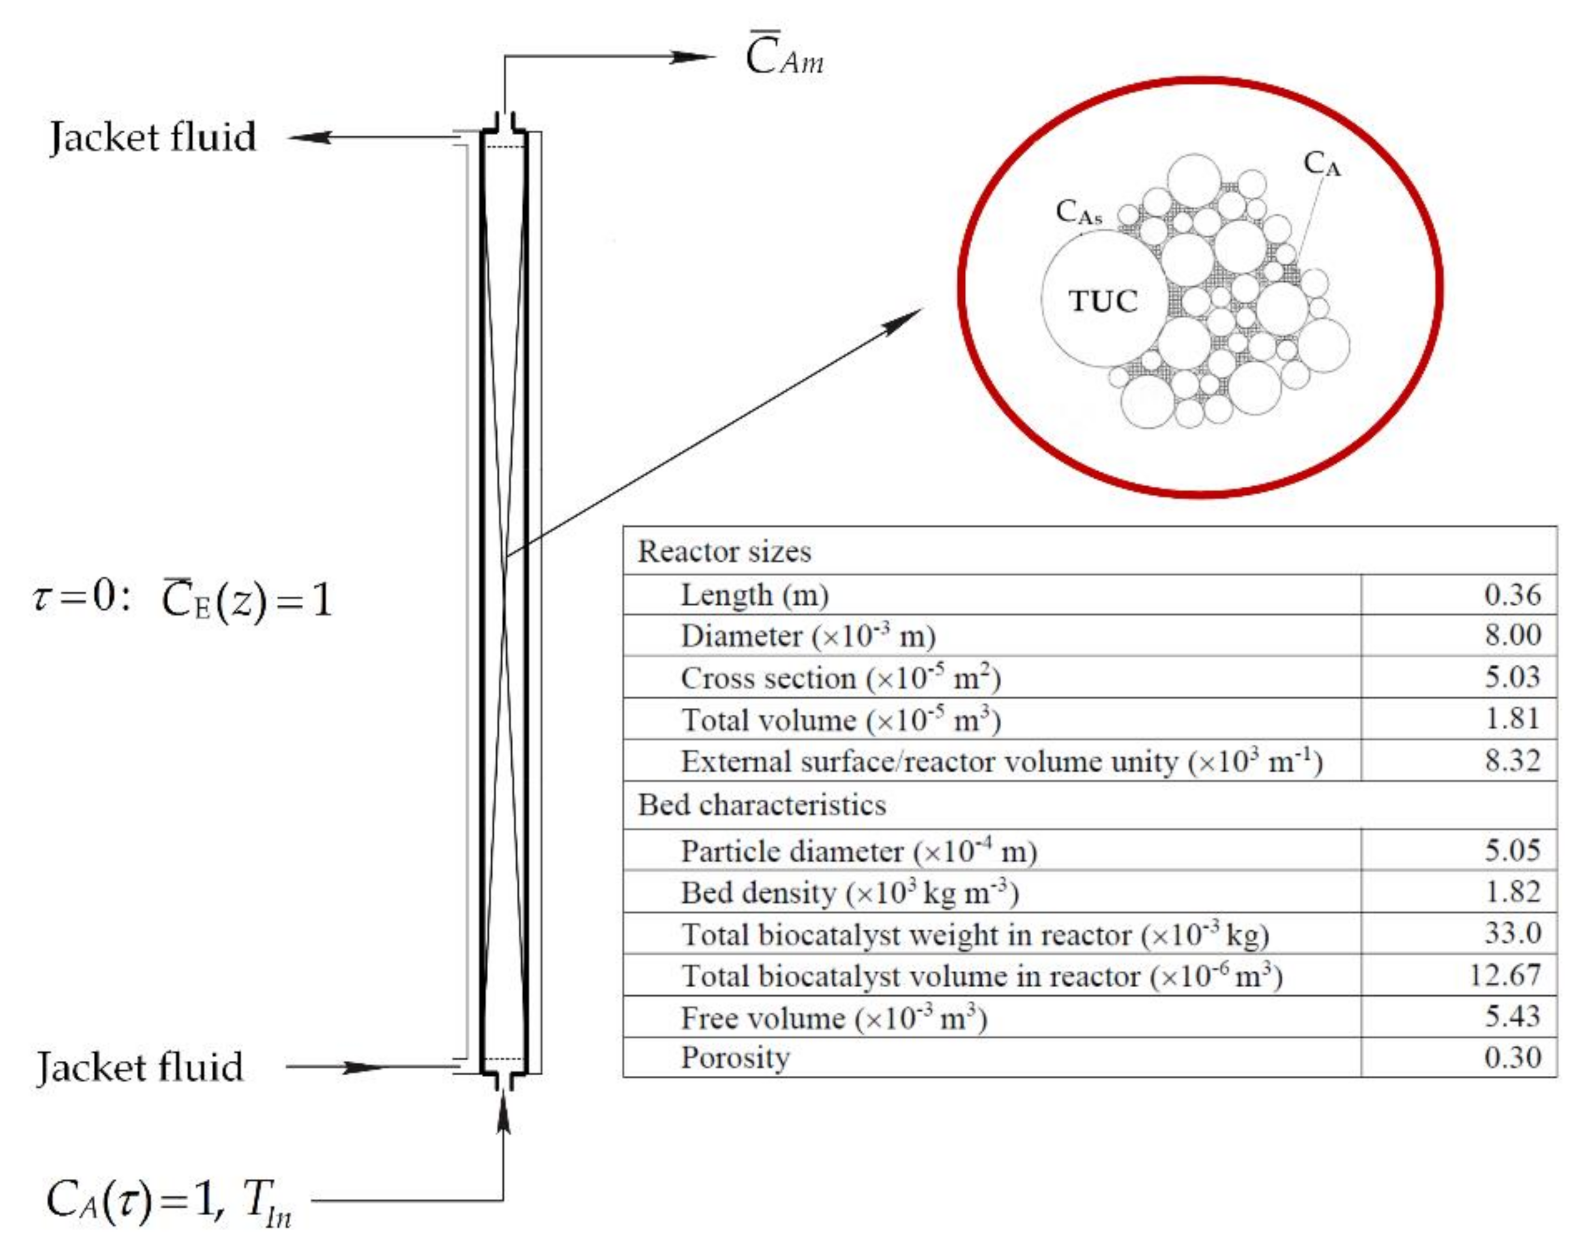
Let us consider an isothermal tubular reactor of length, H, and inner diameter, DR, packed with a bed made of an immobilized catalase, where a HP solution with a feed flow rate Q flows along the axial direction. To provide clarity of consideration characteristics of model bioreactor and biocatalyst employed in calculations have been illustrated in Figure 8.
Under the assumptions formulated above and by rescaling according to the dimensionless state variables:
dimensionless axial coordinate variable (z) and dimensionless biocatalyst age (𝜏):
as well as dimensionless process parameters:
and the differential equations for unsteady mass balance in the bulk liquid as well as for the enzyme deactivation rate which pose the quantitative description of the HPD course in the fixed-bed bioreactor with plug flow can be put into the following dimensionless form:
The formulated mathematical model allows to predict the real performance of the fixed-bed bioreactor for HPD process accomplished in the presence of immobilized commercial catalase in industrial practice.
3.1.3. Evaluation of the Effectiveness Factor
When an enzyme is attached to a porous carrier matrix the coupled internal and external mass-transfer limitations should be considered in development of a general bioreactor model and quantified through the use of an effectiveness factor. Usually, penetration of the substrate into the interior of the biocatalyst particle is the slowest step. Hence, the EDR are negligible compared to IDR. However, it was proved [28] that in the HPD process occurring in the presence of immobilized TUC the EDR should not be neglected. Then, to properly assess a real bioreactor behaviour, the global effectiveness factor (ηeff = ηG) appearing in Equations (1), (2), (4), (9) and (10) should be introduced [46,47]:
where ϕ is the Thiele modulus representing the relative incidence of enzyme catalytic potential and substrate mass transfer rate, while BiM denotes the Biot number for mass transfer and represents the relative impact of EDR with respect to IDR. To calculate them the external mass-transfer model developed previously, parameters for reaction and deactivation describing the process free of diffusional resistances as well as effective diffusion coefficient were applied and in details reported in earlier papers [23,28]. In the calculation presented in this work the lowest value of the effectiveness factor has been adopted corresponding to the initial biocatalyst activity as well as the kinetic parameters for reaction and deactivation in the process free of diffusional limitations [48,49].
3.2. Expressions for Distributions of HP Concentration and TUC Activity
In analysing the course of the process under isothermal conditions, our target is to find an expression describing the distributions of the HP concentration and TUC activity as functions of dimensionless bioreactor length (z) and biocatalyst age (τ) accounting for diffusional resistances expressed by biocatalyst effectiveness factor (ηeff). Under the assumption made above it is possible to predict these state variables distributions in the following analytical form (Appendix A):
where (j = 1,2)
Equations (12) and (13) pose exact solutions
to the first order, nonlinear, coupled Equations (9) and (10) describing the
simultaneous HPD process with TUC deactivation that occurs in the operation of
a continuous packed bed reactor. They are fundamental for the further part of
consideration with temperature (T) as a control variable.
3.3. Optimization Problem Formulation
Temperature, besides feed flow rate, is the most important decisive variable in flow (bio)reactors [15,50,51,52,53,54]. It has a crucial impact on enzyme activity, its stability, and in consequence on bioreactor performance [6]. Due to the dependences (12) and (13) being the functions of temperature it can be expected that there exists an isothermal process temperature which ensures a desired bioreactor efficiency. Hence, an optimizing problem has been formulated as searching for the feed temperature under a constant feed flow rate would provide a maximum (minimum) time-averaged HP conversion (concentration) at the reactor outlet.
3.3.1. Performance Index
In the light of the proposed optimization problem the performance index related to the reactor outlet can be presented as follows (T = TIn):
Analysing the minimization problem of time-averaged HP concentration, substituting Equation (12) into the performance index:
and integrating above Equation (15) according to the integration limits, we obtain:
Equation (16) describes the time-averaged HP concentration at the bioreactor outlet as a function of feed temperature, TIn.
3.3.2. Equation Describing OFT
Application of the necessary condition (Fermat’s Theorem) for existing of extreme with respect to the function described by Equation (16):
yields a differential equation:
which after integration can be given as:
where C is the integration constant (independent of temperature).
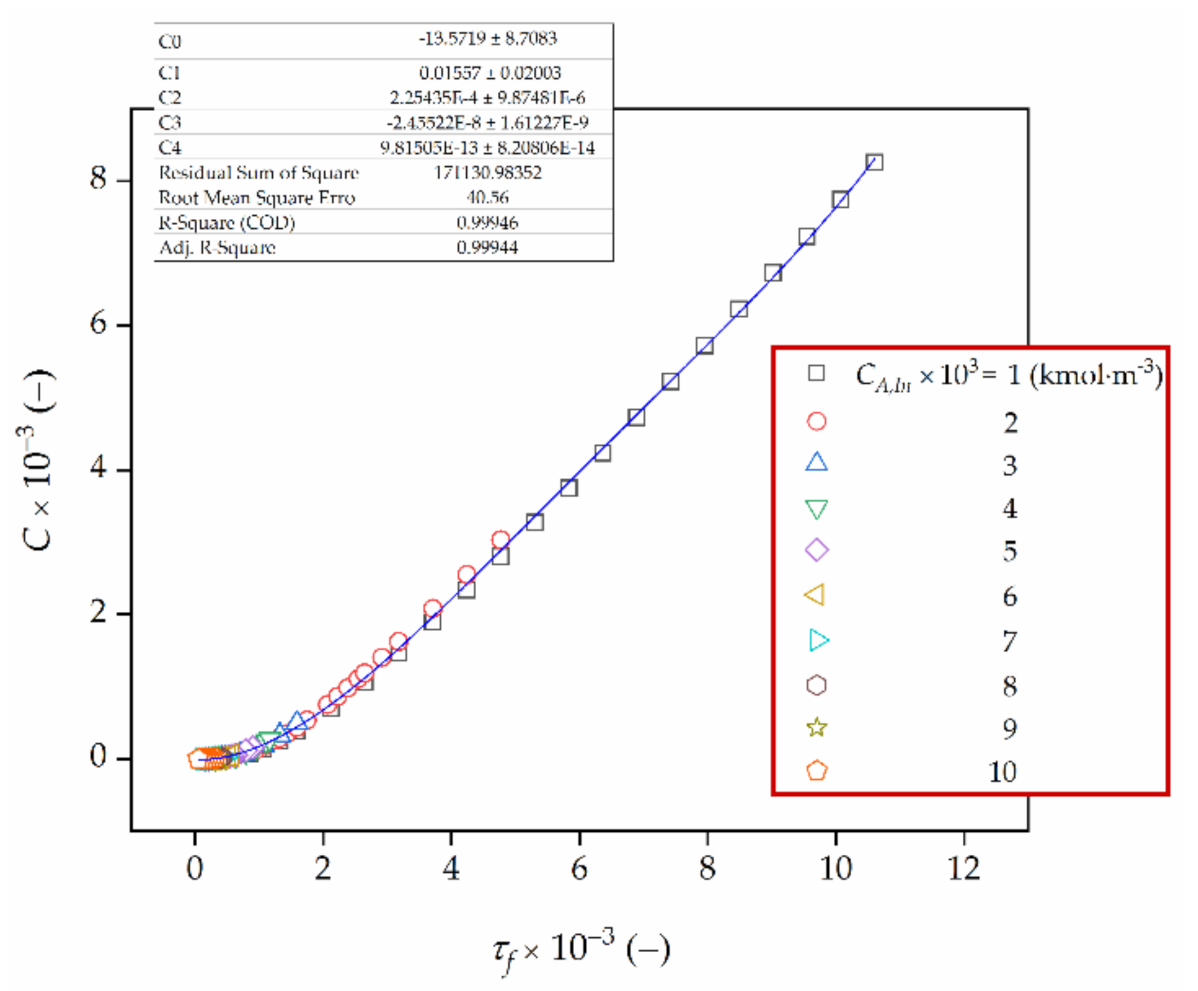
More detailed numerical analysis proved that the integration constant, C, is a function of the final biocatalyst age, τf. Hence, an attempt was made to determine a functional dependence between C and τf. The interpolation polynomials of first, second, third and fourth degree were considered. The results of this analysis are given in Figure 9 and Table 3.
Hence, Equation (19) can be rewritten in the following form:
with C0 = −13.572, C1 = −1.557 × 10⁻², C2 = 2.254 × 10⁻⁴, C3 = −2.455 × 10⁻⁸ and C4 = 9.815 × 10⁻¹³ (Figure 9).
It should be noted that the coefficient of determination R2 (COD) is higher as well as the sum of squares error (SSE) and the root mean square error (RMSE) are lower when fitting the fourth degree polynomials to a discrete function C versus τf rather than approximating it by a linear, square and cubic function.
Approximations using the exponential and power functions were also investigated. However, none of them provided better accuracy than those presented in Table 3.
It is worth mentioning that for the kinetic and mass-transfer process parameters the second derivative of the Equation (16) with respect to temperature is positive for each assessed values of OFT as a sufficient condition for the existence of a function extreme.
4. Conclusions
Algebraic equations describing the feed temperature—at the same time the temperature at which the HPD process occurs—for which the productivity of plug flow reactor for hydrogen peroxide decomposition occurring in the presence of immobilized Terminox Ultra catalase achieves maximum value or is the highest one were developed. It has been demonstrated that such a temperature does exist for each biotransformations running in FXBR assuming plug flow and is closely related to the feed flow rate, and to the effectiveness factor. Based on numerical values illustrated in the figures it should be noted that an inappropriate selection of temperature in the HPD process can lead to a significant decrease of bioreactor efficiency. The general rule can be indicated, namely, the more significant diffusional resistances, the lower the feed HP concentration, and the higher the TUC activity are, the higher the OFT value expected is.
The analysis under consideration not only provides the analytical expression for OFT but also allows to understand exactly an engineering approach to the biotransformations with parallel biocatalyst deactivation.
It should be clearly stated that temperature is an important decisive variable in fixed-bed (bio)reactors and exerts a decisive influence both on the rate of reaction and that of enzyme deactivation. At moderate temperatures the enzyme deactivation rate is insignificant while its initial reaction rate increases with temperature. At higher temperatures the concentration of active enzyme decreases due to the increase in the deactivation rate which becomes predominant. As a result, the reaction rate diminishes. Hence, selection of the appropriate temperature policy that would find a compromise between the rate of reaction and that of enzyme deactivation as well as, ensuring a maximum time-averaged substrate conversion, poses a fundamental problem in designing fixed-bed reactors.
Funding
This research received no external funding.
Institutional Review Board Statement
Not applicable.
Informed Consent Statement
Not applicable.
Data Availability Statement
The data presented in this study are available on request from the corresponding author.
Conflicts of Interest
The author declares no conflict of interest.
Nomenclature
| a, b, c | Experimental constants appearing in Equation (3) |
| am | External surface area for mass transfer, m2⋅m−3 |
| BiM | Biot number (=(dP/2)kL/Deff) |
| CE | Enzyme activity, kg⋅m−3 |
| CA | Bulk substrate concentration, kmol⋅m−3 |
| CA,In, | HP concentration at the reactor inlet, kmol⋅m−3 |
| CAm | Time-averaged HP concentration, kmol⋅m−3 |
| CAs | Surface HP concentration, kmol⋅m−3 |
| dP, DR | Particle diameter, and reactor diameter, respectively, m |
| Deff | Effective diffusion coefficient, m2⋅s−1 |
| Ei | Activation energy for reaction (i = R) and deactivation (i = D), J⋅mol−1 |
| h, H | Distance from reactor inlet, and bed depth, respectively, m |
| kD, | Modified rate constant for deactivation (=νD/KD), m3⋅kmol−1⋅s−1 |
| kD0 | Pre-exponential factor for deactivation rate constant, m3⋅kmol−1⋅s−1 |
| kL | Mass transfer coefficient, m⋅s−1 |
| kR* | Modified rate constant for reaction (=νR/KM), m3⋅kg−1⋅s−1 |
| kR0 | Pre-exponential factor for enzymatic reaction rate constant, m⋅s−1 |
| kR | Modified rate constant for reaction (=kR*CE0/am), m⋅s−1 |
| Ki | Michaelis constant for reaction (i = R) and deactivation (i = D), respectively, kmol⋅m−3 |
| Q | Feed flow rate, m3⋅s−1 |
| (-rA) | Reaction rate, kmol⋅m−3⋅s−1 |
| t | Biocatalyst age, s |
| T | Temperature generally, K |
| TIn | Feed temperature, K |
| Tmin, Tmax | Lower and upper temperature constraints, K |
| TOFT | Optimal feed temperature value, K |
| US | Superficial velocity, m⋅s−1 |
| z | Dimensionless distance from reactor inlet (=h/H) |
| Greek letters | |
| αm | Time-averaged substrate conversion |
| β1, β2 | Dimensionless numbers expressed by Equation (8) |
| εb | Porosity of the porous medium (=0.3) |
| φ | Thiele modulus (=dP/2(kRam/Deff)0.5) |
| η | Fluid viscosity, kg⋅m−1⋅s−1 |
| ηk | Effectiveness factor generally (k = eff), under EDR (k = EDR), and global effectiveness factor (k = G) |
| νD | Rate constant for deactivation, s−1 |
| νR | Rate constant for reaction, kmol⋅kg−1⋅s−1 |
| ρ | Fluid density, kg⋅m−3 |
| τ | Dimensionless time (=tUS/H) |
| Abbreviations | |
| COD | Coefficient of Determination |
| FXBR | Fixed-Bed Reactor |
| EDR | External Diffusional Resistances |
| HP | Hydrogen Peroxide |
| HPD | Hydrogen Peroxide Decomposition |
| IDR | Internal Diffusional Resistances |
| OFT | Optimal Feed Temperature |
| RMSE | Root Mean Square Error |
| SSE | Sum of Squares Error |
| TUC | Terminox Ultra Catalase |
Appendix A. Derivation of Expression Describing the Distributions of HP Concentration and Catalase Activity
Differential equations for mass balance in the bulk liquid as well as for the enzyme deactivation rate which constitute the mathematical model of the HPD running in fixed-bed bioreactor, assuming plug flow, in dimensionless form can be expressed as:
where:
The equations system (A1) and (A2) can be solved analytically. For this purpose it is necessary to introduce the new independent variables τ∙ and z∙ defined as:
Then, the equations (A1) and (A2), after accounting for the complete derivatives of HP concentration and TUC activity with respect to τ and z, takes the following form:
where (j = 1,2).
Dividing side by side Equations (A5) and (A6) yields:
Based on Equation (A7) it can be declared that there exists such a function Ψ (z∙,τ∙) for which this equation can be rewritten as:
Accounting for Equation (A8) in the model Equations (A5) or (A6), after the appropriate transformation, we get:
The partial differential Equation (A9) can be solved applying the prediction method and assuming:
Differentiating Equation (A10) with respect to z∙ and τ∙, and then substituting the obtained expressions into Equation (A9), we have:
where A∙ is a constant of positive value. The initial and boundary conditions in Equation (A12) were obtained from expression (A10) and analogous condition appearing in Equations (A5) and (A6).
Solution of Equation (A11) can be presented in the following form resulting from double integration with respect to z∙ and τ∙:
where A∙∙ is a cumulated integration constant.
Taking into account the initial and boundary conditions, the functions V(τ∙), and W(z∙) as well as the constant A∙∙ can be estimated to be:
Hence, Equation (13) which defines the function w(z∙,τ∙) can be rewritten as follows:
Now, it is possible to determine the functions describing the distributions of HP concentration and TUC activity. Accounting for the definition of the function Ψ (Equation (A10)), then making use the dependences (A8) and returning to the real independent variables z and τ, we get:
References
- Zhang, H.; Li, H.; Xu, C.C.; Yang, S. Heterogeneously Chemo/Enzyme-Functionalized Porous Polymeric Catalysts of High-Performance for Efficient Biodiesel Production. ACS Catal. 2019, 9, 10990–11029. [Google Scholar] [CrossRef]
- Gennari, A.; Mobayed, F.H.; Da Rolt, N.B.; Benvenutti, E.V.; Nicolodi, S.; da Silveira, N.P.; Volpato, G.; Volken de Souza, C.F. Immobilization of β-Galactosidases on Magnetic Nanocellulose: Textural, Morphological, Magnetic, and Catalytic Properties. Biomacromolecules 2019, 20, 2315–2326. [Google Scholar] [CrossRef] [PubMed]
- Grigoras, A.G. Catalase immobilization—A review. Biochem. Eng. J. 2017, 117 Pt B, 1–20. [Google Scholar] [CrossRef]
- García-García, P.; Rocha-Martin, J.; Guisan, J.M.; Fernandez-Lorente, G. Co-Immobilization and Co-Localization of Oxidases and Catalases: Catalase from Bordetella Pertussis Fused with the Zbasic Domain. Catalysts 2020, 10, 810–828. [Google Scholar] [CrossRef]
- Li, M.; Christofides, P.D. Optimal control of diffusion-convection-reaction processes using reduced-order models. Comput. Chem. Eng. 2008, 32, 2123–2135. [Google Scholar] [CrossRef]
- Maria, G.; Crisan, M. Evaluation of optimal operation alternatives of reactors used for d-glucose oxidation in a bi-enzymatic system with a complex deactivation kinetics. Asia-Pac. J. Chem. Eng. 2015, 10, 22–44. [Google Scholar] [CrossRef]
- Carrazco-Escalante, M.; Caro-Corrales, J.; Iribe-Salazar, R.; Ríos-Iribe, E.; Vázquez-López, Y.; Gutiérrez-Dorado, R.; Hernández-Calderón, O. A new approach for describing and solving the reversible Briggs-Haldane mechanism using immobilized enzyme. Can. J. Chem. Eng. 2020, 98, 316–329. [Google Scholar] [CrossRef]
- Garcia-Galan, C.; Berenguer-Murcia, Á.; Fernandez-Lafuente, R.; Rodrigues, R.C. Potential of Different Enzyme Immobilization Strategies to Improve Enzyme Performance. Adv. Synth. Catal. 2011, 353, 2885–2904. [Google Scholar] [CrossRef]
- Illanes, A. Enzyme Reactor Design and Operation under Mass-Transfer Limitations. In Problem Solving in Enzyme Biocatalysis; John Wiley and Sons Ltd.: Chichester, UK, 2013; pp. 181–202. [Google Scholar]
- Sonwani, R.K.; Giri, B.S.; Jaiswal, R.P.; Singh, R.S.; Rai, B.N. Performance evaluation of a continuous packed bed bioreactor: Bio-kinetics and external mass transfer study. Ecotox. Environ. Safe 2020, 201, 110860. [Google Scholar] [CrossRef]
- Badillo-Hernandez, U.; Alvarez, J.; Alvarez-Icaza, L. Efficient modeling of the nonlinear dynamics of tubular heterogeneous reactors. Comput. Chem. Eng. 2019, 123, 389–406. [Google Scholar] [CrossRef]
- Haugwitz, S.; Hagander, P. Challenges in Start-Up control of a Heat Exchange Reactor with Exothermic Reactions. A Hybrid Approach. In Analysis and Design of Hybrid Systems 2006; Cassandras, C., Giua, A., Seatzu, C., Zaytoon, J., Eds.; Elsevier: Amsterdam, The Netherlands, 2006; pp. 185–190. [Google Scholar] [CrossRef]
- Mohammadi, L.; Aksikas, I.; Dubljevic, S.; Forbes, J.F. Optimal boundary control of coupled parabolic PDE–ODE systems using infinite-dimensional representation. J. Process. Contr. 2015, 33, 102–111. [Google Scholar] [CrossRef]
- Ranzi, E.; Corbetta, M.; Manenti, F.; Pierucci, S. Kinetic modeling of the thermal degradation and combustion of biomass. Chem. Eng. Sci. 2014, 110, 2–12. [Google Scholar] [CrossRef]
- Grubecki, I. How to run biotransformations—At the optimal temperature control or isothermally? Mathematical assessment. J. Process Control 2016, 44, 79–91. [Google Scholar] [CrossRef]
- Fenila, F.; Shastri, Y. Optimization of cellulose hydrolysis in a non-ideally mixed reactors. Comput. Chem. Eng. 2019, 128, 340–351. [Google Scholar] [CrossRef]
- Kilpiö, T.; Aho, A.; Murzin, D.; Salmi, T. Experimental and Modeling Study of Catalytic Hydrogenation of Glucose to Sorbitol in a Continuously Operating Packed-Bed Reactor. Ind. Eng. Chem. Res. 2013, 52, 7690–7703. [Google Scholar] [CrossRef]
- Illanes, A.; Wilson, L. Enzyme Reactor Design Under Thermal Inactivation. Crit. Rev. Biotechnol. 2003, 23, 61–93. [Google Scholar] [CrossRef]
- Farkye, N.Y. Cheese technology. Int. J. Dairy Technol. 2004, 57, 91–98. [Google Scholar] [CrossRef]
- Fruhwirth, G.; Paar, A.; Gudelj, M.; Cavaco-Paulo, A.; Robra, K.H.; Gübitz, G. An immobilised catalase peroxidase from the alkalothermophilic Bacillus SF for the treatment of textile-bleaching effluents. Appl. Microbiol. Biotechnol. 2002, 60, 313–319. [Google Scholar] [CrossRef] [Green Version]
- Reis, C.Z.; Fogolari, O.; Oliveira, D.; de Arruda Guelli Ulson de Souza, S.M.; de Souza, A.A.U. Bioscouring and bleaching of knitted cotton fabrics in one-step process using enzymatically generated hydrogen peroxide. Can. J. Chem. Eng. 2017, 95, 2048–2055. [Google Scholar] [CrossRef]
- Soares, J.C.; Moreira, P.R.; Queiroga, A.C.; Morgado, J.; Malcata, F.X.; Pintado, M.E. Application of immobilized enzyme technologies for the textile industry: A review. Biocatal. Biotransform. 2011, 29, 223–237. [Google Scholar] [CrossRef]
- Grubecki, I. Optimal feed temperature for an immobilized enzyme fixed-bed reactor: A case study on hydrogen peroxide decomposition by commercial catalase. Chem. Process Eng. 2018, 39, 39–57. [Google Scholar] [CrossRef]
- Miłek, J. Thermal deactivation of catalase from Saccharomyces cerevisiae. Przem. Chem. 2020, 1, 128–130. [Google Scholar] [CrossRef]
- Liang, Y.; Wu, Y.; Li, D.; Wang, C.; Liu, Y.; Qu, S.; Zou, G. Thermokinetic models of enzyme-catalyzed reactions in batch and plug-flow reactors. Thermochim. Acta 1997, 307, 149–153. [Google Scholar] [CrossRef]
- Levenspiel, O. Chemical Reaction Engineering, 3rd ed.; John Wiley & Sons Inc.: New York, NY, USA, 1999. [Google Scholar]
- Gupta, R.; Bansal, A. Effect of Bed Configuration on Dispersion in a Packed-Bed Reactor. Ind. Eng. Chem. Res. 2010, 49, 9525–9528. [Google Scholar] [CrossRef]
- Grubecki, I. External mass transfer model for hydrogen peroxide decomposition by Terminox Ultra catalase in a packed-bed reactor. Chem. Process. Eng. 2017, 38, 307–319. [Google Scholar] [CrossRef] [Green Version]
- Mathpati, A.C.; Kalghatgi, S.G.; Mathpati, C.S.; Bhanage, B.M. Immobilized lipase catalyzed synthesis of n-amyl acetate: Parameter optimization, heterogeneous kinetics, continuous flow operation and reactor modeling. Chem. Technol. Biotechnol. 2018, 93, 2906–2916. [Google Scholar] [CrossRef]
- Ellis, M.; Durand, H.; Christofides, P.D. A tutorial review of economic model predictive control methods. J. Process Control 2014, 24, 1156–1178. [Google Scholar] [CrossRef]
- Grubecki, I. Optimal temperature control in a batch bioreactor with parallel deactivation of enzyme. J. Process Control 2010, 20, 573–584. [Google Scholar] [CrossRef]
- Grubecki, I. Comparison between Isothermal and Optimal Temperature Policy for Batch Process with Parallel (Bio-)Catalyst Deactivation. J. Chem. Eng. Jpn. 2010, 43, 1014–1019. [Google Scholar] [CrossRef]
- Arvin, E.; Pedersen, L.-F. Hydrogen peroxide decomposition kinetics in aquaculture water. Aquacult. Eng. 2015, 64, 1–7. [Google Scholar] [CrossRef]
- Ghadermarzi, M.; Moosavi-Movahedi, A.A. Determination of the Kinetic Parameters for the “Suicide Substrate” Inactivation of Bovine Liver Catalase by Hydrogen Peroxide. J. Enzyme Inhib. 1996, 10, 167–175. [Google Scholar] [CrossRef] [PubMed]
- Trawczyńska, I. New Method of Determining Kinetic Parameters for Decomposition of Hydrogen Peroxide by Catalase. Catalysts 2020, 10, 323–335. [Google Scholar] [CrossRef] [Green Version]
- George, P. Reaction between catalase and hydrogen peroxide. Nature 1947, 160, 41–43. [Google Scholar] [CrossRef] [PubMed]
- Do, D.D.; Weiland, R.H. Consistency between rate expressions for enzyme reactions and deactivation. Biotechnol. Bioeng. 1980, 22, 1087–1093. [Google Scholar] [CrossRef]
- Vasudevan, P.T.; Weiland, R.H. Deactivation of catalase by hydrogen peroxide. Biotechnol. Bioeng. 1990, 36, 783–789. [Google Scholar] [CrossRef] [PubMed]
- Vasudeven, P.T.; Weiland, R.H. Immobilized catalase: Deactivation and reactor stability. Biotechnol. Bioeng. 1993, 41, 231–236. [Google Scholar] [CrossRef]
- Do, D.D.; Greenfield, P.F. The concept of an effectiveness factor for reaction problems involving catalyst deactivation. Chem. Eng. J. 1983, 27, 99–105. [Google Scholar] [CrossRef]
- Do, D.D.; Weiland, R.H. Enzyme deactivation in fixed bed reactors with michaelis-menten kinetics. Biotechnol. Bioeng. 1981, 23, 691–705. [Google Scholar] [CrossRef]
- Sun, B.; Zhu, H.; Jin, Y.; Qiao, K.; Xu, W.; Jiang, J. Rapid Hydrogen Peroxide Decomposition Using a Microreactor. Chem. Eng. Technol. 2019, 42, 252–256. [Google Scholar] [CrossRef] [Green Version]
- Ricca, E.; Calabro, V.; Curcio, S.; Iorio, G. Optimization of inulin hydrolysis by inulinase accounting for enzyme time- and temperature-dependent deactivation. Biochem. Eng. J. 2009, 48, 81–86. [Google Scholar] [CrossRef]
- Leow, J.W.H.; Chan, E.C.Y. Atypical Michaelis-Menten kinetics in cytochrome P450 enzymes: A focus on substrate inhibition. Biochem. Pharmacol. 2019, 169, 113615. [Google Scholar] [CrossRef] [PubMed]
- Pinheiro, I.F.; Serrano, H.L.; Sphaier, L.A.; Peixoto, F.C.; Silva, V.N.H. Integral transform analysis of heat and mass diffusion in chemically reacting systems with Michaelis–Menten kinetics. Int. Commun. Heat Mass Transf. 2019, 100, 20–26. [Google Scholar] [CrossRef]
- Burghardt, A.; Bartelmus, G. Models of Heterogeneous Fixed-Bed Catalitic Reactors. In Chemical Reactors Engineering. Part II. Heterogeneous Reactors, 1st ed.; Scientific Publishing Company: Warsaw, Poland, 2001; pp. 170–277. [Google Scholar]
- Illanes, A.; Wilson, L.; Vera, C. Enzyme Kinetics in a Heterogeneous System. In Problem Solving in Enzyme Biocatalysis; John Wiley and Sons Ltd.: Chichester, UK, 2015; pp. 87–140. [Google Scholar]
- Dehkordi, A.M.; Safari, I.; Karima, M. Experimental and Modeling study of catalytic reaction of glucose isomerization: Kinetics and packed-bed dynamic modeling. AlChE J. 2008, 54, 1333–1343. [Google Scholar] [CrossRef]
- Palazzi, E.; Converti, A. Evaluation of diffusional resistances in the process of glucose isomerization to fructose by immobilized glucose isomerase. Enzyme Microb. Technol. 2001, 28, 246–252. [Google Scholar] [CrossRef]
- Harmand, J.; Rapaport, A.; Dochain, D.; Lobry, C. Microbial ecology and bioprocess control: Opportunities and challenges. J. Process Control 2008, 18, 865–875. [Google Scholar] [CrossRef]
- Guay, M.; Dochain, D.; Perrier, M. Adaptive extremum-seeking control of nonisothermal continuous stirred tank reactors. Chem. Eng. Sci. 2005, 60, 3671–3681. [Google Scholar] [CrossRef]
- Harmand, J.; Dochain, D. The optimal design of two interconnected (bio)chemical reactors revisited. Comput. Chem. Eng. 2005, 30, 70–82. [Google Scholar] [CrossRef]
- Grubecki, I.; Wójcik, M. How much of enzyme can be saved in the process with the optimal temperature control? J. Food Eng. 2013, 116, 255–259. [Google Scholar] [CrossRef]
- Rade, L.L.; Lemos, C.O.T.; Barrozo, M.A.d.S.; Ribas, R.M.; Monteiro, R.d.S.; Hori, C.E. Optimization of esterification reaction over niobium phosphate in a packed bed tubular reactor. Renew. Energy 2019, 131, 348–355. [Google Scholar] [CrossRef]
Figure 1.
Mass and energy transport mechanism in a reactor packed with immobilized enzyme.

Figure 2.
Effectiveness factor ηeff describing external (ηeff = ηEDR, black surface) and global (ηeff = ηG, blue surface) diffusional resistances as a function of volumetric flux (Q) and feed temperature (TIn).
Figure 2.
Effectiveness factor ηeff describing external (ηeff = ηEDR, black surface) and global (ηeff = ηG, blue surface) diffusional resistances as a function of volumetric flux (Q) and feed temperature (TIn).

Figure 3.
The comparison of the observed time-averaged HP conversion obtained for OFT with those calculated from Equation (16) for ηeff = ηEDR.
Figure 3.
The comparison of the observed time-averaged HP conversion obtained for OFT with those calculated from Equation (16) for ηeff = ηEDR.
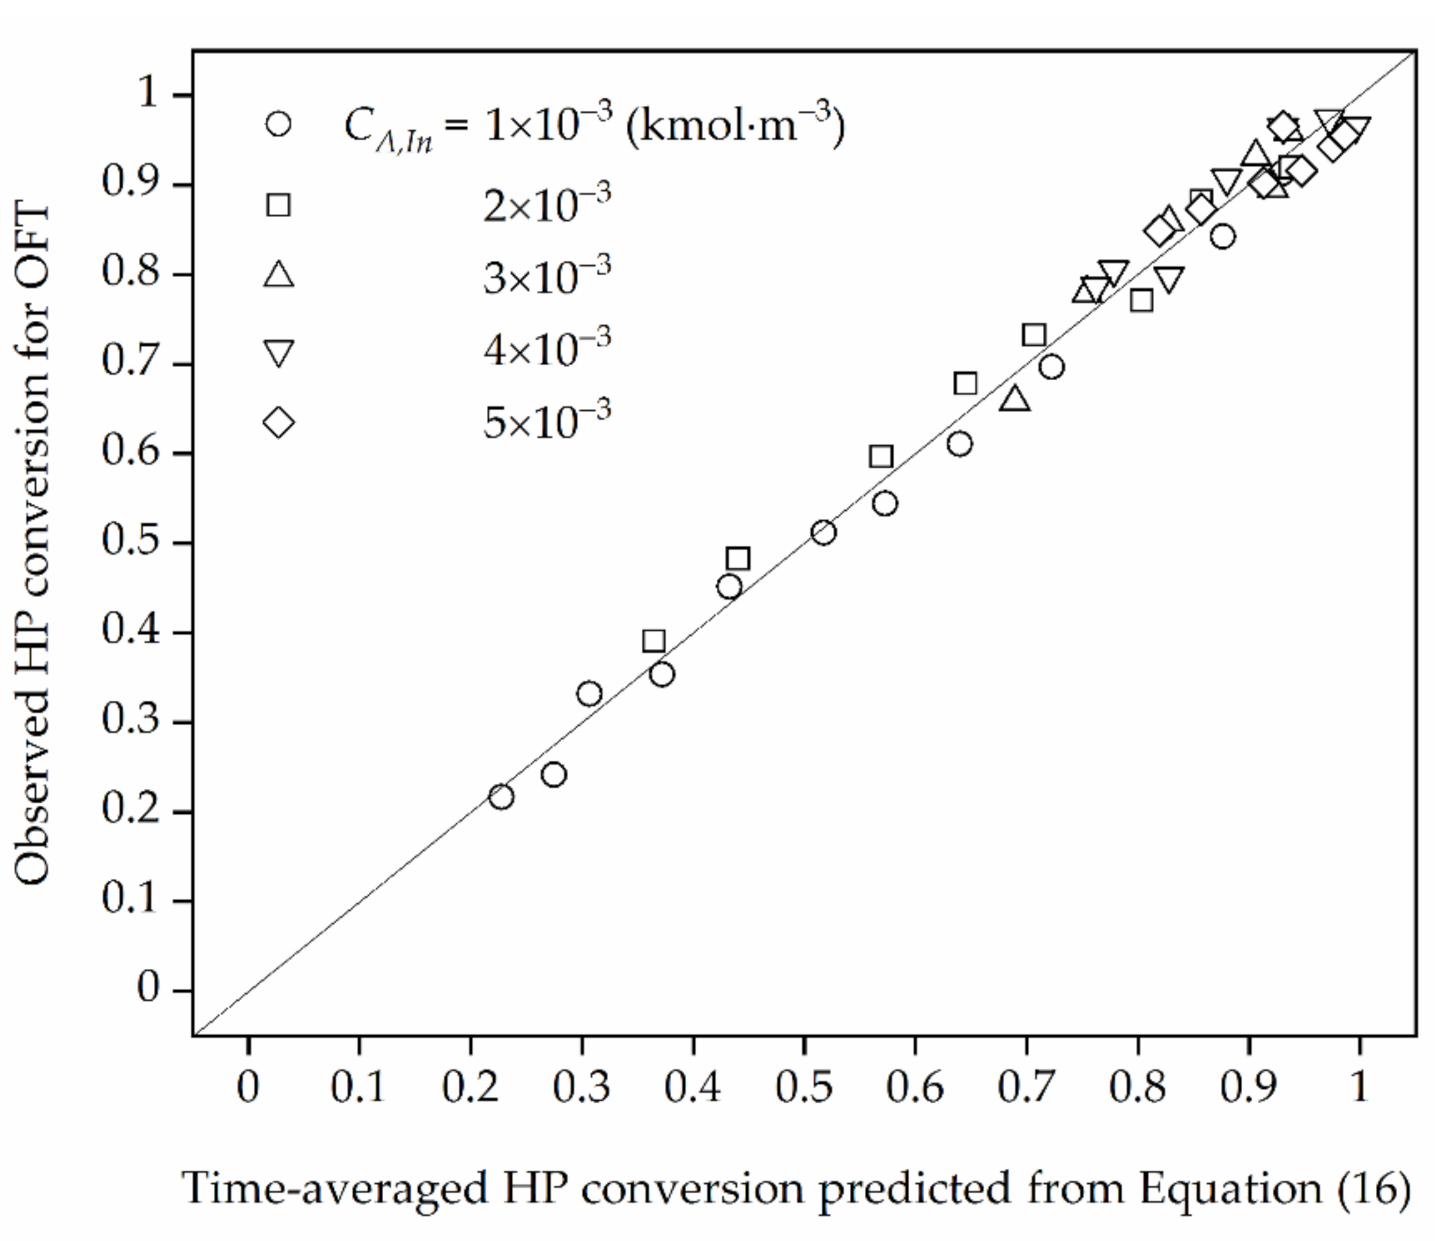
Figure 4.
The effect of the feed temperature (TIn) and feed flow rate (Q) on time-averaged HP conversion (black line) at the reactor outlet and average TUC activity (blue line) for CA,In = 3 × 10⁻³ kmol⋅m−3. The open symbols represent the maximum conversion values (lines 2–5) or the highest ones (lines 1 and 6). For Q × 108 = 57 m⋅s−1 and 7 m3⋅s−1 OFT is slightly higher than at 293 K and slightly lower than at 323 K, respectively. However, for clarity of this figure the lines corresponding to this feed flow rate values have been disregarded.
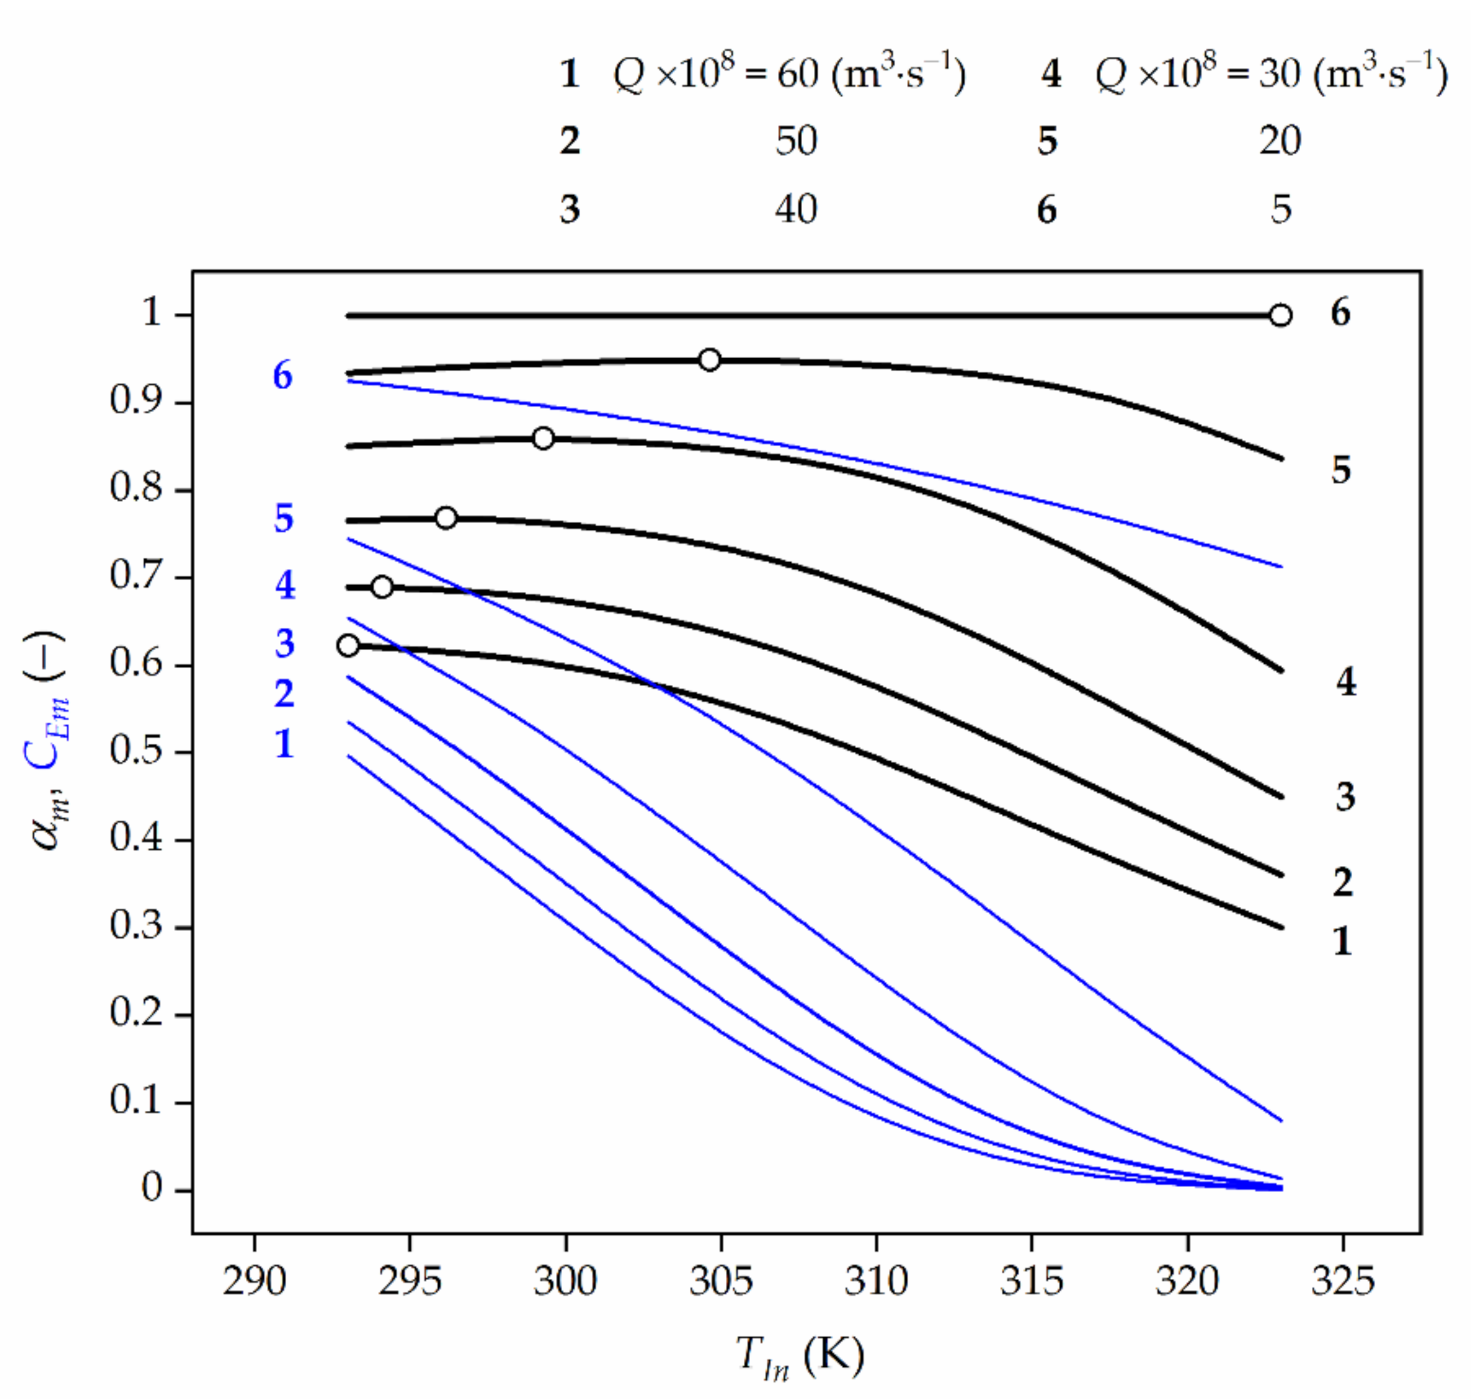
Figure 5.
Effect of feed temperature (TIn) and feed HP concentration (CA,In) on the average HP conversion (black lines) at the reactor outlet as well as TUC activity (blue lines) for the final biocatalyst age. Open symbols represent the maximum HP conversion.
Figure 5.
Effect of feed temperature (TIn) and feed HP concentration (CA,In) on the average HP conversion (black lines) at the reactor outlet as well as TUC activity (blue lines) for the final biocatalyst age. Open symbols represent the maximum HP conversion.

Figure 6.
Effect of feed temperature (TIn) and initial TUC activity (β1) on the average HP conversion (black lines) at the reactor outlet as well as TUC activity (blue line). Open symbols represent the maximum HP conversion.
Figure 6.
Effect of feed temperature (TIn) and initial TUC activity (β1) on the average HP conversion (black lines) at the reactor outlet as well as TUC activity (blue line). Open symbols represent the maximum HP conversion.

Figure 7.
Effect of the feed temperature, TIn, and biocatalyst pellet size, dP, on time-averaged HP conversion at the bioreactor outlet for feed HP concentration of CA,In = 3 × 10⁻³ kmol⋅m−3. Black lines represent HP conversion for Q = 20 × 10−8 m3⋅s−1, while blue lines for Q = 40 × 10−8 m3⋅s−1, respectively. Open symbols represent the maximum values of HP conversion.

Figure 8.
Schematic diagram of FXBR for decomposition process of HP.

Figure 9.
Integration constant, C, as a function of biocatalyst age, τf.


Table 1.
Activation energies and frequency factors in Arrhenius equation for reaction and enzyme deactivation.
Table 1.
Activation energies and frequency factors in Arrhenius equation for reaction and enzyme deactivation.
| Reaction of HPD | |
| Activation energy (kJ⋅mol−1) | ER = 12.6 ± 0.3 |
| Frequency factor (s−1) | kR0am = 48.00 ± 5.38 |
| Parallel deactivation of TUC | |
| Activation energy (kJ⋅mol−1) | ED = 49.7 ± 1.2 |
| Frequency factor (m3⋅kmol−1⋅s−1) | kD0 = (2.77 ± 5.38) × 107 |
Table 2.
Effect of feed flow rate and pellet diameter on external and global effectiveness factors.
| Q = 20 × 10−8 (m3⋅s−1) | Q = 40 × 10−8 (m3⋅s−1) | |||||
|---|---|---|---|---|---|---|
| dP × 104 (m) | 5 | 10 | 15 | 5 | 10 | 15 |
| ηEDR × 100 | 49.54 | 27.55 | 17.93 | 60.34 | 37.08 | 25.29 |
| ηG × 100 | 20.51 | 9.451 | 5.876 | 24.29 | 11.60 | 7.352 |
Table 3.
Results from exploratory fittings of the integration constant C to the biocatalyst age τf.
| Approximation | R2 (COD) | SSE | RMSE |
|---|---|---|---|
| Linear | 0.9760 | 7,644,101 | 271.1 |
| Quadratic | 0.9956 | 1,393,490 | 115.7 |
| Cubic | 0.9987 | 406,419 | 62.50 |
| Fourth degree | 0.9995 | 171,130 | 40.56 |
Publisher’s Note: MDPI stays neutral with regard to jurisdictional claims in published maps and institutional affiliations. |
© 2020 by the author. Licensee MDPI, Basel, Switzerland. This article is an open access article distributed under the terms and conditions of the Creative Commons Attribution (CC BY) license (http://creativecommons.org/licenses/by/4.0/).
Share and Cite
MDPI and ACS Style
Grubecki, I. Analytical Determination of the Optimal Feed Temperature for Hydrogen Peroxide Decomposition Process Occurring in Bioreactor with a Fixed-Bed of Commercial Catalase. Catalysts 2021, 11, 35. https://doi.org/10.3390/catal11010035
AMA Style
Grubecki I. Analytical Determination of the Optimal Feed Temperature for Hydrogen Peroxide Decomposition Process Occurring in Bioreactor with a Fixed-Bed of Commercial Catalase. Catalysts. 2021; 11(1):35. https://doi.org/10.3390/catal11010035
Chicago/Turabian StyleGrubecki, Ireneusz. 2021. "Analytical Determination of the Optimal Feed Temperature for Hydrogen Peroxide Decomposition Process Occurring in Bioreactor with a Fixed-Bed of Commercial Catalase" Catalysts 11, no. 1: 35. https://doi.org/10.3390/catal11010035
Note that from the first issue of 2016, this journal uses article numbers instead of page numbers. See further details here.