Article

Integrating an Expert System, GIS, and Satellite Remote Sensing to Evaluate Land Suitability for Sustainable Tea Production in Bangladesh

1
Graduate School of Life and Environmental Sciences, University of Tsukuba, Ibaraki 305-8572, Japan
2
Faculty of Agriculture, Sylhet Agricultural University, Sylhet 3100, Bangladesh
3
Faculty of Life and Environmental Sciences, University of Tsukuba, Ibaraki 305-8572, Japan
*
Author to whom correspondence should be addressed.
Remote Sens. 2020, 12(24), 4136; https://doi.org/10.3390/rs12244136
Submission received: 17 November 2020 / Revised: 10 December 2020 / Accepted: 11 December 2020 / Published: 17 December 2020

Abstract

:
Land evaluation is important for assessing environmental limitations that inhibit higher yield and productivity in tea. The aim of this research was to determine the suitable lands for sustainable tea production in the northeastern part of Bangladesh using phenological datasets from remote sensing, geospatial datasets of soil–plant biophysical properties, and expert opinions. Sentinel-2 satellite images were processed to obtain layers for land use and land cover (LULC) as well as the normalized difference vegetation index (NDVI). Data from the Shuttle Radar Topography Mission (SRTM) were used to generate the elevation layer. Other vector and raster layers of edaphic, climatic parameters, and vegetation indices were processed in ArcGIS 10.7.1® software. Finally, suitability classes were determined using weighted overlay of spatial analysis based on reclassified raster layers of all parameters along with the results from multicriteria analysis. The results of the study showed that only 41,460 hectares of land (3.37% of the total land) were in the highly suitable category. The proportions of moderately suitable, marginally suitable, and not suitable land categories for tea cultivation in the Sylhet Division were 9.01%, 49.87%, and 37.75%, respectively. Thirty-one tea estates were located in highly suitable areas, 79 in moderately suitable areas, 24 in marginally suitable areas, and only one in a not suitable area. Yield estimation was performed with the NDVI (R2 = 0.69, 0.66, and 0.67) and the LAI (R2 = 0.68, 0.65, and 0.63) for 2017, 2018, and 2019, respectively. This research suggests that satellite remote sensing and GIS application with the analytical hierarchy process (AHP) could be used by agricultural land use planners and land policy makers to select suitable lands for increasing tea production.

Graphical Abstract

1. Introduction

Land suitability analysis is important for sustainable land resource planning and management [1]. A range of parameters, e.g., soil conditions, topography, state of the climate, and vegetation indices are considered to evaluate land suitability [2,3]. Such evaluation provides information about specific land use potentials and constraints. Effective management along with proper land use decisions results in higher productivity of land as well as a sustained environment [4]. For sustainable land resource management, the Food and Agricultural Organization (FAO) proposed guidelines for land evaluation [5]. According to the guidelines, land is classified into four categories: highly suitable (S1), moderately suitable (S2), marginally suitable (S3), and not suitable (N) [6,7]. The rapidly growing population as well as global warming exerts considerable pressure on scarce land resources all over the world [8]. The yield of plantation crops such as tea is decreasing due to the effects of drought and land degradation caused by climate change, especially changes in rainfall and temperature [9]. Therefore, determining suitable lands and climate for tea to obtain maximum yield and production is urgent. In addition, it is imperative to utilize fallow lands, hilly areas, and islands for sustainable land management for tea production.
Tea (Camellia sinensis L. (O.) Kuntze) is a valuable cash crop as well as a popular beverage crop and is renowned for its nutritional, medicinal, antimicrobial, and anticancer properties throughout the world [10,11,12]. Bangladesh is one of the world’s major tea-producing countries. Tea cultivation in Bangladesh began in the British colonial period in 1854. Most of Bangladesh’s tea is produced in the Sylhet Division, and approximately 96% is cultivated in three districts of the Sylhet Division. Among these districts, Moulvibazar produces 63% of the tea and Sylhet and Habiganj combinedly produce 33% [13]. At present, the country has 167 tea estates that produce approximately 96.07 million kilograms of tea annually with an average yield of 1768.52 kg/ha [14]. The tea industry of Bangladesh annually earns roughly BDT 1.775 billion (0.81% of GDP) in foreign currency, exporting nearly 18 million kilograms of tea (1.37% of the export of the global tea trade) [15]. According to world rankings, China ranked first, producing 2350 million kg of tea, followed by India (1267 million kg), Kenya (473 million kg), Sri Lanka (293 million kg), Turkey (253 million kg), Vietnam (180 million kg), Indonesia (125 million kg), Argentina (84 million kg), and Bangladesh (83 million kg). Thus, Bangladesh ranked 9th in tea production [16]. The global production of tea has increased tremendously over the last 50 years. In addition, the average yield per hectare of tea in Bangladesh is apparently lower than that in other major tea-producing countries. The drawback to the higher tea yield in Bangladesh is the existence of marginally suitable lands with unfavorable climates [14]. For this reason, the selection of suitable lands is crucial in making proper use of available lands for tea production. Tea growers establish estates based on conventional knowledge and experience without utilizing scientific information or methods of validation. They consider site suitability rather than using appropriate information. This also adversely impacts production in the long term, exacerbating environmental problems in tea-growing areas [1].
With advances in information and communication technology, land suitability evaluation has been performed using geographical information system (GIS) and satellite remote sensing techniques [17]. In addition, important criteria for sustainable tea production must be considered in the analytical hierarchy process (AHP) for prioritizing experts’ opinions in accordance with the weight obtained from consistent GIS results [7]. Satellite remote sensing with a GIS-based AHP is a robust tool for spatial decision-making processes for land suitability analysis [6]. The results of land suitability evaluation should be validated with obtained yield data. Research on yield estimation of agricultural crops indicates that remote sensing techniques alone are not capable of accurate yield estimation [18]. To improve accuracy, the actual yield of individual tea estates should be incorporated with remote sensing data.
Multiple studies have been undertaken to evaluate land suitability for tea. Land suitability evaluation was performed in Sri Lanka using a GIS-based multicriteria approach [1]. A land suitability assessment was performed for tea and orange in the Nghe An Province of Vietnam using land suitability evaluation (LSE) software by considering several ecological criteria [19]. A comprehensive suitability evaluation for tea was carried out in Zhejiang Province of China using a Geographic Information System (GIS), and a modified land ecological suitability evaluation model showed the scientific basis for land suitability and the planting distribution of tea crops [20]. A GIS-based land use suitability assessment for forests and tea crops was performed by Chanhda et al., (2010) along the Laos–China border, while Gahlod et al., (2017) carried out research to assess the suitability of land for cardamom, rubber, and tea using geospatial techniques in Kerala, India by considering various physicochemical parameters [21,22]. Those studies provided information regarding the constraints of land use for tea and opportunities for decision making as well as optimal utilization of land resources [23].
Suitability analysis facilitates the recognition of marginally suitable lands with limiting factors that aid decision makers in developing appropriate crop management systems for increasing the productivity of land [22]. Upon consideration of suitability analysis results, it is urgent to implement further initiatives for turning unproductive tea estates into productive estates by adopting better management practices. This will also allow tea planters on new plantations to work in highly suitable and moderately suitable fallow lands [1]. Therefore, it has been necessary to perform land suitability analysis by considering other crop requirements. Accordingly, no studies regarding land suitability evaluation for tea in Bangladesh to increase production have been performed. In addition, further research initiative is required to utilize bio-physical and vegetative parameters for yield estimation of tea estates in relation to land suitability analysis. Therefore, a comprehensive study utilizing physical, climatic, and vegetative parameters for sustainable land use and higher productivity of tea was undertaken. This study has attempted to evaluate land suitability, considering multiple criteria to ensure long-term progress in the tea industry. This land suitability evaluation could also improve land use policy for the sustainable management of lands in tea-growing areas in order to increase tea production in Bangladesh.

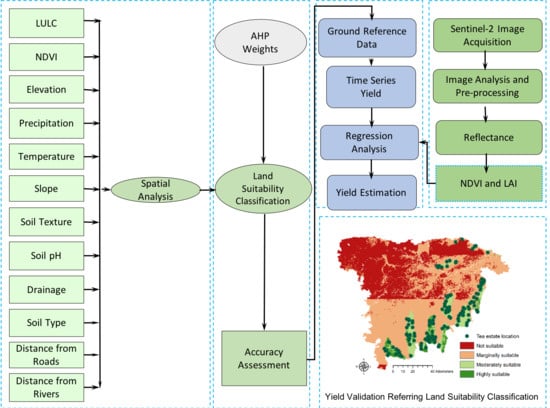
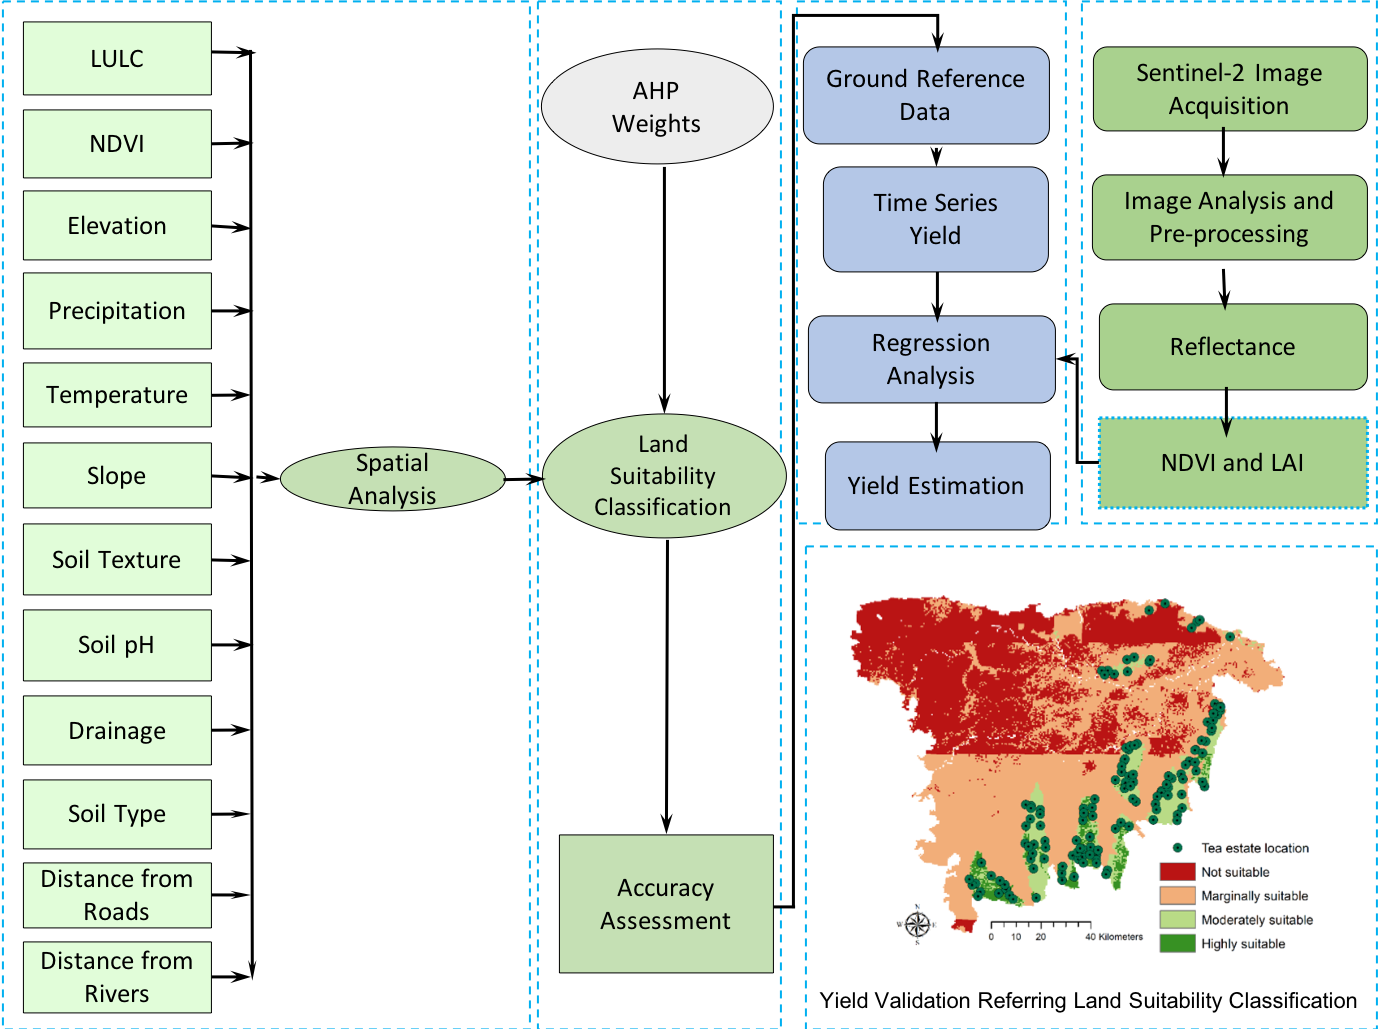
2. Materials and Methods
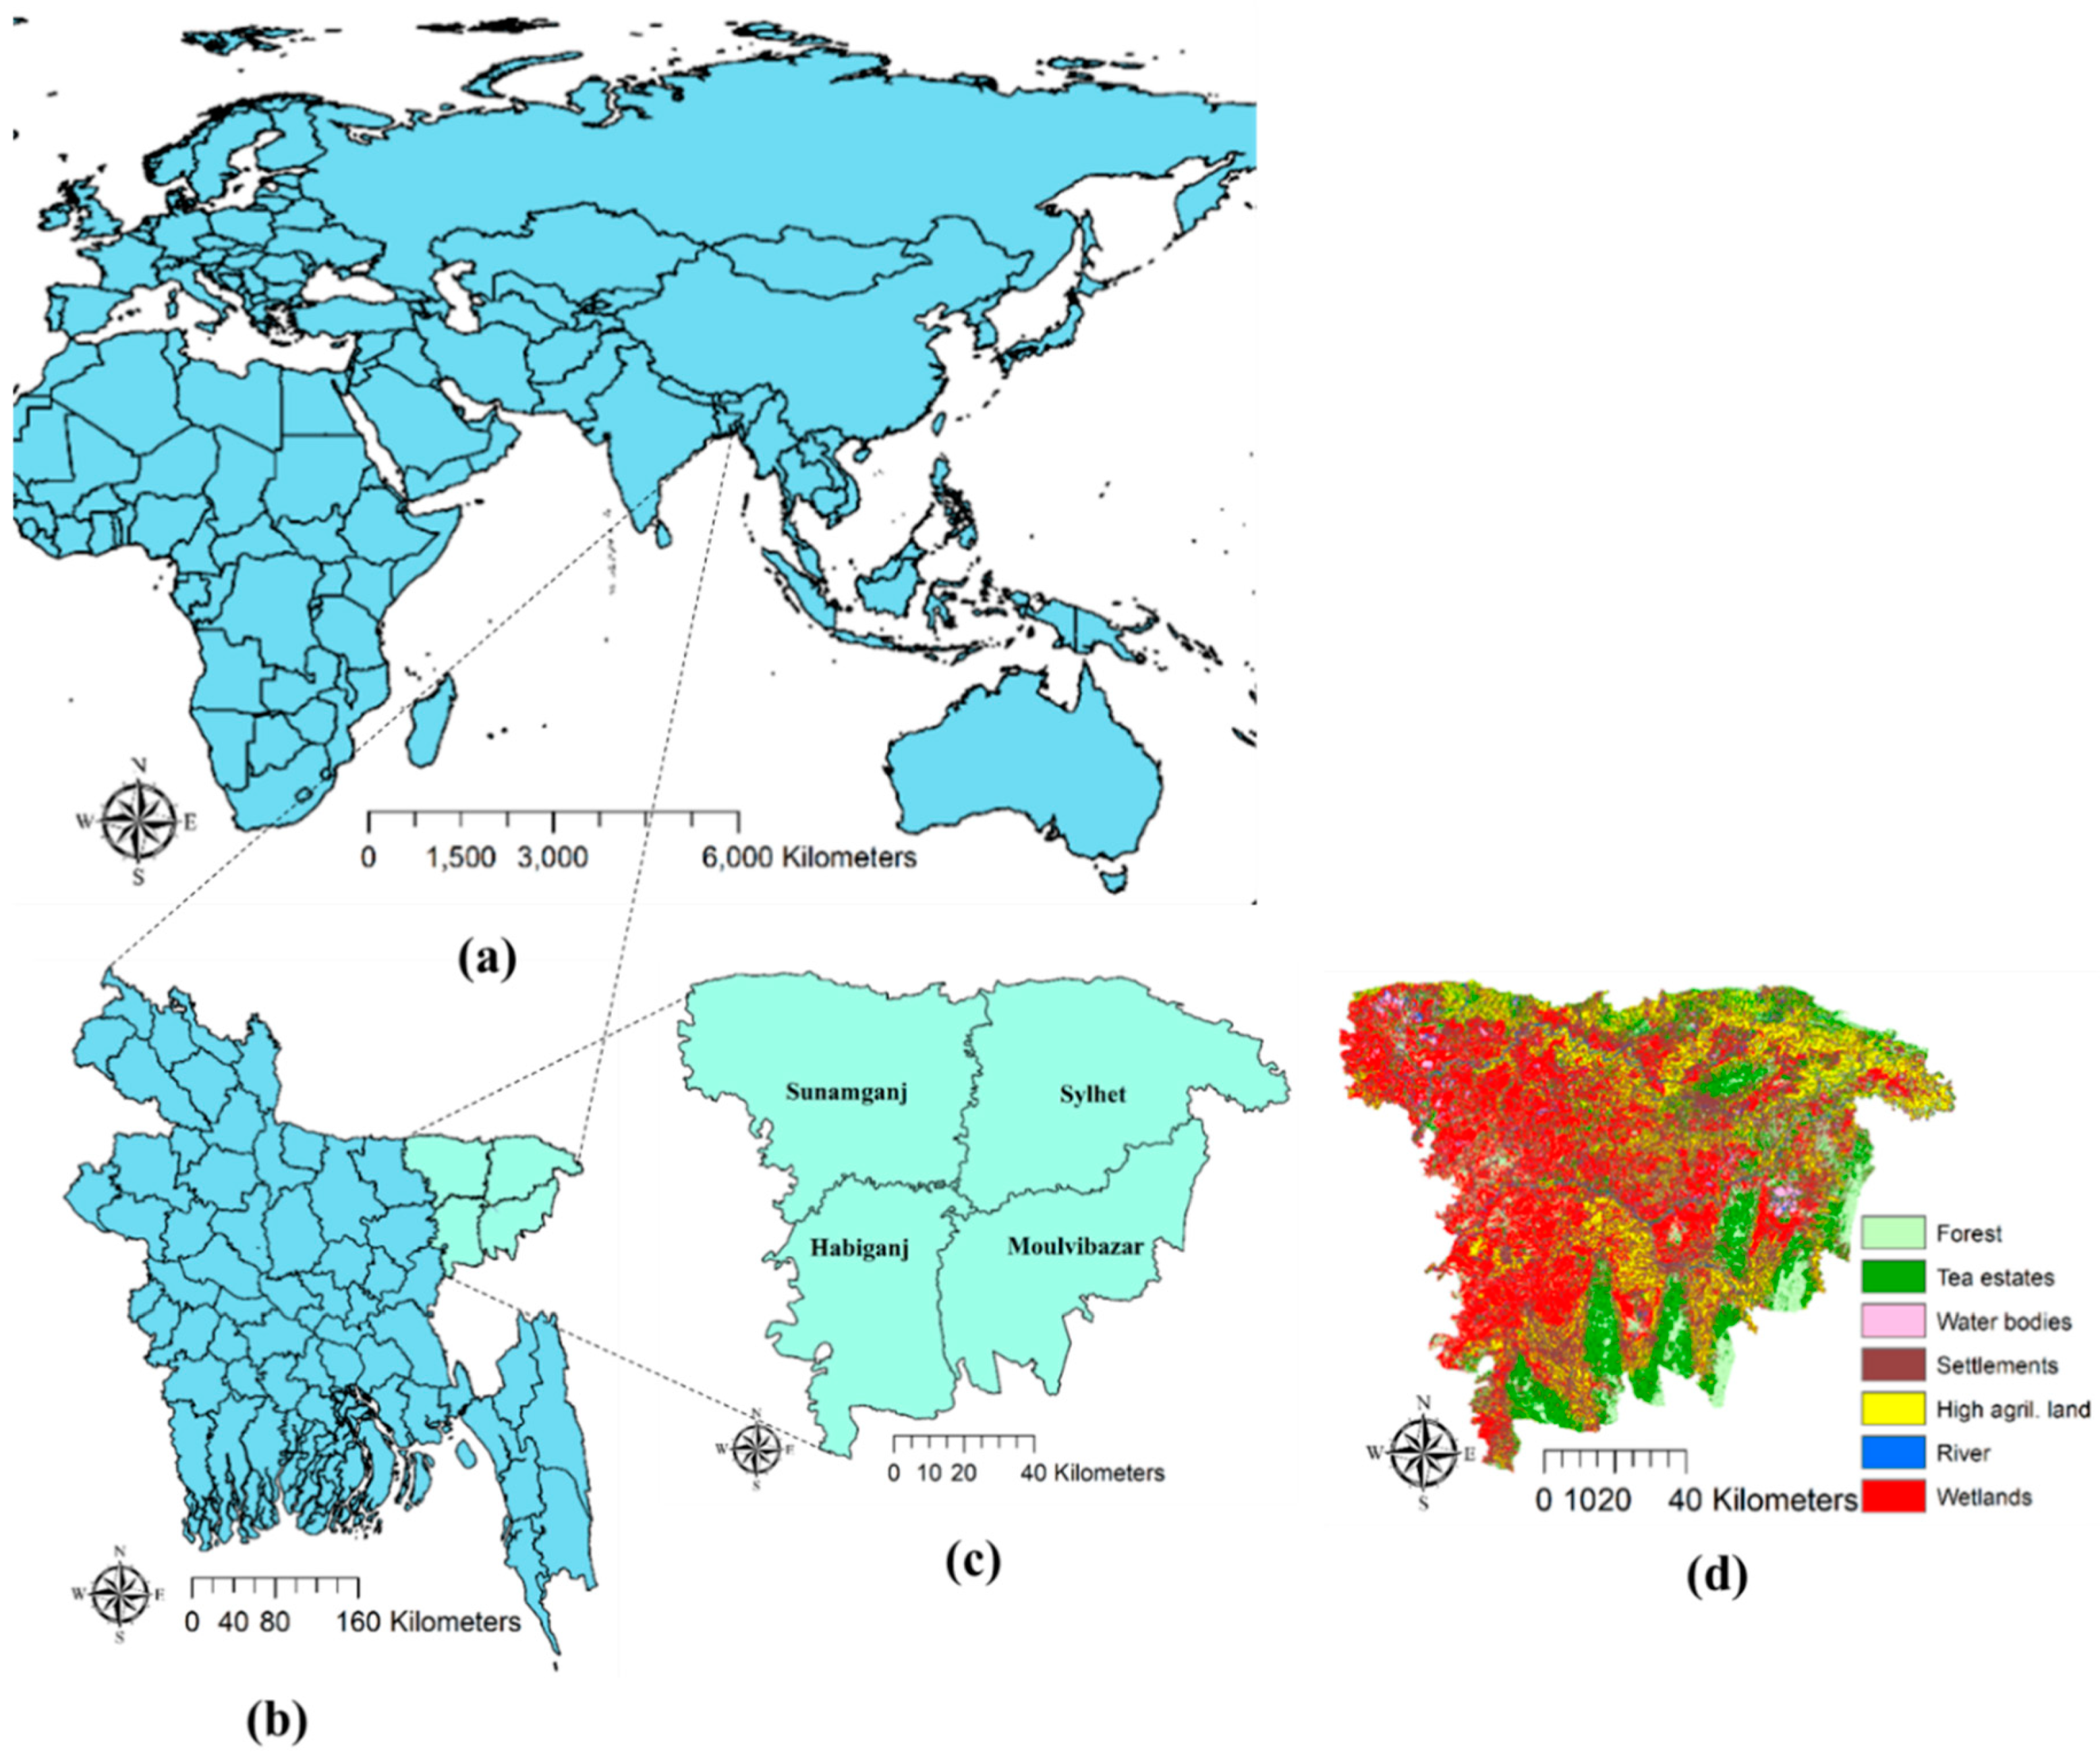
Sentinel-2 multispectral instrument (MSI) satellite images were utilized as the remote sensing dataset, and certain vector-layered edaphic and climatic geodata were processed to develop the map for suitability analysis. The criteria were categorized into four types for land selection of tea according to FAO guidelines. Primary data as well as ground reference information were obtained through fieldwork using a global positioning system (GPS) receiver to locate the tea estates in the study area.

2.1. Study Area

The study area is the Sylhet Division, located in the northeastern part of Bangladesh, and consists of four districts—Habiganj, Moulvibazar, Sunamganj, and Sylhet, which include 38 subdistricts (Figure 1).
The population size of this locality is approximately 10 million, which is less than 7% of the total population of Bangladesh. The study area lies between the latitudes of 23°58′ and 25°12′ north and the longitudes of 90°56′ and 92°30′ east. The area is surrounded by the Indian states of Meghalaya, Assam, and Tripura to the north, east, and south, respectively, and divisions of Chattogram to the southwest and Dhaka and Mymensingh to the west. The area of land within the study area is 1,229,840 hectares and the elevation is less than 335 m. The study area receives an adequate amount of rainfall in the monsoon season that is favorable for tea cultivation.

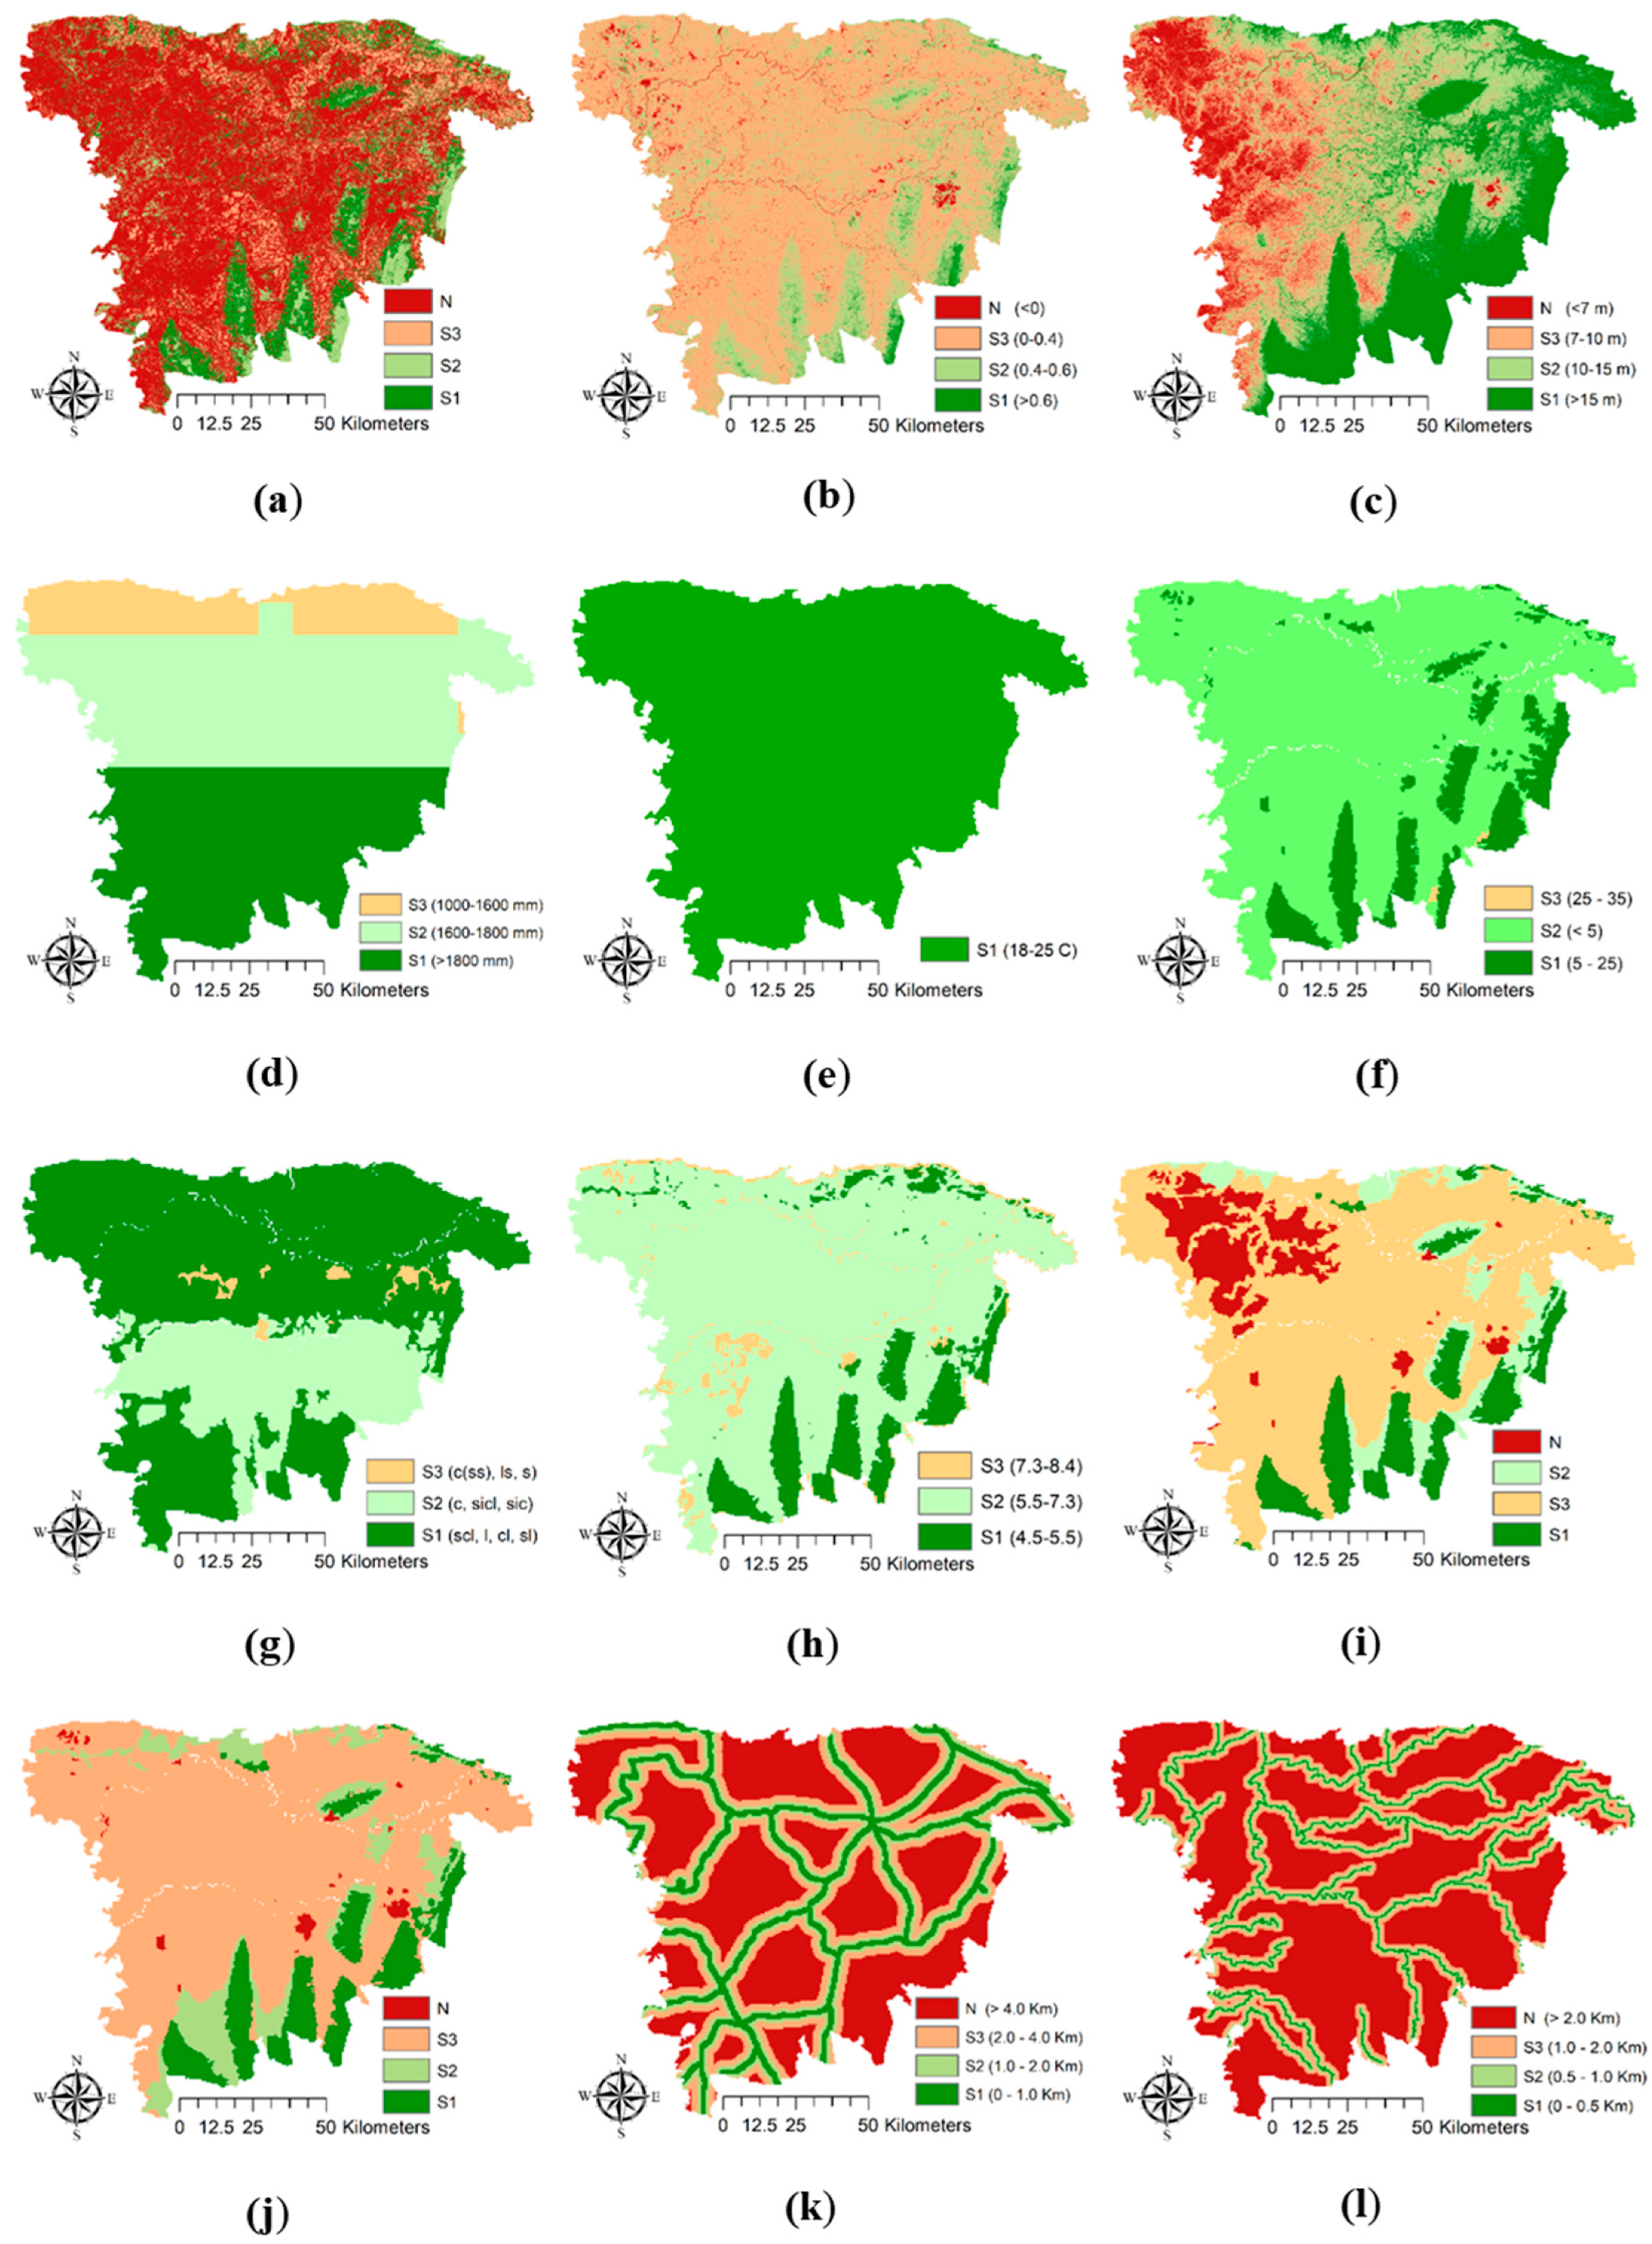
2.2. Criteria for Suitability Analysis

Twelve criteria—land use and land cover (LULC), the normalized difference vegetation index (NDVI), elevation, precipitation, temperature, slope, soil texture, pH, drainage, soil type, distance from roads, and distance from rivers—were considered to determine suitable land for tea cultivation (Table 1, Figure 2, and Appendix A).

2.2.1. Land Use and Land Cover

Land use and land cover (LULC) data were utilized to evaluate the lands for forests, tea estates, high agricultural lands, settlements, water bodies, rivers, and wetlands. According to land use and land cover, the majority of the study area was occupied by forests, tea estates, high agricultural lands, and wetlands for rice cultivation. LULC was built from Sentinel-2 datasets with 20 m resolution and processed using the maximum supervised likelihood classification in ArcGIS®. The raster layer for LULC was categorized into seven classes: forests, tea estates, high agricultural lands, settlements, water bodies, rivers, and wetlands (Table 2). The forest class consisted mostly of national reserve forests; the settlements consisted of households, public offices, and other infrastructures; and the water bodies consisted of areas of water such as beels, ponds, and lakes; a larger portion of the Sylhet Division is a low-lying area occupied by haor, a wetland ecosystem [24].
An accuracy assessment was performed to calculate the accuracy of the LULC classification. According to the accuracy assessment for LULC, user accuracy (UA), producer accuracy (PA), and overall accuracy (OA) were determined. UA was calculated from the total correct samples in rows divided by the total reference samples in each row. PA was determined from the total correct samples in a column divided by the total reference samples in each column. OA was calculated from the total samples along the matrix diagonal from the reference divided by the total samples.
UA = Number   of   correctly   classified   pixels   in   each   category Total   number   of   classified   pixels   in   that   category ( the   row   total ) × 100
PA = Number   of   correctly   classified   pixels   in   each   category Total   number   of   reference   pixels   in   that   category ( the   column   total ) × 100
OA = Total   number   of   correctly   classified   pixels ( Diagonal ) Total   number   of   reference   pixels × 100

2.2.2. Normalized Difference Vegetation Index (NDVI)

The NDVI is a vegetation index correlated with various biophysical parameters and different crop indices [25,26,27]. The proportion of green biomass sensed or captured in satellites is important for vegetation monitoring. Apart from this, the NDVI is used to measure the phenological variations in vegetation. Tea is a perennial crop that exhibits active vegetative growth in the monsoon season from March to November, and harvesting occurs within this time. In this study, the NDVI was calculated for tea plantations using Sentinel-2 satellite images. The map for the NDVI was developed using extraction by masking from Sentinel-2 images to distinguish the vegetation status of this area.

2.2.3. Elevation

Tea grows in a wide range of elevations from sea level to approximately 2200 m [1,28]. Tea is planted in the flat valleys of Assam, India at an elevation ranging from a few meters to approximately 200 m above sea level, while on the hill slopes of Darjeeling, it is cultivated up to an altitude of 2000 m. The elevation in the Sylhet Division ranges from −55 to 335 m. Most of the highland area is free from water logging and suitable for tea cultivation, despite the higher topographic elevation [29]. The elevation data were extracted using the Shuttle Radar Topography Mission (SRTM), 2019, NASA, with a 30 m resolution.

2.2.4. Precipitation

Moderate temperatures with high precipitation are favorable for tea cultivation, although tea is susceptible to water stress. Tea plants require an average minimum rainfall of 1000 mm per year, but 1800–2000 mm is optimal [22]. The study area is characterized by higher rainfall of between 1000 and 2300 mm/year. Rainfall data were collected from the Bangladesh Agricultural Research Council and converted to a raster file. The raster file was processed according to the mean monthly rainfall data from March to November, when tea plants grow vigorously [30].

2.2.5. Temperature

The growth of tea plants is highly influenced by temperature. The yield of tea is also affected by increased average monthly temperature as well as constant higher temperature for longer periods. Temperature regimes below 13 °C and above 30 °C have been observed as detrimental for the shoot growth of tea plants [1]. In the growing season, plants grow satisfactorily at temperatures ranging between 18 °C and 25 °C, which matched the temperatures of the study area [22].

2.2.6. Slope

Land slope affects erosion and surface runoff due to its microclimate variation. Slope also affects other soil properties, such as the soil moisture percentage, the proportion of clay materials, and the availability of other nutrients, such as nitrogen, calcium, and magnesium [31]. Land slopes ranging between 5° and 25° are optimal for tea cultivation. A slope gradient greater than 35° is considered unsuitable because it encourages soil erosion and landslides. Moreover, flattened slopes are also unsuitable for tea cultivation, as they may cause waterlogged conditions [1]. Slope data were obtained from the Bangladesh Agricultural Research Council (BARC), 2019.

2.2.7. Soil Texture

Soil texture is considered an important criterion, as it influences other soil properties such as bulk density, hydraulic conductivity, and the water holding capacity. Tea plants gown in loamy soils produce leaves containing higher proportions of polyphenols, caffeine, and amino acids that are related to an adequate supply of soil nutrients, increased microbial activity, and effectiveness of nitrogenous fertilizer. Soils with higher clay and sand contents are worse than loamy soil in terms of moisture and nutrient holding capacity along with favorable microbial activities [32]. Textural classes designed for potential tea soils were considered according to Gahlod et al., (2017) [22].

2.2.8. Soil pH

Tea usually grows well in soils with lower pH levels ranging from 4.5 to 5.5 [33]. Soil pH may further decline with the use of nitrogenous fertilizers such as ammonium sulfate and urea for higher yields. Moreover, tea plants take up larger quantities of A1 ions from soil and thus require an adequate supply of exchangeable Al and Fe ions in the soil [34]. On the other hand, the growth of tea plants in soils is stunted and the mortality rate due to a higher pH level and lower amounts of exchangeable Al, Fe, and Zn [35]. Classification with respect to soil pH was performed according to the guidelines of the Bangladesh Agricultural Research Council [36].

2.2.9. Drainage

Tea plants are sensitive to stagnant water and cannot survive in areas with persistent waterlogging [37,38]. Under waterlogged conditions, tea bushes are thinner with retarded growth and strive to survive in the presence of water-tolerant weeds [39]. Importantly, it has been reported that adequate drainage in tea soils can increase the yield by 30–35% [37]. Tea plants are affected by excess water due to heavy precipitation in the Brahmaputra valley of Assam during the summer monsoons, causing a problem of surplus water disposal [40]. Improved drainage is essential to provide adequate aeration in the root zone of tea plants for proper plant growth as well as to increase production. Drainage also prevents surface runoff to limit soil loss and maintain optimal soil moisture. Therefore, according to Nguyen et al., (2020), soil drainage was considered an important criterion for evaluating land suitability for tea [19].

2.2.10. Soil Type

Tea grows well in the hilly regions of the northeastern part of Bangladesh, which consists of brown hill soils [41]. Piedmont soils are formed within the transition between hills and lowland plains due to the accumulation of sediments from hills. Gray piedmont soils are moderately suitable for tea with respect to their moderate drainage and acidic to almost neutral pH levels [42,43]. Non-calcareous alluvium and brown, dark gray, and gray flood plain soils were formed due to sedimentation in the flood plains, and are thus vulnerable with respect to drainage facilities and nutrient availability for tea plant growth [44,45]. Acidic basin clay soils are mostly observed in the Sylhet basin, but they are not important for agricultural production. Deep red brown terrace soil is the core component of barren lands covered with grasses [41]. Peat soils are not suitable for tea production, as they are found in low-lying areas and wetland ecosystems in Bangladesh, where flooding and waterlogging are common features [46].

2.2.11. Distance from Roads

There are three types of roads in the Sylhet division: highways, district roads, and local roads, including rural and urban roads. Distance from roads was considered because of the need to minimize the transportation costs associated with the tea cultivation input supply as well as export of tea in the country and abroad using highways, districts, and local roads. Minimum distances between fields and roads facilitate the transport of inputs and collected tea leaves. Data for distance from roads were retrieved in polyline vector form and then converted into a raster. Spatial analysis was performed to measure the distances using the Euclidean distance. Reclassification of the distances from roads was performed according to Pramanik (2016) [47].

2.2.12. Distance from Rivers

The Sylhet division is crossed by the Surma, Kushiyara, Khowai, and Manu river as well as a large number of small rivers, which are part of the watershed in this area. Distances from rivers may also facilitate transport of input materials as well as processed tea leaves. In addition, it may be the source of irrigation water during the drought season. The data for distances from rivers were retrieved as a polyline vector and then converted into raster data. Once the vector data were converted to raster form, they were analyzed using Euclidean distance to calculate the distance from rivers. The study area with respect to distance from rivers was extracted by masking followed by reclassification according to the shortest distances.

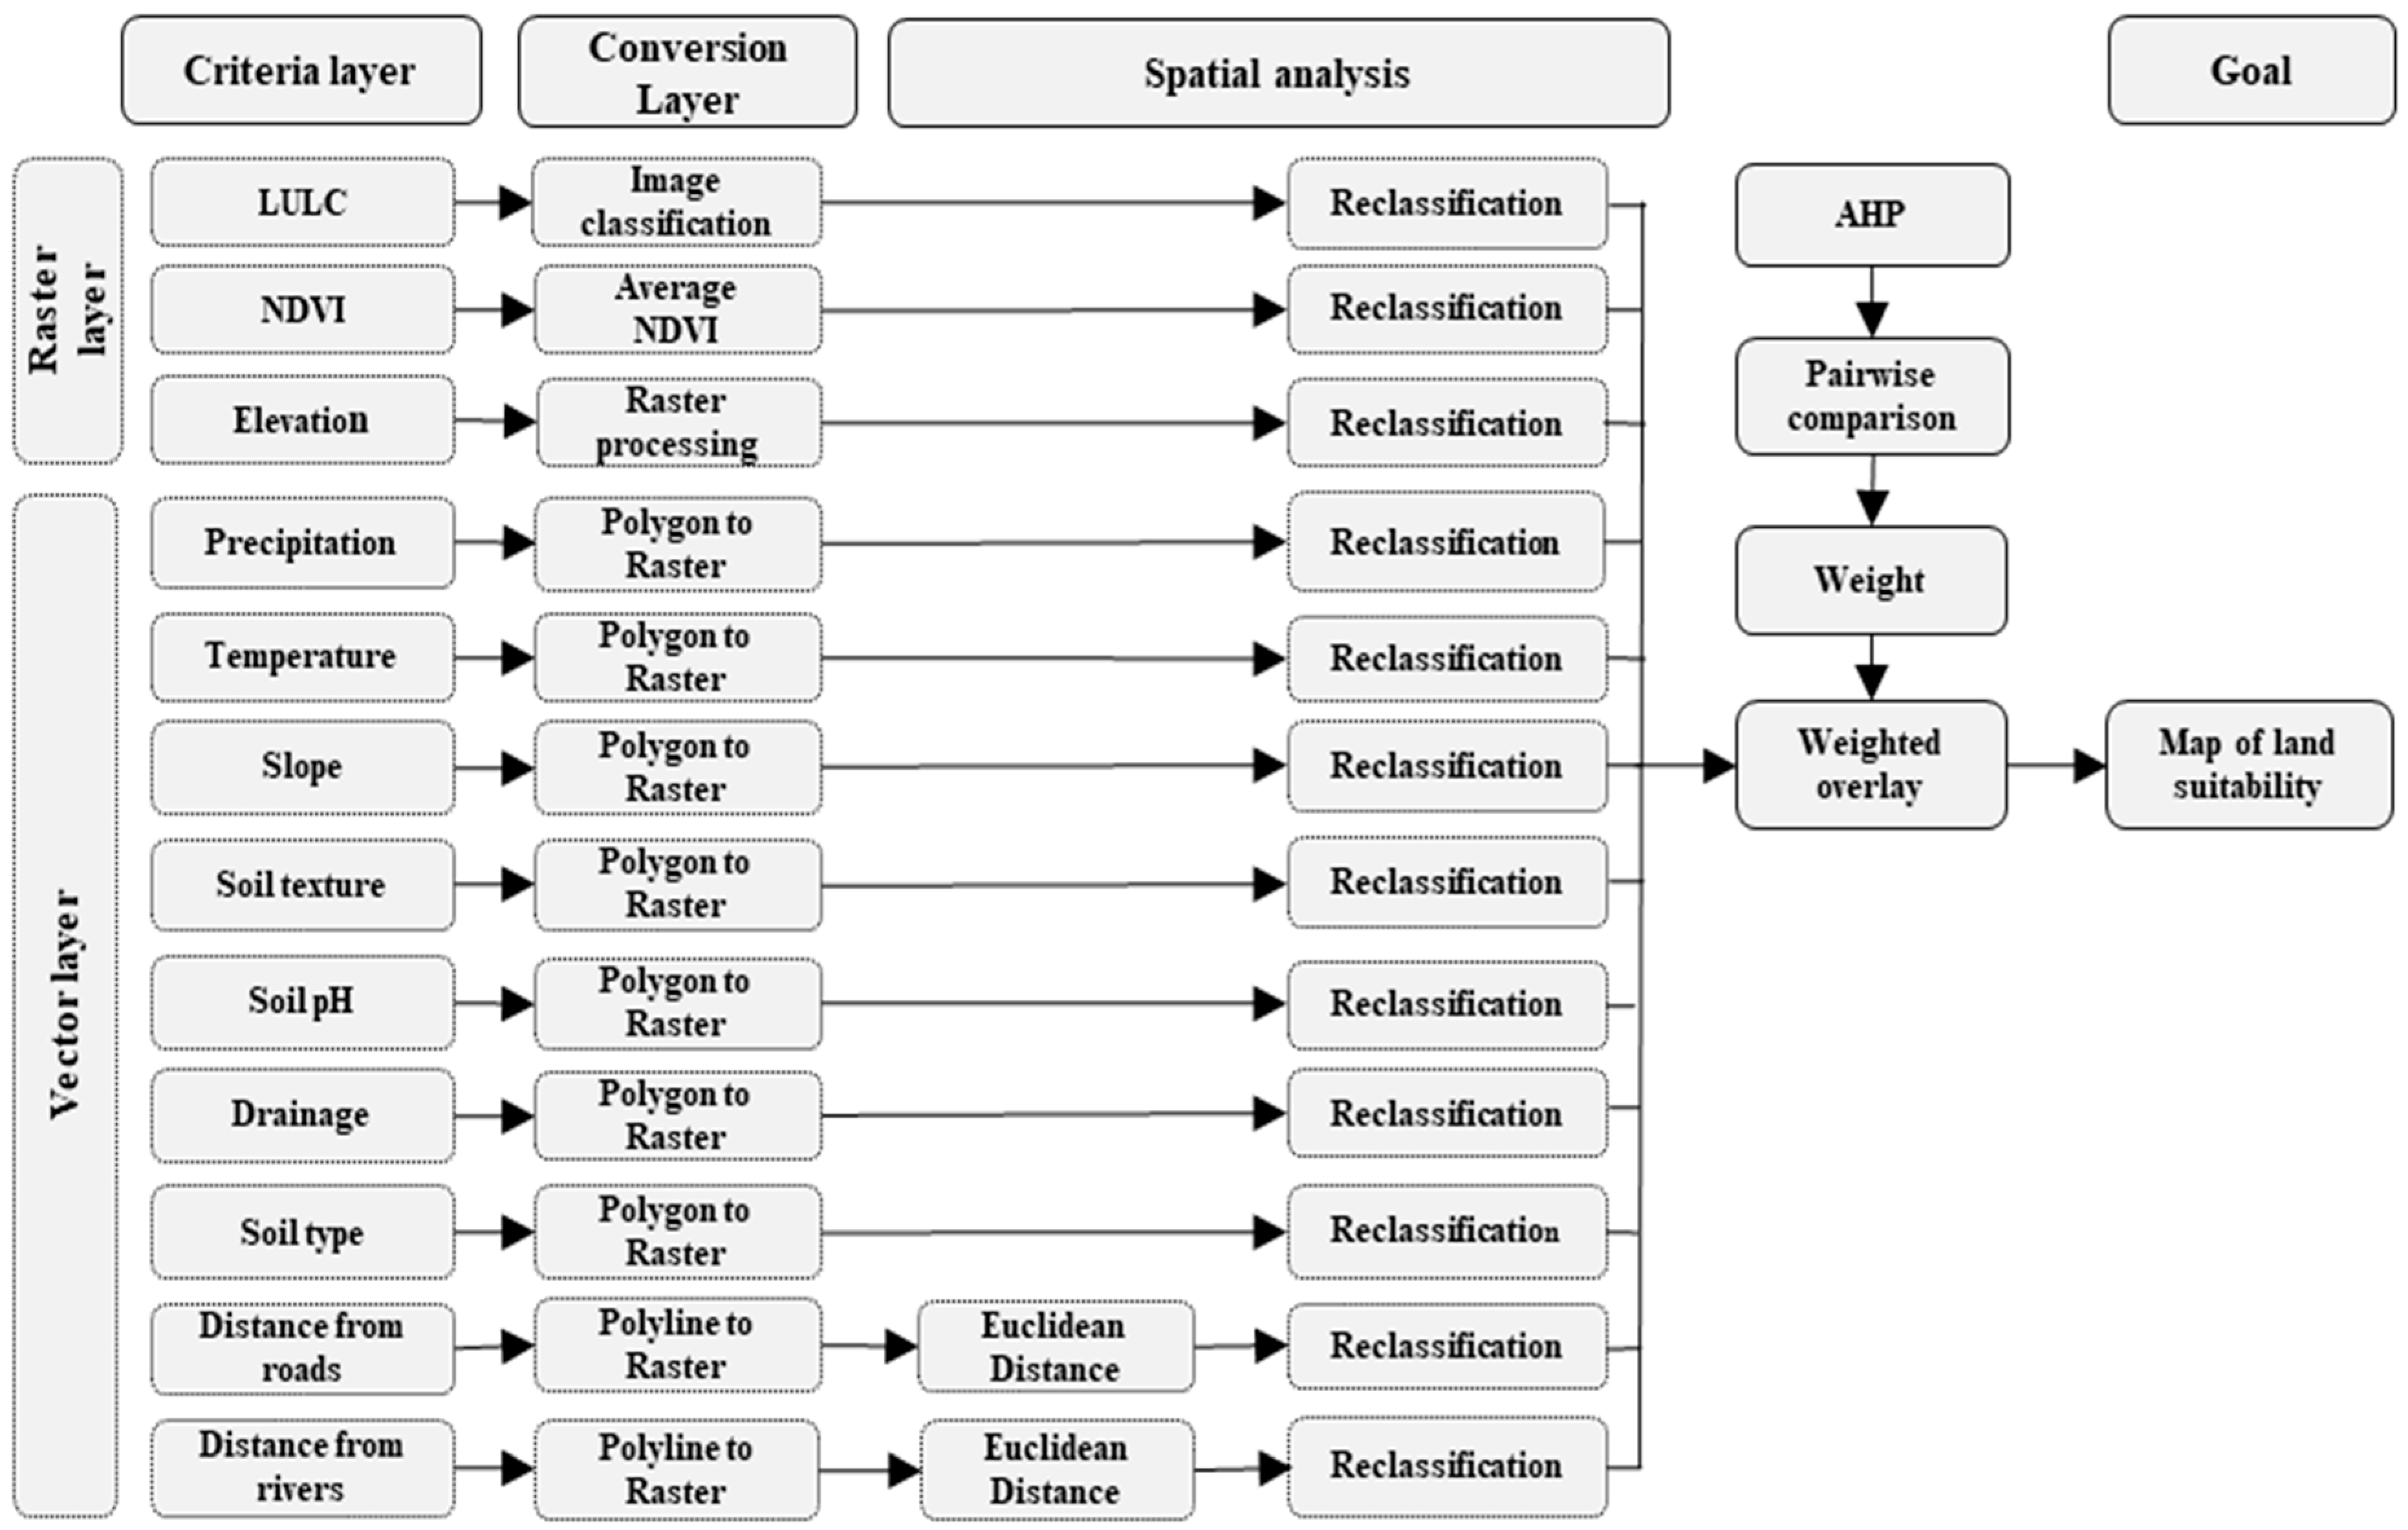
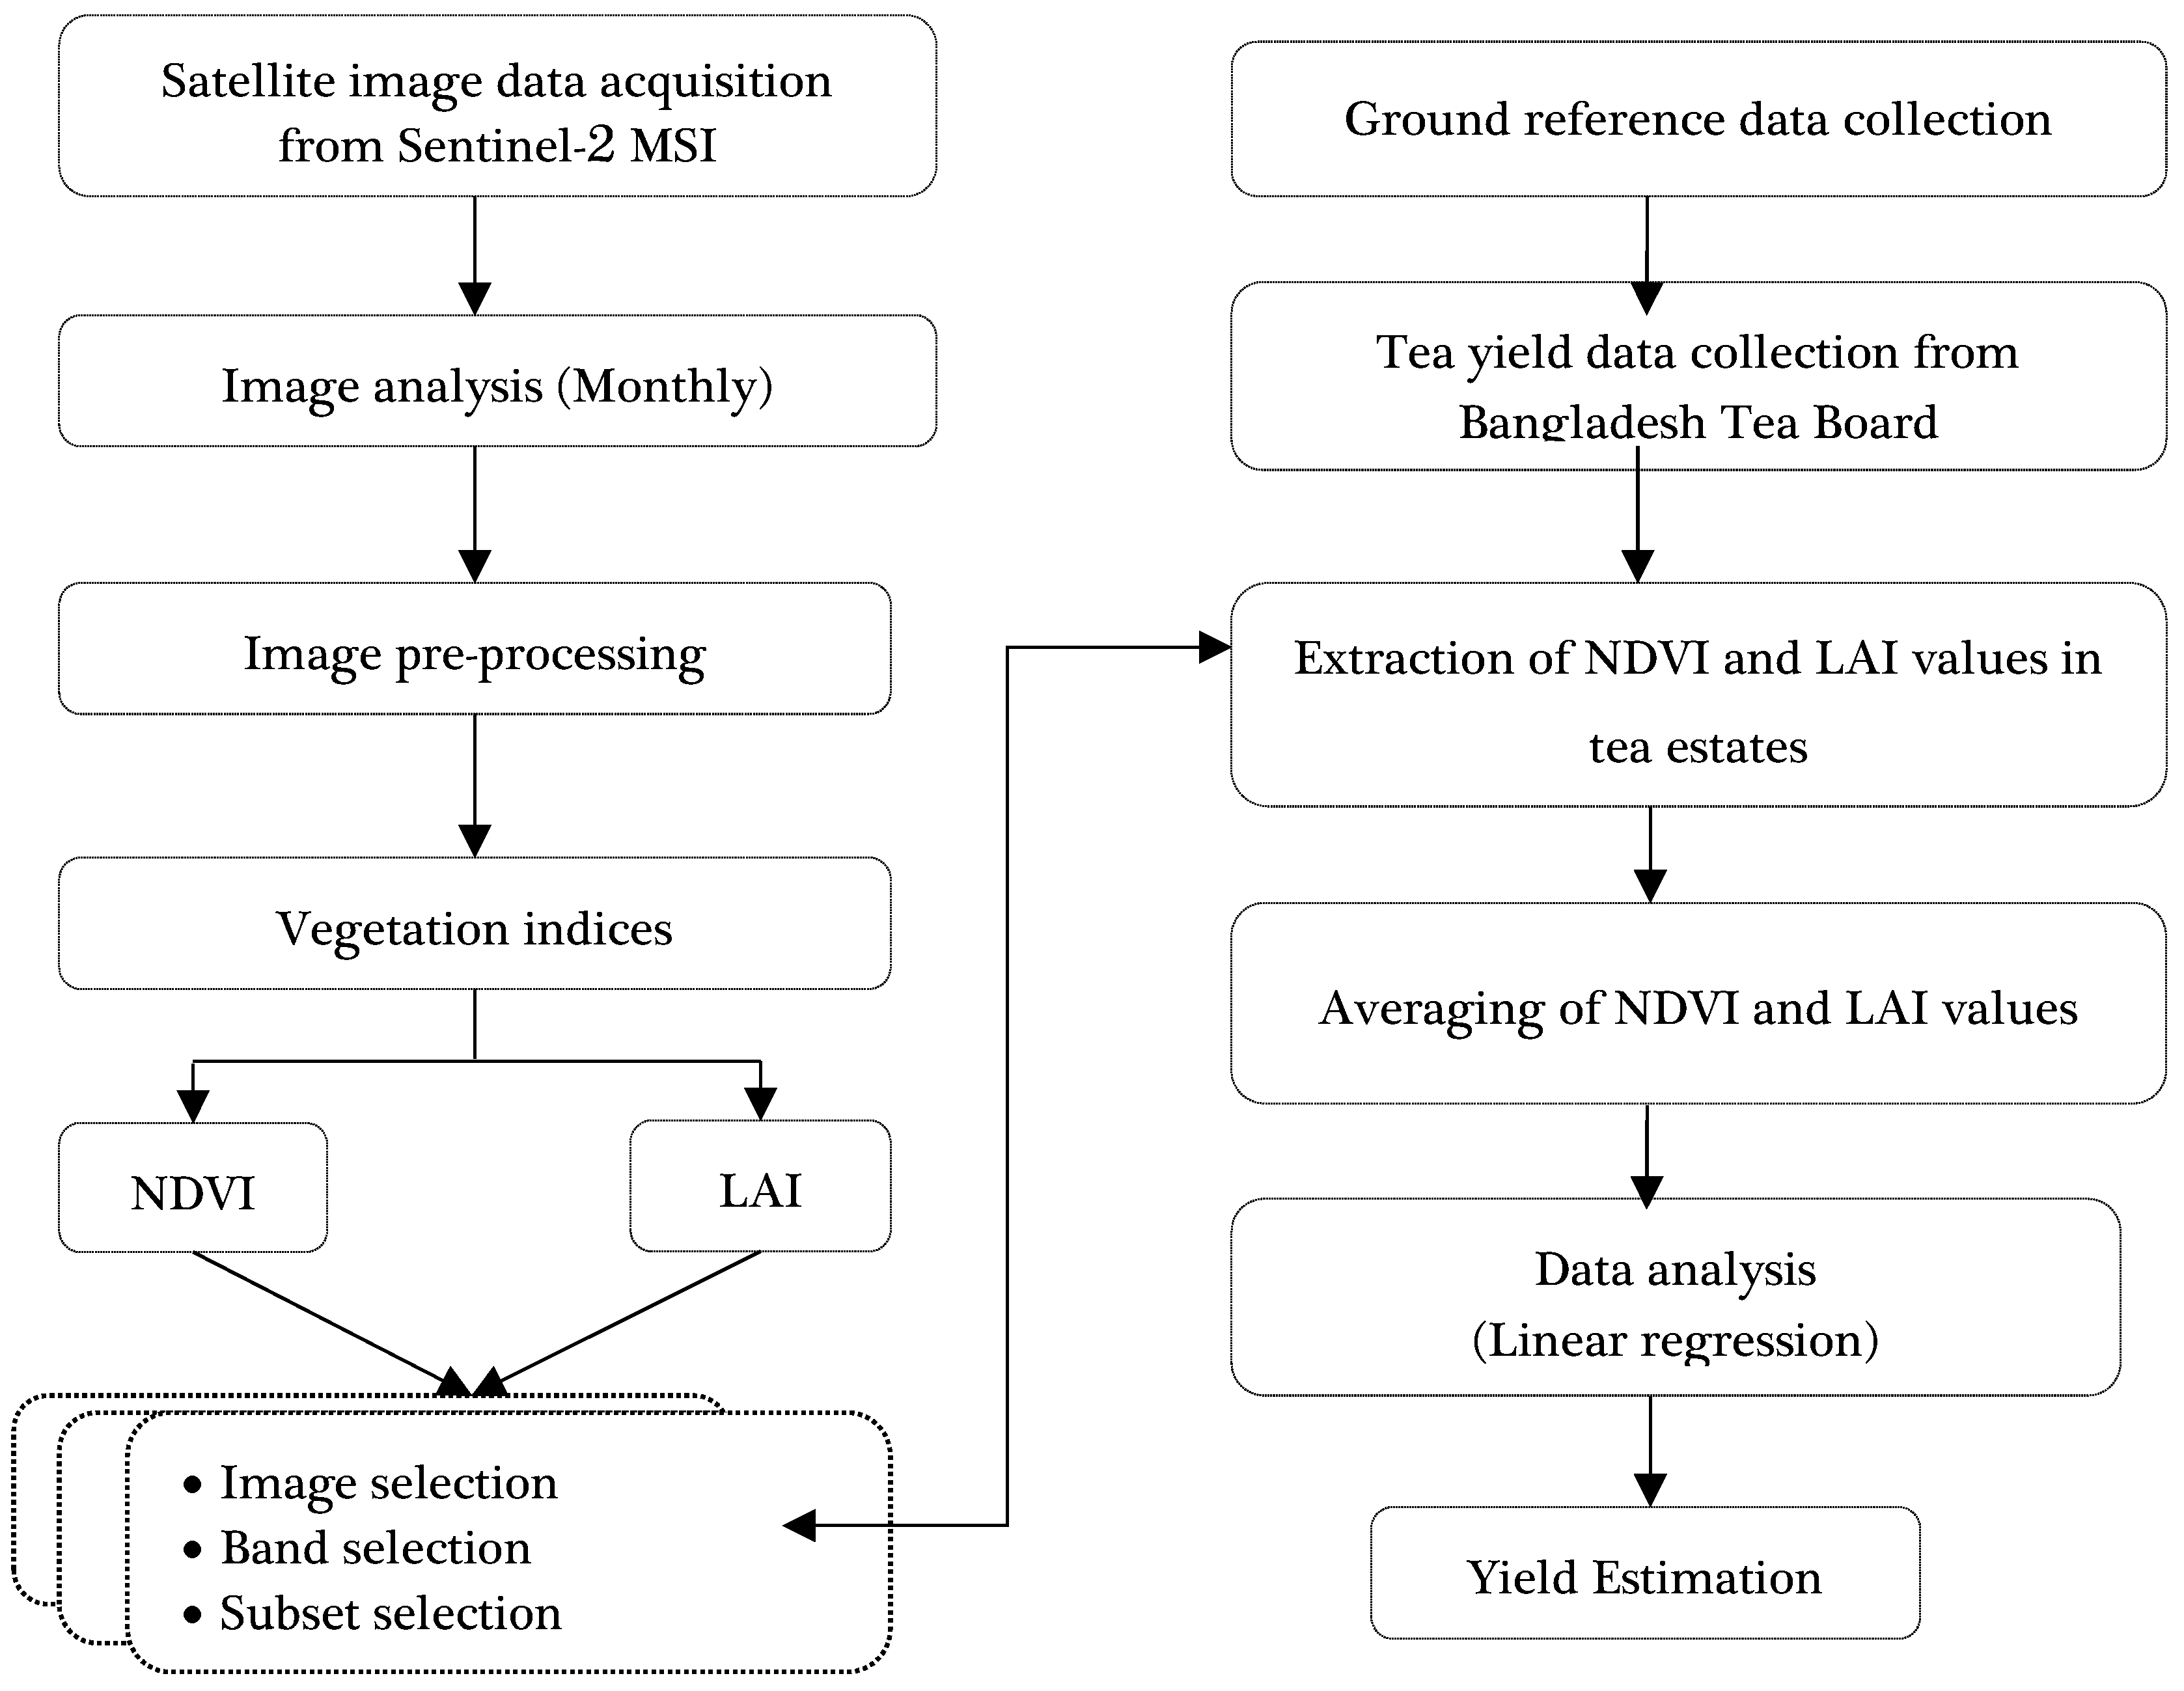
2.3. Digital Image Processing

Geospatial data, including both image and feature datasets, were used in this research. Sentinel-2 images with a 20 m resolution were processed to generate the LULC and NDVI maps. Elevation data with a 30 m resolution from the Shuttle Radar Topography Mission (SRTM), NASA, were processed to form an elevation map. Vector data with a 1:50,000 scale for precipitation, temperature, slope, soil texture, soil pH, drainage, soil type, and distance from roads and distance from rivers were processed to form raster layers, followed by reclassification and weighted overlaying.

2.3.1. NDVI Computation

The NDVI is generated from two important wave bands—near-infrared and red bands—and is measured as follows,
N D V I = R N I R R R E D R N I R + R R E D
where RNIR is the reflectance of near-infrared and RRED is the reflectance of red. In this research, cloud-free Sentinel-2 image data were collected and utilized to measure the NDVI from band combinations of the NIR and red reflections using band 8 and band 4. The NDVI values were extracted according to the ground reference information. The ground reference data for tea were collected in 2019 during its active vegetative growth stage starting in March and ending in November.

2.3.2. LAI Computation

The leaf area index (LAI) measured from remotely sensed data is an important parameter that can be effectively used for tea yield prediction. According to the correlation of the LAI with the NDVI observed in previous studies, the LAI was determined using the least square method and can be expressed as follows [48,49].
L A I = 0.57 × exp ( 2.33 × N D V I )

2.4. Reclassification of Criteria

Reclassification was performed to interpret the data in raster form by substituting a new single value or by categorizing the ranges of values into a single value. The raster map for each criterion was reclassified into four classes: highly suitable (S1), moderately suitable (S2), marginally suitable (S3), and not suitable (N).

2.5. Analytical Hierarchy Process (AHP)

The AHP is a multicriteria decision-making process developed by Saaty (1990) [50]. In the first stage, the decision elements are expanded into a hierarchy that includes three classes consisting of the top class (goals), the middle class (criteria), and the bottom class (alternatives). The top class of the hierarchy is involved in the selection of goals. The middle class defines the criteria, and the bottom class defines alternative decisions. A survey questionnaire was used to obtain expert opinions on the relative significance of the criteria and factors. Comparisons for each factor pair were depicted as integer values of 1 (equal importance) to 9 (extreme difference), where a higher number denoted the alternative factor being more important than another (Table 3).
For instance, in the comparison between LULC and the NDVI, a score of 1 denoted that both factors were equally important for evaluating suitability, and a score of 9 indicated that LULC was more important than the NDVI. All the scores were collected in a pairwise comparison matrix, with the diagonal and reciprocal scores presented in the lower left-hand triangle. Reciprocal scores (1/3, 1/5, 1/7, and 1/9) were used in the row criterion that was observed as less important over the column criterion. In the second stage, the scoring of the criteria was performed via pairwise comparisons followed by scoring the scales of relative importance (Table 4).
The third stage involved the calculation of the matrix, ensuring consistency among the criteria in the pairwise comparison matrix. The AHP was also used to measure the normalized values for each criterion and alternative to determine the normalized principal eigen vectors and priority vectors. The pairwise comparison matrix was calculated according to the following expression.
[ C 11 C 12 C 13 C 1 n C 21 C 22 C 23 C 2 n C m 1 C m 2 C m 3 C m n ]
The sum of each column of the pairwise matrix was expressed as follows.
C i j = i = 1 n C i j
Each element of the matrix was divided by its column total to generate a normalized matrix:
X i j = C i j i = 1 n C i j = [ X 11 X 12 X 13 X 1 n X 21 X 22 X 23 X 2 n X m 1 X m 2 X m 3 X m n ]
The sum of the normalized matrix column was divided by the number of criteria used (n) to calculate the weighted matrix of the priority criteria:
W i j = j = 1 n X i j n   [ W 11 W 12 W 1 n ]
The initial consistency vectors were generated by multiplying the pairwise matrix by the vector of weights:
[ C 11 C 12 C 13 C 1 n C C C C 2 n C m 1 C m 2 C m 3 C m n ] × [ W 11 W 12 W 1 n ] = [ C 11 W 11 C 12 W 12 C 1 n W 1 n C 21 W 21 C 22 W 22 C 2 n W 2 n C m 1 W m 1 C m 2 W m 2 C m n W m n ] = [ V 11 V 12 V 1 n ]
The principal eigenvector (λmax) was calculated by averaging the values for the consistency vector:
λ m a x = i n C V i j
Eigenvalues were measured to determine the relative weights by averaging the rows of each matrix. The largest value for the eigenvector was equal to the number of criteria, and when λ m a x = n, the judgments were consistent. Normalized eigenvalues were calculated to determine the weights of the priority criteria. The principle value suggested that all criteria were consistent in the pairwise comparison matrix (Table 5).
The judgments were also verified to measure the consistency index (CI), which was calculated as follows.
C I = λ m a x n n 1
Here, n is the total number of criteria. Saaty (1989) also suggested the consistency ratio (CR), which was compared with the consistency index and the random index (RI) (Table 6) [51,52].
The consistency ratio was calculated as follows.
C R = C I R I

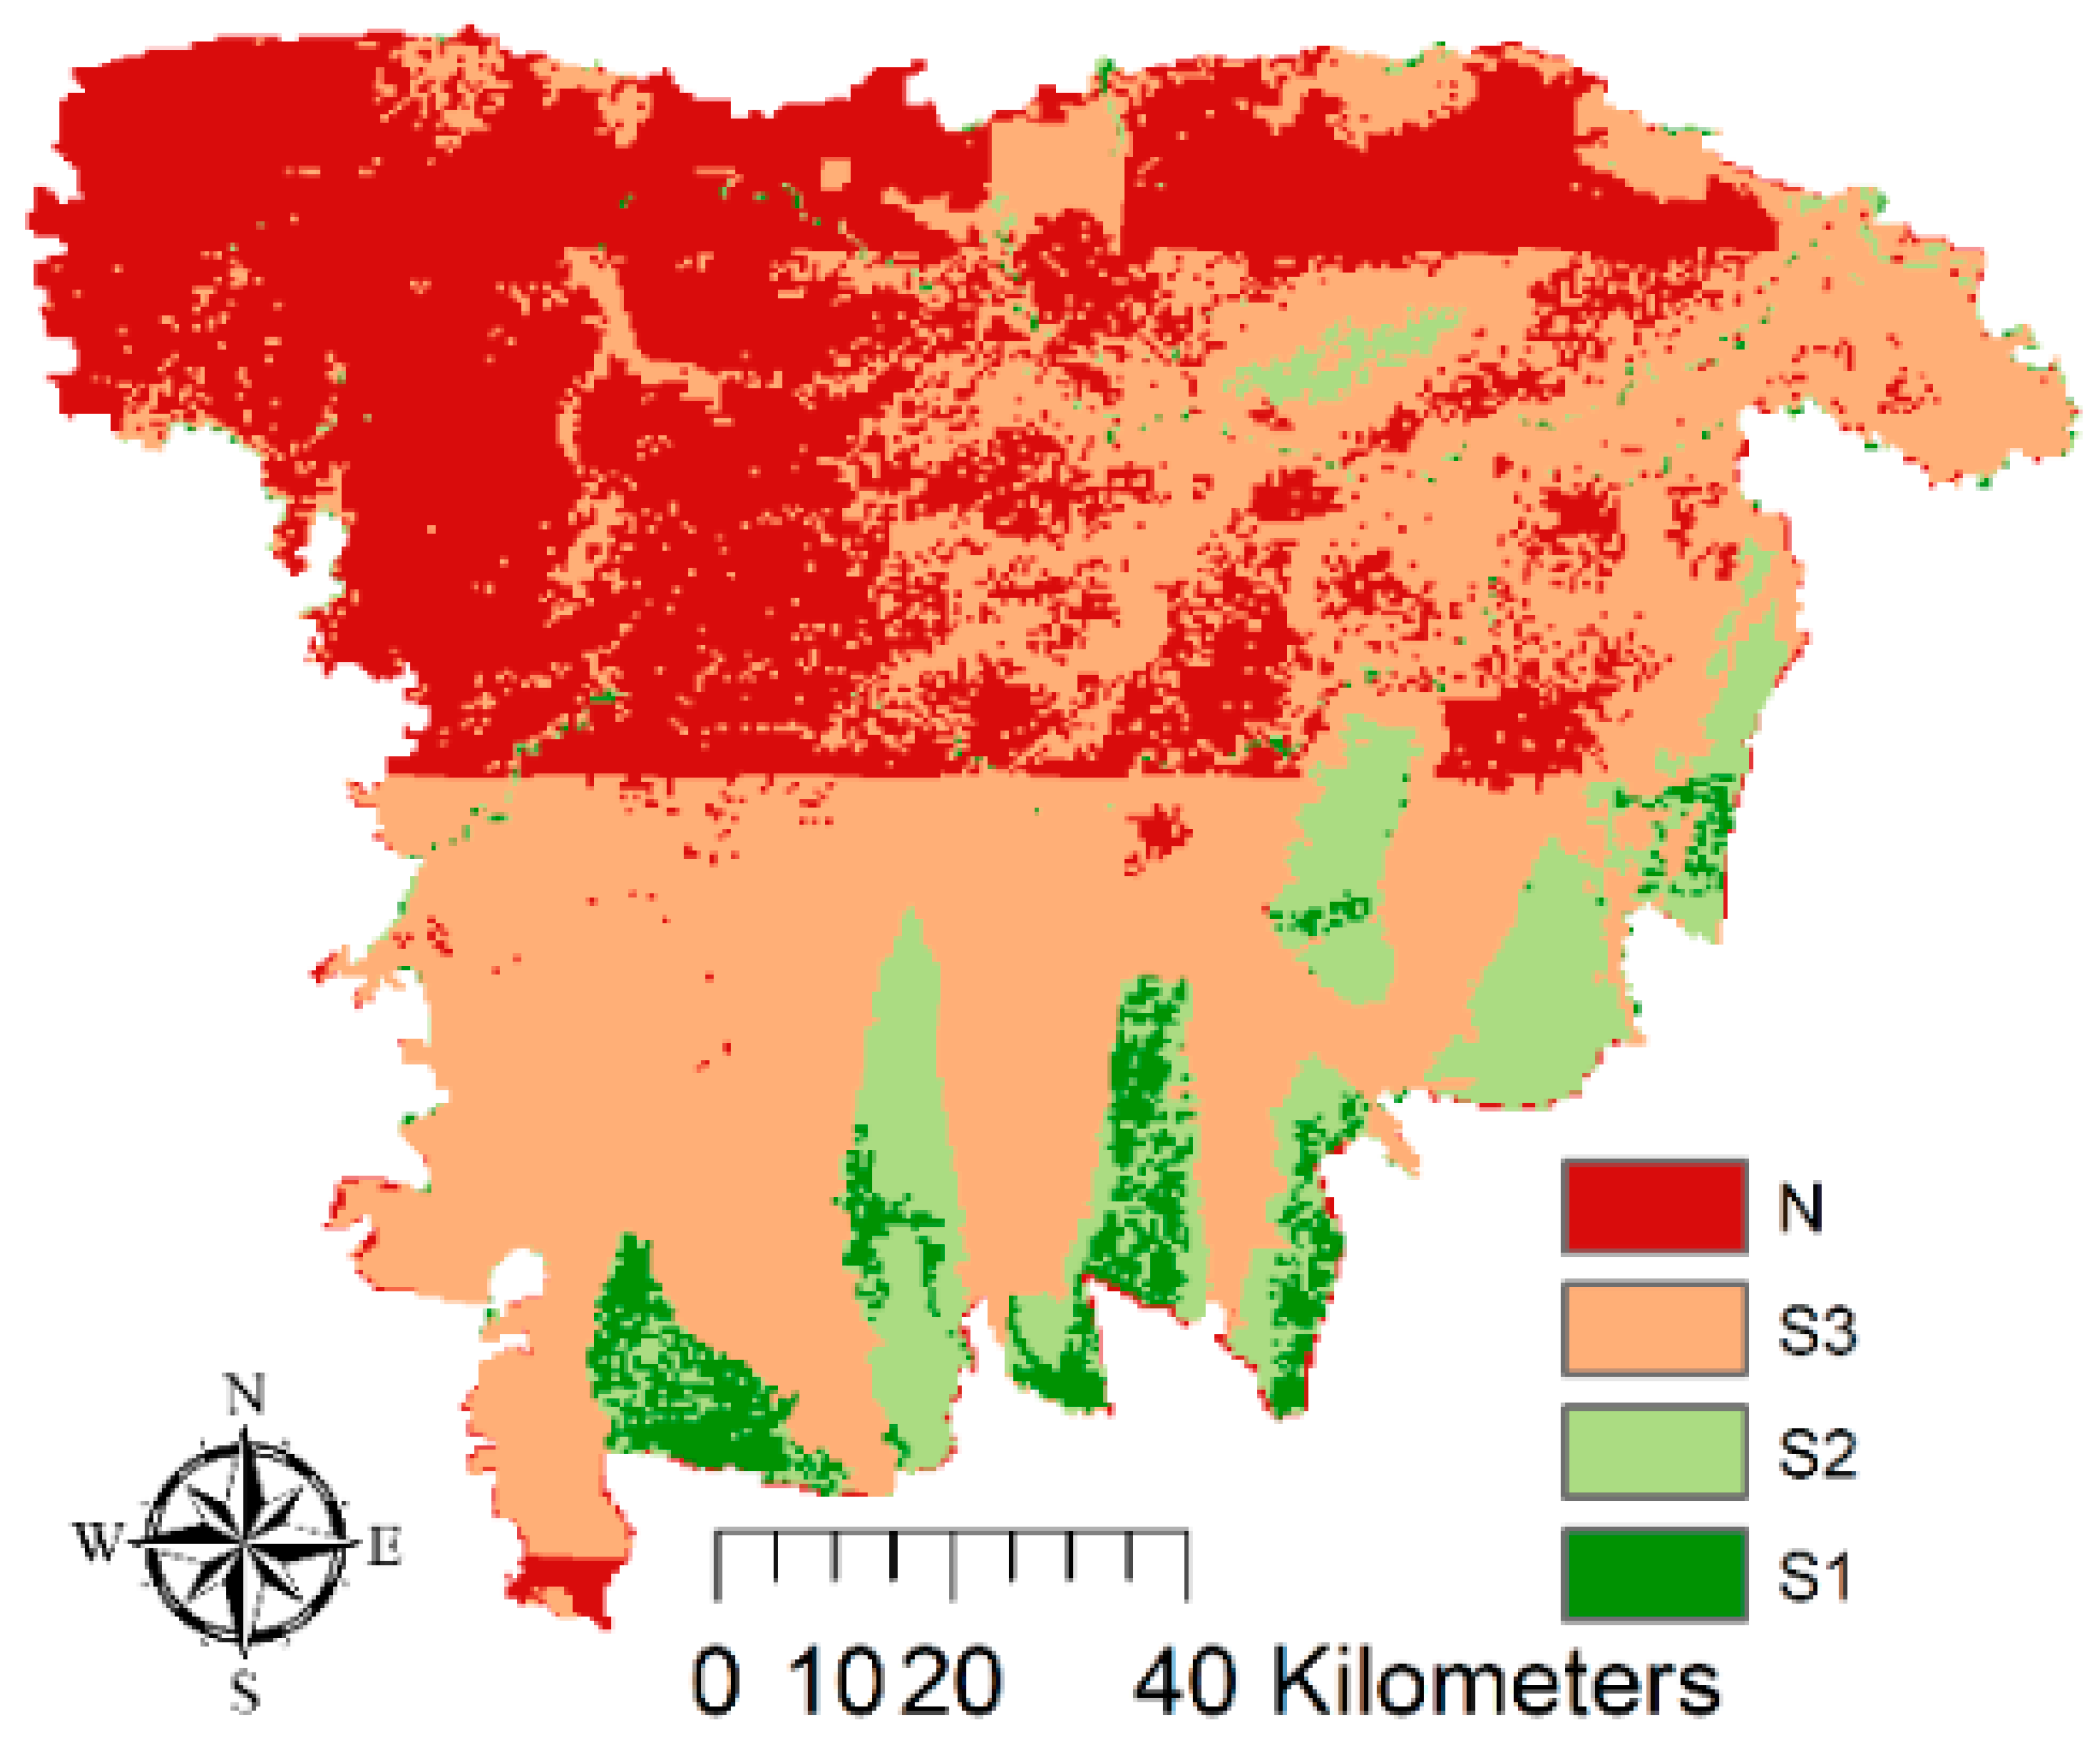
2.6. Land Suitability Evaluation

The land suitability evaluation for tea was conducted according to the classification guidelines proposed by the FAO. The guidelines for suitability classification were utilized to assess the suitability of each land unit for a particular use. According to the FAO’s guidelines for land evaluation, it was initially determined whether the land was suitable (S) or not suitable (N). The suitable class (S) was further divided as required. In practice, three categories—S1, S2, and S3—were used to evaluate the lands for tea cultivation. Thus, the land suitability evaluation was performed for the prioritized criteria that were reclassified into four categories. Eventually, the suitability classes for tea were determined using the weighted overlay based on the fraction weights obtained from expert opinions,
W e i g h t e d   O v e r l a y = i = 1 n C i W n
where Ci denotes the criterion (i) that was reclassified and Wn denotes the number of criteria (n) that were weighted.

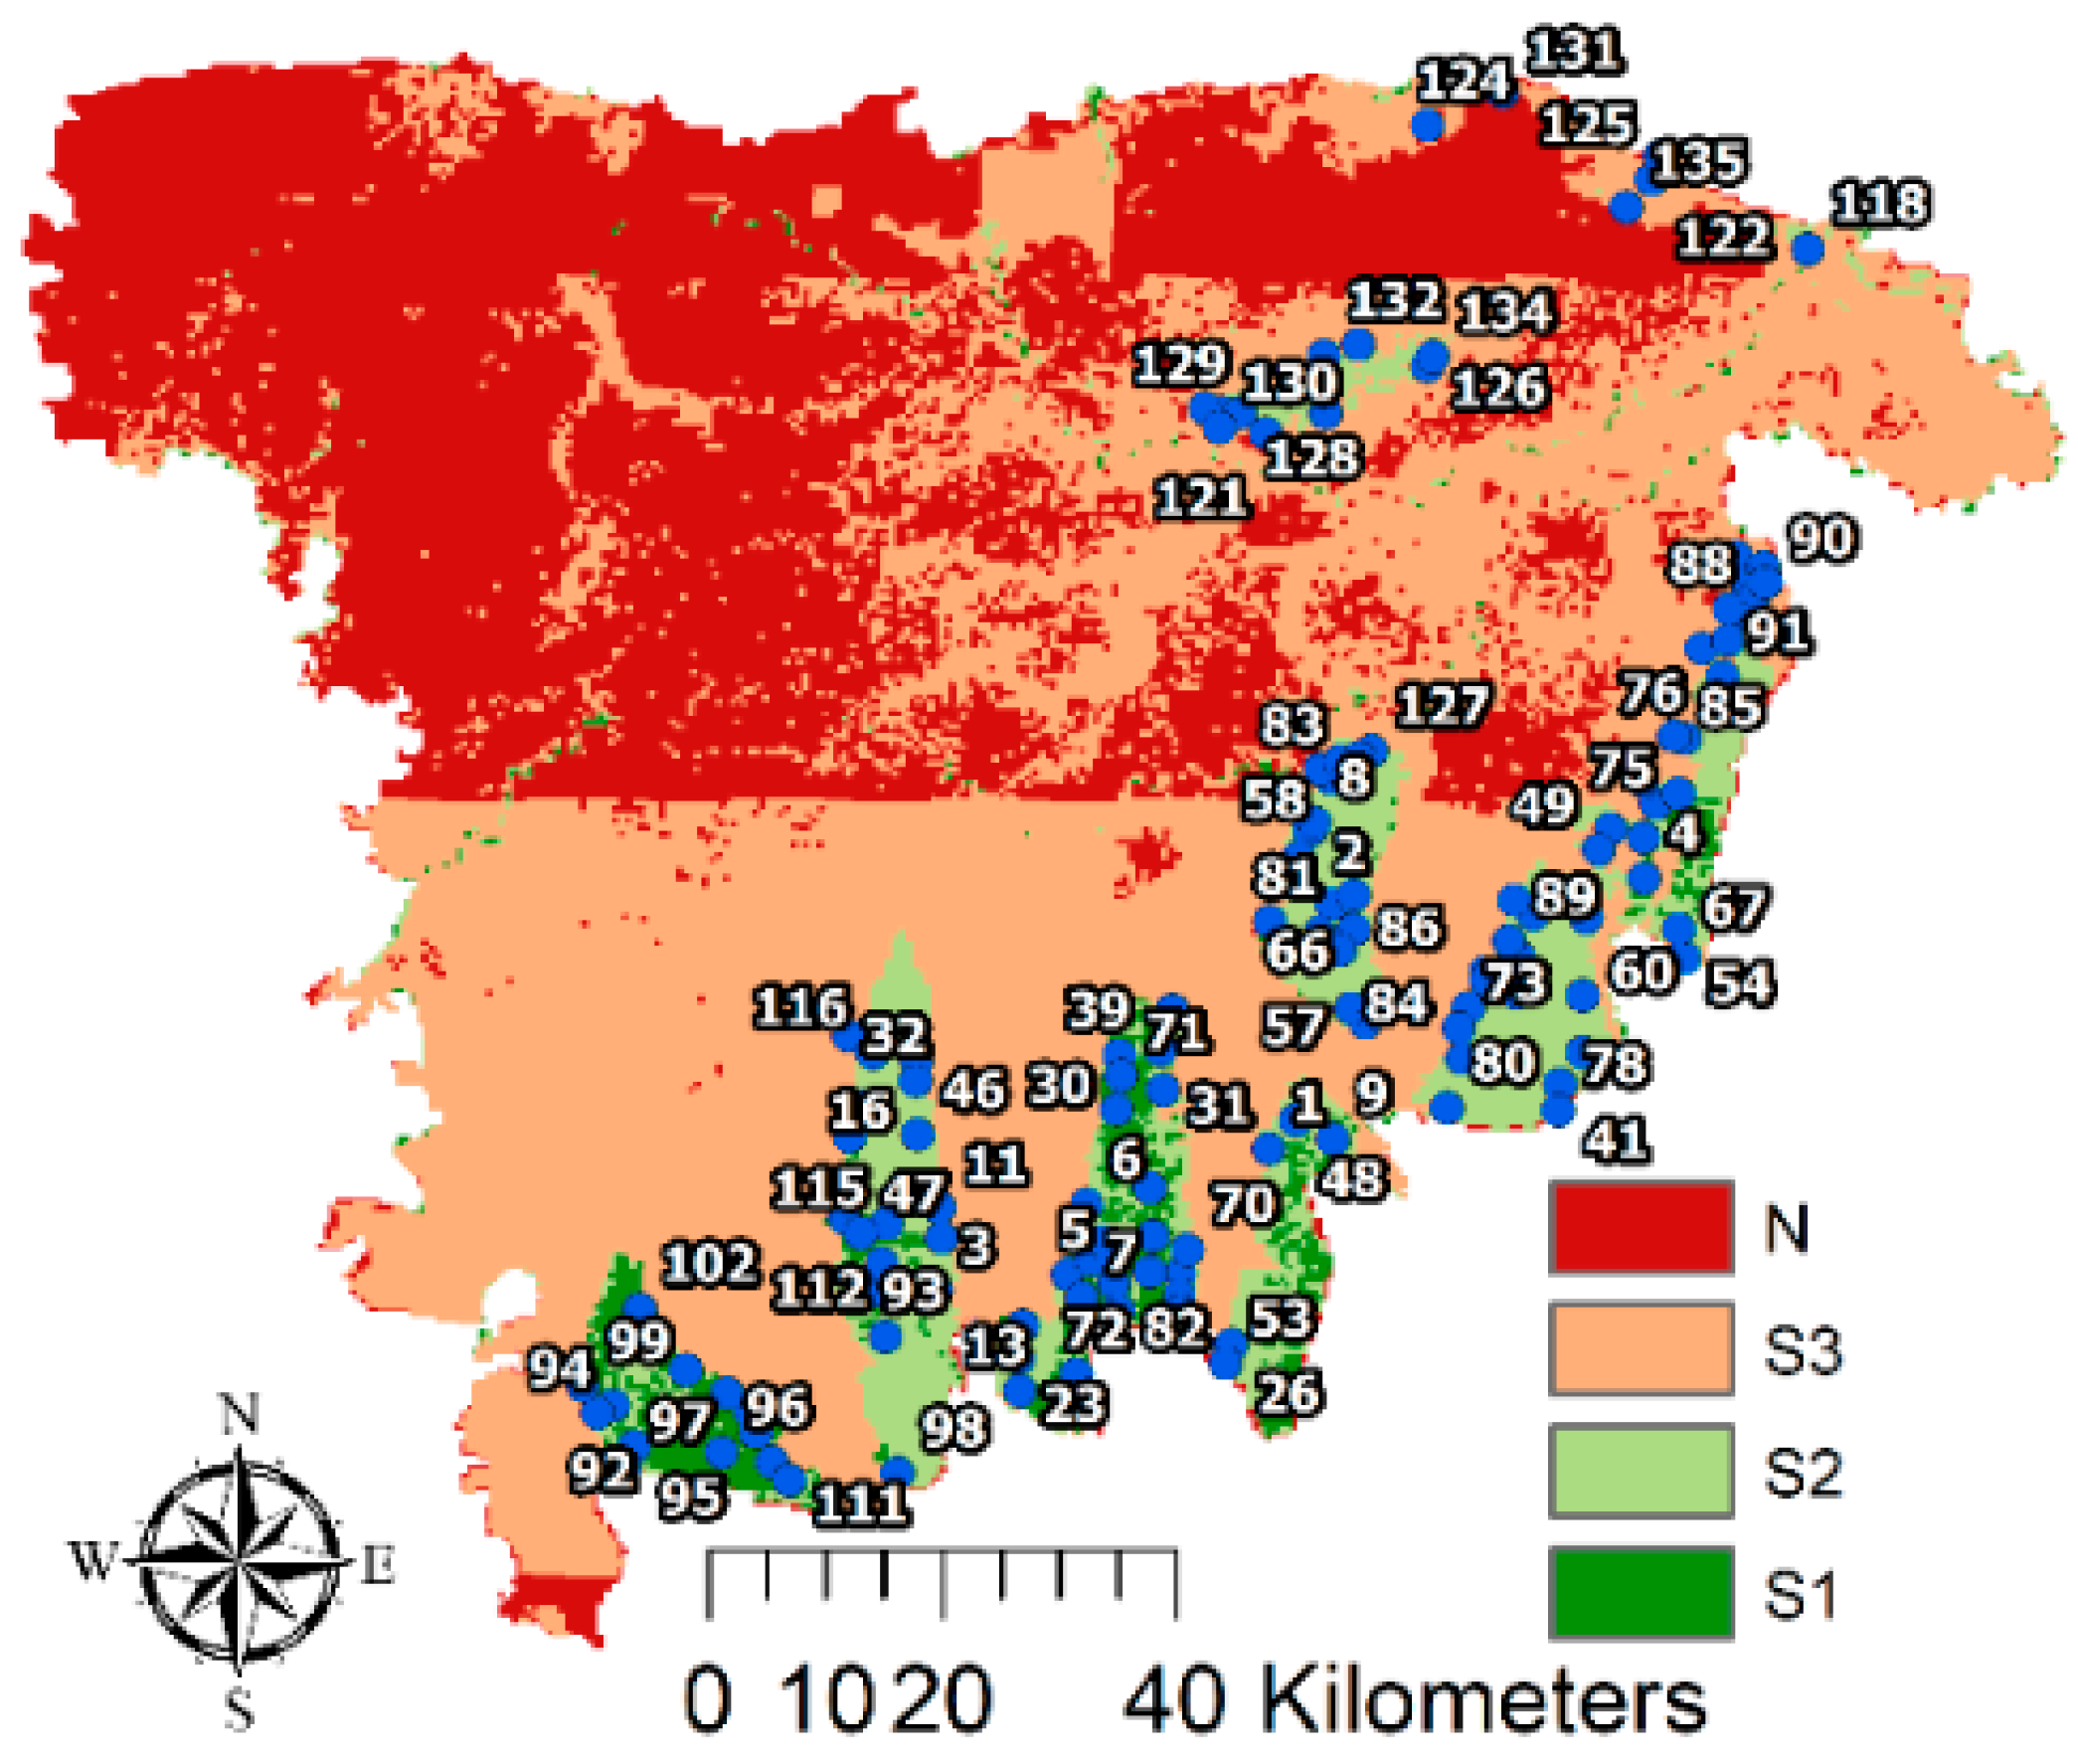
2.7. Ground Reference Information and Field Survey

Primary data were collected during the 2019 field survey. GPS waypoints for tea estate locations were collected around the Sylhet Division using a handheld GPS locator (eTrex 10, Garmin, Olathe, KS, USA). These waypoints were used as references to determine the locations of tea estates. According to the statistical references, among the 135 tea estates in the study area, 91 were located in Moulvibazar, 25 in Habiganj, and 19 in Sylhet.

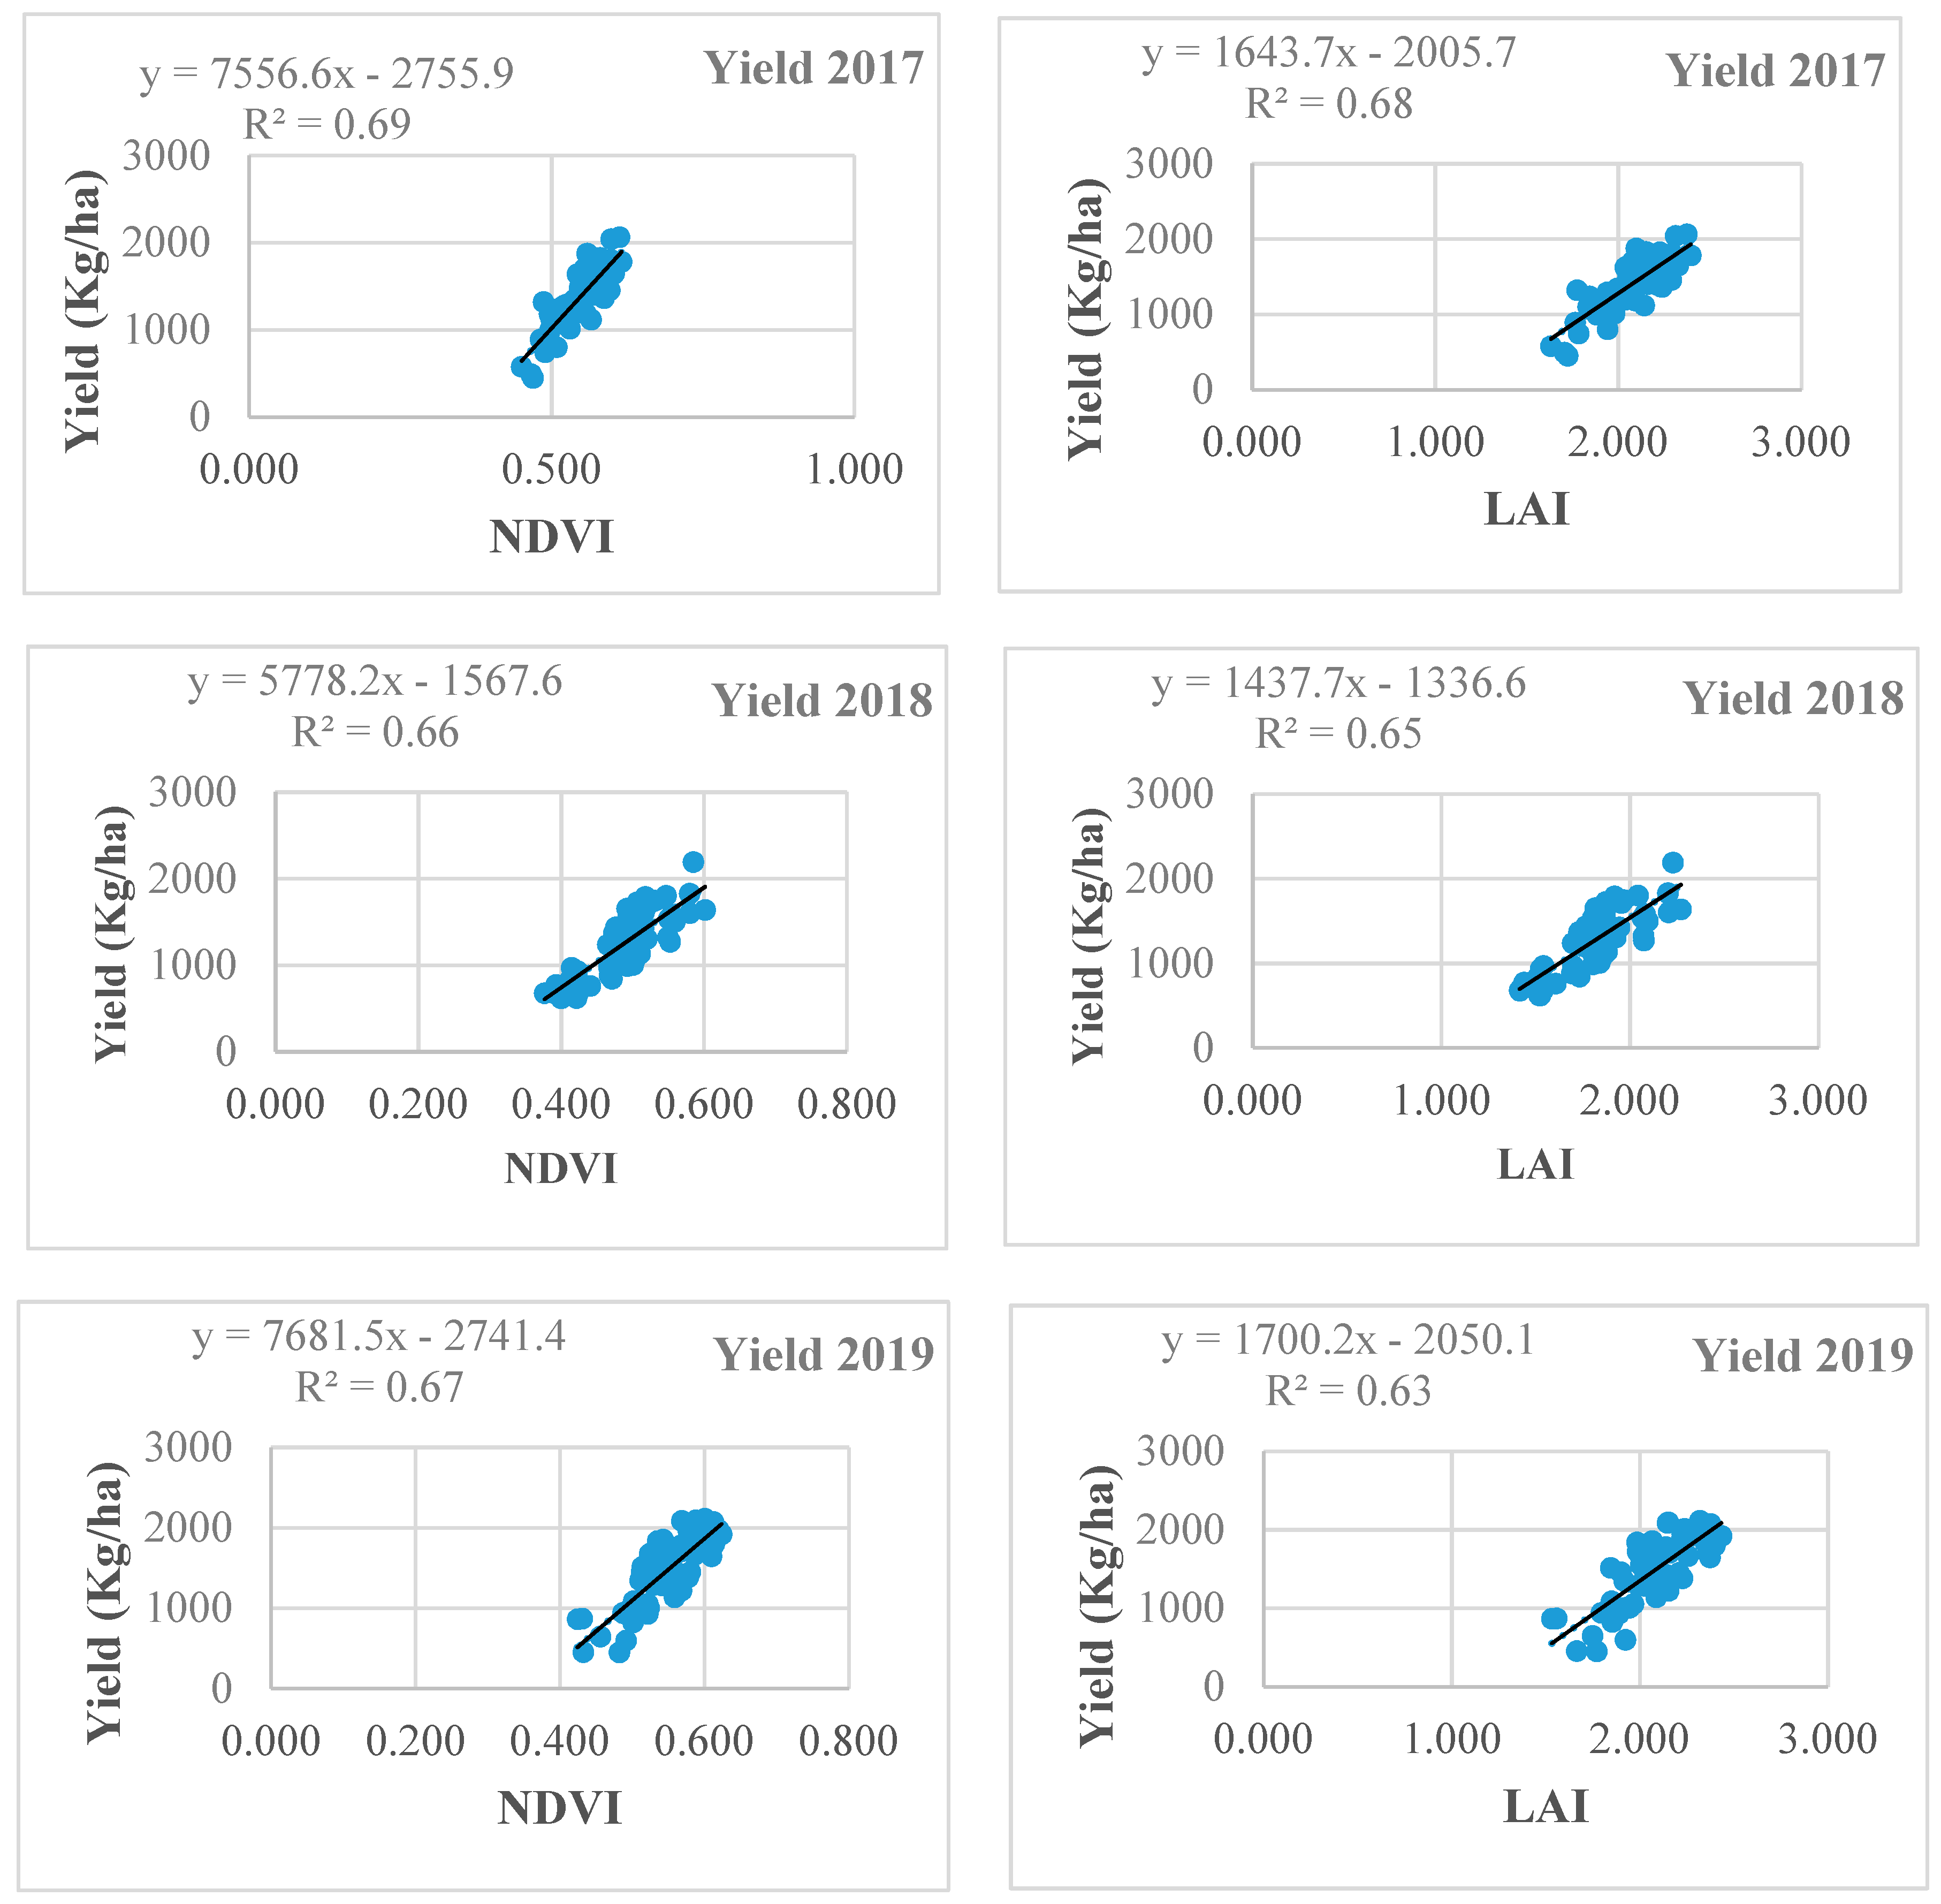
2.8. Validation of Yield

Yield data for three consecutive years (from 2017 to 2019) were collected from the Bangladesh Tea Board (BTB). The NDVI values were also extracted from Sentinel-2 satellite imagery for the years 2017 to 2019. The monthly average NDVI values were extracted for the active growing season (March to November) over the tea estates located in the study areas. The NDVI values were obtained according to the ground reference information collected during the field survey. The monthly average LAI values were derived from the NDVI values using geospatial techniques (Figure 3). The yield data were compared in a scatter plot through regression analysis using both the NDVI and the LAI.

3. Results

3.1. Reclassification

The raster layers of criteria were reclassified in accordance with the suitability levels into highly suitable, moderately suitable, marginally suitable and not suitable categories (Figure 4a–l). In the classification of LULC, the user accuracy (UA) was 100% for forests, tea estates, high agricultural lands and wetlands; 85.71% for water bodies and settlements; and 71.43% for rivers. On the other hand, producer accuracy (PA) was 100% for tea estates, water bodies, settlements, high agricultural lands and rivers and 87.5% and 72.73% for forests and wetlands, respectively (Table 7). In the accuracy assessment for LULC, the overall accuracy (OA) was 92%.
In the reclassification of multicriteria, for LULC 16.41% of lands (201,818 ha) were highly suitable, 10% (123,008 ha) were moderately suitable, 11.87% (145,964 ha) were marginally suitable, and 61.72% (759,050 ha) were not suitable. Considering the NDVI, 2.31% of the lands (28,362 ha) were highly suitable, 26.51% (325,998 ha) were moderately suitable, 67.77% (833,430 ha) were marginally suitable, and 3.42% (42,051 ha) were not suitable. According to elevation, 35.05% of the areas (431,045 ha) were highly suitable, 28.75% (353,533 ha) were moderately suitable, 22.28% (274,016 ha) were marginally suitable, and 13.92% (171,246 ha) were not suitable.
In the reclassification of precipitation, 38.18% of lands (469,553 ha) were in the highly suitable category, 46.54% (572,386 ha) were moderately suitable, and 15.28% (187,901 ha) were marginally suitable. In the reclassification of temperature, it was noted that 100% (1,229,840 ha) of lands were in the highly suitable category. In the case of slope, 14.73% of lands (181,103 ha) were highly suitable, 85.12% (1,046,828 ha) of lands (the majority of the area) were moderately suitable, and only 0.16% (1909 ha) of lands were marginally suitable. In the reclassification of soil texture, 71.36% (877,555 ha) of lands were highly suitable, 27.22% (334,729 ha) of lands were moderately suitable, and 1.43% (17,556 ha) of lands were marginally suitable. In the reclassification of soil pH, 13.99% (172,008 ha) of lands were highly suitable, 81.05% (996,795 ha) were moderately suitable, and 4.96% (61,037 ha) were marginally suitable. According to the classification of drainage, moderately well-drained to well-drained lands, which accounted for 13.36% (164,353 ha), were highly suitable; imperfectly drained lands, which accounted for 9.60% (118,083 ha), were moderately suitable; poorly drained lands, which accounted for 66.30% (815,421 ha), were marginally suitable; and very poorly drained lands, estimated as 10.73% (131,983 ha), were in the not suitable category. Brown hill soils belong to the highly suitable category, accounting for 13.24% (162,782 ha), whereas gray piedmont soils, accounting for 11.84% (145,659 ha), belonged to the moderately suitable category. Non-calcareous alluvium, brown flood plain soils, dark gray flood plain soils, gray flood plain soils, acid basin clays, and deep red-brown terrace soils belonged to the marginally suitable category, accounting for 73.72% (906,642 ha), and peat soils, water bodies and urban areas, accounting for 1.20% (14,757 ha), were in the not suitable category.
According to the reclassification of distance from roads, it was observed that 13.97% (171,759 ha) of lands were in the highly suitable category, 14.51% (148,404 ha) were moderately suitable, 21.81% (268,246 ha) were marginally suitable, and 49.72% (611,431 ha) were not suitable. The reclassification of distance from rivers showed that 6.23% (76,601 ha) of the total lands were highly suitable, 11.68% (143,618 ha) were moderately suitable, 18.03% (221,779 ha) were marginally suitable, and 64.06% (787,842 ha) were not suitable for tea cultivation in the Sylhet Division of Bangladesh (Table 2).

3.2. AHP Weights

In the AHP analysis, the comparison of the criteria scale matrices was accomplished according to the experts’ opinions, where judgments for ranking the criteria influenced the suitability classes of lands. Twelve criteria for the land suitability evaluation of tea were determined according to the baseline survey and a review of the literature. The AHP for the selected criteria was supported by a pairwise matrix, and the weights were determined from the normalized matrices based on expert knowledge to prioritize the criterion layer in the weighted overlay [53]. The results of the AHP demonstrated that precipitation (23%) was highly influential, followed by drainage (19%), temperature (15%), soil pH (10%), and slope (8%). There were similar influences of elevation, soil texture and soil type (5%), LULC and distance from rivers (3%), with the least influence of the NDVI and distance from roads (2%) (Table 8).

3.3. Land Suitability

The suitability map was developed using weighted overlay spatial analysis according to the AHP weights (Figure 5). The result of the weighted overlay showed that 3.37% of the total lands (41,460 ha) were highly suitable, 9.01% (110,767 ha) were moderately suitable, 49.87% (613,367 ha) were marginally suitable, and 37.75% (464,246 ha) were not suitable (Table 9). It was also observed that among the 135 tea estates in the Sylhet Division, 31 were located in highly suitable areas, 79 in moderately suitable areas, 24 in marginally suitable areas, and only one in a not suitable area (Figure 6).

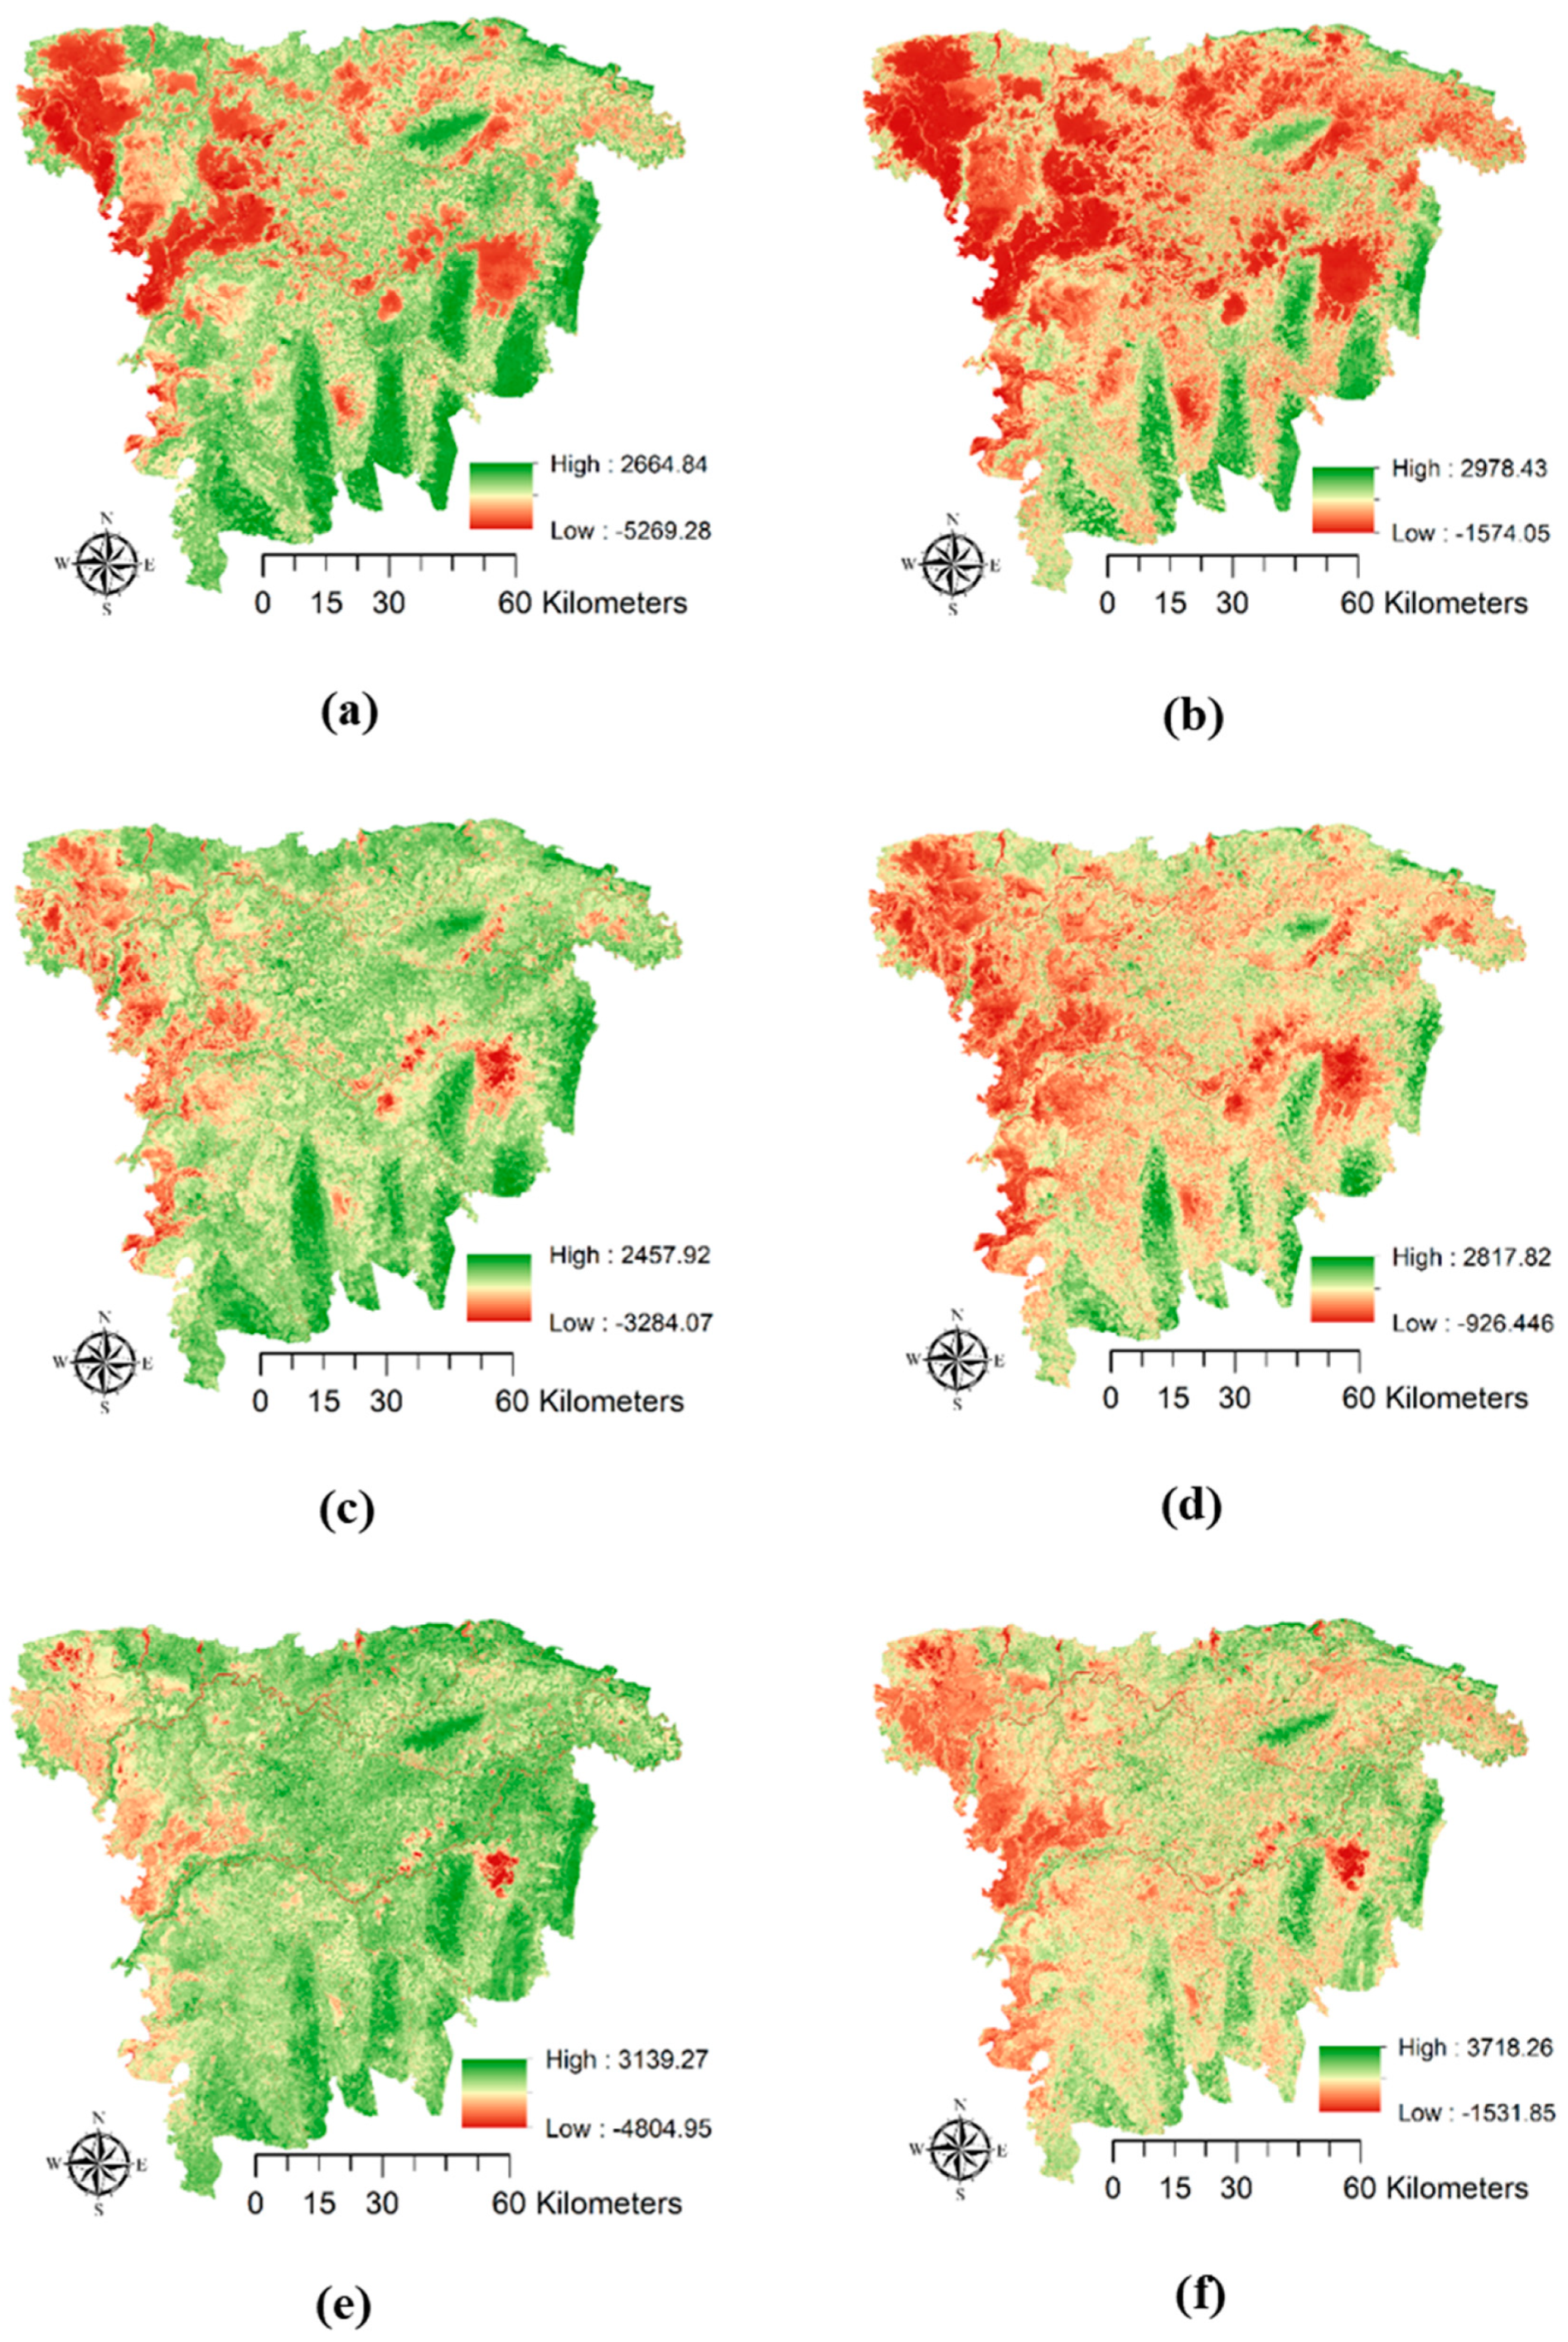
3.4. Validation of Yield

Yield estimation and validation were performed using both NDVI and LAI values with the observed yield data. The trendline obtained from the scatter plot showed the effects of the NDVI and the LAI on yield. According to the regression analysis between the NDVI and yield, the coefficients of determination were 0.69, 0.66, and 0.67, and between the LAI and yield, they were 0.68, 0.65, and 0.63 for 2017, 2018, and 2019, respectively (Figure 7). The predicted yield maps were developed from the obtained linear equation using geospatial techniques. The red color in the map indicates the restricted area, and the light green to deep green color shows the tea-producing area (Figure 8).

4. Discussion

Incorporation of Sentinel-2 MSI and geospatial datasets was significant in this study to assess environmental limitations as well as to evaluate land suitability for tea production [54]. LULC classification and NDVI measurements were performed from Sentinel-2 datasets that serves as a high-resolution remote sensing data. Edaphic, climatic, and topographic factors are critical and important for sustainable tea production [55]. The SRTM digital elevation datasets, prepared by NASA, used to generate the elevation layer of the study area, is significantly important in digital mapping of terrain due to its accessibility of high-quality elevation data. Edaphic and climatic parameters for this study were selected according to the reference of the previous studies. Distance from roads is an important criterion with respect to transportation, and distance from rivers, with the advantages of irrigation facilities and transportation, was considered another criterion in this research (Appendix A). An important step in the land suitability evaluation is to determine the weight of each criterion that affects suitability assessment [1]. Multiple factors affect the land suitability evaluation because of the criteria are of unequal importance [56]. In this study, a multicriteria decision-making process was used that integrates AHP with biophysical and remote sensing parameters. This study represents application of AHP along with the weighted overlay model for land suitability evaluation of tea production resulting in a value of consistency ratio (CR) less than 0.1 [6].
Most of the lands suitable for tea cultivation were located in the southern and eastern parts of the Sylhet Division. This result might be due to the suitable drainage system, slope, soil type, soil pH, and elevation in this area along with the most important factors, such as precipitation and temperature. On the other hand, around one-third portion of lands, mostly located in northwestern part of the Sylhet Division, were not suitable due to the presence of wetlands that is not arable for tea cultivation along with other adverse edaphic factors. This research finds that drainage is an influencing factor after precipitation. One of the novel points of this research is the validation of yield using vegetative and biophysical indices based on time series NDVI and LAI datasets.
Previous researches had the limitation of obtaining inappropriate validation results due to inadequate ground reference information. Validation of the results was accomplished in this research by physical verification with GPS identification of tea estate locations and corresponding time series yield data from tea estates. In previous studies on the land suitability evaluation of tea, only a few edaphic and climatic parameters were used to determine the areas in different suitability classes [1,19,20,21,22]. However, this research integrated the use of geospatial and remote sensing data with AHP to locate tea estates in different suitability classes. The limitation of this research was disregarding the influence of shade trees on tea estates. A new method needs to incorporate in future studies to remove the shade of trees from high-resolution remote sensing data.

5. Conclusions

This study launched a method of determining suitable lands for tea cultivation in Bangladesh utilizing GIS, satellite remote sensing, and AHP. Among the criteria used, precipitation had the greatest influence (23%), followed by drainage (19%), temperature (15%), and other factors. The weighted overlay using the AHP demonstrated that only 41,460 hectares (3.37%) of land were highly suitable, followed by 110,767 hectares (9.01%) of moderately suitable land. The majority of the area (613,367 hectares), which accounted for 49.87%, were marginally suitable, and a considerable portion of lands (464,246 hectares), estimated as 37.75%, were not suitable for tea cultivation. Among the 135 tea estates, 58% were in moderately suitable areas, 23% were in highly suitable areas, 18% were in marginally suitable areas, and less than 1% were in not suitable areas. The results of the land suitability evaluation for tea in Bangladesh would be very significant in the decision-making process to boost production as well as for the sustainable management of agricultural lands. Thus, land suitability evaluation is essential for understanding the future land use and production trend of tea for the growth of the tea industry in Bangladesh.

Author Contributions

Research Investigation, Methodology, Data Curation, Analysis, Interpretation of Results, and Writing—Original Draft, A.C.D.; Resources and Editing, R.N.; Research Conceptualization, Editing and Supervision T.A.; All authors have read and agreed to the published version of the manuscript.

Funding

This research received no external funding.

Acknowledgments

We would like to thank the University of Tsukuba for supporting this research to develop the multicriteria land suitability evaluation and yield forecasting of tea in Bangladesh. We also express our sincere thanks to the European Space Agency (ESA), the Bangladesh Agricultural Research Council (BARC), and the Bangladesh Tea Board (BTB) for remote sensing, geospatial, geographic, and statistical data. Finally, we express our gratitude to international experts and field enumerators involved in this research.

Conflicts of Interest

The authors declare no conflict of interest.

Appendix A

Table A1. Criteria for the land suitability evaluation of tea.
CriteriaSuitability ClassSub-CriteriaReference
LULCS1Tea estates[57,58]
S2Forest[28,57,58]
S3High agricultural land[57]
NSettlements, water bodies, rivers, and wetlands[6,59]
NDVIS1>0.6[60]
S20.4–0.6[60]
S30.4[60]
N<0[60]
ElevationS1>15 m[1,28]
S210–15 m[1,28]
S37–10 m[1,28]
N<7 m[1,28]
PrecipitationS1>1800 mm[22]
S21600–1800 mm[22]
S31000–1600 mm[22]
TemperatureS118–25 °C[22]
SlopeS15–25°[1]
S2<5°[1]
S3>25°[1]
Soil TextureS1scl, l, cl, sl[22]
S2c, sicl, sic[22]
S3c(ss), ls, s[22]
Soil pHS14.5–5.5[1,33,35,36]
S25.5–7.3[1,33,35,36]
S37.3–8.4[1,33,35,36]
DrainageS1Moderately well drained to well drained[19,61]
S2Imperfectly drained[19,61]
S3Poorly drained[19,61]
NVery poorly drained[61]
Soil typeS1Brown hill soils[41]
S2Gray piedmont soils[42,43]
S3Non-calcareous alluvium, Brown flood plain soils,
Dark gray flood plain soils, Gray flood plain soils, Acid basin clays, Deep-red brown terrace soils
[41,44,45,46]
NPeat, Water bodies, Urban[46]
Distance from roadsS10–1.0 km[47]
S21.0–2.0 km[47]
S32.0–4.0 km[47]
N>4.0 km[47]
Distance from riversS10–0.5 km[47]
S20.5–1.0 km[47]
S31.0–2.0 km[47]
N>2.0 km[47]

References

  1. Jayasinghe, S.L.; Kumar, L.; Sandamali, J. Assessment of potential land suitability for tea (Camellia sinensis (L.) O. Kuntze) in Sri Lanka using a GIS-based multi-criteria approach. Agriculture 2019, 9, 148. [Google Scholar] [CrossRef] [Green Version]
  2. Ahamed, T.N.; Rao, K.G.; Murthy, J.S.R. GIS-based fuzzy membership model for crop-land suitability analysis. Agric. Syst. 2000, 63, 75–95. [Google Scholar] [CrossRef]
  3. Wang, F.; Brent Hall, G.; Subaryono. Fuzzy information representation and processing in conventional GIS software: Database design and application. Int. J. Geogr. Inf. Syst. 1990, 4, 261–283. [Google Scholar] [CrossRef]
  4. McDowell, R.W.; Snelder, T.; Harris, S.; Lilburne, L.; Larned, S.T.; Scarsbrook, M.; Curtis, A.; Holgate, B.; Phillips, J.; Taylor, K. The land use suitability concept: Introduction and an application of the concept to inform sustainable productivity within environmental constraints. Ecol. Indic. 2018, 91, 212–219. [Google Scholar] [CrossRef]
  5. Food and Agriculture Organization. A Framework for Land Evaluation; FAO: Rome, Italy, 1976. [Google Scholar]
  6. Purnamasari, R.A.; Ahamed, T.; Noguchi, R. Land suitability assessment for cassava production in Indonesia using GIS, remote sensing and multi-criteria analysis. Asia-Pac. J. Reg. Sci. 2019, 3, 1–32. [Google Scholar] [CrossRef]
  7. Habibie, M.I.; Noguchi, R.; Shusuke, M.; Ahamed, T. Land suitability analysis for maize production in Indonesia using satellite remote sensing and GIS-based multicriteria decision support system. GeoJournal 2019, 1–31. [Google Scholar] [CrossRef]
  8. Vitousek, P.M. Beyond global warming: Ecology and global change. Ecology 1994, 75, 1861–1876. [Google Scholar] [CrossRef]
  9. Gunathilaka, R.D.; Smart, J.C.; Fleming, C.M. The impact of changing climate on perennial crops: The case of tea production in Sri Lanka. Clim. Chang. 2017, 140, 577–592. [Google Scholar] [CrossRef]
  10. Lambert, J.D.; Yang, C.S. Mechanisms of cancer prevention by tea constituents. J. Nutr. 2003, 133, 3262–3267. [Google Scholar] [CrossRef]
  11. Cooper, R.; Morre, D.J.; Morre, D.M. Medicinal benefits of green tea: Part II. Review of anti-cancer properties. J. Alter. Complem. Med. 2005, 11, 639–652. [Google Scholar] [CrossRef]
  12. Bhattacharya, A.; Saini, U.; Joshi, R.; Kaur, D.; Pal, A.K.; Kumar, N.; Gulati, A.; Mohanpuria, P.; Yadav, S.K.; Kumar, S.; et al. Osmotin-expressing transgenic tea plants have improved stress tolerance and are of higher quality. Transgenic Res. 2014, 23, 211–223. [Google Scholar] [CrossRef] [PubMed]
  13. Islam, M.N.; Al-Amin, M. Life behind leaves: Capability, poverty and social vulnerability of tea garden workers in Bangladesh. Labor Hist. 2019, 60, 571–587. [Google Scholar] [CrossRef]
  14. Bangladesh Tea Board. Statistical Handbook on Bangladesh Tea Industry 2019; Project Development Unit; Bangladesh Tea Board: Sylhet, Bangladesh, 2020; Volume 8, pp. 1–146. [Google Scholar]
  15. Kamruzzaman, M.; Parveen, S.; Das, A.C. Livelihood improvement of tea garden workers: A scenario of marginalized women group in Bangladesh. Asian J. Agric. Ext. Econ. Soc. 2015, 7, 1–7. [Google Scholar] [CrossRef]
  16. International Tea Committee. Annual Bulletin of Statistics; International Tea Committee Ltd.: London, UK, 2017. [Google Scholar]
  17. Bandyopadhyay, S.; Jaiswal, R.K.; Hegde, V.S.; Jayaraman, V. Assessment of land suitability potentials for agriculture using a remote sensing and GIS based approach. Int. J. Remote Sens. 2009, 30, 879–895. [Google Scholar] [CrossRef]
  18. Clevers, J.G.P.W.; Büker, C.; Van Leeuwen, H.J.C.; Bouman, B.A.M. A framework for monitoring crop growth by combining directional and spectral remote sensing information. Remote Sens. Environ. 1994, 50, 161–170. [Google Scholar] [CrossRef]
  19. Nguyen, H.; Nguyen, T.; Hoang, N.; Bui, D.; Vu, H.; Van, T. The application of LSE software: A new approach for land suitability evaluation in agriculture. Comput. Electron. Agric. 2020, 173, 1–16. [Google Scholar] [CrossRef]
  20. Li, B.; Zhang, F.; Zhang, L.W.; Huang, J.F.; Jin, Z.F.; Gupta, D.K. Comprehensive suitability evaluation of tea crops using GIS and a modified land ecological suitability evaluation model. Pedosphere 2012, 22, 122–130. [Google Scholar] [CrossRef]
  21. Chanhda, H.; Wu, C.F.; Ye, Y.M.; Ayumi, Y. GIS based land suitability assessment along Laos-China border. J. Forest. Res. 2010, 21, 343–349. [Google Scholar] [CrossRef]
  22. Gahlod, N.S.; Binjola, S.; Ravi, R.; Arya, V.S. Land-site suitability evaluation for tea, cardamom and rubber using Geo-spatial technology in Wayanad district, Kerala. J. Appl. Nat. Sci. 2017, 9, 1440–1447. [Google Scholar] [CrossRef] [Green Version]
  23. Collette, B.B.; Nauen, C.E. FAO Species Catalogue; Scombrids of the World; An Annotated and Illustrated Catalogue of Tunas, Mackerels, Bonitos and Related Species Known to Date; FAO Fisheries Synopsis, Food and Agriculture Organization of the United Nations: Rome, Italy, 1983; Volume 2, pp. 1–137. ISBN 92-5-101381-0. [Google Scholar]
  24. Kamruzzaman, M.; Shaw, R. Flood and sustainable agriculture in the Haor basin of Bangladesh: A review paper. Univ. J. Agric. Res. 2018, 6, 40–49. [Google Scholar] [CrossRef] [Green Version]
  25. Rouse, J.W.; Haas, R.H.; Schell, J.A.; Deering, D.W. Monitoring Vegetation Systems in the Great Plains with ERTS. In Proceedings of the Third Earth Resources Technology Satellite—1 Symposium, Goddard Space Flight Center, Greenbelt, MD, USA, 10–14 December 1973; NASA SP-351. pp. 309–317. Available online: https://ntrs.nasa.gov/citations/19740022614 (accessed on 16 December 2020).
  26. Romano, G.; Ricci, G.F.; Gentile, F. Influence of different satellite imagery on the analysis of riparian leaf density in a mountain stream. Remote Sens. 2020, 12, 3376. [Google Scholar] [CrossRef]
  27. Phan, P.; Chen, N.; Xu, L.; Chen, Z. Using Multi-Temporal MODIS NDVI Data to monitor tea Status and forecast yield: A case study at Tanuyen, Laichau, Vietnam. Remote Sens. 2020, 12, 1814. [Google Scholar] [CrossRef]
  28. Hajiboland, R. Environmental and nutritional requirements for tea cultivation. Folia Hort. 2017, 29, 199–220. [Google Scholar] [CrossRef] [Green Version]
  29. Bozdağ, A.; Yavuz, F.; Günay, A.S. AHP and GIS based land suitability analysis for Cihanbeyli (Turkey) County. Environ. Earth Sci. 2016, 75, 813. [Google Scholar] [CrossRef]
  30. Ahmed, S.; Stepp, J.R.; Orians, C.; Griffin, T.; Matyas, C.; Robbat, A.; Buckley, S. Effects of extreme climate events on tea (Camellia sinensis) functional quality validate indigenous farmer knowledge and sensory preferences in tropical China. PLoS ONE 2014, 9, e109126. [Google Scholar] [CrossRef] [Green Version]
  31. Khormali, F.; Ayoubi, S.; Foomani, F.K.; Fatemi, A. Tea yield and soil properties as affected by slope position and aspect in Lahijan area, Iran. Int. J. Plant. Prod. 2012, 1, 99–111. [Google Scholar] [CrossRef]
  32. Zhang, W.L.; Xie, H.; Li, T.; Wang, D.D. Effects of different soil texture and management pattern on soil properties and tea quality of tea garden. Hubei Agric. Sci. 2017, 10, 7. [Google Scholar]
  33. Natesan, S. Tea soils. In Global Advances in Tea Science; Jain, N.K., Ed.; Aravali Books International Pty Ltd.: New Delhi, India, 1999. [Google Scholar]
  34. Foy, C.D.; Chaney, R.L.; White, M.C. The physiology of metal toxicity in plants. Ann. Rev. Plant. Physiol. 1978, 29, 511–526. [Google Scholar] [CrossRef]
  35. Sultana, J.; Siddique, M.N.A.; Kamaruzzaman, M.; Halim, M.A. Conventional to ecological: Tea plantation soil Management in Panchagarh district of Bangladesh. J. Sci. Technol. Environ. Inform. 2014, 1, 27–37. [Google Scholar] [CrossRef]
  36. Hussain, S.G.; Chowdhury, M.K.A.; Chowdhury, M.A.H. Land Suitability Assessment and Crop. Zoning of Bangladesh; Bangladesh Agricultural Research Council (BARC): Farmgate, Dhaka, Bangladesh, 2012; pp. 1–110. [Google Scholar]
  37. Parthasarathy, V.A.; Chattopadhyay, P.K.; Bose, T.K. Plantation Crops-I; Naya Udyog: Calcutta, India, 2006; ISBN 13: 9788185971971. [Google Scholar]
  38. Mukhopadhyay, M.; Mondal, T.K. Cultivation, improvement, and environmental impacts of tea. Oxford Res. Encycl. Environ. Sci. 2017. [Google Scholar] [CrossRef]
  39. Rama Rao, N.; Kapoor, M.; Sharma, N.; Venkateswarlu, K. Yield prediction and waterlogging assessment for tea plantation land using satellite image-based techniques. Int. J. Remote Sens. 2007, 28, 1561–1576. [Google Scholar] [CrossRef]
  40. Bhagat, R.M.; Baruah, R.D.; Safique, S. Climate and Tea [Camellia sinensis (L.) O. Kuntze] Production with Special Reference to North Eastern India: A Review. J. Environ. Res. Develop. 2010, 4, 1017–1028. Available online: https://www.cabdirect.org/cabdirect/abstract/2011322704 (accessed on 16 December 2020).
  41. Egashira, K.; Aramaki, K.; Yoshimasa, M.; Takeda, A.; Yamasaki, S.I. Variation of rare earth element of soils in the process of soil formation. Clay Sci. 2007, 13, 117–124. [Google Scholar] [CrossRef]
  42. Prokop, P.; Ploskonka, D. Natural and human impact on the land use and soil properties of the Sikkim Himalayas piedmont in India. J. Environ. Manag. 2014, 138, 15–23. [Google Scholar] [CrossRef] [PubMed] [Green Version]
  43. Akhtaruzzaman, M.; Haque, M.E.; Osman, K.T. Morphological, physical and chemical characteristics of hill forest soils at Chittagong University, Bangladesh. Open J. Soil Sci. 2014, 4, 26–35. [Google Scholar] [CrossRef] [Green Version]
  44. Egashira, K.; Hagimine, M.; Moslehuddin, A.Z.M. Fixed ammonium in some Bangladesh soils. Soil Sci. Plant. Nutr. 1998, 44, 269–272. [Google Scholar] [CrossRef]
  45. Bhuiya, Z.H. Organic matter status and organic recycling in Bangladesh soils. Resour. Conserv. 1987, 13, 117–124. [Google Scholar] [CrossRef]
  46. Islam, M.A.; Hasan, M.A.; Farukh, M.A. Application of GIS in general soil mapping of Bangladesh. J. Geogr. Inform. Syst. 2017, 9, 604–621. [Google Scholar] [CrossRef] [Green Version]
  47. Pramanik, M.K. Site suitability analysis for agricultural land use of Darjeeling district using AHP and GIS techniques. Model. Earth Syst. Environ. 2016, 2, 1–22. [Google Scholar] [CrossRef] [Green Version]
  48. Tewari, S.; Kulhavy, J.; Rock, B.N.; Hadas, P. Remote monitoring of forest response to changed soil moisture regime due to river regulation. J. For. Sci. 2003, 49, 429–438. [Google Scholar] [CrossRef] [Green Version]
  49. Tuvshinbayar, D.; Erdenetuya, B.; Erkhembayar, E.; Batbileg, B.; Sarangerel, J. Some Results of crop stress monitoring by remote sensing in northern Mongolia. Mong. J. Agric. Sci. 2017, 21, 59–63. [Google Scholar] [CrossRef] [Green Version]
  50. Saaty, T.L. How to make a decision: The analytic hierarchy process. Eur. J. Operat. Res. 1990, 48, 9–26. [Google Scholar] [CrossRef]
  51. Saaty, T.L. Group decision making and the AHP. In The Analytic Hierarchy Process; Golden, B.L., Wasil, E.A., Harker, P.T., Eds.; Springer: Berlin/Heidelberg, Germany, 1989. [Google Scholar]
  52. Aldababseh, A.; Temimi, M.; Maghelal, P.; Branch, O.; Wulfmeyer, V. Multi-criteria evaluation of irrigated agriculture suitability to achieve food security in an arid environment. Sustainability 2018, 10, 803. [Google Scholar] [CrossRef] [Green Version]
  53. Rashid, M.F.A. Capabilities of a GIS-based multi-criteria decision analysis approach in modelling migration. GeoJournal 2019, 84, 483–496. [Google Scholar] [CrossRef]
  54. Hinton, J.C. GIS and remote sensing integration for environmental applications. Int. J. Geogr. Inf. Syst. 2007, 10, 877–890. [Google Scholar] [CrossRef]
  55. Amarathunga, S.L.D.; Panabokke, C.R.; Pathiranage, S.R.W.; Amarasinghe, L.; Wijeratne, M.A. Land suitability classification and mapping of tea lands in Ratnapura district. Sri Lanka J. Tea Sci. 2008, 73, 1–10. [Google Scholar]
  56. Elsheikh, R.; Shariff, A.R.B.M.; Amiri, F.; Ahmad, N.B.; Balasundram, S.K.; Soom, M.A.M. Agriculture Land Suitability Evaluator (ALSE): A decision and planning support tool for tropical and subtropical crops. Comput. Electron. Agric. 2013, 93, 98–110. [Google Scholar] [CrossRef] [Green Version]
  57. Su, S.; Wan, C.; Li, J.; Jin, X.; Pi, J.; Zhang, Q.; Weng, M. Economic benefit and ecological cost of enlarging tea cultivation in subtropical China: Characterizing the trade-off for policy implications. Land Use Policy 2017, 66, 183–195. [Google Scholar] [CrossRef]
  58. Su, S.; Zhou, X.; Wan, C.; Li, Y.; Kong, W. Land use changes to cash crop plantations: Crop types, multilevel determinants and policy implications. Land Use Policy 2016, 50, 379–389. [Google Scholar] [CrossRef]
  59. Pezeshki, S.R. Wetland plant responses to soil flooding. Environ. Exp. Bot. 2001, 46, 299–312. [Google Scholar] [CrossRef]
  60. Choudhary, K.; Shi, W.; Boori, M.S.; Corgne, S. Agriculture phenology monitoring using NDVI time series based on remote sensing satellites: A case study of Guangdong, China. Optic. Memory Neural Netw. 2019, 28, 204–214. [Google Scholar] [CrossRef]
  61. Sys, C.; Van Ranst, E.; Debaveye, J.; Beernaert, F. Land Evaluation—Part. III—Crop. Requirements; Agricultural Publications-No. 7; General Administration for Development Cooperation: Brussels, Belgium, 1993; Available online: http://hdl.handle.net/1854/LU-233235 (accessed on 16 December 2020).
Figure 1. Geographical extent of the study area: (a) Bangladesh on the world map, (b) Bangladesh, (c) Sylhet Division, and (d) physiographic image of Sylhet Division.
Remotesensing 12 04136 g001
Figure 2. Conceptual framework for the land suitability evaluation of tea estates.
Remotesensing 12 04136 g002
Figure 3. Yield estimation procedure from phenological datasets extracted from Sentinel 2 MSI.
Remotesensing 12 04136 g003
Figure 4. Reclassification of criteria: (a) LULC, (b) NDVI, (c) Elevation, (d) Precipitation, (e) Temperature, (f) Slope, (g) Soil texture, (h) Soil pH, (i) Drainage, (j) Soil type, (k) Distance from roads, and (l) Distance from rivers.
Remotesensing 12 04136 g004
Figure 5. Suitability classes for tea estates.
Remotesensing 12 04136 g005
Figure 6. Validation of tea estates in different land suitability classes.
Remotesensing 12 04136 g006
Figure 7. Regression analysis for yield prediction of tea using phenological indices and ground reference time series yield information.
Remotesensing 12 04136 g007
Figure 8. Yield maps of tea obtained from phenological indices: (a) NDVI 2017, (b) LAI 2017, (c) NDVI 2018, (d) LAI 2018, (e) NDVI 2019, and (f) LAI 2019.
Remotesensing 12 04136 g008
Table 1. Generated map and sources of original data for the land suitability evaluation of tea.
No.DataDescriptionSource
1Map of LULC20 m resolutionSentinel-2, European Space Agency (ESA), 2019
2Map of NDVI20 m resolutionSentinel-2, European Space Agency (ESA), 2019
3Map of elevation30 m resolutionShuttle Radar Topography Mission (SRTM), NASA, 2019
4Map of precipitationScale 1:50,000Bangladesh Agricultural Research Council (BARC), 2019
5Map of temperatureScale 1:50,000Bangladesh Agricultural Research Council (BARC), 2019
6Map of slopeScale 1:50,000Bangladesh Agricultural Research Council (BARC), 2019
7Map of soil textureScale 1:50,000Bangladesh Agricultural Research Council (BARC), 2019
8Map of soil pHScale 1:50,000Bangladesh Agricultural Research Council (BARC), 2019
9Map of drainage Scale 1:50,000Bangladesh Agricultural Research Council (BARC), 2019
10Map of soil type Scale 1:50,000Bangladesh Agricultural Research Council (BARC), 2019
11Map of distance from RoadsScale 1:50,000Bangladesh Agricultural Research Council (BARC), 2019
12Map of distance from Rivers Scale 1:50,000Bangladesh Country Almanac (BCA), 2019
13Location of tea estatesGPS dataField survey, 2019
14Tea productionStatistical dataBangladesh Tea Board (BTB), 2017–2019
Table 2. Reclassification of the criteria for the land suitability evaluation of tea.
CriteriaSuitability ClassesValues/Sub-CriteriaArea (%)Area (ha)
LULCS1Tea estates16.41201,818
S2Forest10123,008
S3High agricultural land11.87145,964
NSettlements, water bodies, rivers, and wetlands61.72759,050
NDVIS1>0.62.3128,362
S20.4–0.626.51325,998
S30–0.4 67.77833,430
N<03.4242,051
ElevationS1>15 m35.05431,045
S210–15 m28.75353,533
S37–10 m22.28274,016
N<7 m13.92171,246
PrecipitationS1>1800 mm38.18469,553
S21600–180046.54572,386
S31000 + 1600 15.28187,901
TemperatureS118–25 °C1001,229,840
SlopeS15–25°14.73181,103
S2<5° 85.121046,828
S3>25°0.161909
Soil textureS1scl, l, cl, sl71.36877,555
S2c, sicl, sic27.22334,729
S3c(ss), ls, s1.4317,556
Soil pHS14.5–5.513.99172,008
S25.5–7.381.05996,795
S37.3–8.44.9661,037
DrainageS1Moderately well drained to well drained13.36164,353
S2Imperfectly drained9.60118,083
S3Poorly drained66.30815,421
NVery poorly drained10.73131,983
Soil typeS1Brown hill soils13.24162,782
S2Gray piedmont soils11.84145,659
S3Non-calcareous alluvium, Brown flood plain soils,
Dark gray flood plain soils, Gray flood plain soils, Acid basin clays, Deep-red brown terrace soils
73.72906,642
NPeat, Water bodies, Urban1.2014,757
Distance from roadsS10–1.0 km13.97171,759
S21.0–2.0 km14.51148,404
S32.0–4.0 km21.81268,246
N>4.0 km49.72611,431
Distance from riversS10–0.5 km6.2376,601
S20.5–1.0 km11.68143,618
S31.0–2.0 km18.03221,779
N>2.0 km64.06787,842
Table 3. Scale of preference for the analytical hierarchy process (AHP) pairwise comparison by Saaty (1989) [51].
ScaleDegree of PreferenceDescription
1Equal ImportanceTwo factors contribute equally
3Moderate importance of one factor over other factorExperience and judgment slightly favor one over another
5Strong importanceExperience and judgment strongly favor one over another
7Very strong importanceExperience and judgment very strongly favor one over another
9Extreme importanceThe evidence favoring one over another is of the highest possible order of affirmation
2,4,6,8Intermediate values between two adjacent scalesWhen compromise is required
ReciprocalsOpposite of the aboveUsed for inverse comparisons
Table 4. Pairwise comparison for scoring the criteria for tea cultivation.
CriteriaLULCNDVIElevationPrecipitationTemperatureSlopeSoil TextureSoil pHDrainageSoil TypeDistance from RoadsDistance from Rivers
LULC110.330.140.200.200.330.200.140.330.330.33
NDVI110.330.110.140.200.330.200.140.330.330.33
Elevation3310.200.330.3310.330.20111
Precipitation79513.005.00531577
Temperature5730.3313.00550.20555
Slope5530.200.331310.33333
Soil texture3310.200.200.3310.330.20133
Soil pH5530.330.203.00110.33355
Drainage77515.003.0053.001577
Soil type3310.200.200.3310.330.20111
Distance from roads3310.140.200.330.330.200.14111
Distance from rivers3310.140.200.330.330.200.14111
Table 5. Normalized matrix of the criteria for tea cultivation.
CriteriaLULCNDVIElevationPrecipitationTemperatureSlopeSoil TextureSoil pHDrainageSoil TypeDistance from RoadsDistance from Rivers
LULC0.0220.0200.0140.0360.0180.0120.0140.0140.0350.0130.0100.010
NDVI0.0220.0200.0140.0280.0130.0120.0140.0140.0350.0130.0100.010
Elevation0.0650.0600.0410.0500.0300.0200.0430.0230.0500.0380.0290.029
Precipitation0.1520.1800.2030.2500.2720.2930.2140.2030.2480.1880.2020.202
Temperature0.1090.1400.1220.0830.0910.1760.2140.3380.0500.1880.1440.144
Slope0.1090.1000.1220.0500.0300.0590.1290.0680.0830.1130.0870.087
Soil texture0.0650.0600.0410.0500.0180.0200.0430.0230.0500.0380.0870.087
Soil pH0.1090.1000.1220.0830.0180.1760.0430.0680.0830.1130.1440.144
Drainage0.1520.1400.2030.2500.4540.1760.2140.2030.2480.1880.2020.202
Soil type0.0650.0600.0410.0500.0180.0200.0430.0230.0500.0380.0290.029
Distance from roads0.0650.0600.0410.0360.0180.0200.0140.0140.0350.0380.0290.029
Distance from rivers0.0650.0600.0410.0360.0180.0200.0140.0140.0350.0380.0290.029
Table 6. Consistency random index (RI) [51].
n123456789101112131415
RI000.580.91.121.241.321.411.451.491.511.481.561.571.59
Table 7. Accuracy assessment for land use and land cover (LULC).
ComponentsForestsTea EstatesWater
Bodies
SettlementsHigh
Agril. Land
RiversWet
Lands
Total (User)% Accuracy
Forests70000007100
Tea Estates07000007100
Water
Bodies
0060001785.71
Settlements1006000785.71
High
Agril. Land
00007007100
Rivers0000052771.43
Wetlands00000088100
Total (Producer)8766751150
% Accuracy87.5100100100100100100
Table 8. AHP weights for the assessment of the relative importance of the criteria.
CriteriaExpert A (30 Years)Expert B (10 Years)Expert C (12 Years)Expert D (12 Years)Expert E (8 Years)Expert F (10 Years)Expert G (12 Years)Expert H (15 Years)Expert I (12 Years)Expert J (8 Years)AverageWeight
LULC0.0240.0230.0220.0330.0370.0380.0300.0180.0190.0200.0263
NDVI0.0240.0180.0220.0210.0200.0170.0340.0170.0190.0210.0212
Elevation0.0350.0400.0510.0880.0580.0680.0540.0400.0630.0470.0545
Precipitation0.2140.2440.2480.2000.2490.2580.2020.2170.2320.2050.22723
Temperature0.1330.1770.1330.1450.1350.1810.1550.1500.1420.1290.14815
Slope0.0950.0820.0900.0780.0770.0660.0760.0860.0710.1000.0828
Soil texture0.0660.0450.0480.0480.0490.0380.0550.0480.0520.0480.0505
Soil pH0.1040.1050.0850.0910.1080.0950.1140.1000.0930.0890.09810
Drainage0.1860.1820.1910.2000.1780.1570.1890.2190.2070.2260.19419
Soil type0.0710.0460.0650.0530.0510.0410.0500.0390.0620.0500.0535
Distance from roads0.0240.0190.0230.0230.0200.0200.0200.0330.0200.0200.0222
Distance from rivers0.0240.0190.0230.0230.0200.0200.0200.0330.0200.0460.0253
Table 9. Areas in the land suitability classes of tea.
Suitability LevelPixel CountsArea (%)Area (ha)
S1 (Highly suitable)15353.3741,460
S2 (Moderately suitable)41019.01110,767
S3 (Marginally suitable)22,70949.87613,367
N (Not suitable)17,18837.75464,246
Publisher’s Note: MDPI stays neutral with regard to jurisdictional claims in published maps and institutional affiliations.

