Article

Implications of Green Logistics Management on Sustainable Business and Supply Chain Performance: Evidence from a Survey in the Greek Agri-Food Sector

by
Panagiotis Trivellas
1,*,
Georgios Malindretos
2 and
Panagiotis Reklitis
1
1
Department of Agribusiness and Supply Chain Management, Agricultural University of Athens, 1st km Old National Road Thiva-Eleusis, 32200 Thiva, Greece
2
School of Environment, Geography and Applied Economics, Harokopio University, 17676 Kallithea, Greece
*
Author to whom correspondence should be addressed.
Sustainability 2020, 12(24), 10515; https://doi.org/10.3390/su122410515
Submission received: 25 October 2020 / Revised: 9 December 2020 / Accepted: 12 December 2020 / Published: 15 December 2020

Abstract

:
Green agri-food supply chains are increasingly attracting research interest, owing to their potential capacity for resilience against recent crises (e.g., financial, COVID-19) as well as end-consumers’ concerns on sustainability issues. In this context, this paper aims to explore the relationship between green supply chain management practices and three different performance aspects, namely, supply chain, green (environmental) and business performance, and controlling for environmental dynamism. Field research was conducted through a structured questionnaire contacted to 134 executives of firms in the agri-food sector in Greece. The results reveal that information sharing, logistics networking and transportation are the most powerful factors that impact sustainable, business and supply chain performance. In addition, green packaging is related to financial and social performance aspects. Interestingly, green warehousing and logistics emissions failed to establish any relationship with performance outcomes. The conclusions and recommendations drawn in the present study are expected to provide meaningful guidance for the supply chain decision-making process, as logistics managers are becoming increasingly aware of exploiting all available resources, knowhow and competitive advantages for attaining sustainable performance.

1. Introduction

Interest in green logistics and sustainable supply chains has been rapidly growing for over two decades and the topic is becoming mainstream. Meeting the “historical challenge” of adjustment to the ever-changing business, economic, social and physical environment, has increasingly attracted the interest of many academics, management practitioners and policy makers. While conventional agriculture is driven almost solely by productivity and profit, sustainable agriculture integrates biological, chemical, physical, ecological, economic and social sciences in a comprehensive way to develop new farming practices that are safe and do not degrade our environment [1]. In the agri-food sector, farmers, agribusinesses, governments and civil society must cooperate to promote inclusive, fair and efficient food systems, better integrate small farmers into supply chains and agribusiness and improve their access to markets, characterized by the ever-changing consumption patterns [2].
In the past few decades, much literature on supply chain management in the manufacturing and service sectors has been produced, but little attention has been paid to the agriculture sector [3]. Particularly, logistics decision-making process factors and their impact on different aspects of performance have not attracted much attention of the academia. However, the specificities that differentiate agri-food supply chains from other types of supply chains (such as shelf-life constraints and perishability of products, seasonality in cultivation), together with the growing ethical, societal and ecological challenges involved in their business, make it necessary to develop concrete decision tools, founded on the substantial linkage of various attributes with different performance dimensions in the light of sustainability. It is yet a largely unsettled actual challenge, calling for collective use of all available resources, know-how and continuous study, although literature contains many types and subdivisions of key performance indicators regarding sustainability.
In this respect, this paper focuses primarily on the sufficient understanding of green logistics management’s (GLM) various elements, functions and activities in the framework of sustainable development imperatives within a dynamic business environment, turning the attention to executive officers of firms in the agri-food supply chain. It then tests the hypotheses relating green logistics management components (drivers) in pursuit of their impact to three dimensions of sustainable performance: supply chain, green (environmental) and business performance.
This study therefore highlights the need for a new holistic framework which integrates these performance dimensions into the GLM decision-making process. Moreover, it is expected to provide useful insights into the prioritization of logistics decisions’ factors, in line with the corresponding company’s performance goals. In this sense, the findings of this research will support managers and policy makers to have more confidence in the adoption of GLM practices to improve performance and researchers to better channel their efforts in studying the GLM practices.

2. Green Logistics/Supply Chain Management Impact to Sustainable Performance

Growing environmental, social and ethical concerns have led to increased pressures from consumer organizations, environmental advocacy groups and policy makers for agri-food companies to deal with their supply chains [4]. The increasing awareness regarding environmental effects has attracted the attention of many researchers recently to focus more on studying and investigating green supply-chain management (GSCM) in various fields and sectors [5]. The particular requirements set in agriculture and food logistics ask for improving the conditions of transportation and storage of perishable goods, affecting public health, as well as for information in real-time to avoid harmful consequences and waste [6]. Stakeholders demand corporate responsibility to go beyond product quality and to extend to areas of environmental and social sustainability. Although green logistics management (GLM) and green supply chain management (GSCM) have attracted research interest by many academics, a literature review shows that studies on the GLM and sustainability performance are fragmented and incomplete, representing at the same time a relatively new research area (Table A1, Appendix A), particularly in the agriculture sector [7].
The functions of logistics are interdependent, and measures in one area usually have trade-offs in other areas of sustainability. This makes the logistics decision-making process even more complex. An example of these functions’ interdependences is that a reusable packaging system increases resource efficiency, resulting cost savings, but also produces more reverse logistics routes and subsequently higher emissions in transportation (trade-off between environmental and business performance). In this line, Bhattacharya et al. [8] and Khan and Qianli [9] found that renewable energy usage in supply chain operations cannot only improve environmental performance in terms of mitigating carbon emissions but can also improve economic development and solve the problems that perplex enterprise managers [10]. Thus, green supply chain decisions have been expected to further strengthen the environmental (green) and financial performance, which, in turn, positively impact organizational performance [11,12,13,14]. Thus, the literature has covered a range of facets pertaining to the effects of various GLM items to different dimensions of performance, such as Green (Environmental), Business, Financial, Operational, Supply Chain and Social Performance (Table A2, Appendix A).
In this context, this paragraph shifts the emphasis on performance implications according to relevant scientific studies worldwide, since green logistics/supply chain management drivers need sufficient understanding in relation to sustainable performance.
An interesting study from Azevedo et al. [15] suggested three groups, namely (a) GSCM practices associated directly with interactions between a firm and their suppliers, (b) GSCM practices dependent only on firms’ decisions to deploy an environmentally friendly behavior (such as minimizing waste, ISO 14001 certification, or decrease of consumption of hazardous and toxic materials) and finally, (c) GSCM practices that involve customers.
Packing has been considered as a significant green logistics initiative, since it directly impacts the environment as well as operational efficiency. The main task of sustainable packaging design is to balance the function of sustainability with the critical packaging functions in the case of agricultural perishable products, such as protection and preservation of the packaged goods. In this line, in order to improve farmers’ decision-making regarding supply chain participation, proper packaging is one of the critical factors underlying the assumption of sustainability of agri-food industries [16]. Better packaging, along with rearranged loading patterns and unit loads, can reduce materials’ usage, increase space utilization in the warehouse and in the trailer and reduce the amount of handling required [3]. Moreover, returnable packaging as a critical environmental logistics consideration that prerequisites an effective reverse logistics channel, has been fostered by relevant take-back legislation in some countries.
In a logistics system, the transportation is the most important component and therefore, it has a huge effect on the total NPV (Net Present Value), as every subsection of the entire logistic is related with the transportation time [17]. It is well known that freight transportation accounts for the largest share of logistics emissions. Therefore, transportation emission reduction practice, selection of transportation modes [18] and transportation network optimization are hot topics of green logistics. A number of decisions regarding modes of transportation (greener vehicles), efficient loading and unloading and optimization of vehicles’ routing affect green supply chain in both forward and reverse logistics networks. Distribution and transportation processes are also important operational issues that are most closely tied to the characteristics and requirements of the customer. Attention has recently been directed to electric vehicles that are perceived as key technology in the automotive industry to contribute to sustainable development with lower greenhouse gas emissions, less air pollution and new job opportunities, with positive social impact [19,20]. According to McKinnon [21], the main parameters of sustainable transportation are modal split, average number of changes of transportation mode, average length of haul, average load on laden trips, average percentage of empty runs, other externalities per vehicle-km and per unit of throughput (e.g., noise, accidents), energy efficiency of transport vehicle and emissions per unit of energy.
Warehousing represents undoubtedly a critical component of a distribution network, since it is considered as the bridge between vendors and consumers. In effect, it directly impacts supply chain performance, in terms of lead times from vendors as well as delivery times to customers (speed of delivery, otif—“on time/in full”). The selection of a strategic location of a sustainable warehouse is a multi-criteria decision-making problem and has a great importance for many companies as it improves efficiency of the overall supply chain [22]. Sustainable warehouse location selection decision would not only have to consider the economic factors, such as rent and operations costs, but also balance the social and environmental effects that occur within the warehouse compound as well as its surrounding vicinity, which has a crucial role in the supply chain management process [15]. Warehousing and production facilities’ location has been extensively discussed in supply chain and logistics industry. Thus, it was already found by Bogataj et al. [23] that facility location can reduce the logistics costs, thus, using several transportation modes separately or combined for global supply chain management can be utilized to reduce logistics costs further, which would be a major extension of this model. Moreover, Sarkar and Majumder [24] conducted a study on the three-dimensional facility location problem, where they proved if the advanced transportation mode is independent of retailers’ demand, then the maximum cost reduction is possible.
One of the key aspects to green supply chains is to improve both economic and environmental performance by establishing long-term buyer–supplier relationships, provided that suppliers fulfill specific environmental requirements. In fact, suppliers in many cases have been hard pressed to find any business opportunities elsewhere without initiating GSCM practices [25]. In this context, enterprises have developed a diverse set of initiatives for green SCM, including screening suppliers for environmental performance and providing training to build supplier environmental management capacity.
Access to markets, adequate information, knowledge and technologies all play a strong role in driving the farmers’ choice of production towards sustainable production and distribution of food [4]. Apparently, there is a need to overcome “asymmetric information” between upstream and downstream partners in the agri-food chain through advancement of information technology that eases information integration, innovation and fosters synergic action and a value delivery network. A review of the literature regarding various variables of supply chain management (SCM) has shown that particularly Small and Medium Enterprises (SMEs) can be benefited by exploiting Information Technology (IT) enablers [26], which is in line with other studies’ findings that highlight the need for “information sharing” as a key criterion and main enabler that influences trust and innovation in SCM [27,28] and fosters the foundation of an effective logistics and also even a regional network. In this respect, according to a Co-operatives Supply Chain Integration model proposed by Malindretos et al. [29], the collaboration opportunities towards an integrated value agri-food chain network must be explored—based on trust and synergic mentality—including horizontal patterns (form of cooperatives), vertical close relationships, along with synergies with other sectors such as tourism and civilization organizations.
Inter-organizational collaboration is even more important for managing the internal and external coordination and cooperation in order to have the system successfully implemented throughout the whole supply chains [30]. In this direction, three organizational variables, namely employee satisfaction, operational efficiency and relational efficiency, seem to affect business performance [31]. Moreover, companies that implement GSCM practices must ensure that both the organization and its employees accomplish the overall organizational objectives, such as cost-saving, cycle time reduction, improved environmental quality and overall greater customer values, as well as individual goals of the employees [31]. The central role of integration with the social dimension supports significant research results about the role of inter-organizational resources in the sustainable supply chain management (SSCM) [32].
In retrospect, this study addresses green logistics management elements and their impact on different aspects of sustainability in the agricultural sector.

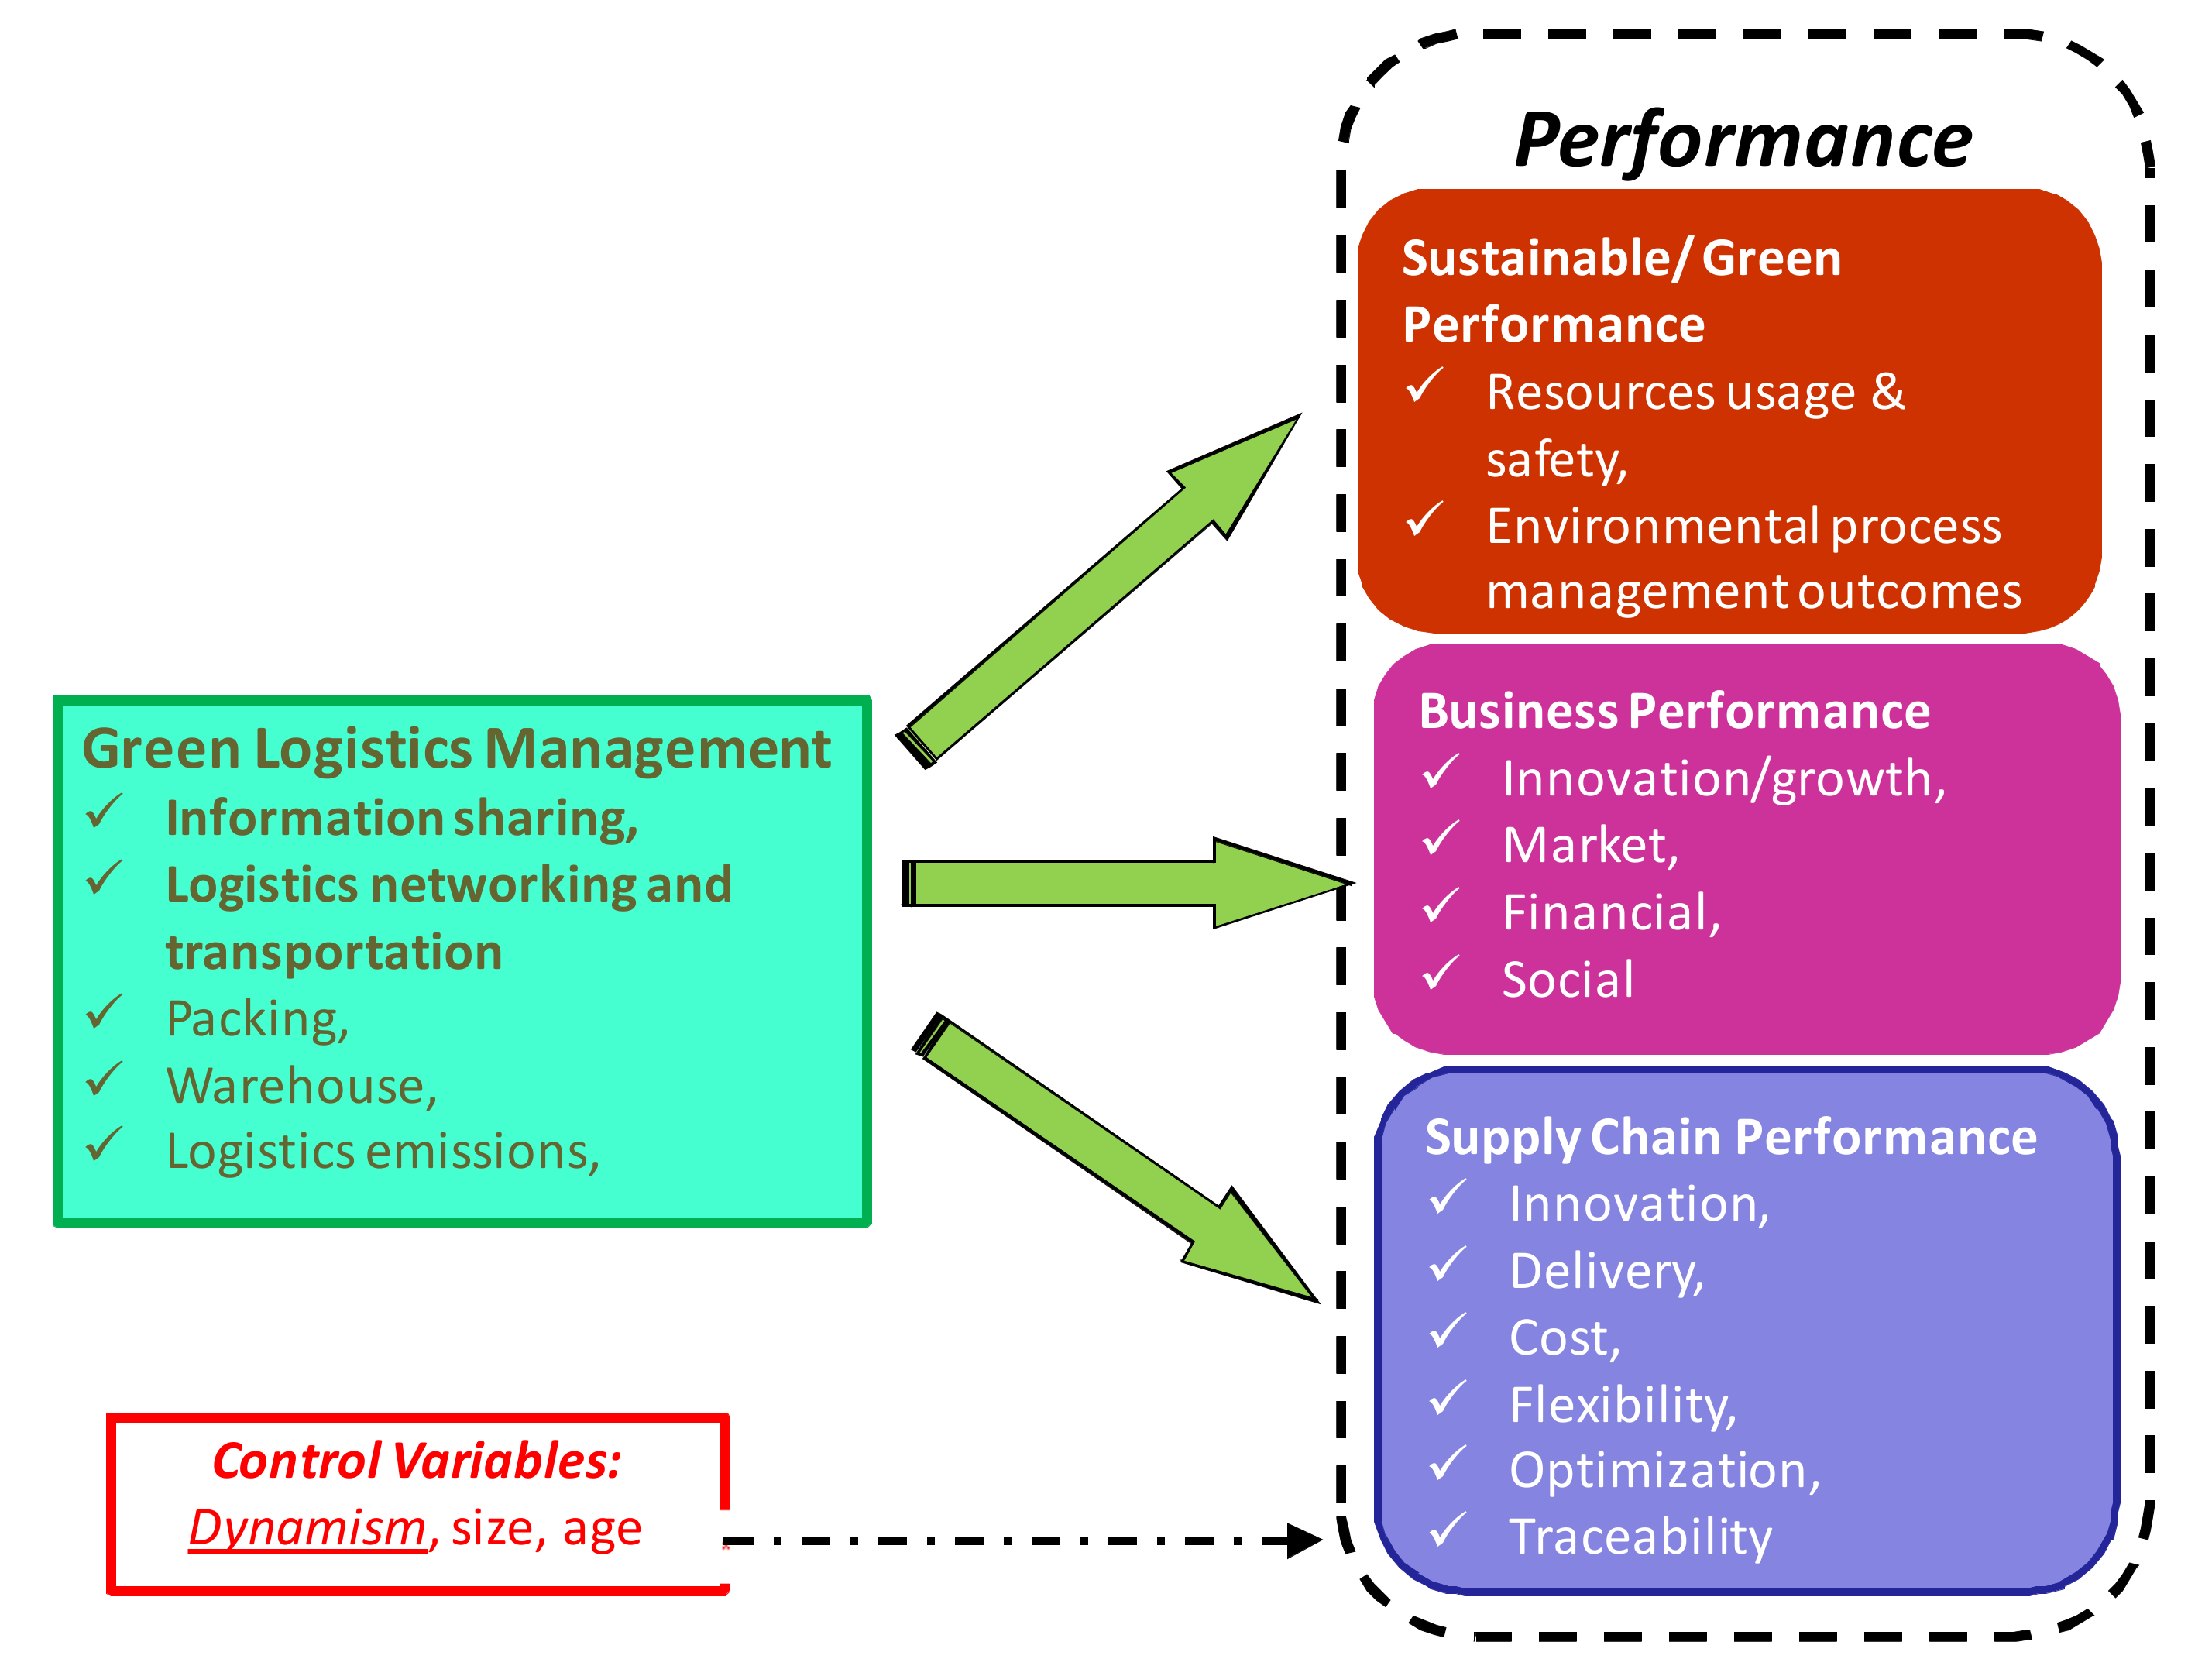
3. Conceptual Framework

Interdisciplinary research has integrated the efforts of management, engineering, physical and social sciences to investigate the issues relevant to sustainability and sustainable development. In this context, a range of different research methods have been used to gain diverse insights; however, no single research method is seen as being superior to any other, but they are rather considered as complementing each other [33].
The turbulence of the environment and the dynamics of changes in terms of products, technologies, competition and customer preferences constitute “dynamism”, which was operationalized by an empirically validated scale (e.g., References [34,35]). Moreover, firm’s age and size are used in the statistical analysis as control variables, in order to reduce the possibility of spurious results caused by their potential association with variables such as market performance. In addition, respondents’ gender, age, education level and working experience were tested for their association with our research design, and no significant effects were detected.
This study’s conceptual framework focuses on the connection between green logistics items and sustainable performance with its different constructs, through a structured questionnaire in an empirical study of 134 enterprises in the agri-food sector in Greece. More specifically, these constructs include Business, Supply Chain and Green dimensions of sustainable performance, linked with specific Key Performance Indicators (KPIs), derived from a critical review of the relevant literature in the last decade 2010–2020 (Table A1, Appendix A). Thus, 16 items were selected in five different areas to measure GLM (referred as “Items groups”, Table 1), namely Packing, Information sharing, Warehousing, Logistics emissions and Logistics networking/Transport.
Business performance integrates market, financial, innovation/growth and social aspects of performance, which presents the 14 KPIs that corresponds to these aspects (Table 2).
Supply chain performance includes 6 groups of KPIs, namely Supply Chain Innovation, Delivery, Cost, Flexibility, Optimization and Traceability, in an overall group of 11 KPIs (Table 3).
For the third dimension of performance, Green Performance, 8 items (KPIs) were selected, grouped in two groups, namely, (a) Resources usage and safety and (b) Environmental process management performance (Table 4).
Thus, the KPIs adopted epitomize the different GLM and performance dimensions included in a holistic agri-food supply chain framework rather than covering the whole range of their content. For example, this study’s performance items are in alignment with Aramyan et al.’s [46] four main categories in agri-food supply chains effectiveness, (i.e., efficiency, flexibility, responsiveness and food quality), as well as Bourlakis et al.’s [48] and Gold et al.’s [47] agri-food sustainable supply chains dimensions (e.g., responsiveness and agility, cost and efficiency, quality, sustainability). Similarly, relevant items with the GLM practices listed in this study can be identified in several research studies (e.g., references [2,56,57,58,59,60]).
This paper contributes on the organizational theory and GSCM in multiple ways:
First, in the organizational context, firms are exploring their trajectory to integrate GLM practices into their supply chain (Sarkis et al. [61] Luthra and Mangla [62]). Moreover, organizations need to identify the dynamics and influential management orientations in GLM categories boosting performance, while limited theoretical knowledge and practical application have been developed in this research area [63,64].
Second, sustainability across the agri-food supply chain is at the initial stage and remains a complex concept, thus literature has not converged to metrics upon its practices and its effectiveness, yet [62,65,66].
Third, as the agri-food supply chain (ASC) sustainability theme has recently attracted research interest, too-limited number of papers deal with its practices and performance consequences [67,68].
Fourth, considering research methods, case studies prevail in ASC practice, and quantitative analysis such as field surveys are rather restricted [68]. Our findings were based upon 134 interviews with executive officers across the ASC.
Fifth, regarding the geographic areas, the majority of existing ASC research is focused on developed countries [68], neglecting rather developing small economies at the periphery of the European Union (EU), such as Greece.
The hypothesized model linking the relationship between GLM items and control variables and the different constructs of sustainability performance is depicted in Figure 1. GLM is conceptualized to include items of Table 1, while sustainability performance is investigated from the perspectives of business, supply chain and green performance, with KPIs groups presented in Table 2, Table 3 and Table 4 correspondingly.
Principal component analysis (PCA) was adopted to identify the subdimensions of each scale of the conceptual framework, and multiple regression analyses were conducted to test research hypotheses. The conceptual framework of this study can be seen in Figure 1.

4. Research Method

4.1. Sample

The empirical research was carried out by using a structured self-administered questionnaire that was filled out by personal interviews, mainly with executive officers of firms in the agri-food supply chain. The survey tool was tested twice by 8 managers from processing firms, retailers and wholesalers in the agri-food supply chain. The outcome of this process yielded 134 valid questionnaires (9 questionnaires were excluded from the analysis as they had more than 10% of missing data). Of the respondents, 41% were CEOs or general managers, 9% were owners and the rest were managers: 65% were between 35 and 55 years old, 71% were males, 76% have more than 5 years working experience at the same position, 68% had more than 10 years in this company and 32% hold a postgraduate degree. Regarding participating firms’ demographics, about 30% were established in the last 12 years, 57% were located in a city, 58% are independent firms while 37% are members of a corporate group. Of the firms, 39% are retailers or wholesalers, 34% are food processing companies and the rest fall in the packaging, logistics and transportation sectors.

4.2. Measurement

In this study, green logistics management reflecting the environmental impact of activities such as information sharing, packing, warehousing, transportation, loading and unloading, logistics networking, logistics emissions and standards along the agri-food supply chain were measured by validated constructs (e.g., References [69,70]). Environmental dynamism representing the degree of turbulence in products, technologies, competition and customer preferences within a market was operationalized by an empirically validated scale (e.g., References [34,35]). Moreover, respondents were asked to assess various performance indicators at the business level, such as profitability, innovation/growth and market position, at the supply chain domain such as delivery, cost and flexibility performance, and at the environmental level such as green performance (see Table 2, Table 3 and Table 4). Firm’s age and size are included in statistical analyses as control variables, in order to reduce the possibility of spurious results caused by their potential association with dependent variables such as market performance.
In addition, respondents’ gender, age, education level and working experience were tested for their association with our research design, and no significant effects were detected. The research instrument was based on a seven-point Likert-type scale.

5. Statistical Analysis and Results

5.1. Principal Component Analysis

Content validity was examined by explorative factor analysis, as recommended in previous studies (e.g., Reference [53]). Principal component analysis (PCA) was conducted to identify latent factors within all constructs. Preceding PCA, the Bartlett sphericity testing on the degree of correlation between the variables (p < 0.001) and the Kaiser–Meyer–Olkin (KMO) index verified the appropriateness of the sample. Examining green logistics management scale and adopting Kaizer criterion, five factors were extracted from the data, as it is illustrated in Table 5. These components accounted for over 77% of the total variation. Performing normalized varimax rotation to bring about simple and interpretable structure, and using a cut-off of 0.40 for item selection, five distinct principal components emerged, and they were labeled as (a) information sharing, (b) logistics emissions, (c) warehouse, (d) packing and (e) logistics networking and transportation.
Likewise, four principal components were extracted from the business performance scale (Kaizer criterion, Scree plot), which accounted for over 76.9% of the total variation, as it is shown in Table 6. These five factors were labeled as (a) financial, (b) innovation and growth, (c) market and (d) social performance.
Similarly, six principal components were extracted from the supply chain performance scale (Kaizer criterion, Scree plot), which accounted for over 88% of the total variation, as it is illustrated in Table 7. These six factors were labeled as (a) supply chain innovation, (b) delivery performance, (c) cost performance, (d) flexibility performance, (e) optimization and (f) traceability.
In a similar way, two principal components were extracted from the green performance scale (Kaizer criterion), which accounted for over 69% of the total variation, as it is illustrated in Table 8. These two factors were labeled as (a) resources usage and safety, and (b) environmental process management outcomes.
Similarly, one principal component was extracted representing environmental dynamism, which accounted for 63.7% of the total variation, as it is shown in Table 9.
Statistics for the Bartlett sphericity test on the degree of correlation between the variables were significant for all components (p < 0.001) and the Kaiser-Meyer-Olkin indices calculated for the appropriateness of the sample for the analyses were above the recommended threshold of 0.6 [71].
Indicators’ reliability was assessed by examining their loadings on their corresponding constructs, and all loadings proved to be larger than the suggested threshold of 0.5 [72].
Internal consistency or reliability of all scales was assessed by Cronbach’s alpha and composite reliability [72,73] indices. More specifically, the values of 0.6 and 0.7 were proposed in the relevant literature as thresholds for Cronbach’s alpha [74] and the composite reliability [64] coefficients, respectively. In this study, all developed components well exceed the suggested limits, thus constructs’ reliability was verified. Also, Fornell and Larcker’s [73] average variance extracted (AVE) criterion is adopted for the estimation of scales’ convergent validity. As shown in Table 5, Table 6, Table 7, Table 8 and Table 9, all scales met this criterion, since the AVE value of each factor is higher than 0.50.
Discriminant validity was examined by Fornell and Larcker’s [73] AVE test and correlations criterion. As shown in Table 10, all constructs in the present research model demonstrated adequate discriminant validity, since the diagonal elements, which are the square roots of the AVEs, are greater than the off-diagonal elements (correlations) in the corresponding rows and columns.
A series of multiple regression analyses were conducted, one for each dimension of business, supply chain and green performance as dependent variables, testing their relationships with green logistics management activities. We included firms’ age, size and business dynamism as control variables.
Finally, as a single respondent from each firm answered the research instrument, we statistically assessed common method bias by performing Harman’s single-factor test and the correlation matrix procedure suggested by Bagozzi et al. [75]. All tests indicated that responses lack a significant amount of common methods bias.

5.2. Multiple Regression Analyses Results

Examining business performance, results show that the predictor variables have captured a significant proportion of change in the dependent variables, explaining 38.7%, 24.4%, 34.7% and 41.8% of variance in market, financial, innovation and social performance, respectively.
Among GSCM aspects, logistics networking and transportation (standardized β = 0.301, p < 0.05 financial performance, stand. β = 0.298, p < 0.01 innovation performance and stand. β = 0.207, p < 0.05 social performance) as well as information sharing (stand. β = 0.225, p < 0.05 market performance, stand. β = 0.239, p < 0.05 financial performance and stand. β = 0.343, p < 0.001 social performance) seem to dominate as they are strongly related to three out of four business performance dimensions. Green packaging is significantly associated with financial (stand. β = 0.236, p < 0.05) and social (stand. β = 0.278, p < 0.05) performance. Logistics emissions and warehousing are not related to any business performance aspect. In Table 11, multiple regression analysis results for business and green performance aspects are presented.
Regarding green performance, independent variables captured a significant proportion of change in the dependent variables, explaining 22.4% and 31.8% of variance in resources usage and safety, and environmental process management outcomes, respectively.
Among GSCM orientations, logistics networking and transportation prevails as it is the only one which is strongly associated with both green performance dimensions (stand. β = 0.324, p < 0.05 resources usage and safety, stand. β = 0.423, p < 0.001 environmental process management outcomes).
Concerning supply chain performance, predictors captured a significant proportion of change in the dependent variables, explaining 28.5%, 35.7%, 32.6%, 23.3%, 30.8% and 25.9% of variance in supply chain innovation, delivery, cost, flexibility, optimization and traceability, respectively (Table 12).
Following a similar pattern, among GSCM orientations, only information sharing (stand. β = 0.281, p < 0.05 supply chain Innovation, stand. β = 0.256, p < 0.05 delivery, stand. β = 0.301, p < 0.01 cost, stand. β = 0.343, p < 0.01 flexibility and stand. β = 0.337, p < 0.01 optimization) and logistics networking and transportation (stand. β = 0.318, p < 0.05 supply chain Innovation, stand. β = 0.261, p < 0.05 cost, stand. β = 0.342, p < 0.01 optimization and stand. β = 0.298, p < 0.05 traceability) are strongly linked to supply chain performance aspects.
Regarding control variables, firms’ age is related to market performance (stand. β = 0.421, p < 0.01) and traceability (stand. β = 0.312, p < 0.05). Environmental dynamism is positively associated with business innovation performance (stand. β = 0.204, p < 0.05) and cost (stand. β = 0.236, p < 0.05), while it is negatively related to social performance (stand. β = −0.195, p < 0.05).
No serious problems of multi-collinearity exist between the independent variables as variance inflation factors are far below the 3-point limit suggested in Social Sciences literature. The results of regression analyses (standardized betas, adjusted R square, significance levels) are exhibited in Table 11 and Table 12. Also, the data were examined for outliers, skewness, kurtosis and multivariate normality.
Consequently, information sharing and logistics networking and transportation are found to be the most powerful predictors of sustainable business and supply chain performance aspects. Interestingly, although green warehousing and logistics emissions exhibit a series of statistically significant correlation coefficients with performance dimensions, these GLM practices failed to establish any association with KPIs at the presence of the rest of the practices (regression analysis).

6. Discussion

This paper aimed to explore the impact of GLM upon performance in the agri-food sector enterprises. More specifically, this study addressed green logistics management elements (i.e., information sharing, logistics emissions, warehouse, packing and logistics networking and transportation) in pursuit of their impact on three different performance aspects: supply chain, green (environmental) and business performance.

6.1. Effects of GLM on Business Performance

Examining the effect of GLM on business performance, results reveal that the logistics networking and transportation orientation, reflecting the integration of information technology, optimization and green standardization in transportation and logistics network, prevails as it is related to three out of four business performance dimensions, namely financial, innovation and social performance.
These results agree with those of Dangelico and Pontrandolfo [76], who pointed out the positive correlation of corporate sector financial performance with green logistical and supply chain operations, including transportation. They are also in line with Azevedo et al.’s [15] argument that the deployment of GSM practices, based on standardized processes, can contribute significantly to business performance. In this direction, Sila [77] maintains that standardization of processes can improve corporate social performance while remaining financially viable in the framework of total quality management practices.
Also, according to Mariano et al. [78], CO2 emissions from transport are highly correlated with GDP. Additionally, the countries’ income impacts the demand for sustainable transportation. Thus, developed countries are more capable of promoting the greening of transportation, while low-income countries are considered to be lagging in the development of logistics infrastructure and services, and ignoring environmental protection in transport management. It is also noticeable that some authors maintain that the early stage of adoption of sustainable equipment, infrastructure, tools, etc., usually requires high investment, which increases companies’ operational costs and negatively impact firms’ economic performance [57]. In this sense, a concrete study of the short- and long-term impacts on business performance is required to overcome this kind of uncertainty, ensuring a valid, green-oriented decision process in logistics and transport.
Information communication technology is driving modern employment innovation through enabling people to interact, and in addition, can contribute to networked activity towards the application of corporate social responsibility practices. The utilization of technology in general aims to become customer-centric, facilitate rapid information sharing and contribute to cost reduction, flexibility and increased effective coordination [79]. Recent green supply chain management and innovation studies have highlighted the importance of green customer integration in promoting green product innovation (e.g., Reference [80]). In practice, many companies have integrated their customers into the process of green product innovation and achieved performance improvement, as green customer process integration has a stronger effect on quality of information sharing than green customer information integration [81]. Jermsittiparsert et al. [82] argue that supplier, customer and technological integration have positive influences on sustainable social performance. In particular, farmers market organizations are in the position to leverage their inter-organizational relationships, institutional role and power to build collaborative networks with businesses, government bodies and charities, so that concrete CSR-based virtuous circles on surplus food donation are triggered at the organizational level [83].
Following a similar pattern in this empirical study, the information sharing green logistics aspect is also strongly associated with three out of four business performance dimensions, namely market, financial and social performance.
Information sharing that concerns “the degree to which each party discloses information that may facilitate the other party’s activities” [84], fosters collaboration between different parties in a supply chain, which in turn supports trust and employees’ communication. Because, if members constructively share the necessary information or knowledge related to their work, it is expected that employees can share their knowledge, skills and information about their work anywhere and at any time, and that this process may improve communication and lead to new and more useful ways of working [85]. In the agricultural sector, particularly, the “asymmetric” information flow and control that impedes equal chances between SMEs and large enterprises plays a critical role and inevitably leads to high costs of production and low bargaining power, trapping the agri-food SMEs in a “vicious” cycle [4]. However, the empirical study of this paper revealed that information sharing has a low impact on innovation, which probably reflects the lack of trust among the actors engaged in the Greek agri-food supply chain, with respect to strategic sensitive issues such as innovation, leading to differentiation and long-term competitive advantage. This is included in the barriers for managing the SC in an integrated model, namely the increasing complexity of coordination, the lack of communication between partners, the potentially higher cost of management and managers’ lack of capability [86]. However, the stakeholder approach is increasingly understood in sustainable supply chains and sustainable business models [87], developing mutual commitment and trust, moving relationships from cooperation to collaboration.
As managers are becoming increasingly aware of corporate social responsibility, the concept of the close communication and information sharing between internal stakeholders (employees, managers, owners) and external stakeholders (suppliers, customers, society, government, etc.) has directly come to the forefront [88,89,90]. Thus, stakeholders can seek globally optimal solutions to reduce overall costs and improve profitability. In addition, due to real-time data sharing, stakeholders can adjust their planning and scheduling based on actual situations [10]. Information sharing can also improve the efficiency of inventory holding by achieving better quality predictions of demand. This is in line with Huang et al.’s [91] survey outcomes, who studied the impact of information sharing on the reduction of cost and inventory in supply chains with multiple suppliers. They noticed, however, that the degree of information sharing is critical, since perfect information may result in double marginalization, while sharing partial information may result in distortion between demand and inventory, i.e., the bullwhip effect. Moreover, information sharing enables the manufacturers to adjust their wholesale prices and service levels responsively to market conditions and demand, which can benefit their supply chains if they are efficient at service investment [92].
Moreover, according to the survey results, green packaging is one of the GLM items that impacts business performance in terms of its financial and social dimensions. Indeed, the adoption of environmentally sensitive production practices such as resource and energy saving, reduction of waste and less packaging contributes significantly to better financial results (improved sales through strengthening “green image” and reduced costs), as well as to closer relationships with society, in the framework of social responsibility. This is confirmed by the Çankaya and Sezen [93] study outcomes which show the positive relation of packaging with economic and social performance. In this direction, many enterprises prefer recycled packages because they are cheaper than the common ones, while, similarly, reducing packaging materials will allow enterprises to reduce not only their production costs, but also transportation costs. García-Arca et al. [94] maintain that packaging design affects both direct costs (packaging purchases and waste management) and indirect costs (packing, handling, storage, transport and losses). Packaging should be considered as a silent or invisible “salesperson” with tangible and intangible product characteristics, promoting its degree of differentiation and subsequent sales [95]. It is critical, however, for all companies on the supply chain (suppliers, manufacturers, retailers, third party logistics, etc.) to understand the overall impact of packaging design decisions from a holistic perspective, so as to neither guarantee safe consumption [96,97], nor to lose potential sources of competitiveness improvement through sustainability deployment [94]. The latter involves various needs from the social perspective as well, such as transparent, honest, understandable and truthful information, adapting usage and product sizes to the needs of different customers (e.g., the elderly or people with disabilities).
Interestingly, warehousing and logistics emissions failed to establish any relationship with business performance outcomes. In this line, Ni and Sun [98] maintain that investing internally to achieve firm-level sustainability are necessary but not sufficient to improve business performance.

6.2. Effects of GLM on Green Performance

Considering the impact of GLM on green performance, among green logistics dimensions, logistics networking and transportation is critically linked to both green performance dimensions, namely, resources usage and safety and environmental process management outcomes, whereas other internal logistics processes such as warehousing, packing and even logistics emissions, are considered to have a lower impact on green performance. This is aligned with the majority of studies that aim towards addressing environmental sustainability in the agri-food supply chains, in which they carry out life cycle assessments [99,100,101] that encompasses all processes in the supply chain “from farm to fork”.
In this respect, Sherafati et al. [102] propose an innovative methodology for estimating the sustainability dimensions, which ensures that the environmentally friendly facilities can operate more effectively in the supply chain network. Furthermore, the benefits of transportation decisions in terms of both cost and environmental impact savings to improve the sustainability of a logistics network are significant.
Food and Eco system security is generally inspected through three measurement approaches, in particular the accessibility of ecosystem, access to food supply chain networks and use of the food chain [103].
According to a study of the local food producers integrated logistics network in Sweden, Nordmark et al. [104] noticed that route optimization could reduce the route distances, decreasing the environmental impact, while they also pointed out that the lowest estimated potentials for global warming, acidification, eutrophication and human toxicity were found when integrated collections and deliveries took place during each route. Geiger [105] also maintains that communication information technology plays a vital role in promoting environmentally sustainable cargo transportation throughout Europe. It is well known that in any case, freight transportation accounts for the largest share of logistics emissions [18]. According to Al-Odeh and Smallwood [106], factors like fuel, modes of transport, infrastructure and operational practices are important factors to consider in developing green transportation. In this sense, lately, many authors have increasingly explored the potential use of greener vehicles, such as electric ones, aiming at lower greenhouse gas emissions, less air pollution and new job opportunities, with positive social impact [19,20,107].

6.3. Effects of GLM on Supply Chain Performance

Regarding green logistics management implications on supply chain performance, information sharing promoting logistics network transparency and collaboration is related to all GSCM aspects but traceability, namely supply chain innovation, delivery, cost, flexibility and optimization.
Several scholars have empirically validated the crucial role of IT practices and techniques on the establishment of a sustainable competitive advantage based on supply chain management (e.g., Reference [108]). In particular, existing information systems including the web-enabled collaboration among supply chain partners support supply chain optimization, dynamics and configuration at the operational and strategic level [109]. Information sharing in the supply chain and collaboration enhance situational awareness and avoid information delay and distortion, while suppliers can aid in the preparation of timely and good-quality services and materials. Shahabadkar et al. [26] highlights the potential benefits, particularly for SMEs, that can be attained by exploiting IT enablers, while others point out the importance of information sharing as a key criterion and main enabler that influences trust and innovation in SCM [27,28] and improves supply chain agility according to a survey based on 272 survey responses from supply and purchasing executives and managers in the manufacturing industry [110]. Moreover, in a similar pattern, Marinagi et al. [111] highlighted the critical role of information sharing in the link between information quality and supply chain performance. However, it is noticeable that according to the results of this survey, agri-food executives focus their concern on operational aspects of supply chain performance, such as delivery and inventory management, rather than traceability that aims mainly at qualitative insurance goals. This is probably due to the fact that they consider the need for “real time” information flows as a first priority towards a better coordination of supply chain networks and optimization of efficiency, within very tight profit-margin constraints. Besides, other reasons may be the acknowledged high quality of Greek agricultural products (due to Mediterranean climate advantages), typical quality processes that are already implemented as a rule in the Greek farms and the close control of such processes in the framework of new cooperation patterns in the agri-food chains, such as contract agricultural schemes or short agri-food supply chains. Information sharing has been considered as one “cornerstone” of a successful collaboration, and the lack thereof explains the surprisingly high failure rate of collaborations [112]. Information sharing and operational coordination represent the two dimensions of supply chain integration [113], which in turn is widely considered by both practitioners and researchers as a vital contributor to supply chain performance [114].
Also, according to the present study results, logistics networking and transportation is associated with supply chain innovation, cost, optimization and traceability. The positive relations between logistics network, supply chain integration and supply chain performance have been pointed out in various studies which have clearly shown that the degree of integration influences cost and efficiency [115]. Some authors are skeptical, however, that integration might be more difficult in practice than in theory and that it is more rhetoric than reality [116]. Thus, particularly for small-scale producers, such barriers are associated with a lack of resources to comply with strict standards towards safe and traceable food. Wider access to information and communication technology (ICT) may lift some of these barriers, because the proliferation of mobile devices, advances in communication and greater affordability of nanotechnology offer potential for small-scale producers to implement traceability systems and connect to global markets [117]. Another important issue is that the nature and extent of integration has been rather selective, since most companies are quite cautious when it comes to sharing sensitive data, and rightfully so [115].
In addition, Stajniak and Koliński [118] highlight the need for transport process standardization as it is a key process that ensures the smooth physical material flow throughout the supply chain and therefore its efficiency. In this sense, a number of decisions regarding transportation processes, in terms of efficient loading, unloading and vehicles’ routing, affect supply chain performance in both forward and reverse logistics networks.
Moreover, much discussion has been made lately regarding traceability in the supply chain by adopting new technologies and applications in logistics and transport, such as blockchain, a new innovative technology that has aroused wide attention from industry and academia in recent years. Using blockchain technology, agricultural products, from farmers to dealers, can be tracked and controlled using maximum visibility throughout the entire process in the chain [119]. Through logistics traceability, enabled by blockchain technology, stakeholders can easily obtain consistent and reliable data, leading to saving resources and materials to bring considerable economic profits to enterprises [10]. Moreover, findings show that blockchain may yield the efficiency of logistics and digital documentation maintenance up to 74% and 75% respectively, which delivers advantages over traditional materials’ management systems and improves profitability of Business to Business (B2B) market companies in the e-commerce market [120]. Such applications facilitate auditability, disintermediation and smart contracts, which also contribute to the business benefits [121,122], provided that multiple disciplines and a variety of stakeholders will cooperate for taking full advantage of related technology [123].

6.4. Effects of Control Variables on Performance

Exploring control variables, dynamism reflecting the rate of change in products, technologies, competition and customer preferences boosts business innovation performance and supply chain cost, while it limits social performance.
In a highly uncertain and changing environment, managers need to have the strategic flexibility to respond to changes, developing new organizational structure and innovative culture [124]. Know-how and experience foster innovation and effective exploitation of all available resources and in this sense, the industry, by cooperating with research institutions, can be facilitated in the innovation implementation process [125]. Innovation can result in new products that better satisfy customer needs, can improve the quality of existing products, or can reduce the costs of making products that customers want [126]. When the market demand is difficult to predict, then firms can use their dynamic service innovation capabilities to improve competitive advantages, service innovation and organizational performance in a faster way [127]. In this direction, according to Teece et al. [109], dynamic capability is considered as the organization’s ability to combine, build and redesign internal and external capabilities to chase market dynamism. Facing the dynamic changes of the market environment, especially the innovative activities of the competitors, firms may have no choice but to continuously improve to take the lead [127]. However, the turbulent business environments that create constantly changing economic conditions, especially in global economic crises and the COVID-19 new era, which have deeply affected all world national economies, firms are often forced to make key decisions based on unclear information or market opportunities, customers’ inability to articulate their needs and uncertainty of when and how much capital to invest [109]. In this respect, organizations voluntarily commit or replicate competitors’ best practices with the aim to survive and remain competitive in the industry [128]. In addition, such conditions worsen job uncertainty and the fear of losing one’s job has a strong negative influence on workers [129,130]. In this rationale, a dynamic environment urges firms to concentrate resources on core capabilities and operations in order to respond to external hostility and uncertainty, and to be sheltered from future vulnerabilities, eliminating the potential to invest in and pursue activities with social impact.
Also, an interesting finding of this paper survey is that warehousing and logistics emission are not directly related to any effectiveness aspect.

7. Conclusions

This paper presented a framework to identify and analyze the impact of green logistics and green supply chain management (GLM and GSCM) components on performance, in terms of environmental, business and supply chain effectiveness, controlling for environmental dynamism and firms’ size. Following a literature review of GLM and GSCM practices, the paper presented their links with different effectiveness indicators. A field survey on executives in the agri-food sector set the ground for the identification of the core GLM elements defining performance implications, as follows:
(a)
In particular, logistics networking and transportation as well as information sharing seem to dominate as they are strongly related to three out of four business performance dimensions. Moreover, green packaging is significantly associated with financial and social performance.
(b)
Likewise, logistics networking and transportation prevails as it is the only one which is strongly related to both green performance dimensions (resources usage and safety, environmental process management outcomes).
(c)
Following a similar pattern, only logistics networking and information sharing are strongly linked to supply chain performance aspects.
This paper has important implications, as it provides an appropriate theoretical framework for GSCM practices and performance initiatives, as well as their associations, setting the ground for developing the necessary repertoire of GLM practices, leading to the improvement of specific KPIs in alignment with their strategic objectives. The findings suggest that logistics networking and transportation, and information sharing among GSCM components, enjoy performance benefits, while the other combinations are lagging behind.
In the context of the COVID-19 crisis, GLM has emerged as a hot topic, and agri-food supply chain resilience turned out to be of critical importance, especially since global chains have been mainly dependent on logistics, in order to resist this unforeseen shock [131]. From the point of view of practical implications, managers involved in GLM application and firm effectiveness assessment would be in a position to keep track of the status of GLM practices implemented, and to suggest which particular GLM aspects require more attention and resources to be allocated for satisfactory development, so as to enhance specific performance dimensions. In this way, this study’s findings leverage managers to undertake proactive actions in order to develop inter- and intra-organizational green logistics processes, boosting agri-food supply chain and sustainability performance in alignment with the strategic priorities of the firm, thereby maximizing overall stakeholders’ value. In particular, executives should pursue green supply chain strategies intimately tied to transparent information sharing among partners from farm to fork, integrated logistics network, routing optimization, transport standardization, greener intermodal connection and information technology deployment, which in turn will enhance performance and shelter businesses in a turbulent environment. Following this rationale, managers should be properly qualified and dedicated in order to embrace and fuel a collaborative culture of partnership across the agri-food supply chain stakeholders [132].
Furthermore, the sufficient understanding of these complexities of GLM practices–performance links related to internal mechanisms and processes may lead to the identification of operational requirements or other internal factors and systems for improving individual, firm and supply chain performance. In this regard, a full-cycle approach which highlights the reciprocal relationships among people, the organizational context and the natural environment in which they operate, may be particularly useful. Also, considering that SMEs in the agri-food sector are generally reluctant to pursue environmental and social goals and bear the associated cost, this study suggests that, so far, it is possible to balance financial performance with sustainability outcomes, by focusing on adopting typical functions/initiatives such as packaging, information sharing and networking.
This study is also subject to potential limitations emanating from the conceptual model and methodology used. First, the conceptual framework encompasses certain predetermined GLM and GSCM dimensions. Moreover, other plausible contingent factors might have been explored, such as CSR efforts, strategy, culture and leadership, which may enrich or even modify the results. Second, conducting field research on a restrained sample in the agri-food sector in Greece may limit the potential for generalization of results. Although focusing on the agri-food supply chain provides in-depth knowledge of industry specifications revealing latent coordination mechanisms, more respondents from a variety of sectors would provide a more universalistic view, requiring an extensive research effort potential. Third, no clear evidence of causality can be established with survey data obtained from cross-sectional analysis at one point of time, although they must be considered robust with most of the theoretical arguments and hypothesized relationships. Lastly, specific case studies of high performing ecosystems adopting GSCM practices may shed light on the mechanisms of supply chain integration, since information derived at the organizational level of analysis may obscure meaningful linkages.
The majority of previous studies have examined a few performance aspects or KPIs, mainly financial or operational ones. The present study adopted a more holistic and multi-dimensional approach, by exploring metrics at the organizational level (business), ecosystem (supply chain) and natural environment (green performance). Further elaboration of inward and outward performance indicators may give new insights. Following this rationale, future research may expand this study’s focus on respondents by adopting a multi-stakeholder analysis and data-driven approach [133], as well as on green supply chain performance measurement through emergy accounting and analysis (with an “m”, reflecting the memory of energy) [134]. Also, empirical research in the literature comes mostly from large economies such as the US. Data from small countries, in the periphery of the European Union, suffering from a long financial crisis period, such as Greece in the present study, are rarely presented. Further analysis with datasets from other countries would develop the existing literature, leading to potentially more generalizable outputs.

Author Contributions

Conceptualization, P.T. and G.M.; methodology, P.T. and G.M.; validation, P.T., G.M. and P.R.; formal analysis, P.T.; investigation, P.T. and G.M.; writing—original draft preparation, P.T. and G.M.; writing—review and editing, P.T., G.M. and P.R.; project administration, P.T. and P.R. All authors have read and agreed to the published version of the manuscript.

Funding

This research received no external funding.

Conflicts of Interest

The authors declare no conflict of interest.

Appendix A

Table A1. Academic interest in GLM and performance from 2010 to 2020 1.
Part of Article’s TitleNumber of ArticlesNumber of Articles also Including “Performance” in Their Title
Green supply chain3480593
Green logistics115057
Sustainable supply chain2380246
Sustainable logistics80124
Total7811920
Including also “management”
Green supply chain management1610320
Green logistics management8615
Sustainable supply chain management1010120
Sustainable logistics management743
Total2780458
1 Source: Google Scholar search engine (accessed on 7 July 2020).
Table A2. Indicative literature from 2010 to 2020 for GLM (GSCM) and performance 1.
YearAuthorsGreen Logistics (Supply Chain) Management Items (Drivers)GPBPFPOPSCPSP
2011[69]Information sharing, Packing, Warehouse, Transportation, Loading/unloading, Logistics networking, Logistics emissions X
2010[135]Hazardous materials, environmental accidents, technology X
2011[136]Green supply chain management capabilities, Strategic level of purchasing department, Environment commitment, Green supplier assessment, Collaboration with suppliersX XX
2011[137]Eco-design, green purchasing, Green manufacturing capacity, green marketing and consumption, recycling products, processing ability, information, technologyX
2012[138]Green supply Distribution strategies and transportation execution Warehousing and green building Reverse logistics Cooperation with customers’ Investment recovery Eco-design and packaging Internal managementX X X
2017[139]Intra-organizational environment management, Product eco-design, Green supplier integration, Green customer cooperation, Reverse logisticsX XX X
2015[140]Green Procurement, Green Manufacturing, Green Distribution, Green LogisticsX X X
2019[141]Cost, Time, Quality, Flexibility, Innovation, Resource, Information XX
2019[142]Green purchasing, Green Logistics, Green Human Resource ManagementX
2018[143]Purchasing, Manufacturing, Warehousing, Distribution, Reverse Logistics, Remanufacturing–Recycling, Green TransportationX X X
2014[144]Internal GSCM, GSCM with customers, GSCM with suppliers XX
2018[145]Operational attributes, information sharing, collaboration, environmental awareness and attitudes X
2016[146]Green Design, Green Purchasing, Green Transformation, Green Logistics and Reverse Logistics X
2019[93]Green purchasing, Green manufacturing, Green distribution, Green packaging, Green marketing, Environmental education, Internal environmental management and investment recoveryX X X
2018[147]Internal practices, External practices, Investment recovery and eco-designX X X
2017[148]Transportation and Warehousing activitiesXXX X
2018[149]Procurement, Energy X
2015[150]Environmental criteria for supplier evaluations, environmental management system certification, auditing, environmental information sharing, educational and technical assistance, environmental collaborationX XXX
2018[151]Green purchasing (in bound greening), green manufacturing (focal company), green distribution (out bound greening) and environmentally oriented reverse logisticsX X
2014[152]Green purchasing and inbound logistics, green manufacturing, green materials management, green distribution/marketing and reverse logisticsX
2018[153]Environmental collaboration, Internal environmental management, Green purchasing, Green production, Cooperation with customers, Eco-design, green logistics, recyclingX X
2018[154]Internal Environmental Management, Cooperation with customers, Investment Recovery, Eco-design, Supplier selection, Environmental collaboration, Supplier evaluationX X X
2012[155]Green Purchase, Customer Cooperation, Investment Recovery XX
2018[156]Internal green practices focus on the company-wide green activities concerning mainly the eco-design of internal processes. External green practices focus primarily on green collaboration with suppliersX
2015[157]Upstream firms (green purchasing, collaboration with suppliers and green design), focal firms (green-related programs), and downstream firms (collaboration with customers, green packaging, green product portfolio and reverse logistics)XXXX
1 GP: Green (Environmental) Performance, BP: Business Performance, FP: Financial Performance, OP: Operational Performance, SCP: Supply Chain Performance, SP: Social Performance.

References

  1. Lichtfouse, E.; Navarrete, M.; Debaeke, P.; Souchère, V.; Alberola, C.; Ménassieum, J. Agronomy for Sustainable Agriculture: A Review. In Sustainable Agriculture; Lichtfouse, E., Navarrete, M., Debaeke, P., Véronique, S., Alberola, C., Eds.; Springer: Dordrecht, The Netherlands, 2009. [Google Scholar]
  2. Naseer, M.A.R.; Ashfaq, M.; Hassan, S.; Abbas, A.; Razzaq, A.; Mehdi, M.; Ariyawardana, A.; Anwar, M. Critical Issues at the Upstream Level. In Sustainable Supply Chain Management of Agri-Food Industries: Evidence from Pakistan’s Citrus Industry. Sustainability 2019, 11, 1326. [Google Scholar] [CrossRef] [Green Version]
  3. Kumar, C.G.; Murugaiyan, P.; Madanmohan, G. Agri-Food Supply Chain Management: Literature Review. Intell. Inf. Manag. 2017, 9, 68–96. [Google Scholar]
  4. Manikas, I.; Malindretos, G.; Moschouris, S. A community based Agro-food Hub model for sustainable farming. Sustainability 2019, 11, 1017. [Google Scholar]
  5. Jemai, J.; Chung, B.D.; Sarkar, B. Environmental effect for a complex green supply chain management to control waste: A sustainable approach. J. Clean. Prod. 2020, 277, 122919. [Google Scholar] [CrossRef]
  6. Kaloxylos, A.A.; Wolfert, J.; Verwaart, T.; Terol, C.M.; Brewster, C.; Robbemond, R.; Sundmakere, H. The Use of Future Internet Technologies in the Agriculture and Food Sectors: Integrating the Supply Chain. Procedia Technol. 2013, 8, 51–60. [Google Scholar] [CrossRef] [Green Version]
  7. Gennari, P.; Navarro, D.K. The Challenge of Measuring Agricultural Sustainability in All its Dimensions. J. Sustain. Res. 2019, 1, e190013. [Google Scholar]
  8. Bhattacharya, M.; Paramati, S.R.; Ozturk, I.; Bhattacharya, S. The effect of renewable energy consumption on economic growth: Evidence from top 38 countries. Appl. Energy 2016, 162, 733–741. [Google Scholar] [CrossRef]
  9. Khan, S.A.R.; Qianli, D. Impact of green supply chain management practices on firms’ performance: An empirical study from the perspective of Pakistan. Environ. Sci. Pollut. Res. 2017, 13, 173–201. [Google Scholar] [CrossRef]
  10. Tan, B.Q.; Wang, F.; Liu, J.; Kang, K.; Costa, F. A Blockchain-Based Framework for Green Logistics in Supply Chains. Sustainability 2020, 12, 4656. [Google Scholar] [CrossRef]
  11. Sarkis, J. Strategic Decision Framework for Green Supply Chain Management. J. Clean. Prod. 2003, 11, 397–409. [Google Scholar] [CrossRef]
  12. Srivastava, S. Green supply-chain management: A state-of the-art literature review. Int. J. Manag. Rev. 2007, 9, 53–80. [Google Scholar] [CrossRef]
  13. Ghobakhloo, M.; Tang, S.H.; Zulkifli, N.; Ariffin, M.K.A. An Integrated Framework of Green Supply Chain Management Implementation. Int. J. Innov. Manag. Technol. 2013, 4, 86–89. [Google Scholar]
  14. Green, J.; Kenneth, W.; Pamela, J.; Zelbst, J.M.; Vikram, S.B. Green supply chain management practices: Impact on performance. Supply Chain Manag. Int. J. 2012, 17, 290–305. [Google Scholar] [CrossRef]
  15. Azevedo, S.G.; Carvalho, H.; Machado, V.C. The influence of green practices on supply chain performance: A case study Approach. Transp. Res. 2011, 47, 850–871. [Google Scholar] [CrossRef]
  16. Polychroniou, P.; Trivellas, P. The impact of strong and balanced organizational cultures on firm performance: Assessing moderated effects. Int. J. Qual. Serv. Sci. 2018, 10, 16–35. [Google Scholar] [CrossRef]
  17. Sarkar, B.; Guchhai, R.; Sarkar, M.; Cárdenas-Barróna, L.E. How does an industry manage the optimum cash flow within a smart production system with the carbon footprint and carbon emission under logistics framework? Int. J. Prod. Econ. 2019, 213, 243–257. [Google Scholar] [CrossRef]
  18. Lu, M.; Xie, R.; Chen, P.; Zou, Y.; Tang, J. Green Transportation and Logistics Performance: An Improved Composite. Sustainability 2019, 11, 2976. [Google Scholar] [CrossRef] [Green Version]
  19. Günther, H.; Kannegiesser, M.; Autenrie, N. The role of electric vehicles for supply chain sustainability in the automotive industry. J. Clean. Prod. 2015, 90, 220–233. [Google Scholar] [CrossRef]
  20. Bonsu, N. Towards a circular and low-carbon economy: Insights from the transitioning to electric vehicles and net zero economy. J. Clean. Prod. 2020, 256, 120659. [Google Scholar] [CrossRef]
  21. McKinnon, Α. Freight Transport Deceleration: Its Possible Contribution to the Decarbonisation of Logistics. Transp. Rev. 2016, 36, 418–436. [Google Scholar] [CrossRef]
  22. Raut, R.D.; Narkhede, B.E.; Gardas, B.B.; Raut, V. Multi-criteria decision making approach: A sustainable warehouse location selection problem. Int. J. Manag. Concepts Philos. 2017, 10, 260–281. [Google Scholar] [CrossRef]
  23. Bogataj, M.; Grubbström, R.W.; Bogataj, L. Efficient location of industrial activity cells in a global supply chain. Int. J. Prod. Econ. 2011, 133, 243–250. [Google Scholar] [CrossRef]
  24. Sarkar, B.; Majumder, A. A study on three different dimensional facility location problems. Econ. Model. 2013, 30, 879–887. [Google Scholar] [CrossRef]
  25. Nishitani, K. Demand for ISO 14001 adoption in the global supply chain: An empirical analysis focusing on environmentally conscious markets. Resour. Energy Econ. 2010, 32, 395–407. [Google Scholar] [CrossRef]
  26. Shahabadkar, P.; Hebbal, S.S.; Prashant, S. Deployment of Interpretive Structural Modeling Methodology in Supply Chain Management—An Overview. Int. J. Ind. Eng. Prod. Res. 2012, 23, 195–205. [Google Scholar]
  27. Welker, G.A.; Van der Vaart, T.; Van Donk, P.D. The Influence of Business Conditions on Supply Chain Information-Sharing Mechanisms: A Study among Supply Chain links of SMEs. Int. J. Prod. Econ. 2007, 113, 706–720. [Google Scholar] [CrossRef]
  28. Khurana, M.K.; Mishra, P.K.; Singh, A.R. Barriers to Information Sharing in Supply Chain of Manufacturing Industries. Int. J. Manuf. Syst. 2011, 1, 9–29. [Google Scholar] [CrossRef]
  29. Malindretos, G.; Aidonis, D.; Folinas, D.; Triantafillou, D. Holistic Value Chain and Sustainability. Potential role of co-operatives 2013. In Proceedings of the ICA Global Research Conference, Cooperatives during crisis and Post-Crisis Period—COOPCY, Nicosia, Cyprus, 12–15 June 2013. [Google Scholar]
  30. Zhu, Q.; Krikke, H.; Caniëls, M.C.J. Supply chain integration: Value creation through managing inter-organizational learning. Int. J. Oper. Prod. Manag. 2018, 38, 211–229. [Google Scholar] [CrossRef]
  31. Lee, S.M.; Kim, S.T.; Choi, D. Green supply chain management and organizational performance. Ind. Manag. Data Syst. 2012, 112, 1148–1180. [Google Scholar] [CrossRef]
  32. Gold, S.; Seuring, S.; Beske, P. Sustainable supply chain management and interorganizational resources: A literature review. Corp. Soc. Responsib. Environ. Manag. 2010, 17, 230–245. [Google Scholar]
  33. Seuring, S. Supply chain management for sustainable products—Insights from research applying mixed methodologies. Bus. Strategy Environ. 2011, 20, 471–484. [Google Scholar] [CrossRef]
  34. Ward, P.T.; Duray, R. Manufacturing strategy in context: Environment, competitive strategy and manufacturing strategy. J. Oper. Manag. 2000, 18, 123–138. [Google Scholar] [CrossRef]
  35. Kristal, M.M.; Huang, X.; Roth, A.V. The effect of an ambidextrous supply chain strategy on combinative competitive capabilities and business performance. J. Oper. Manag. 2010, 28, 415–429. [Google Scholar] [CrossRef]
  36. Dess, G.G.; Robinson, R.B. Measuring organizational performance in the absence of objective measures: The case of the privately-held firm and conglomerate business unit. Strateg. Manag. J. 1984, 5, 265–273. [Google Scholar] [CrossRef]
  37. Vickery, S.K.; Droge, C.; Markland, R.E. Dimensions of manufacturing strength in the furniture industry. J. Oper. Manag. 1997, 15, 317–330. [Google Scholar] [CrossRef]
  38. Ward, P.T.; McCreery, J.K.; Ritzman, L.; Sharma, D. Competitive priorities in operations management. Decis. Sci. 1998, 29, 1035–1046. [Google Scholar] [CrossRef]
  39. Roth, A.V.; Schroeder, R.G.; Huang, X.; Kristal, M.M. Handbook of Multi-Item Scales for Research in Operations Management; Sage Publications: Thousand Oaks, CA, USA, 2008. [Google Scholar]
  40. Reklitis, P.; Trivellas, P. Performance Implications of Aligning Generic Strategies with the Business Environment. Int. J. Manag. Decis. Mak. 2002, 3, 319–336. [Google Scholar] [CrossRef]
  41. Zhen, L.; Routray, J.K. Operational indicators for measuring agricultural sustainability in developing countries. Environ. Manag. 2003, 32, 34–46. [Google Scholar] [CrossRef] [Green Version]
  42. Lewis, P.; Thomas, H. The linkage between strategy, strategic groups, and performance in the UK retail grocery industry. Strateg. Manag. J. 1990, 11, 385–397. [Google Scholar] [CrossRef]
  43. Frazier, G.; Howell, R. Business definition and performance. J. Mark. 1983, 47, 59–67. [Google Scholar] [CrossRef]
  44. Boeker, W. Organizational strategy: An ecological perspective. Acad. Manag. J. 1991, 34, 613–635. [Google Scholar]
  45. Dess, G.; Davis, P. Porter’s (1980) generic strategies as determinants of strategic group membership and organizational performance. Acad. Manag. J. 1984, 27, 467–488. [Google Scholar]
  46. Aramyan, L.H.; Lansink, A.G.J.M.O.; Van Kooten, O. Performance measurement in agri-food supply chains: A case study. Supply Chain Manag. 2007, 12, 304–315. [Google Scholar] [CrossRef]
  47. Gold, S.; Kunz, N.; Reiner, G. Sustainable Global Agrifood Supply Chains: Exploring the Barriers. J. Ind. Ecol. 2016, 21, 249–260. [Google Scholar] [CrossRef] [Green Version]
  48. Bourlakis, M.; Maglaras, G.; Aktas, E.; Gallear, D.; Fotopoulos, C. Firm size and sustainable performance in food supply chains: Insights from Greek SMEs. Int. J. Prod. Econ. 2014, 152, 112–130. [Google Scholar] [CrossRef] [Green Version]
  49. Fynes, B.; de Burca, S.; Marshall, D. Environmental uncertainty, supply chain relationship quality and performance. J. Purch. Supply Manag. 2004, 10, 179–190. [Google Scholar] [CrossRef]
  50. Choi, T.Y.; Eboch, K. The TQM paradox: Relations among TQM practices, plant performance, and customer satisfaction. J. Oper. Manag. 1998, 17, 59–75. [Google Scholar] [CrossRef]
  51. Fynes, B.; Voss, C. A path analytic model of quality practices, quality performance and business performance. Prod. Oper. Manag. 2001, 10, 494–513. [Google Scholar] [CrossRef]
  52. Dixon, J.R. Measuring manufacturing flexibility: An empirical investigation. Eur. J. Oper. Res. 1992, 60, 131–143. [Google Scholar] [CrossRef]
  53. Shao, J.; Moser, R.; Henke, M. Multidimensional supply performance framework: A conceptual development and empirical analysis. Int. J. Prod. Econ. 2012, 138, 26–34. [Google Scholar] [CrossRef]
  54. Calik, E.; Bardudeen, F. A measurement scale to evaluate sustainable innovation performance in manufacturing organizations. Procedia CIRP 2016, 40, 449–454. [Google Scholar] [CrossRef] [Green Version]
  55. Zhu, Q.; Sarkis, J.; Lai, K. Confirmation of a measurement model for green supply chain management practices implementation. Int. J. Prod. Econ. 2008, 111, 261–273. [Google Scholar] [CrossRef]
  56. Yang, C.S.; Lu, C.S.; Haider, J.J.; Marlow, P.B. The effect of green supply chain management on green performance and firm competitiveness in the context of container shipping in Taiwan. Transp. Res. 2013, 55, 55–73. [Google Scholar] [CrossRef]
  57. Zhu, Q.; Sarkis, J. Relationships between operational practices and performance among early adopters of green supply chain management practices in Chinese manufacturing enterprises. J. Oper. Manag. 2004, 22, 265–289. [Google Scholar] [CrossRef]
  58. Tsolakis, N.K.; Keramydas, C.A.; Toka, A.K.; Aidonis, D.A.; Iakovou, E.T. Agrifood supply chain management: A comprehensive hierarchical decision-making framework and a critical taxonomy. Biosyst. Eng. 2004, 120, 47–64. [Google Scholar] [CrossRef]
  59. Dania, W.A.P.; Xing, K.; Amer, Y. Collaboration behavioural factors for sustainable agri-food supply chains: A systematic review. J. Clean. Prod. 2018, 186, 851–864. [Google Scholar] [CrossRef]
  60. Das, D. Development and validation of a scale for measuring Sustainable Supply Chain Management practices and performance. J. Clean. Prod. 2017, 164, 1344–1362. [Google Scholar] [CrossRef]
  61. Sarkis, J.; Zhu, Q.; Lai, K.H. An organizational theoretic review of green supply chain management literature. Int. J. Prod. Econ. 2011, 130, 1–15. [Google Scholar] [CrossRef]
  62. Luthra, S.; Mangla, S.K. When strategies matter: Adoption of sustainable supply chain management practices in an emerging economy’s context. Resour. Conserv. Recycl. 2018, 138, 194–206. [Google Scholar] [CrossRef]
  63. Mardani, A.; Streimikiene, D.; Zavadskas, E.K.; Cavallaro, F.; Nilashi, M.; Jusoh, A.; Zare, H. Application of Structural Equation Modeling (SEM) to Solve Environmental Sustainability Problems: A Comprehensive Review and Meta-Analysis. Sustainability 2017, 9, 1814. [Google Scholar] [CrossRef] [Green Version]
  64. Barbosa-Póvoa, A.P.; da Silva, C.; Carvalho, A. Opportunities and challenges in sustainable supply chain: An operations research perspective. Eur. J. Oper. Res. 2017, 268, 399–431. [Google Scholar] [CrossRef]
  65. Kusi-Sarpong, S.; Sarkis, J.; Wang, X. Assessing green supply chain practices in the Ghanaian mining industry: A framework and evaluation. Int. J. Prod. Econ. 2016, 181, 325–341. [Google Scholar] [CrossRef]
  66. Tundys, B.; Wisniewski, T. The Selected Method and Tools for Performance Measurement in the Green Supply Chain—Survey Analysis in Poland. Sustainability 2018, 10, 549. [Google Scholar] [CrossRef] [Green Version]
  67. Sharma, V.; Chandna, P.; Bhardwaj, A. Green supply chain management related performance indicators in agro industry: A review. J. Clean. Prod. 2016, 141, 1195–1208. [Google Scholar] [CrossRef]
  68. Luo, J.; Ji, C.; Qiu, C.; Jia, F. Agri-Food Supply Chain Management: Bibliometric and Content Analyses. Sustainability 2018, 10, 1573. [Google Scholar] [CrossRef] [Green Version]
  69. Choi, Y.; Zhang, N. Does proactive green logistics management improve business performance? A case of Chinese logistics enterprises. Afr. J. Bus. Manag. 2011, 5, 7564–7574. [Google Scholar]
  70. Choi, Y. Green management of logistics enterprises and its sustainable performance in Korea. Afr. J. Bus. Manag. 2012, 6, 1475–1482. [Google Scholar]
  71. Kaiser, H.F.; Rice, J. Little Jiffy, Mark IV. Educ. Psychol. Meas. 1974, 34, 111–117. [Google Scholar] [CrossRef]
  72. Chin, W.W. The partial least squares approach to structural equation modeling. In Modern Methods for Business Research; Marcoulides, G.A., Ed.; Lawrence Erlbaum Assoc. Inc.: Mahwah, NJ, USA, 1998; pp. 295–336. [Google Scholar]
  73. Fornell, C.; Larcker, D.F. Evaluating Structural Equation Models with Unobservable Variables and Measurement Error. J. Mark. Res. 1981, 18, 39–50. [Google Scholar] [CrossRef]
  74. Nunnally, J.C.; Bernstein, I.H. Psychometric Theory, 3rd ed.; McGraw-Hill: New York, NY, USA, 1994. [Google Scholar]
  75. Bagozzi, R.P.; Yi, Y.; Phillips, L.W. Assessing construct validity in organizational research. Adm. Sci. Q. 1991, 36, 421–458. [Google Scholar] [CrossRef]
  76. Dangelico, R.M.; Pontrandolfo, P. Being “Green and Competitive”: The Impact of Environmental Actions and Collaborations on Firm Performance. Bus. Strategy Environ. 2013, 24, 142–185. [Google Scholar] [CrossRef]
  77. Sila, I. Investigating changes in TQM’s effects on corporate social performance and financial performance over time. J. Total Qual. Manag. Bus. Excell. 2020, 31, 210–229. [Google Scholar] [CrossRef]
  78. Mariano, E.B.; Gobbo, J.A., Jr.; de Castro, C.F.; do Nascimento, R.D.A. CO2 emissions and logistics performance: A composite index proposal. J. Clean. Prod. 2017, 163, 166–178. [Google Scholar] [CrossRef]
  79. Önder, M. Contribution of Plays and Toys to Children’s Value Education. Asian J. Educ. Train. 2018, 4, 146–149. [Google Scholar] [CrossRef] [Green Version]
  80. Melander, L.; Pazirandeh, A. Collaboration beyond the supply network for green innovation: Insight from 11 cases. Supply Chain Manag. 2019, 24, 509–523. [Google Scholar] [CrossRef]
  81. Yunhui, Z.; Ningshuo, Z.; Taiwen, F.; Chuanli, Z.; Jianming, Z. The green spillover effect of green customer integration: Does internal integration matter? Corp. Soc. Responsib. Environ. Manag. 2020, 27, 325–338. [Google Scholar]
  82. Jermsittiparsert, K.; Sriyakul, T.; Sangperm, N. The Influence of Customer and Technology Supply Chain Integration on Social Sustainable Performance with Moderating Role of Organizational Structure. Int. J. Supply Chain Manag. 2019, 8, 71–82. [Google Scholar]
  83. Moggi, S.; Bonomi, S.; Ricciardi, F. Against Food Waste: CSR for the Social and Environmental Impact through a Network-Based Organizational Model. Sustainability 2018, 10, 3515. [Google Scholar] [CrossRef] [Green Version]
  84. Heide, J.B.; Miner, A.S. The shadow of the future: Effects of anticipated interaction and frequency of contact on buyer-seller cooperation. Acad. Manag. J. 1992, 35, 265–291. [Google Scholar] [CrossRef] [Green Version]
  85. Tae-Sik, R.; Young-Moo, K.; Xiu, J. A Study on the Influence of Reasonable Mobile Task Instruction and Mobile Information Sharing on Employee Job Satisfaction: The Moderating Effect of Self-Efficacy. J. Inst. Internet Broadcast. Commun. 2019, 19, 37–49. [Google Scholar]
  86. Seuring, S.; Müller, M. From a literature review to a conceptual framework for sustainable supply chain management. J. Clean. Prod. 2008, 16, 1699–1710. [Google Scholar] [CrossRef]
  87. Lüdeke-Freund, F.; Gold, S.; Bocken, N. Sustainable business model and supply chain conceptions—Towards an integrated perspective. In Implementing Triple Bottom Line Sustainability into Global Supply Chains; Bals, L., Tate, W., Eds.; Greenleaf: Sheffield, UK, 2016; pp. 337–363. [Google Scholar]
  88. Reklitis, P.; Trivellas, P.; Mantzaris, I.; Mantzari, E.; Reklitis, D. Employee Perceptions of Corporate Social Responsibility Activities and Work-Related Attitudes: The Case of a Greek Management Services Organization. In Sustainability and Social Responsibility: Regulation and Reporting, 1st ed.; Gal, G., Akisik, O., Wooldridge, W., Eds.; Springer: Singapore, 2018; pp. 225–240. [Google Scholar] [CrossRef]
  89. Reklitis, P.; Fotiadis, A.; Trivellas, P. Emotional Exhaustion and Perceived Corporate Social Responsibility: A Case Study of a Port Logistics Organization. Springer Proceedings in Business and Economics; Sakas, D., Nasiopoulos, D., Eds.; Springer: Cham, Switzerland, 2019; pp. 17–24. [Google Scholar] [CrossRef]
  90. Reklitis, P.; Fotiadis, A.; Trivellas, P. Perceived Corporate Social Responsibility and Job Satisfaction in a Port Logistics Organization. Springer Proceedings in Business and Economics; Sakas, D., Nasiopoulos, D., Eds.; Springer: Cham, Switzerland, 2019; pp. 9–16. [Google Scholar] [CrossRef]
  91. Huang, Y.-S.; Hung, J.-S.; Ho, J.-W. A study on information sharing for supply chains with multiple suppliers. Comput. Ind. Eng. 2017, 104, 114–123. [Google Scholar] [CrossRef]
  92. Guan, Z.; Zhang, X.; Zhou, M.; Dan, Y. Demand information sharing in competing supply chains with manufacturer-provided service. Int. J. Prod. Econ. 2020, 220, 107450. [Google Scholar] [CrossRef]
  93. Çankaya, S.Y.; Sezen, B. Effects of green supply chain management practices on sustainability performance. J. Manuf. Technol. Manag. 2019, 30, 98–121. [Google Scholar] [CrossRef]
  94. García-Arca, J.; Garrido, A.; Prado-Prado, J.C. “Sustainable Packaging Logistics”. The link between Sustainability and Competitiveness in Supply Chains. Sustainability 2017, 9, 1098. [Google Scholar] [CrossRef] [Green Version]
  95. Rundh, B. The role of packaging within marketing and value creation. Br. Food J. 2016, 118, 2491–2511. [Google Scholar] [CrossRef]
  96. Vernuccio, M.; Cozzolino, A.; Michelin, I.L. An exploratory study of marketing, logistics, and ethics in packaging innovation. Eur. J. Innov. Manag. 2010, 13, 333–354. [Google Scholar] [CrossRef]
  97. Nordin, N.; Selke, S. Social aspect of sustainable packaging. Packag. Technol. Sci. 2010, 23, 317–326. [Google Scholar] [CrossRef]
  98. Ni, W.; Sun, H. The effect of sustainable supply chain management on business performance: Implications for integrating the entire supply chain in the Chinese manufacturing sector. J. Clean. Prod. 2019, 232, 1176–1186. [Google Scholar] [CrossRef]
  99. Recanati, F.; Marveggio, D.; Dotelli, G. From beans to bar: A life cycle assessment towards sustainable chocolate supply chain. Sci. Total Environ. 2018, 613, 1013–1023. [Google Scholar] [CrossRef]
  100. Rebolledo-Leiva, R.; Angulo-Meza, L.; Iriarte, A.; Gonzalez-Araya, M.C. Joint carbon footprint assessment and data envelopment analysis for the reduction of greenhouse gas emissions in agriculture production. Sci. Total Environ. 2017, 593, 36–46. [Google Scholar] [CrossRef] [PubMed]
  101. Miranda-Ackerman, M.A.; Azzaro-Pantel, C.; Aguilar-Lasserre, A.A. A green supply chain network design framework for the processed food industry: Application to the orange juice agrofood cluster. Comput. Ind. Eng. 2017, 109, 369–389. [Google Scholar] [CrossRef] [Green Version]
  102. Sherafati, M.; Bashiri, M.; Tavakkoli-Moghaddam, R.; Pishvaee, M.S. Supply chain network design considering sustainable development paradigm: A case study in cable industry. J. Clean. Prod. 2019, 234, 366–380. [Google Scholar] [CrossRef]
  103. Xu, W.; Zhang, Z.; Wang, H.; Yi, Y.; Zhang, Y. Optimization of monitoring network system for Eco safety on Internet of Things platform and environmental food supply chain. Comput. Commun. 2020, 151, 320–330. [Google Scholar] [CrossRef]
  104. Nordmark, I.; Ljungberg, D.; Gebresenbet, G.; Bosona, T.; Jüriado, R. Integrated Logistics Network for the Supply Chain of Locally Produced Food, Part II: Assessment of E-Trade, Economic Benefit and Environmental Impact. J. Serv. Sci. Manag. 2012, 5. [Google Scholar] [CrossRef] [Green Version]
  105. Geiger, C. ICT in Green Freight Logistics. In Green Transportation Logistics: The Quest for Win-Win Solutions; Psaraftis, H.N., Ed.; Springer International Publishing: Cham, Switzerland, 2016; pp. 205–241. [Google Scholar]
  106. Al-Odeh, M.; Smallhood, J. Sustainable Supply Chain Management: Literature Review, Trends, and Framework. Int. J. Comput. Eng. Manag. 2012, 15, 85–90. [Google Scholar]
  107. Vance, L.; Heckl, I.; Bertok, B.; Cabezas, H.; Friedler, F. Designing sustainable energy supply chains by the P-graph method for minimal cost, environmental burden, energy resources input. J. Clean. Prod. 2015, 94, 144–154. [Google Scholar] [CrossRef]
  108. Teece, D.J.; Pisano, G.; Shuen, A. Dynamic Capabilities and Strategic Management. Strateg. Manag. J. 1997, 18, 509–533. [Google Scholar] [CrossRef]
  109. Baron, R.A.; Tang, J. The role of entrepreneurs in firm-level innovation: Joint effects of positive affect, creativity, and environmental dynamism. J. Bus. Ventur. 2011, 26, 49–60. [Google Scholar] [CrossRef]
  110. Kim, M.; Chai, S. The impact of supplier innovativeness, information sharing and strategic sourcing on improving supply chain agility: Global supply chain perspective. Int. J. Prod. Econ. 2017, 187, 42–52. [Google Scholar] [CrossRef]
  111. Marinagi, C.; Trivellas, P.; Reklitis, P. Information Quality and Supply Chain Performance: The Mediating Role of Information Sharing. Procedia Soc. Behav. Sci. 2015, 175, 473–479. [Google Scholar] [CrossRef] [Green Version]
  112. Raweewana, Μ.; Ferrell, W.G., Jr. Information sharing in supply chain collaboration. Comput. Ind. Eng. 2018, 126, 269–281. [Google Scholar] [CrossRef]
  113. Liu, H.; Ke, W.; Wei, K.K.; Hua, Z. Effects of supply chain integration and market orientation on firm performance: Evidence from China. Int. J. Oper. Prod. Manag. 2013, 33, 322–346. [Google Scholar] [CrossRef]
  114. Prajogo, D.; Olhager, J. Supply chain integration and performance: The effects of long-term relationships, information technology and sharing, and logistics integration. Int. J. Prod. Econ. 2012, 135, 514–522. [Google Scholar] [CrossRef]
  115. Bagchi, P.K.; Skjøtt-Larsen, T. Supply chain integration: A European survey. Int. J. Logist. Manag. 2005, 16, 275–294. [Google Scholar] [CrossRef]
  116. Fabbe-Costes, N.; Jahre, M. Supply chain integration improves performance: The Emperor’s new suit? Int. J. Phys. Distrib. Logist. Manag. 2007, 37, 835–855. [Google Scholar] [CrossRef]
  117. Karippacheril, T.G.; Rios, L.D.; Srivastava, L. Global Markets, Global Challenges: Improving Food Safety and Traceability While Empowering Smallholders through ICT. In Agriculture (Updated Edition): Connecting Smallholders to Knowledge, Networks, and Institutions; World Bank Group: Washington, DC, USA, 2017. [Google Scholar] [CrossRef] [Green Version]
  118. Stajniak, M.J.; Koliński, A. The Impact of Transport Processes Standardization on Supply Chain Efficiency. Sci. J. Logist. 2016, 12, 37–46. [Google Scholar]
  119. Prashar, D.; Jha, N.; Jha, S.; Lee, Y.; Joshi, G.P. Blockchain-Based Traceability and Visibility for Agricultural Products: A Decentralized Way of Ensuring Food Safety in India. Sustainability 2020, 12, 3497. [Google Scholar] [CrossRef] [Green Version]
  120. Lahkani, M.J.; Wang, S.; Urbański, M.; Egorova, M. Sustainable B2B E-Commerce and Blockchain-Based Supply Chain Finance. Sustainability 2020, 12, 3968. [Google Scholar] [CrossRef]
  121. Mukherjee, S.; Carter, C.; Koh, S.C.L. Blockchain Disruption in Transport; Working paper; Catapult Transport Systems and The University of Sheffield: Milton Keynes, UK, 2018. [Google Scholar] [CrossRef]
  122. Pournader, M.; Shi, Y.; Seuring, S.; Koh, S.C.L. Blockchain applications in supply chains, transport and logistics: A systematic review of the literature. Int. J. Prod. Res. Spec. Issue Blockchain Transp. Logist. 2020, 58, 2063–2081. [Google Scholar] [CrossRef]
  123. Koh, S.C.L.; Dolgui, A.; Sarkis, J. Blockchain in transport and logistics—Paradigms and transitions. Int. J. Prod. Res. Spec. Issue Blockchain Transp. Logist. 2020, 58, 2054–2062. [Google Scholar] [CrossRef] [Green Version]
  124. Cingoz, A.; Akdogan, A.A. Strategic flexibility, environmental dynamism, and innovation performance: An empirical study. Procedia Soc. Behav. Sci. 2013, 99, 582–589. [Google Scholar] [CrossRef] [Green Version]
  125. Malindretos, G.; Tsiboukas, K.; Argyropoulou-Konstantaki, S. Sustainable wine supply chain and entrepreneurship. The exploitation of by-products in a waste management process. Int. J. Bus. Sci. Appl. Manag. 2016, 11, 34–46. [Google Scholar]
  126. Hill, W.L.C.; Jones, G.R. Strategic Management: An Integrated Approach, 8th ed.; Houghton Mifflin Company: Boston, MA, USA, 2008. [Google Scholar]
  127. Wu, W.Y.; Nguyen, P.T. The Antecedents of Dynamiv Service Innovation Capabilities: The Moderating Roles of Market Dynamism and Market Orientation. Int. J. Innov. Manag. 2019, 1950066. [Google Scholar] [CrossRef]
  128. Talib, M.S.A.; Sawari, S.S.M.; Hamid, A.B.; Chin, T.A. Emerging Halal food market: An Institutional Theory of Halal certificate implementation. Manag. Res. Rev. 2016, 39, 987–997. [Google Scholar] [CrossRef]
  129. Guzi, M.; Pedraza, P.P. A web survey analysis of subjective well-being. Int. J. Manpow. 2015, 36, 48–67. [Google Scholar] [CrossRef]
  130. Dickerson, A.; Green, F. Fears and realisations of employment insecurity. Labour Econ. 2012, 19, 198–210. [Google Scholar] [CrossRef] [Green Version]
  131. Chiffoleau, Y.; Dourian, T. Sustainable Food Supply Chains: Is Shortening the Answer? A Literature Review for a Research and Innovation Agenda. Sustainability 2020, 12, 9831. [Google Scholar] [CrossRef]
  132. Pérez-Mesa, J.C.; Piedra-Muñoz, L.; García-Barranco, M.C.; Giagnocavo, C. Response of Fresh Food Suppliers to Sustainable Supply Chain Management of Large European Retailers. Sustainability 2019, 11, 3885. [Google Scholar] [CrossRef] [Green Version]
  133. Kamblea, S.S.; Gunasekaranb, A.; Gawankarc, S.A. Achieving sustainable performance in a data-driven agriculture supply chain: A review for research and applications. Int. J. Prod. Econ. 2020, 219, 179–194. [Google Scholar] [CrossRef]
  134. Tian, X.; Sarkis, J. Expanding green supply chain performance measurement through emergy accounting and analysis. Int. J. Prod. Econ. 2020, 225, 107576. [Google Scholar] [CrossRef]
  135. Wu, G.C.; Cheng, Y.H.; Huang, S.Y. The study of knowledge transfer and green management performance in green supply chain management. Afr. J. Bus. Manag. 2010, 4, 44–48. [Google Scholar]
  136. Large, R.O.; Thomsen, C.G. Drivers of Green Supply Chain Management Performance: Evidence from Germany. J. Purch. Supply Manag. 2011, 17, 176–184. [Google Scholar] [CrossRef]
  137. Li, Y. Research on the Performance Measurement of Green Supply Chain Management in China. J. Sustain. Dev. 2011, 4, 101. [Google Scholar] [CrossRef] [Green Version]
  138. Perotti, S.; Zorzini, M.; Enrico, B.; Guido, C.; Micheli, J.L. Green supply chain practices and company performance: The case of 3PLs in Italy. Int. J. Phys. Distrib. Logist. Manag. 2012, 42, 640–672. [Google Scholar] [CrossRef]
  139. Geng, R.; Mansouri, S.A.; Aktas, E. The relationship between green supply chain management and performance: A meta-analysis of empirical evidences in Asian emerging economies. Int. J. Prod. Econ. 2017, 183, 245–258. [Google Scholar] [CrossRef] [Green Version]
  140. Chin, T.A.; Tat, H.H.; Sulaiman, Z. Green Supply Chain Management. Environmental Collaboration and Sustainability Performance. Proc. CIRP 2015, 26, 695–699. [Google Scholar] [CrossRef] [Green Version]
  141. Tundys, B.; Fernando, Y. Sustainable Supply Chain Management-Key Performance Indicators (KPIs) as an element for measuring of processes. Transp. Econ. Transp. Serv. Mark. 2019, 83, 31–50. [Google Scholar]
  142. Jermsittiparsert, K.; Siriattakul, P.; Wattanapongphasuk, S. Determining the Environmental Performance of Indonesian SMEs influence by Green Supply Chain Practices with Moderating Role of Green HR Practices. Int. J. Supply Chain Manag. 2019, 8, 59–70. [Google Scholar]
  143. Yu, Z.; Golpîra, H.; Khan, S.A.R. The relationship between Green Supply Chain Performance, Energy Demand, Economic Growth and Environmental Sustainability: An Empirical Evidence from Developed Countries. LogForum 2018, 14, 479–494. [Google Scholar] [CrossRef]
  144. Yu, W.; Feng, M.; Wiengarten, F. Integrated green supply chain management and operational performance. Supply Chain Manag. 2014, 19, 683–696. [Google Scholar] [CrossRef]
  145. Ibrahim, I.; Jamil, N.A.; Halin, I.A. Green Enterprise Resource Planning and Green Logistics Performance. The SIJ Transactions on Industrial. Financ. Bus. Manag. 2018, 6, 1–6. [Google Scholar]
  146. Uygun, O.; Dede, A. Performance evaluation of green supply chain management using integrated fuzzy multi-criteria decision making techniques. Comput. Ind. Eng. 2016, 102, 502–511. [Google Scholar] [CrossRef]
  147. Mumtaz, U.; Ali, Y.; Petrillo, A. A linear regression approach to evaluate the green supply chain management impact on industrial organizational performance. Sci. Total Environ. 2018, 624, 162–169. [Google Scholar] [CrossRef]
  148. Makmor, M.F.M.; Saad, M. Leadership and Management Commitment towards Logistics Performance Improvement in Malaysia with the Adoption of Green Logistics as the Moderating variable. Int. J. Acad. Res. Bus. Soc. Sci. 2017, 7, 2222–6990. [Google Scholar] [CrossRef]
  149. Chrisostom, A.O.; Monari, F. Influence Green Logistics Management on Performance of registered Automotive Firms in Kenya. Int. J. Acad. Res. Bus. Soc. Sci. 2018, 8, 351–365. [Google Scholar] [CrossRef]
  150. Lee, S.-Y. The effects of green supply chain management on the supplier’s performance through social capital accumulation. Supply Chain Manag. 2015, 20, 42–55. [Google Scholar] [CrossRef]
  151. Achuora, J. Effect of Green Supply Chain Management Practices on the performance of manufacturing firms in Kenya. Glob. Sci. J. 2018, 6, 669–862. [Google Scholar]
  152. Muma, B.O.; Nyaoga, R.B.; Matwere, R.B.; Nyambega, E. Green supply chain management and environmental performance among tea processing firms in Kericho County-Kenya. Int. J. Econ. Financ. Manag. Sci. 2014, 2, 270–276. [Google Scholar] [CrossRef]
  153. Aslam, H.; Rashid, K.; Wahla, A.R.; Tahira, U. Drivers of Green Supply Chain Management Practices and their Impact on Firm Performance: A Developing Country Perspective. J. Quant. Methods 2018, 2, 87–111. [Google Scholar] [CrossRef]
  154. Foo, P.-Y.; Lee, V.H.; Tan, G.W.-H.; Ooi, K.-B. A gateway to realising sustainability performance via green supply chain management practices: A PLS–ANN approach. Expert Syst. Appl. 2018, 107, 1–14. [Google Scholar] [CrossRef]
  155. Chan, R.Y.K.; He, H.; Chan, H.K.; Wang, W.Y.C. Environmental orientation and corporate performance: The mediation mechanism of green supply chain management and moderating effect of competitive intensity. Ind. Mark. Manag. 2012, 41, 621–630. [Google Scholar] [CrossRef]
  156. Wang, Z.; Wang, Q.; Zhang, S.; Zhao, X. Effects of customer and cost drivers on green supply chain management practices and environmental performance. J. Clean. Prod. 2018, 189, 673–682. [Google Scholar] [CrossRef]
  157. Kuei, C.H.; Madu, C.N.; Chow, W.S.; Chen, Y. Determinants and associated performance improvement of green supply chain management in China. J. Clean. Prod. 2015, 95, 163–173. [Google Scholar] [CrossRef]
Figure 1. The conceptual framework of the empirical study.
Sustainability 12 10515 g001
Table 1. Green logistics management (GLM) items (drivers).
Green Logistics Management Items (Drivers)Items Group
1. Green packing materialsPacking
2. Packing material amount
3. Information sharing with manufacturing firms and retailersInformation sharing
4. Efficient and accurate ordering system
5. Reduction of warehouse feeWarehouse
6. Location selection of warehouse
7. Greenhouse gas (GHG)Logistics emissions
8. Adoption of green technologies to save resources
9. Pollution emissions in logistics activities
10. Standardization of transportLogistics networking and Transport
11. Optimization of vehicles’ routing
12. Greener vehicles—transport modes
13. Loading and unloading safety
14. Unit load to improve efficiency
15. Logistics networking
16. Information technology design and use at the logistics network
Table 2. Business performance KPIs.
Business Performance KPIsΚPIs GroupIndicative
Literature
1. Sales volumeMarket performanceDess and Robinson [36]
Vickery et al. [37]
Ward et al. [38]
Roth et al. [39]
Reklitis and Trivellas [40]
Polychroniou and Trivellas [16]
Zhen and Routray [41]
Lewis and Thomas [42]
Frazier and Howell [43]
Boeker [44]
Dess and Davis [45]
Green et al. [14]
Aramyan et al. [46]
Gold et al. [47]
Bourlakis et al. [48]
2. Sales growth
3. Market share
4. Market share growth
5. Firm’s reputation
6. Profit margin Financial performance
7. Return on Equity (ROE)
8. Return on Investment (ROI)
9. Net Profits
10. New product developmentInnovation/
growth performance
11. New market entrance
12. Innovativeness and Quality
13. Employee satisfactionSocial performance
14. Corporate Social Responsibility
Table 3. Supply chain performance KPIs.
Supply Chain Performance KPIsΚPIs GroupIndicative
Literature
1. Innovation development with suppliersSupply Chain InnovationFynes et al. [49]
Choi and Eboch [50]
Fynes and Voss [51]
Dixon [52]
Shao et al. [53]
Aramyan et al. [46]
Gold et al. [47]
Bourlakis et al. [48]
2. Innovation identification within the supply base
3. Speed of delivery relative to competitorsDelivery
4. Percentage of orders delivered on-time.
5. Unit cost of product relative to competitors.Cost
6. Unit cost of product over life cycle
7. Volume flexibilityFlexibility
8. Variety (product line) flexibility
9. Inventory optimizationOptimization
10. Cash management optimization
11. Tracking/feedback systems’ efficiencyTraceability
Table 4. Green performance KPIs.
Green Performance KPIsΚPIs GroupIndicative
Literature
1. Energy consumptionResources usage and safetyCalik and Bardudeen [54]
Zhu et al. [55]
Green et al. [14]
Aramyan et al. [46]
Gold et al. [47]
Bourlakis et al. [48]
2. Water consumption
3. Restrain usage of dangerous/hazardous materials
4. Environmental accidents
5. Carbon dioxide emissions
6. Novelty in environmental issues relative to competitors Environmental process management performance
7. Waste management
8. Environmental performance in transportation process (e.g., lower fuel consumption)
Table 5. Principal component analysis (PCA) for the green logistics management (GLM) scale 1.
Items (KMO = 0.891)GLM1 2GLM2GLM3GLM4GLM5
1. Green packing materials 0.669
2. Packing material amount 0.847
3. Information sharing with manufacturing firms and retailers 0.821
4. Efficient and accurate ordering system 0.829
5. Reduction of warehouse fee 0.820
6. Location selection of warehouse 0.789
7. Greenhouse gas (GHG) 0.715
8. Adoption of green technologies to save resources 0.773
9. Pollution emissions in logistics activities 0.678
10. Standardization of transport0.689
11. Optimization of vehicles’ routing0.840
12. Greener vehicles—transport modes0.680
13. Loading and unloading efficiently0.741
14. Unit load to improve efficiency0.653
15. Logistics networking0.810
16. Information technology design and use at the logistics network0.715
Eigenvalues4.2022.5732.0061.9661.711
Variance explained (%)26.26 16.08 12.54 12.29 10.69
Cumulative variance explained (%)26.2642.35 54.88 67.17 77.86
Cronbach’s alpha0.904 0.841 0.751 0.820 0.704
Composite Reliability (CR)0.891 0.766 0.7860.810 0.735
Average Variance Extracted (AVE)0.541 0.523 0.647 0.681 0.582
1 All factor loadings less than 0.5 suppressed (varimax rotated components matrix). 2 GLM1: Logistics networking and transportation, GLM2: Logistics emissions, GLM3: Warehouse, GLM4: Information sharing, GLM5: Packing.
Table 6. PCA for the business performance (BP) scale 1.
Items (KMO = 0.822)BP1 2BP2BP3BP4
1. Sales volume0.877
2. Sales growth0.730
3. Market share0.781
4. Market share growth0.859
5. Firm’s reputation0.661
6. Profit margin 0.771
7. ROE 0.814
8. ROI 0.697
9. Net Profits 0.901
10. New product development 0.792
11. New market entrance 0.814
12. Innovativeness and Quality 0.869
13. Employee satisfaction 0.880
14. Corporate Social Responsibility 0.842
Eigenvalues3.5432.9762.4741.779
Variance explained (%)25.3121.2617.6712.71
Cumulative variance explained (%)25.3146.5764.2476.94
Cronbach’s alpha0.8930.8620.8520.741
Composite Reliability (CR)0.8890.8750.8650.852
Average Variance Extracted (AVE)0.6170.6390.6820.742
1 All factor loadings less than 0.5 suppressed (varimax rotated components matrix). 2 BP1: Market performance, BP2: Financial performance, BP3: Innovation/growth performance, BP4: Social performance.
Table 7. PCA for the supply chain (SC) performance scale 1.
Items (KMO = 0.793)SC1 2SC2SC3SC4SC5SC6
1. Innovation development with suppliers0.889
2. Innovation identification within the supply base0.895
3. Speed of delivery relative to competitors 0.885
4. Percentage of orders delivered on-time. 0.882
5. Unit cost of product relative to competitors. 0.895
6. Unit cost of product over life cycle 0.734
7. Volume flexibility 0.694
8. Variety (product line) flexibility 0.883
9. Inventory optimization 0.758
10. Cash management optimization 0.850
11. Tracking/feedback systems’ efficiency 0.928
Eigenvalues2.0661.8601.7451.6781.2901.093
Variance explained (%)18.7816.9115.8715.2611.729.94
Cumulative variance explained (%)18.7835.6951.5666.8178.5488.48
Cronbach’s alpha0.9100.8460.7820.8000.740-
Composite Reliability (CR)0.8860.8770.8010.7710.786-
Average Variance Extracted (AVE)0.7960.7800.6700.6310.649-
1 All factor loadings less than 0.5 suppressed (varimax rotated components matrix). 2 SC1: Supply Chain Innovation, SC2: Delivery, SC3: Cost, SC4: Flexibility, SC5: Optimization, SC6: Traceability.
Table 8. PCA for the green performance (GP) scale 1.
Items (KMO = 0.740)GP1 2GP2
1. Energy consumption0.843
2. Water consumption0.773
3. Restrain usage of dangerous/hazardous materials0.607
4. Environmental accidents0.824
5. Carbon dioxide emissions0.827
6. Novelty in environmental issues relative to competitors 0.937
7. Waste management 0.608
8. Improving environmental performance in transportation (e.g., lower fuel consumption) 0.876
Eigenvalues3.2602.286
Variance explained (%)40.7528.58
Cumulative variance explained (%)40.7569.33
Cronbach’s alpha0.8470.784
Composite Reliability (CR)0.8840.856
Average Variance Extracted (AVE)0.6080.672
1 All factor loadings less than 0.5 suppressed (varimax rotated components matrix). 2 GP1: Resources usage and safety, GP2: Environmental process management performance.
Table 9. PCA for the environmental dynamism (DYN) scale 1.
Items (KMO = 0.847)DYN
1. The rate of innovation of new products and services0.794
2. The rate of change of tastes and preferences of customers0.841
3. The rate of change of distribution channels0.824
4. The rate of change of suppliers0.730
Eigenvalues2.549
Variance explained (%)63.74
Cronbach’s alpha0.802
Composite Reliability (CR)0.875
Average Variance Extracted (AVE)0.637
1 All factor loadings less than 0.5 suppressed (varimax rotated components matrix).
Table 10. Descriptive statistics and results of discriminant validity analysis of all scales 1.
Variable 11234567891011121314151617
1. GL_IS0.825
2. GL_pck0.486 **0.763
3. GL_Net0.426 **0.301 **0.735
4. GL_emi0.470 **0.479 **0.615 **0.723
5. GL_war0.376 **0.342 **0.569 **0.580 **0.805
6. E_dyn0.365 **0.295 **0.225 *0.274 **0.205 *0.798
7. BP_inn0.301 **0.253 **0.410 **0.402 **0.371 **0.339 **0.826
8. BP_mrk0.306 **0.1480.325 **0.307 **0.402 **0.1340.480 **0.786
9. BP_fina0.330 **0.1550.309 **0.1510.1480.1750.482 **0.541 **0.799
10. BP_soci0.480 **0.295 **0.406 **0.420 **0.404 **0.0620.266 **0.339 **0.210 *0.861
11. GP_rus0.0470.0180.215 *0.0080.0980.244 **0.244 **0.209 *0.382 **−0.0880.780
12. GP_ems0.222 *0.246 **0.507 **0.471 **0.274 **0.262 **0.451 **0.213 *0.414 **0.1730.521 **0.820
13. SC_inn0.407 **0.274 **0.395 **0.322 **0.1230.233 *0.603 **0.209 *0.413 **0.360 **0.1030.275 **0.892
14. SC_deli0.481 **0.290 **0.460 **0.476 **0.417 **0.320 **0.429 **0.338 **0.270 **0.381 **0.1770.461 **0.335 **0.884
15. SC_cost0.417 **0.210 *0.339 **0.1730.198 *0.333 **0.264 **0.211 *0.392 **0.0880.288 **0.456 **0.334 **0.407 **0.818
16. SC_flex0.421 **0.241 **0.255 **0.189 *0.214 *0.225 *0.374 **0.298 **0.435 **0.231 *0.203 *0.365 **0.408 **0.387 **0.590 **0.794
17. SC_opti0.474 **0.238 **0.444 **0.298 **0.220 *0.202 *0.512 **0.269 **0.442 **0.377 **0.1360.296 **0.671 **0.479 **0.463 **0.516 **0.805
18. SC_trac 20.248 **0.1720.410 **0.292 **0.343 **0.215 *0.310 **0.396 **0.1590.342 **0.1120.299 **0.296 **0.353 **0.312 **0.397 **0.469 **
Mean5.245.195.225.415.635.195.325.324.685.773.734.744.865.835.065.135.50
STD1.0291.1891.0801.2271.1571.0181.2911.0771.1061.1141.4331.3171.2870.9571.0541.0420.874
Correlation is significant * at the 0.05 level, ** at the 0.01 level, 1 GL_IS: Information sharing, GL_pck: Packing, GL_Net: Logistics networking, loading and unloading and transportation, GL_emi: Logistics emissions, GL_war: Warehouse, E_dyn: Environmental dynamism, BP_inn: Innovation/growth performance, BP_mrk: Market performance, BP_fina: Financial performance, BP_soci: Social performance, GP_rus: Resources usage and safety, GP_ems: Environmental process management performance, SC_inn: Supply Chain Innovation, SC_deli: Delivery, SC_cost: Cost, SC_flex: Flexibility, SC_opti: Optimization, SC_trac: Traceability, 2 Traceability mean = 5.77, STD = 1.114.
Table 11. Results of regression models testing the relationships of GSCM with business and green performance 1.
Dependent Variables
Independent VariablesBP1 2BP2BP3BP4GP1GP2
Control variables
Firm’s age0.0860.044−0.0380.0970.1380.041
Firm’s size0.421 **0.1340.1720.134−0.008−0.014
Environmental Dynamism−0.0760.0240.204 *−0.195 *0.2090.164
Green Supply Chain Management
Information sharing0.225 *0.239 *0.1120.343 ***−0.103−0.134
Logistics emissions−0.051−0.2310.039−0.033−0.2500.207
Warehouse0.111−0.0500.1330.0580.058−0.117
Packing0.1740.236 *0.0210.278 *0.0730.118
Logistics networking and transportation0.0650.301 *0.298 **0.207 *0.324 *0.423 ***
Adjusted-R20.387 ***0.244 **0.347 ***0.418 ***0.224 **0.318 ***
1 Standardized beta coefficients presented, * Significant at the 0.05 level, ** significant at the 0.01 level, *** significant at the 0.001 level. 2 BP1: Market performance, BP2: Financial performance, BP3: Innovation/growth performance, BP4: Social performance, GP1: Resources usage and safety, GP2: Environmental process management performance.
Table 12. Results of regression models testing the relationships of GSCM and supply chain performance 1.
Dependent Variables
Independent VariablesSC1 2SC2SC3SC4SC5SC6
Control variables
Firm’s age−0.134−0.135−0.0790.068−0.118−0.090
Size0.0880.117−0.1230.0260.0250.312 *
Environmental Dynamism0.0420.1390.236 *0.0680.0220.079
Green Supply Chain Management
Information sharing0.281 *0.256 *0.301 **0.343 **0.337 **0.018
Logistics emissions0.0760.171−0.135−0.156−0.049−0.091
Warehouse−0.2190.1240.0650.024−0.0480.057
Packing0.054−0.081−0.0100.1910.0140.116
Logistics networking and transportation0.318 *0.1240.261 *0.1080.342 **0.298 *
Adjusted-R20.285 ***0.357 ***0.326 ***0.233 **0.308 ***0.259 ***
1 Standardized beta coefficients presented, * Significant at the 0.05 level, ** significant at the 0.01 level, *** significant at the 0.001 level. 2 SC1: Supply Chain Innovation, SC2: Delivery, SC3: Cost, SC4: Flexibility, SC5: Optimization, SC6: Traceability.
Publisher’s Note: MDPI stays neutral with regard to jurisdictional claims in published maps and institutional affiliations.

