Basin Water Sensitivity and Its Impact on Spatial Expansion: A Case Study of the Taihu Basin, China


1
Key Laboratory of Watershed Geographic Sciences, Nanjing Institute of Geography and Limnology, Chinese Academy of Sciences, Nanjing 210008, China
2
School of Water Resources and Hydropower Engineering, North China Electric Power University, 2 Beinong Rd., Changping, Beijing 102206, China
3
Department of Resource and Environment, University of Chinese Academy, Beijing 100049, China
4
National-Regional Joint Engineering Research Center for Soil Pollution Control and Remediation in South China, Guangdong Key Laboratory of Integrated Agro-Environmental Pollution Control and Management, Institute of Eco-Environmental and Soil Sciences, Guangdong Academy of Sciences, Guangzhou 510650, China
*
Author to whom correspondence should be addressed.
Sustainability 2020, 12(24), 10353; https://doi.org/10.3390/su122410353
Submission received: 4 November 2020
/
Revised: 30 November 2020
/
Accepted: 2 December 2020
/
Published: 11 December 2020
(This article belongs to the Special Issue Urban Management Based on the Concept of Sustainable Development)
Abstract
:Water is the most important and sensitive factor controlling urban development in basins. This paper developed a novel approach to construct a Basin Water Sensitivity Index (BWSI) from the perspective of integrated basin management. The correlation between the spatial expansion of development and water sensitivity over the past 30 years in the Taihu Basin was analyzed using BWSI and urban development data. The analysis found that, (1) from 1985 to 1995 the spatial expansion of developed areas in the Taihu Basin was unrelated to BWSI; (2) from 1995 to 2007 the expansion intensity decreased with an increase in BWSI; and (3) from 2007 to 2017 there was a significant increase in the spatial development expansion intensity and the area of expansion was concentrated in low BWSI areas, while the constraints of water sensitivity on spatial expansion were more obvious than in previous years. The analysis illustrated how BWSI affected spatial growth in a basin and this research can be used to help formulate a spatial growth management policy that includes water sensitivity and provides a scientific basis for coordinating the relationship between economic and social development with water resources and the environment.
1. Introduction
Water is a core element of regional development and human survival and as global urbanization accelerates, the natural water cycle is being more severely affected by human activities [1,2,3,4]. In recent years, rapid urban development in China has led to the expansion of metropolitan areas that have placed tremendous pressure on the existing hydrologic infrastructure. Rainstorms, waterlogging, droughts and water scarcity occur frequently [5]. There is an urgent need for a sustainable water environmental management system that offsets the impacts of urban development. One such system is the Water Sensitive Urban Design (WSUD) approach [6], a comprehensive sustainable urban water ecological management framework based on the Low Impact Development Concept (LID). The intent of the approach is to cooperatively develop urban construction patterns and urban water cycles that protect water ecological resources, while improving the resilience of urban ecological environments [7]. Facing the challenges of climate change, urban population surges and water pollution, WSUD theory offers the potential to simultaneously accommodate urban development while protecting water sources, restoring urban ecosystems and addressing the potential impacts of climate change [8].
Cities and river basins are inextricably linked. A river basin provides the foundation for nurturing and conserving basic and ecological functions of cities, and consists of a complex ecosystem composed of upper, middle and lower reaches which are linked by water. Therefore, basin water management is regarded as a key ingredient needed to develop resilient cities that can adapt to climate and other man-made changes [9]. The water quality of an area depends largely on land use and management policies within the basin catchment area [10]. The occupation of forest and farmland has increased surface runoff and further changed the quantity of basin water resources, affected the amount of nutritive salt entering the water and increased the potential risks associated with floods. Moreover, increasing human activities associated with spatial growth have raised pollution emissions and increased the consumption of water resources [11,12,13,14,15,16,17].
According to previous studies, one goal of spatial growth management is to determine each area’s bearing capacity, based mainly on spatial regionalization functions. However, this approach mainly takes administrative regions as units and generally fails to consider river basins as key management components. A particularly important limitation is that the expansion of urban development is not fully considered from the comprehensive perspective of land-water interactions. Although attention has been paid to water by many studies examining land use zoning, most studies are limited to the regional (city-wide) evaluation of the water environment. These analyses disregard a comprehensive assessment of the spatial relationships between water and land as well as factors such as the quantity of water resources, the current ecological condition of aquatic ecosystems and the potential risk of water-based disasters (e.g., floods). In contrast, many current scientific integrated management plans for river basins emphasize sustainability and resilience. The objective of these management plans has also shifted from creating projects that primarily address such issues as flood prevention and water use for shipping and irrigation to a more integrated water resources utilization program. The latter includes the protection of ecosystems while simultaneously managing hazards and planning for economic and social development [9]. Therefore, adopting a regional evaluation of water sensitivity as a prerequisite for spatial growth management that links the relationships between river basins and urban development is an important research issue in basin geography and can provide a scientific basis for formulating spatial management policies within a basin.
2. Evaluation of the Basin Water Sensitivity Index (BWSI)
Water sensitivity, first proposed by Australian scholar Whelans in the 1990s, is an urban ecological construction and landscape design concept that addresses the negative effects of traditional urban development on the water environment and the urban landscape in the context of climate change [18,19]. Since then, many scholars have applied the concept of water sensitivity to urban design (WSUD) and have adopted it as an evaluation method for land use planning and engineering design to effectively adapt to climate change. WSUD is used to minimize the degradation of the water environment caused by urban spatial growth, while enhancing the appeal of urban landscapes for leisure tourism [20].
Currently, there are several definitions of water sensitivity. According to the International Association of Hydrological Sciences, water sensitivity is the responsiveness of natural hydrological and ecological processes to urban management, and it is a prerequisite for the management, protection and preservation of urban design and the urban water cycle [21,22]. Water sensitivity evaluation, according to the National Water Commission of Australia, is a new planning method that combines urban development and construction with a consideration of the water cycle throughout the urban planning process with the intent to minimize the hydrological impacts of urban development on the surrounding environment [23,24]. WSUD theory is regarded as a key component of future urban development and urban water management in Australia, the United States, France, Singapore and other countries [7,25]. Ashley et al. [7], by extending the scope of the definition of water sensitivity from cities to regions, found that water sensitivity was a prerequisite for regionally integrated water cycle management. They also stated that spatial management policies, if formulated on the basis of water sensitivity, would greatly protect the aquatic ecological environment, improve the efficiency of water resources utilization and reduce the risk of water hazards, and thus would be of great significance to regionally sustainable development.
Few researchers have described and explored the basic principles and contents of WSUD [26] or applied it to inspirational urban design [27], landscape architecture and/or extension design [28]. The practice of WSUD theory in China is even more limited, as the consideration of water sensitivity in basin development is still in its initial stages. Only Gong et al. [29] and Wang et al. [30] have explored the development and application of WSUD in China. However, the use of WSUD in these studies of storm water management and water treatment was limited to small scale projects in experimental cities; the analyses lacked a comprehensive consideration of larger spaces and elements.
Urbanization is progressing rapidly in China, especially in urban dominated river basins, including the Yangtze River Delta and the Pearl River Delta, which have experienced rapid economic development. Thus, a comprehensive understanding of water sensitivity that provides the foundation and support for the development of basin areas is critically needed. Therefore, water sensitivity research in river basins has practical significance and should receive more attention [25,31].
Water, as the soul of a river basin and a core concept of human sustainable development, provides important ecological services and enables recreation and entertainment while meeting various domestic needs of the local population. The natural water cycle closely integrates the use of water resources, the water environment and water-related disasters [32]. From this point of view, Basin Water Sensitivity (BWS) can be interpreted as the sensitivity of the aquatic ecosystem and hydrological processes to human spatial development activities. A Basin Water Sensitivity Index (BWSI) was developed herein to evaluate BWS and indicate the restrictive influence of water resources, aquatic ecology, the water environment and flood hazards on the spatial development of a basin. In other words, the evaluation of the BWSI was used to determine the suitability of spatial development in different sections of upper, middle and lower reaches of a basin by evaluating the water resources, aquatic ecology, water environment and potentials for water hazards. Basins with higher BWSI tend to have a lower carrying capacity of spatial growth. The Taihu Basin, located in the Yangtze River Delta, was selected as the research area to establish and evaluate the BWSI as it represents the most developed region in China. The analysis included four primary components as follows.
- (1)
- Water resources. The evaluation mainly includes the availability of surface and groundwater in a region. It comprehensively evaluates whether water resources are capable of meeting social, economic and ecological water demands. Overexploitation of water resources will likely result in a series of issues, such as reductions in flow along watercourses, the shrinking of wetlands, groundwater table declines, the formation of groundwater funnels (cones of depression), water pollution and land degradation [33]. Due to the spatial variations in precipitation and evaporation caused by regional climatic differences, water resources are unevenly distributed within a basin and the determination of available water quantity is very complicated. In this study, water system density and the relative abundance of water resources were taken as indices of regional water sensitivity. Water system density refers to the proportion of the evaluation unit that was covered by surface water, whereas the relative abundance of water resources was based on the ability to obtain fresh water resources given the area’s geomorphological conditions, which included low-relief plains, coastal areas, hilly terrain and mountains where large rivers and lakes are located.
- (2)
- Aquatic ecology. The evaluation of basin-scale ecological security should not only focus on ecosystem health and species security, but also on spatial differences in ecological security. That is, evaluation needs to consider ecological impacts differently in the upper and lower reaches of the basin because of their different geographical and environmental characteristics. However, the current assessment framework for aquatic ecological security stresses ecological health, while ignoring the evaluation of ecological services and ecological risks [34]. Therefore, in this study the evaluation of regional aquatic ecology with regards to basin water sensitivity mainly stresses the importance of protecting ecological services such as water conservation, water quality and flood regulation. It was evaluated based on the spatial extent of drinking water resources, the relative areas of freshwater channel maintenance, the area of water conservation (mountainous and hilly catchment areas), areas of wetlands and the occurrence of large-scale water surface areas. The importance of water ecological protection was characterized by the proportional area of these ecological units in the basin.
- (3)
- Water environment. The water environment mainly refers to water’s pollutant carrying capacity in basins without human activity. The main indices of water pollution include chemical oxygen demand (COD), ammonium nitrogen (NH4+-N) concentration, total nitrogen (TN) content, total phosphorus (TP) concentration, dissolved oxygen (DO) content and biochemical oxygen demand (BOD). Most of these parameters were calculated using an equilibrium-based water quality model [35]. In fact, the pollutant carrying capacity of the water environment is not only related to the quantity of water resources and its hydrodynamic characteristics and functions, but also to the amount and location of sewage discharge. However, due to the difficulty of obtaining actual values for these parameters and their limited relevance for the comparative study of macroregions, the regional evaluation of water’s carrying capacity within a basin mainly focused on geomorphological characteristics, water environmental functions, water quality objectives and the capacity of water to exchange with the external environment [36,37].
- (4)
- Water-based hazards. Among the losses caused by natural disasters, floods account for 40% of all losses [38]. Reasonable circumvention of flood damage has become one of the core objectives of spatial growth management in basins due to their high frequency of occurrence, large associated losses, large-scale influence and devastating impacts. In this study, water-related hazards were mainly evaluated with respect to the risk of flooding and inundation in a basin. Specifically, they reflect the comprehensive evaluation of indices, including floods and floodwater inundation as well as typhoons and storm surges, which are likely to cause flood-related disasters.
Specifically, this study applied the constructed Basin Water Sensitivity Index in the study area of Taihu Basin and, by analyzing the correlation between the BWSI and the spatial expansion intensity for developed land over the past 30 years in the Taihu Basin, attempted to reveal the internal relationship between the BWSI and local expansion and development. The research flow chart is shown in Figure 1.
3. Study Area and Data
The Taihu Basin is located along the southern flank of the Yangtze River Delta and encompasses a total area of about 3.69 × 10⁴ km2. Of this total area, the surface of Taihu Lake covers 0.61 × 10⁴ km2. The river’s total length is 393.2 km. In 2016, the Taihu Basin accounted for 9.8% of China’s national GDP but only included 0.4% of the national land area and 4.4% of the national population. While attaining great achievements and substantial progress in economic and social development, the area has significantly impacted the ecology of Taihu Lake and the Taihu Basin. Currently, only 53.4% of functional water areas in the Taihu Basin have reached the standard (defined by the proportion of water quality monitoring sites reaching the primary or secondary functional water use standards in the total evaluation unit) and only 54.5% of rivers entering Taihu Lake possessed river water quality equal to or above Class III (see Table 1 for details). The average nutrient index of Taihu Lake, which was evaluated on the basis of five indicators, including chlorophyll a (chla), total phosphorus, total nitrogen, transparency (SD) and the permanganate index (CODMn), was 62.3, indicating that the lake was moderately eutrophic. The average quantity of cyanobacteria was 82,820,000 per liter, which was 2.1 times higher than in 2015. Overall, Taihu Lake exhibited poor ecological health [39].
One of the major reasons for the basin’s degraded state was the expansion of developed land, which changed the natural state of the land surface and altered the original water flow pattern. According to TM (thematic mapper)remote sensing image interpretation, the developed/urban land areas in the Taihu Basin reached 9731 km2 in 2017 and its land use intensity reached 26.41%, which was 2.73 times, 2.10 times and 1.48 times greater than in 1985, 1995 and 2007, respectively. Some cities along the lake, such as Suzhou, Wuxi and Huzhou, had higher expansion rates than the average level of urban expansion in the basin. All these local governments were primarily focused on economic development and paid less attention to the constraints of water sensitivity; they therefore lacked an overall comprehensive management plan for spatial growth in the basin (Figure 2).
4. Methods
4.1. Evaluation Unit and Index Processing
Small Basin Evaluation Units. In order to conduct a detailed water sensitivity analysis in Taihu Basin, small basin units were designated using SRTM DEM (Shuttle Radar Topography Mission Digital Elevation Model) data from the basin. The spatial resolution of the DEM was about 90 m. The small catchment areas within the Taihu Basin were delineated through depression detention, flow direction generation and flow analysis applied to the DEM data. Specifically, using a GIS (Geographic Information System) platform and its associated “basintools” software, the micro-basin watersheds and their corresponding channels were automatically extracted and their topological relationships within the basin were established. River and water systems, lakes and reservoirs, hydraulic facilities and important traffic lines shown on remote sensing images and various data layers were extracted and processed so that water flow was smooth (continuous). The water flow outlet location node was corrected and confirmed to ensure that the micro-basin river distribution line was correct, the channel was continuous and complete and the water outlet was accurately located. While the micro-basin and channel were being extracted, the computer automatically established the topologic relationships between the micro-basins and their channels to ensure that the convergence of the surface water network was correct. According to the natural catchment relationship, the micro-basin was gradually merged into small watersheds.
The approach divided the Taihu Basin into 128 small units (the minimum area was 51 km2 and the maximum was 830 km2) for spatial evaluation by adjusting the distribution pattern.
Index Selection and Data Processing. With regard to the terms in the selection index, water resources data were evaluated based on water system density and the relative abundance of freshwater resources. Water ecological data included the spatial distribution of functional ecological areas such as drinking water resources, freshwater channel maintenance areas, water conservation areas, wetlands and large-scale water surfaces. The water environmental data included geomorphological features, water quality targets, water use, accessibility and freshwater channels, among other parameters. Index selection regarding water hazards mainly included a comprehensive evaluation of flood and typhoon risks (Table 2).
The land use data were interpreted using 15 m resolution TM and Spot 5 remote sensing images (images were based on the geospatial data cloud platform http://www.gscloud.cn/) and the topographic data were obtained from 1:50,000 topographic maps of the Taihu Basin. The water environmental and ecological data were mainly from the Water Environment Function Regionalization, Water Resources Bulletin, Environmental Statistical Bulletin and Water Resources Departments of Jiangsu Province and Zhejiang Province, as well as from the municipality of Shanghai. The data pertaining to flood hazards and tsunamis were from the Planning Code for Geological Disasters Defense and the Distribution Map of Danger-hidden Points of Geological Disasters maintained by the Ministry of Land and Resources. The Taihu Basin Atlas was prepared by the Nanjing Institute of Geography and Limnology within the Chinese Academy of Sciences.
In terms of data processing, the importance of aquatic ecology and water system density distribution were determined according to the areal proportion of important ecological areas and water surfaces in the corresponding units. The relative abundance of water resources was determined according to the relevant literature and data [40]. It was found that the abundance of water resources was the highest along the Yangtze River, followed by areas adjacent to Taihu Lake. Fresh water resources were limited in the mountainous areas of the southwest and in coastal areas in southeastern China. The risks of flooding and typhoons were calculated by the areal proportion of the potentially affected areas characterized by different levels of disaster risk. The areal proportion was divided according to the degree of disaster hazard risk and the distance from the potential source of disaster. The map of the BWSI was created using the GIS (Figure 2); specifically, the ARCGIS platform was used to assess the different datasets for each of the small watershed units. Then, the ARCGIS data management platform and spatial analysis tools were used to process the data as needed. Finally, the natural discontinuity method was used to display the processed data using different colors. Other indices were calculated as follows.
- (1)
- Geomorphological characteristics. Different geomorphic terrains have varied water-holding and drainage capacities and they influence aquatic systems differently. In mountainous and hilly areas, significant runoff may cause strong erosion and soil loss; thus, water sensitivity was defined to be high. In low-lying areas where water drainage capacity and water self-purification capacity were both low, the aquatic environment was moderately sensitive. Plains have lower water sensitivity due to their tranquil water flow. Therefore, 5 points, 3 points and 1 point were assigned to mountainous and hilly areas, low-lying areas and plains, respectively.
- (2)
- Water quality objectives. Target water quality categories were defined according to the Environmental Quality Standards for Surface Water and included Classes I–V. These classes are intended to ensure water quality and water uses over a certain period. For lower categories, the control of sewage discharge in the catchment was more stringent and the water sensitivity was also higher. Accordingly, 7 points were assigned to basins with Class II water quality, 5 points were assigned to Class III, 3 points to Class IV and 1 point was given to Class V and above.
- (3)
- Designated water use. Different water uses have different effects on water quality. According to water use, 7 points were assigned to water in natural reserves, source water, drinking water and aquaculture water with the highest water quality requirement, 5 points were assigned to touristic and landscape water, 3 points were assigned to industrial water and agricultural irrigation water and 1 point was assigned to other water uses.
- (4)
- Water accessibility. This parameter refers to the ability to exchange water between a river system and external water systems. It indirectly reflects the discharge pathway of pollutants from human activities. Areas that are better able to exchange water with external masses of water often have a stronger pollutant-holding capacity and, therefore, have lower water sensitivity. Thus, 9 points were assigned to rivers that enter large lakes, 7 points were assigned to general watercourses, 5 points were assigned to rivers that enter the Beijing–Hangzhou Canal, 3 points were assigned to rivers that enter the Huaihe River and the Qiantang River and 1 point was assigned to rivers that enter the Yangtze River or the sea.
- (5)
- Freshwater channels. Freshwater channels are important routes for water diversion and transfer across basins. They have strict requirements for water quality and are more restricted due to the safety of water sources. Marks were assigned based on whether a freshwater channel passed through the evaluation unit. A total of 3 points were assigned to units with freshwater channels and 1 point was assigned to the other units.
4.2. Weight Determination and Regionalization Synthesis
Subjective and objective analyses were adopted to determine parameter weightings in this study. The subjective weight analysis was based on expert input according to an Analytic Hierarchy Process (AHP). The objective weight analysis adopted was an entropy method [38]. After the subjective and objective weights were determined, the coefficients of the subjective weight vector and objective weight vector were calculated using a multi-objective approach. The utilized equations were as follows:
where A and B refer to the coefficients of the subjective weight and objective weight, respectively, xij is the value of the i-th evaluation index in the j-th evaluation unit, is the index weight vector calculated by the entropy method and W″ is the index weight vector calculated by the AHP.
The weight vector calculated by the entropy method and the weight coefficient calculated by the AHP were then derived through standardization of the weighting coefficients of A and B. The utilized formulas were:
Finally, the combination weight vector of each index was calculated according to the formula . The outcome was the final weight value of each index in the evaluation of basin water sensitivity.
Based on the index evaluation and weight determination, a stratified merging method was adopted to perform weighted summation of each parallel and independent index. The water sensitivity of each small basin unit was then calculated by Equation (5):
where Ci refers to the water sensitivity index of the i-th small basin unit, Xij is the value of j-th index in the i-th unit and W is the weight of j-th index.
Based on the weight calculations, the regional evaluation indices of water sensitivity with different weights across four categories in the Taihu Basin were determined (Table 1). The weights for water resources, aquatic ecology, water environment and flood hazards and risks were 0.18, 0.32, 0.39 and 0.11, respectively. Water system density, water sources and conservation areas, geomorphological characteristics and flood hazards/risks had the highest weight in water resources, aquatic ecology, water environment and flood hazards, respectively. The spatial distribution maps for each regional water sensitivity evaluation index for the basin are displayed in Figure 3.
4.3. Calculation of the Spatial Expansion Intensity
The expansion of developed (urban) land is the most direct expression of spatial growth. The expansion intensity index of developed land is generally expressed as the percentage of the annual average expansion of an urban area in a spatial unit for a particular time at the beginning of such a period. It was calculated as follows:
where represents the developed land expansion index of the i-th basin unit in the year ∆t, the total area of developed (urban) land at the beginning of a period, the total area of construction at the end of a period and ∆t the year.
5. Results
5.1. Identification of Basin Water Sensitivity Index and Spatial Expansion Intensity
The Basin Water Sensitivity Index of the 128 small basin units in the Taihu Basin ranged between 0.11 and 0.83. The 128 basin units were classified into high, medium and low water sensitivity areas within this range of values using the “Natural Break” method, which is a spatial analysis module in ARCGIS for cluster analysis (Figure 4). The equation for calculating the development expansion intensity was used to determine the spatial expansion intensity of each small basin unit at different development stages (Table 3). By correlating between BWSI and spatial expansion intensity, the constraints that BWSI posed on spatial growth during different stages of economic development were determined.
5.2. Results from Regional Water Sensitivity Analysis
High water sensitivity areas (High BWSI). Regions with BWSIs ranging between 0.53 and 0.83 possess a low water environmental capacity but provide important ecological services. They were mainly located in the western and southern parts of the upper Taihu Basin and along rivers that enter Taihu Lake. Geomorphologically, they are prominent in areas of hilly and mountainous terrain. They provide important drinking water resources and possess conservation areas that provide essential ecological services. Thus, they require a high level of water quality. The influence of large-scale development on hydrological conditions and the water cycle in these areas is higher than in middle and downstream areas of the basin. In developed countries, effective river basin management uses these areas as national parks (public lands) or green belts, which prohibit development. In contrast to these basin management practices, there are villages in the upper parts of the Taihu Basin. From the perspective of Taihu Lake water quality protection, the amount of developed land should be strictly restricted in these areas. In addition, other types of non-urban construction should be limited within water source and conservation areas, clear water channel maintenance areas and the areas along the river channel. Moreover, restoration should include returning the area to more natural underlying surfaces and controlling the development of the basin to an acceptable level to maintain the water environment.
Medium water sensitivity areas (Medium BWSI). Areas possessing a BWSI between 0.32 and 0.52 were considered to have a medium water sensitivity. These areas were mainly located in the middle and northern part of the upper Taihu Basin and were geomorphologically characterized by hills and plains. These areas contain important ecological reserves and are drained by a few rivers that enter Taihu Lake. They possess higher water system density than High BWSIs and are more affected by flooding. They also have poor water accessibility. Despite their abundant water resources, the aquatic environment and potential for water-related disasters are quite low, resulting in their classification in the medium range of water sensitivity.
Low water sensitivity areas (Low BWSI). Low water sensitivity areas possessed a BWSI ranging between 0.11 and 0.3 and were mainly distributed in the lower reaches of the Taihu Basin and in areas along the Yangtze River. Both regions are primarily composed of plains. They are less affected by flooding and typhoon risks than the other water sensitivity categories. With direct access to the Yangtze River and the Qiantang River, they boast high water accessibility. The water resources in these areas are highly abundant and are mostly used by industries and for agricultural irrigation. They have lower requirements for aquatic environmental and water quality and, thus, have lower water sensitivity.
5.3. Results from the Analysis of Spatial Expansion
Overall, the intensity of expansion in urban development is influenced by both the original size of the developed land and its scale of expansion, which leads to different patterns and expansion intensities. Municipalities have lower expansion or construction intensity because the area of development is spread over a larger area. By contrast, the expansion rate in counties is higher. Between 1985 and 1995, rapidly expanding areas were largely concentrated in southern Jiangsu along the Yangtze River in the northern part of the Taihu Basin. Expansion was especially prevalent in Changshu, Taicang, Wujin, Danyang and Xishan. Between 1995 and 2007, rapid construction primarily occurred in the suburbs of Shanghai, the surrounding areas of Suzhou, Wuxi and Changzhou, northwest Hangzhou and Lin’an. The areal exploitation intensity in the upper reaches of the Taihu Basin was higher than the during the previous stage (1985–1995). Between 2007 and 2017, the developmental expansion intensity increased significantly, but the expansion areas were more dispersed, which indicates a flattening trend. However, the expansion intensity in the upper reaches of the Taihu Basin was lower than other regions (Figure 5).
5.4. Correlation Analysis of Spatial Expansion and Water Sensitivity
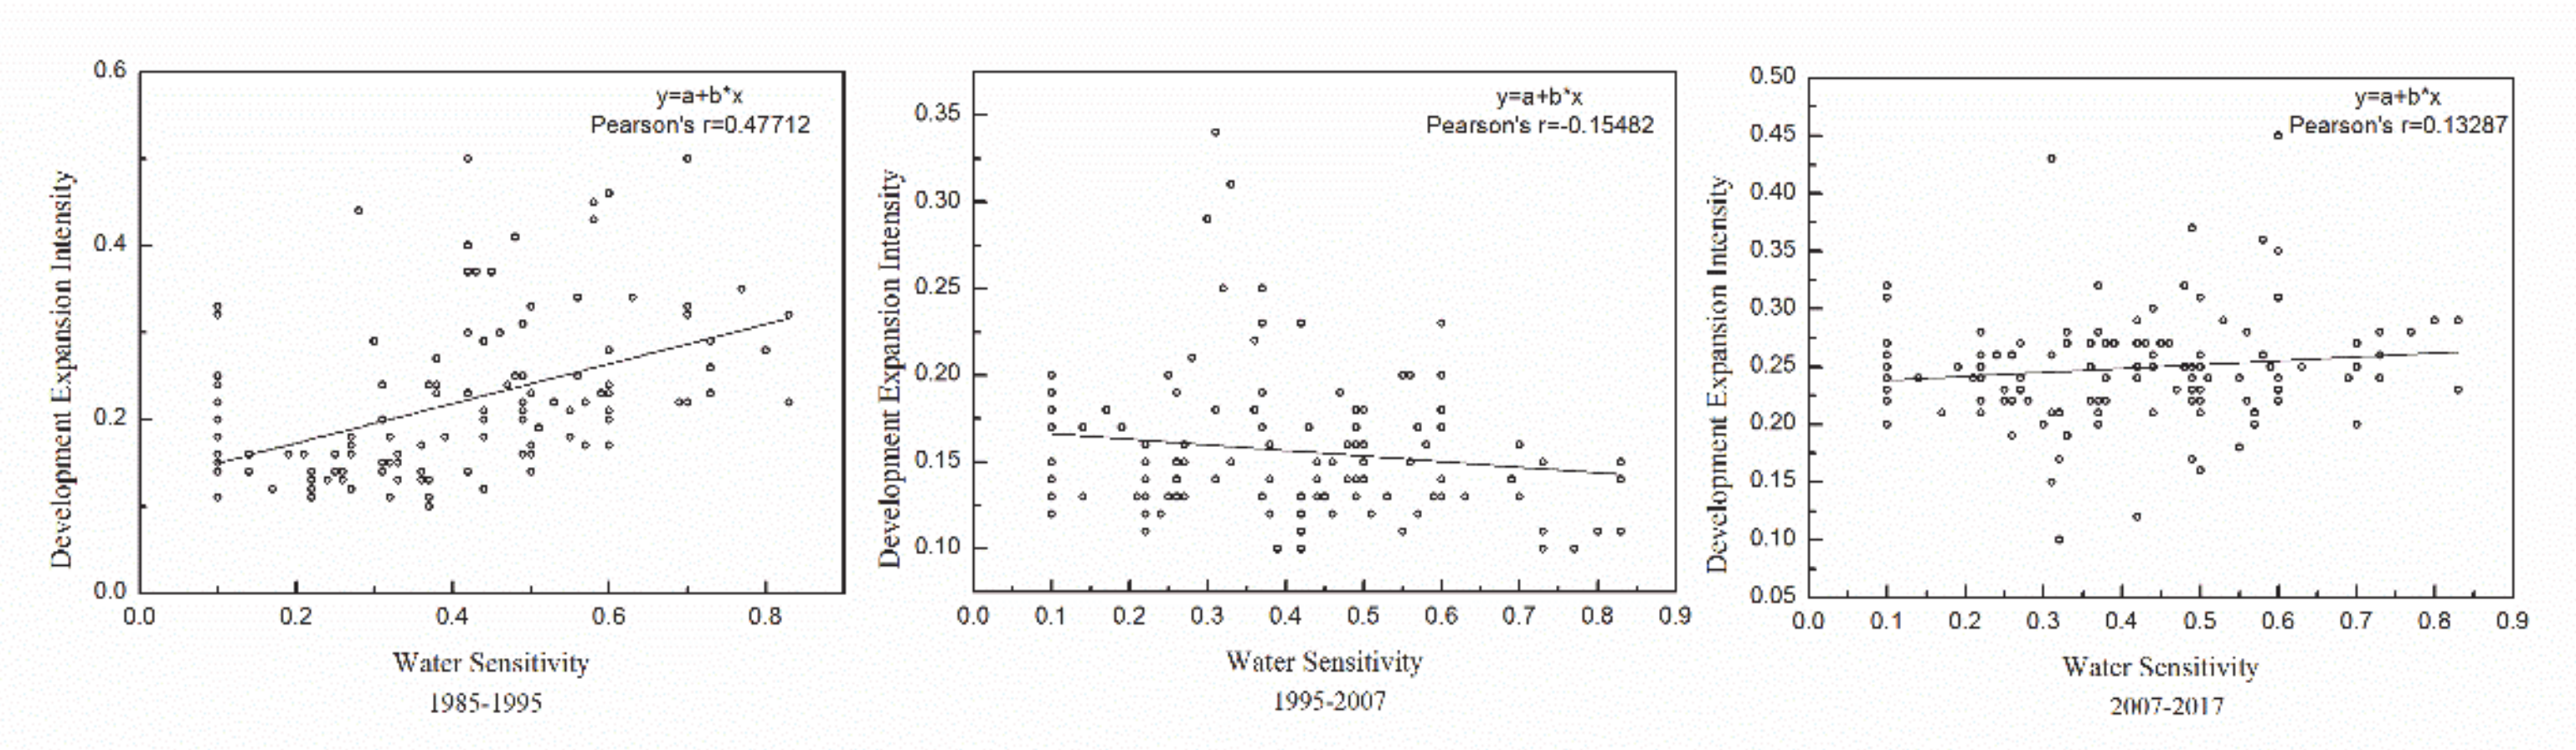
In order to further analyze the relationship between spatial expansion and water sensitivity in the Taihu Basin, the numerical descriptors of spatial expansion intensity and the BWSI were standardized. Standardization was conducted because there was a unit difference between the two data types, and the dimensional relationship between the variables could be eliminated by standardization, making the data comparable. These mapped, standardized data range between 0 and 1. A correlation analysis was conducted. The results of the correlation are described below:
- (1)
- For the period of 1985–1995, the developmental expansion intensity of all areas was above 0.1, while the BWSIs for areas with a relatively higher expansion index were mostly between 0.4 and 0.7. Areas with a higher BWSI had a higher developmental expansion intensity. Little correlation exists between spatial growth and water sensitivity. This lack of correlation may be related to the fact that rural surplus labor is used by most local cities and counties in the Taihu Basin for vigorous industrial development, resulting in rapid industrialization and urbanization in rural areas. However, due to the lack of comprehensive planning, the developed areas were fragmented. In addition, little attention was paid to the impact of development on water sensitivity.
- (2)
- During the period of 1995–2007, the expansion intensity index trended downward, whereas BWSIs increased. Areas with higher developmental expansion intensity generally had a lower BWSI. Most BWSIs were between 0.2 and 0.6, which is lower than during the previously described period (1985–1995). The correlation between spatial growth and water sensitivity increased. During this period, the Taihu Basin seized the strategic opportunity for international manufacturing and the development of Shanghai Pudong led to a vigorous open economy that resulted in construction of many developed zones. The expansion of developed land was mainly around Shanghai Pudong, which contrasted with decentralized rural development, the latter of which had a smaller impact on aquatic ecology and the water environment.
- (3)
- Between 2007–2017, the developmental expansion intensity increased significantly due to rapid urbanization and industrialization. The expansion intensity indices all increased to 0.2 and above, but the correlation between expansion intensity and water sensitivity remained consistent with the values observed from the period 1995–2007. The BWSI of areas with large expansion potential for construction was mainly concentrated between 0.2 and 0.5, indicating that the intrinsic restriction of water sensitivity on spatial expansion was increasing (Figure 6).
6. Discussion
Basin management must address two often conflicting interests: maintaining ecological service and allowance for economic and social development. Therefore, management needs to clarify the spatial divisions that are required for environmental protection and development. During the stage of rapid industrialization and urbanization, the local conditions, urbanization level, per capita GDP and inertia of development growth are key factors affecting the allocation of developed land. In recent years, with the development of sustainable environments, the macro-scale elements of the ecological environment have been included in studies of land resource allocation. Nonetheless, such management approaches remain insufficient. This is especially true for basin units where water is the most critical ecological factor controlling production and life but its impacts and constraints on the allocation of land development and spatial management are poorly considered.
This paper put forth the concept of a multi-parameter Basin Water Sensitivity Index, which has not been used previously in China. The approach proposed the development of a regional evaluation system to assess basin water sensitivity using information on water resources, aquatic ecology, the water (aquatic) environment and water-related disasters (flood hazards) from the perspective of integrated basin management. The Taihu Basin was used as an example of how to conduct the proposed regional evaluation of water sensitivity for small basin units. The analysis led to delineation of water sensitivity differences in the Taihu Basin, along with the identification of the controls on water sensitivity. The obtained BWSI data were then combined with land use data for the typical years of 1985, 1995, 2007 and 2017 to study the correlation between the expansion of developed land and water sensitivity in the Taihu Basin during the past 30 years. The data suggest that water sensitivity in the Taihu Basin was quite high, especially in hilly and mountainous terrains located in headwater areas and along rivers that enter Taihu Lake. Water sensitivity has not been taken directly and comprehensively into account in urban planning in the past. However, our analysis has shown that the reaction of water sensitivity to spatial growth was an internal restriction and key constraint on spatial growth. Therefore, during future development, the differences in water sensitivity between the upper, middle and lower reaches of the basin should be fully considered and the construction land index and layout adjustment policy should be reasonably arranged to improve the coordination between development, land utilization and water resources protection.
7. Conclusions
This study analyzed and identified the water sensitivity of different regions in the Taihu Basin and evaluated the correlation between regional water sensitivity and the expansion intensity for developed land. The results suggest that areas of high-water sensitivity within the upper southwestern reaches of the basin should be strictly controlled during urban expansion. Management policies should also limit irrelevant land development in areas of water resources conservation, freshwater channel maintenance and along rivers that enter Taihu Lake. Management should also work towards restoring land cover to a more natural underlying surface in order to keep the development intensity within the carrying capacity of the aquatic environment. Urban areas located in medium water sensitivity areas along Taihu Lake, including Suzhou, Wuxi and Changzhou, should promote a reduction in development and invigorate and prioritize the use of existing developed land, especially within 1 km of the shoreline of Taihu Lake and, to a lesser degree, within the 5 km buffer zone around the lake. Water sensitivity should be taken as the basis for strictly delineating the boundary of urban development and the red line of ecological protection in these areas. Most areas in the lower reaches of the Taihu Basin, especially those along the Yangtze and Qiantang Rivers, have lower water sensitivity and have potential for spatial growth. They can appropriately expand the scale of developed land and guide the concentration of developed space. In addition, they should pay attention to the coordination of land use and water sensitivity and avoid any spatial development method that will change the water system pattern.
This study results from the need to evaluate and limit urban water sensitivity and extends the perspective of water sensitivity research to the basin scale. The regional evaluation results of water sensitivity that were obtained were based on the hypothesis of closed empirical regions. Thus, due to the fluidity of water resources and the limited scale of the basin, the method of evaluating water sensitivity over larger scale basins needs to be further explored. Nonetheless, this paper analyzed the statistical correlation between the Basin Water Sensitivity Index and the expansion intensity of developed land and showed that the relationship is not linear because spatial growth is influenced by factors such as national and regional development policies, local economic and social development demands and other resource conditions. A quantitative analysis of the interaction between spatial growth and water sensitivity and its impacts on the environment (including water resources) has yet to be undertaken. In addition, approaches in which water is considered as a major element that connects regional landscapes and functions of urban, peri-urban and rural areas as an environmental resource that is implicated in spatial planning need to be developed. There is no question, however, that it should be taken into full account in various planning programs such as protection development, urban-rural development and lake basin planning. On this basis, future research should explore a two-way model of natural resources management and spatial planning system reconstruction.
Author Contributions
Conceptualization, W.S. and Y.W.; methodology, W.S.; software, W.S.; validation, W.S., C.-G.L. and B.H.; formal analysis, W.C.; investigation, C.-G.L.; resources, B.H.; data curation, C.-G.L.; writing—original draft preparation, W.S.; writing—review and editing, Y.W.; visualization, B.H.; supervision, W.C.; project administration, C.-G.L.; funding acquisition, W.S. All authors have read and agreed to the published version of the manuscript.
Funding
This research was funded by the National Natural Science Foundation of China (41871119), the Strategic Priority Research Program of the Chinese Academy of Sciences (XDA23020102), the Thousand Talent Program for Young Outstanding Scientists of China (Y771071001), and the GDAS Special Project of Science and Technology Development (2020GDASYL-20200102013, 2020GDASYL-20200301003), Guangdong Foundation for Program of Science and Technology Research (2019QN01L682, 2019B121201004) and the National Natural Science Foundation of China (NSFC: 41930865).
Acknowledgments
We thank LetPub (www.letpub.com) for its linguistic assistance during the preparation of this manuscript.
Conflicts of Interest
The authors declare no conflict of interest.
References
- Beck, A.J.; Sanudo-Wilhelmy, S.A. Impact of water temperature and dissolved oxygen on copper cycling in an urban estuary. Environ. Sci. Technol. 2007, 41, 6103–6108. [Google Scholar] [CrossRef]
- Lee, J.; Pak, G.; Yoo, C.; Kim, S.; Yoon, J. Effects of land use change and water reuse options on urban water cycle. J. Environ. Sci. 2010, 22, 923–928. [Google Scholar] [CrossRef]
- Sharma, S.; Bharat, A.; Das, V.M. Statistical Change Detection in Water Cycle over Two Decades and Assessment of Impact of Urbanization on Surface and Sub-Surface Water Flows. Open J. Modern Hydrol. 2013, 3, 165–171. [Google Scholar] [CrossRef] [Green Version]
- Pal, A.; He, Y.; Jekel, M.; Reinhard, M.; Gin, K.Y.H. Emerging contaminants of public health significance as water quality indicator compounds in the urban water cycle. Environ. Int. 2014, 71, 46–62. [Google Scholar] [CrossRef] [PubMed]
- Duan, W.L.; He, B.; Nover, D.; Yang, G.S.; Chen, W.; Meng, H.F.; Zou, S.; Liu, C.M. Water quality assessment and pollution source identification of the eastern poyang lake basin using multivariate statistical methods. Sustainability 2016, 8, 133. [Google Scholar] [CrossRef] [Green Version]
- Hatt, B.E.; Deletic, A.; Fletcher, T.D. Stormwater reuse: Designing biofiltration systems for reliable treatment. Water Sci. Technol. 2007, 55, 201–209. [Google Scholar] [CrossRef] [PubMed]
- Wong, T.H.F. An overview of water sensitive urban design practices in Australia. Water Pr. Technol. 2006, 1, 1–8. [Google Scholar]
- Ashley, R.; Lundy, L.; Ward, S.; Shaffer, P.; Walker, L.; Morgan, C.; Saul, A.; Wong, T.; Moore, S. Water-sensitive urban design: Opportunities for the UK. Proc. Inst. Civ. Eng. Munic. Eng. 2013, 166, 65–76. [Google Scholar] [CrossRef]
- Yang, G.S. Introduction to Integrated River Basin Management; Science Press: Beijing, China, 2004. [Google Scholar]
- Chen, W. Research and preliminary practical exploration of land use zoning and spatial governance of river basin: A case study of Taihu Basin. Hupo Kexue 2012, 24, 1–8. [Google Scholar]
- Sun, W. Regionalization of spatial development suitability and evaluation of spatial unbalance in Taihu Basin. Hupo Kexue 2012, 24, 9–16. [Google Scholar]
- Wang, Y.J.; Lv, H.J.; Shi, Y.F.; Tong, J. Impacts of land use changes on hydrological processes in an urbanized basin: A case study in the Qinhuai river basin. J. Nat. Resour. 2009, 24, 30–36. [Google Scholar]
- Sun, W.; Chen, W.; Chen, C. Study on cooperative constraint regionalization of water environment and the guidance for industrial distribution:A case study of Jiangsu province. Acta Geograph. Sin. 2010, 65, 819–827. [Google Scholar]
- Duan, W.L.; He, B.; Chen, Y.N.; Zou, S.; Wang, Y.; Nover, D.; Chen, W.; Yang, G.S. Identification of long-term trends and seasonality in high-frequency water quality data from the Yangtze River basin, China. PLoS ONE 2018, 13, e0188889. [Google Scholar] [CrossRef] [PubMed]
- Wang, Y.; Gao, J.F.; Liu, Z.W.; Zhang, Z.M. Pollution Load and Environment Capacity in Tonghu Lake Basin. Wetland Sci. 2016, 14, 354–360. [Google Scholar]
- Cabral-Pinto, M.M.S.; Inácio, M.; Neves, O.; Almeida, A.A.; Pinto, E.; Oliveiros, B.; Eduardo, F.D.S. Human health risk assessment due to agricultural activities and crop consumption in the surroundings of an industrial area. Exposure Health 2020, 12, 629–640. [Google Scholar] [CrossRef]
- Cabral-Pinto, M.M.S.; Eduardo, F.D.S. Heavy Metals of Santiago Island (Cape Verde) alluvial deposits: Baseline value maps and human health risk assessment. Int. J. Environ. Res. Public Health 2019, 16, 2. [Google Scholar] [CrossRef] [Green Version]
- Duan, W.L.; He, B.; Nover, D.; Fan, J.L.; Yang, G.S.; Chen, W.; Meng, H.F.; Liu, C.M. Floods and associated socioeconomic damages in China over the last century. Nat. Hazards 2016, 82, 401–413. [Google Scholar] [CrossRef]
- Whelans, C.; Maunsell, H.G.; Thompson, P. Planning and Management Guidelines for Water Sensitive Urban (Residential) Design; Department of Planning and Urban Development of Western Australia: Perth, WA, Australia, 1994.
- Liu, S.; Li, C.H. Transition Process of Water Sensitive Urban Design (WSUD) in Australia and Its Enlightenment; Landscape Architecture: New York, NY, USA, 2016; pp. 104–111. [Google Scholar]
- Yang, Q.; Zhan, Q.; Song, W. Water Sensitive Urban Planning in Controlled Detailed Planning; Urban Planning Society of China: Shenyang, China, 2015. [Google Scholar]
- Rural, M.; Council, C. Water sensitive urban design guidelines. Gold Coast 2005, 14, 1391–1400. [Google Scholar]
- He, P.G.; Zhang, C. Rainwater Management Practice Based on Water Sensitivity Urban Design and Its Enlightenment: A Case Study of Melbourne; Urban Planning Society of China: Shenyang, China, 2016. [Google Scholar]
- Lloyd, S.D.; Wong, T.H.F.; Chesterfield, C.J. Water Sensitive Urban Design: A Stormwater Management Perspective; Higher Education Research Data Collection: Brisbane, QLD, Australia, 2002; pp. 1–38. [Google Scholar]
- Wong, T.H.F. Water sensitive urban design—The journey thus far. Aust. J. Water Resour. 2006, 10, 213–222. [Google Scholar] [CrossRef]
- Lin, C.; Ma, R.H.; He, B. Identifying watershed regions sensitive to soil erosion and contributing to lake eutrophication—A case study in the Taihu lake basin (China). Int. J. Environ. Res. Public Health 2016, 13, 77. [Google Scholar] [CrossRef] [Green Version]
- Wang, P.; Gill, L.; Liu, B.Y. Water sensitive urban design and its applications in landscape projects. Chin. Landsc. Arch. 2010, 37, 88–91. [Google Scholar]
- Ye, L.; Cai, Q.H.; Liu, R.Q.; Cao, M. The influence of topography and land use on water quality of Xiangxi River in Three Gorges Reservoir region. Environ. Geol. 2009, 58, 937–942. [Google Scholar] [CrossRef]
- Gao, Y. A Research on the Application of Water Sensitive Urban Design in China. Master’s Thesis, Harbin Institute of Technology, Harbin, China, 2012. [Google Scholar]
- Gong, Q.Y.; Liu, W.; Li, J.Z. Tidal and Storm Responsive Urban Design with Numerical Simulation. J. Tianjin Univ. 2008, 41, 461–466. [Google Scholar]
- Wang, S.S.; Zhang, D.M. Water sensitive urban design in Australia and its enlightenment. China Water Wastewater 2010, 26, 64–68. [Google Scholar]
- He, B.; Oki, K.; Wang, Y.; Oki, T.; Yamashiki, Y.; Takara, K.; Miura, S.; Imai, A.; Komatsu, K.; Kawasaki, N. Analysis of stream water quality and estimation of nutrient load with the aid of Quick Bird remote sensing imagery. Hydrol. Sci. J. 2012, 57, 850–860. [Google Scholar] [CrossRef]
- Peng, J.; Zhao, H.J.; Liu, Y.X.; Du, Y.Y. Progress and conceptual framework of regional water security pattern construction. Acta Ecol. Sin. 2016, 36, 3137–3145. [Google Scholar]
- Bao, C.; He, D.M. Spatiotemporal characteristics of water resources exploitation and policy implications in the Beijing-Tianjin-Hebei Urban Agglomeration. Progress Geogr. 2017, 36, 58–67. [Google Scholar]
- Zhang, Y.; Gao, X.; Lin, J.N.; Jia, X.B.; Zhang, N.; Cheng, J.B.; Meng, W. Research on evaluation methods for riverine aquatic ecological security. Res. Environ. Sci. 2016, 29, 1393–1399. [Google Scholar]
- Wang, Y.; He, B.; Duan, W.L.; Li, W.H.; Luo, P.P.; Razafindrabe, B.H.N. Source apportionment of annual water pollution loads in river basins by remote-sensed land cover classification. Water 2016, 8, 361. [Google Scholar] [CrossRef] [Green Version]
- Zhang, C.S.; Xie, G.D.; Lu, C.X. Research on scarcity degree of chinese water environment capacity and its interactions with regional function. Resour. Sci. 2009, 31, 559–565. [Google Scholar]
- Sun, W. Spatial Function Division Theory, Method and Application Practice; Science Press: Beijing, China, 2013. [Google Scholar]
- Yin, Z.E.; Yin, J.; Xu, S.Y.; Wen, J.H. Community-based scenario modelling and disaster risk assessment of urban rainstorm waterlogging. J. Geogr. Sci. 2011, 21, 274–284. [Google Scholar] [CrossRef]
- The Health Status Report of Taihu Lake. 2017. Available online: http://www.tba.gov.cn/contents/45/14731.html (accessed on 10 August 2019).
Figure 1.
Research flow chart for this study.
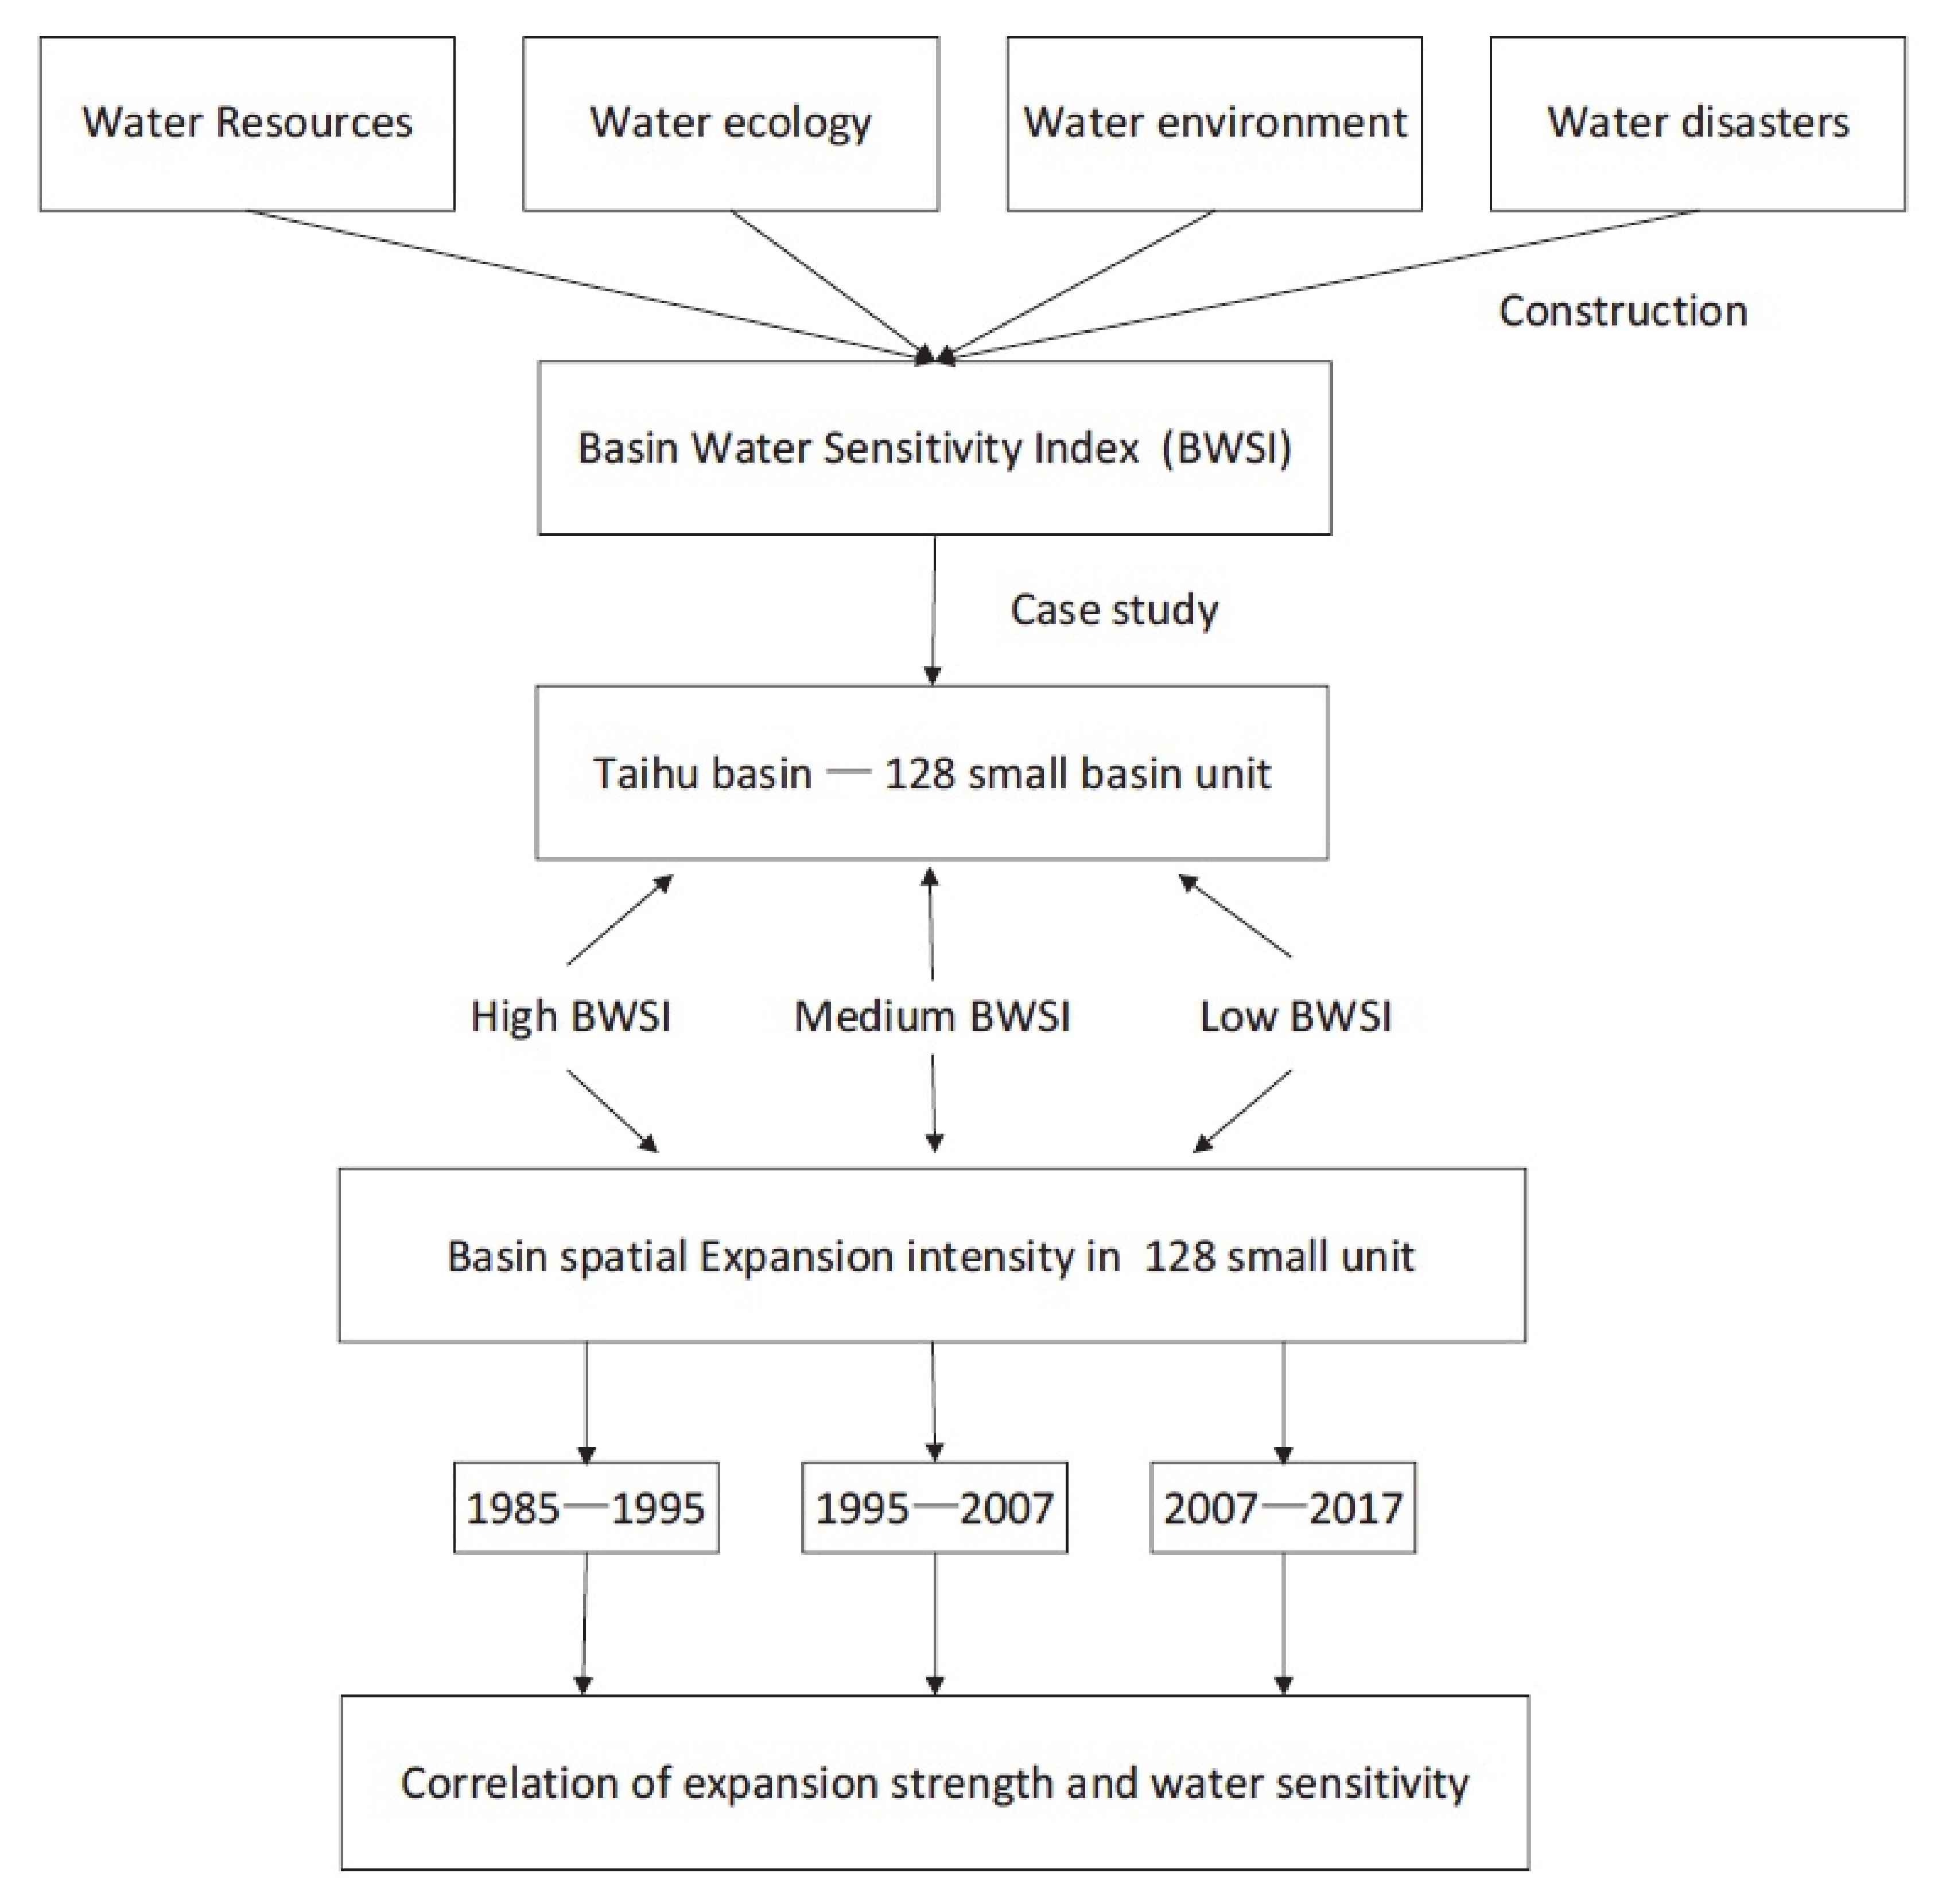
Figure 2.
Changes of construction land in Taihu Lake Basin from 1985 to 2017.
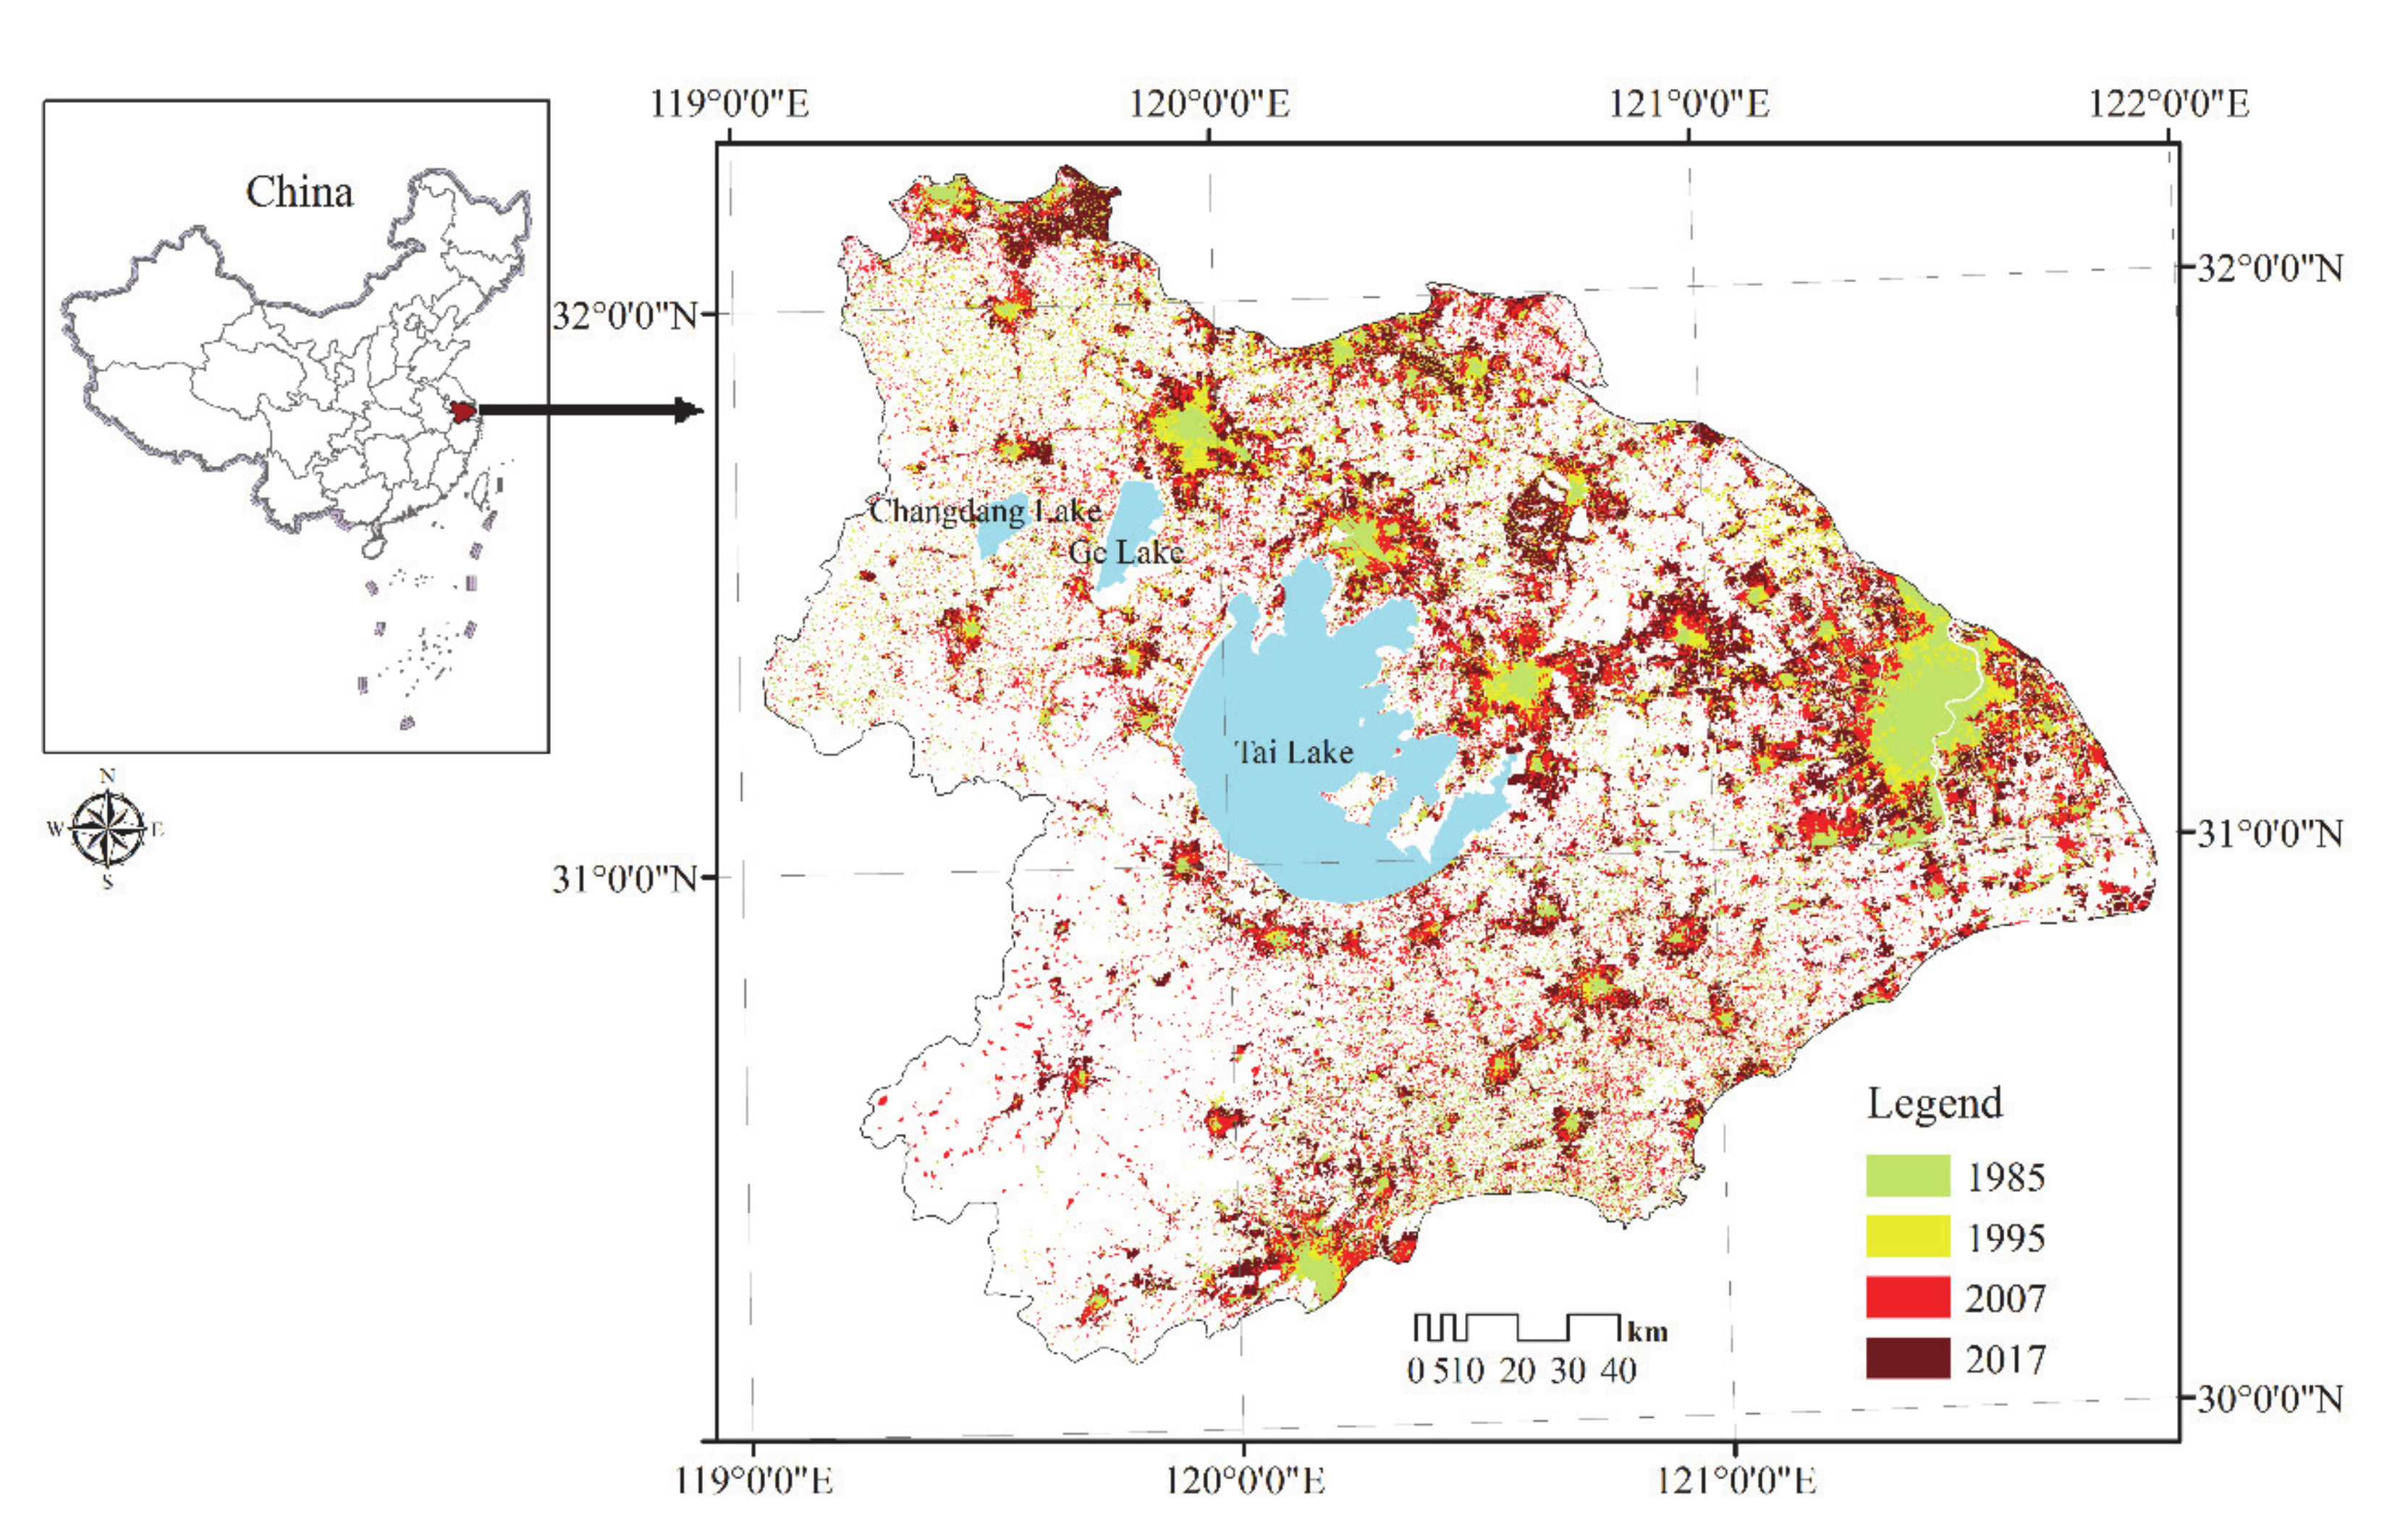
Figure 3.
Regionalization evaluation indices of water sensitivity in the Taihu Basin: (a) water system density; (b) relative abundance of water resources; (c) importance of water ecology; (d) geomorphological characteristics; (e) water quality objectives; (f) use functions; (g) accessibility; (h) freshwater channels; (i) flood risk; (j) typhoon risk;.
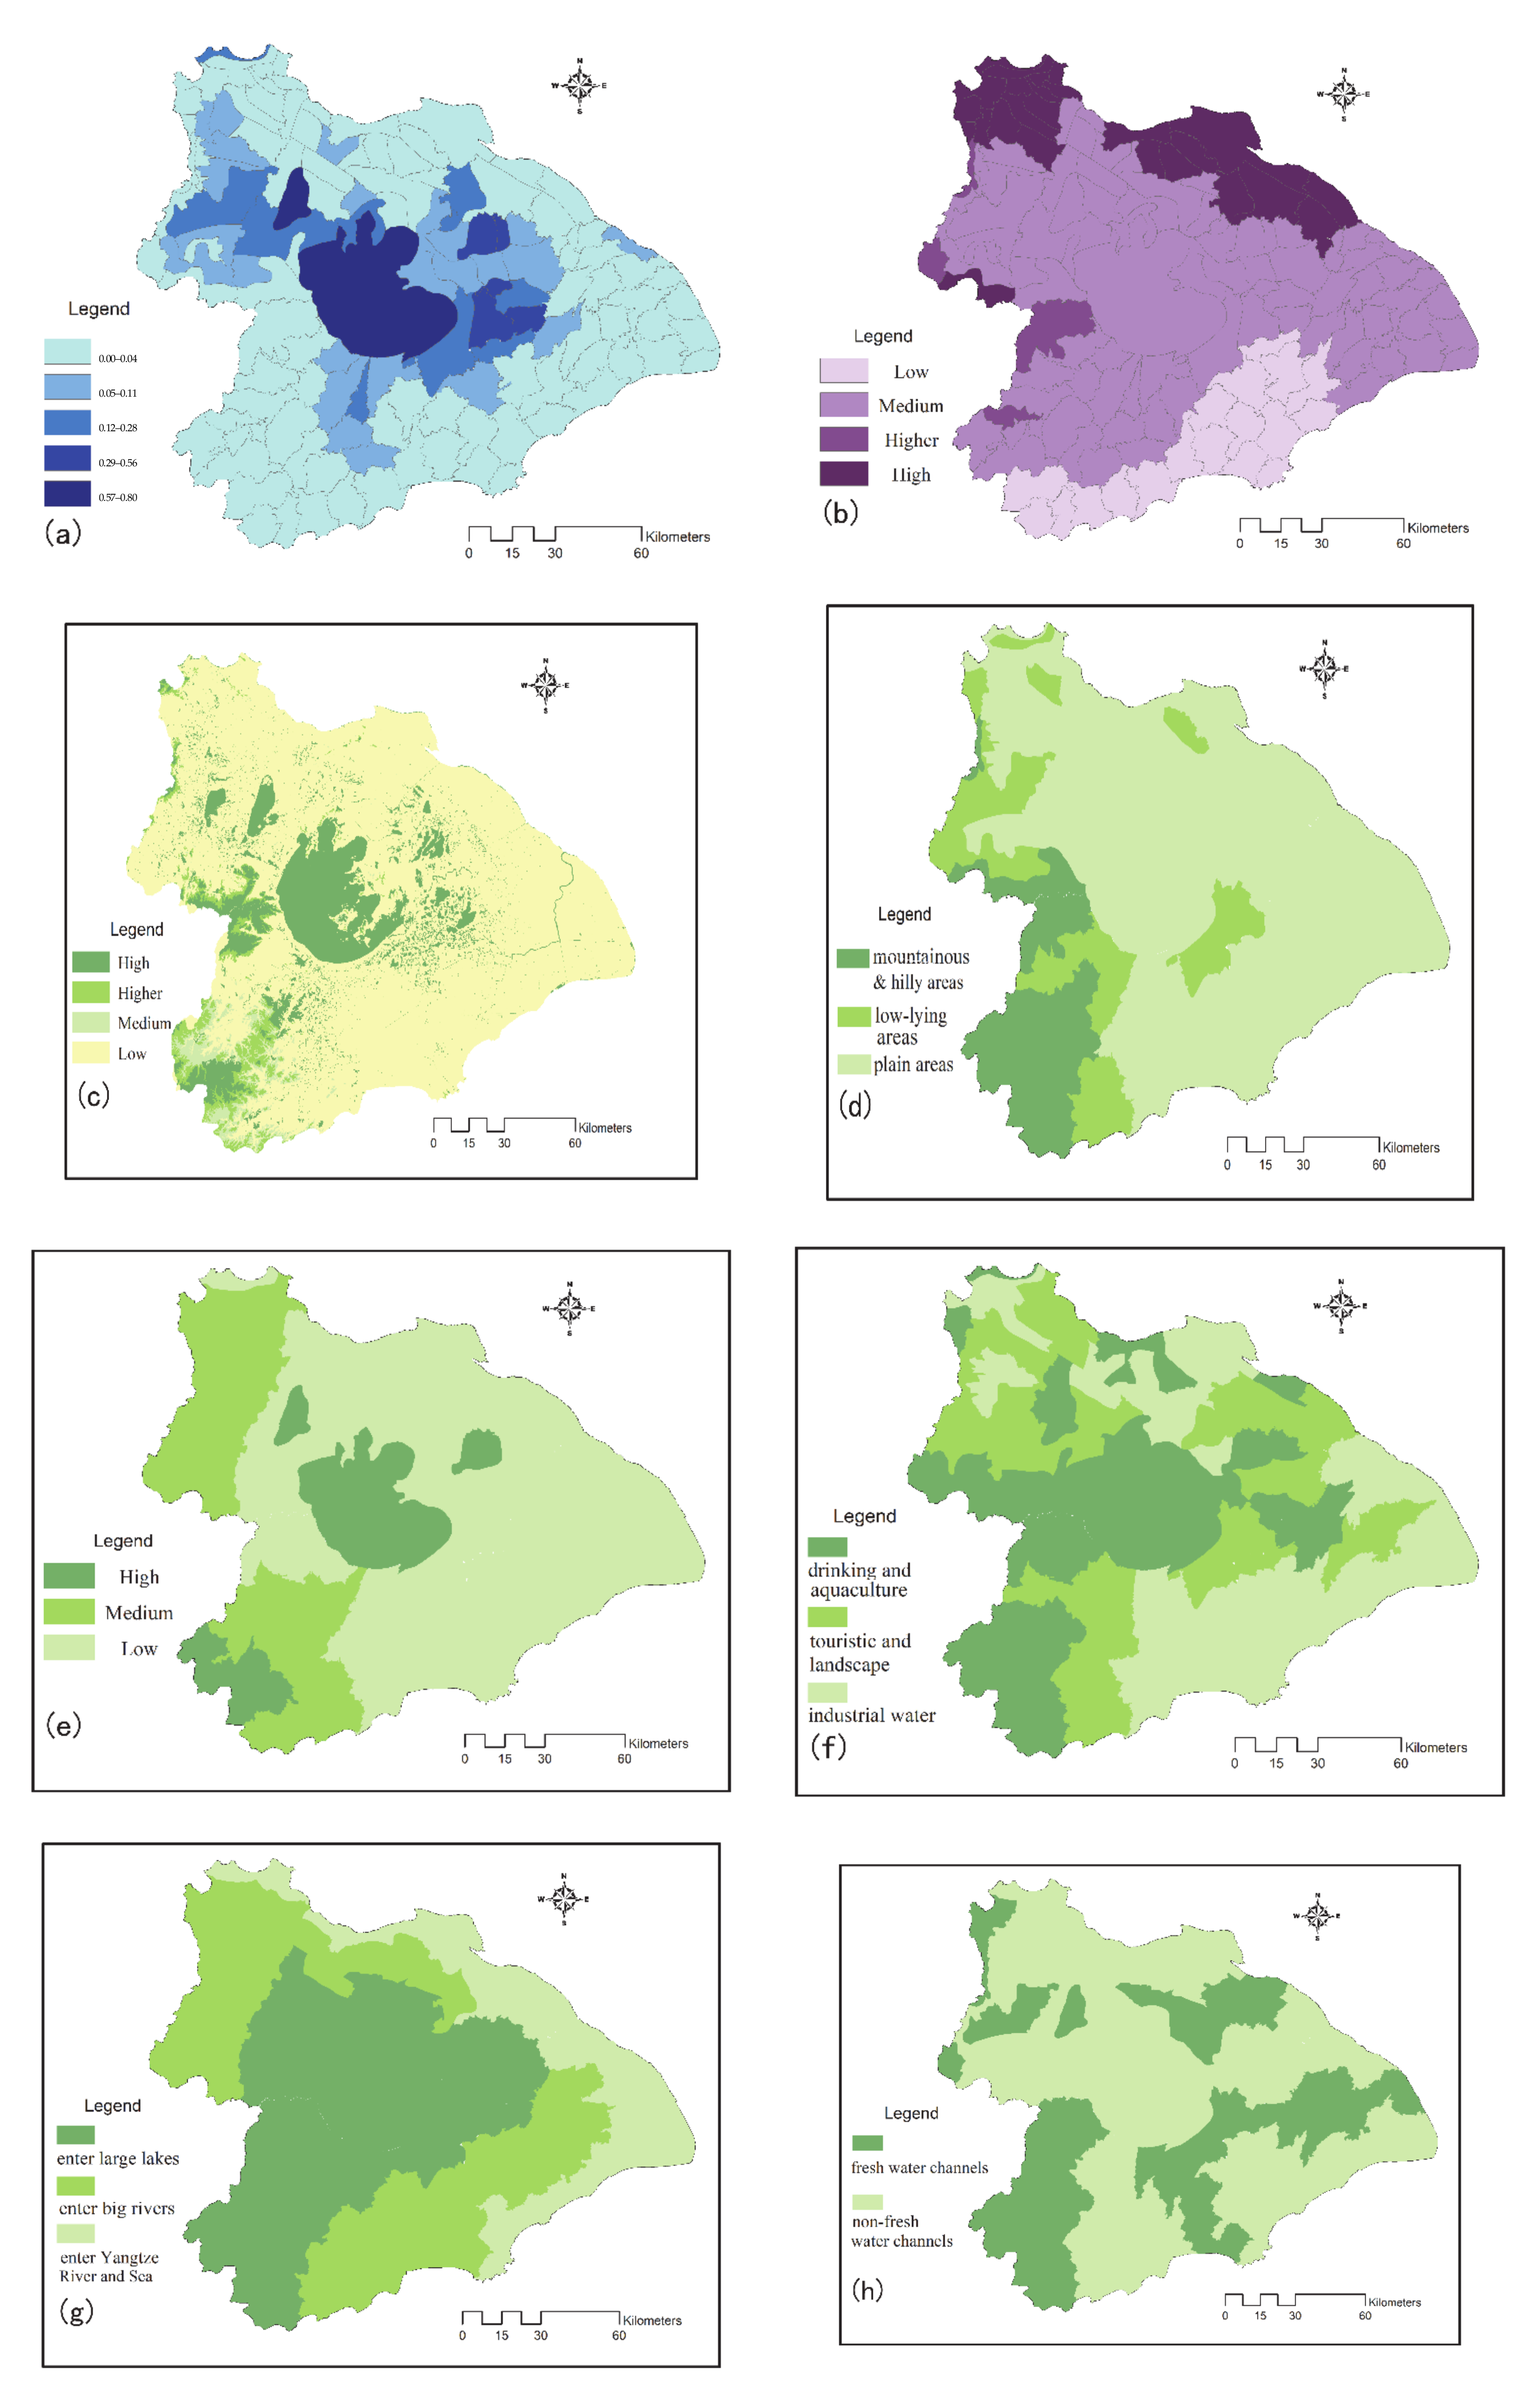
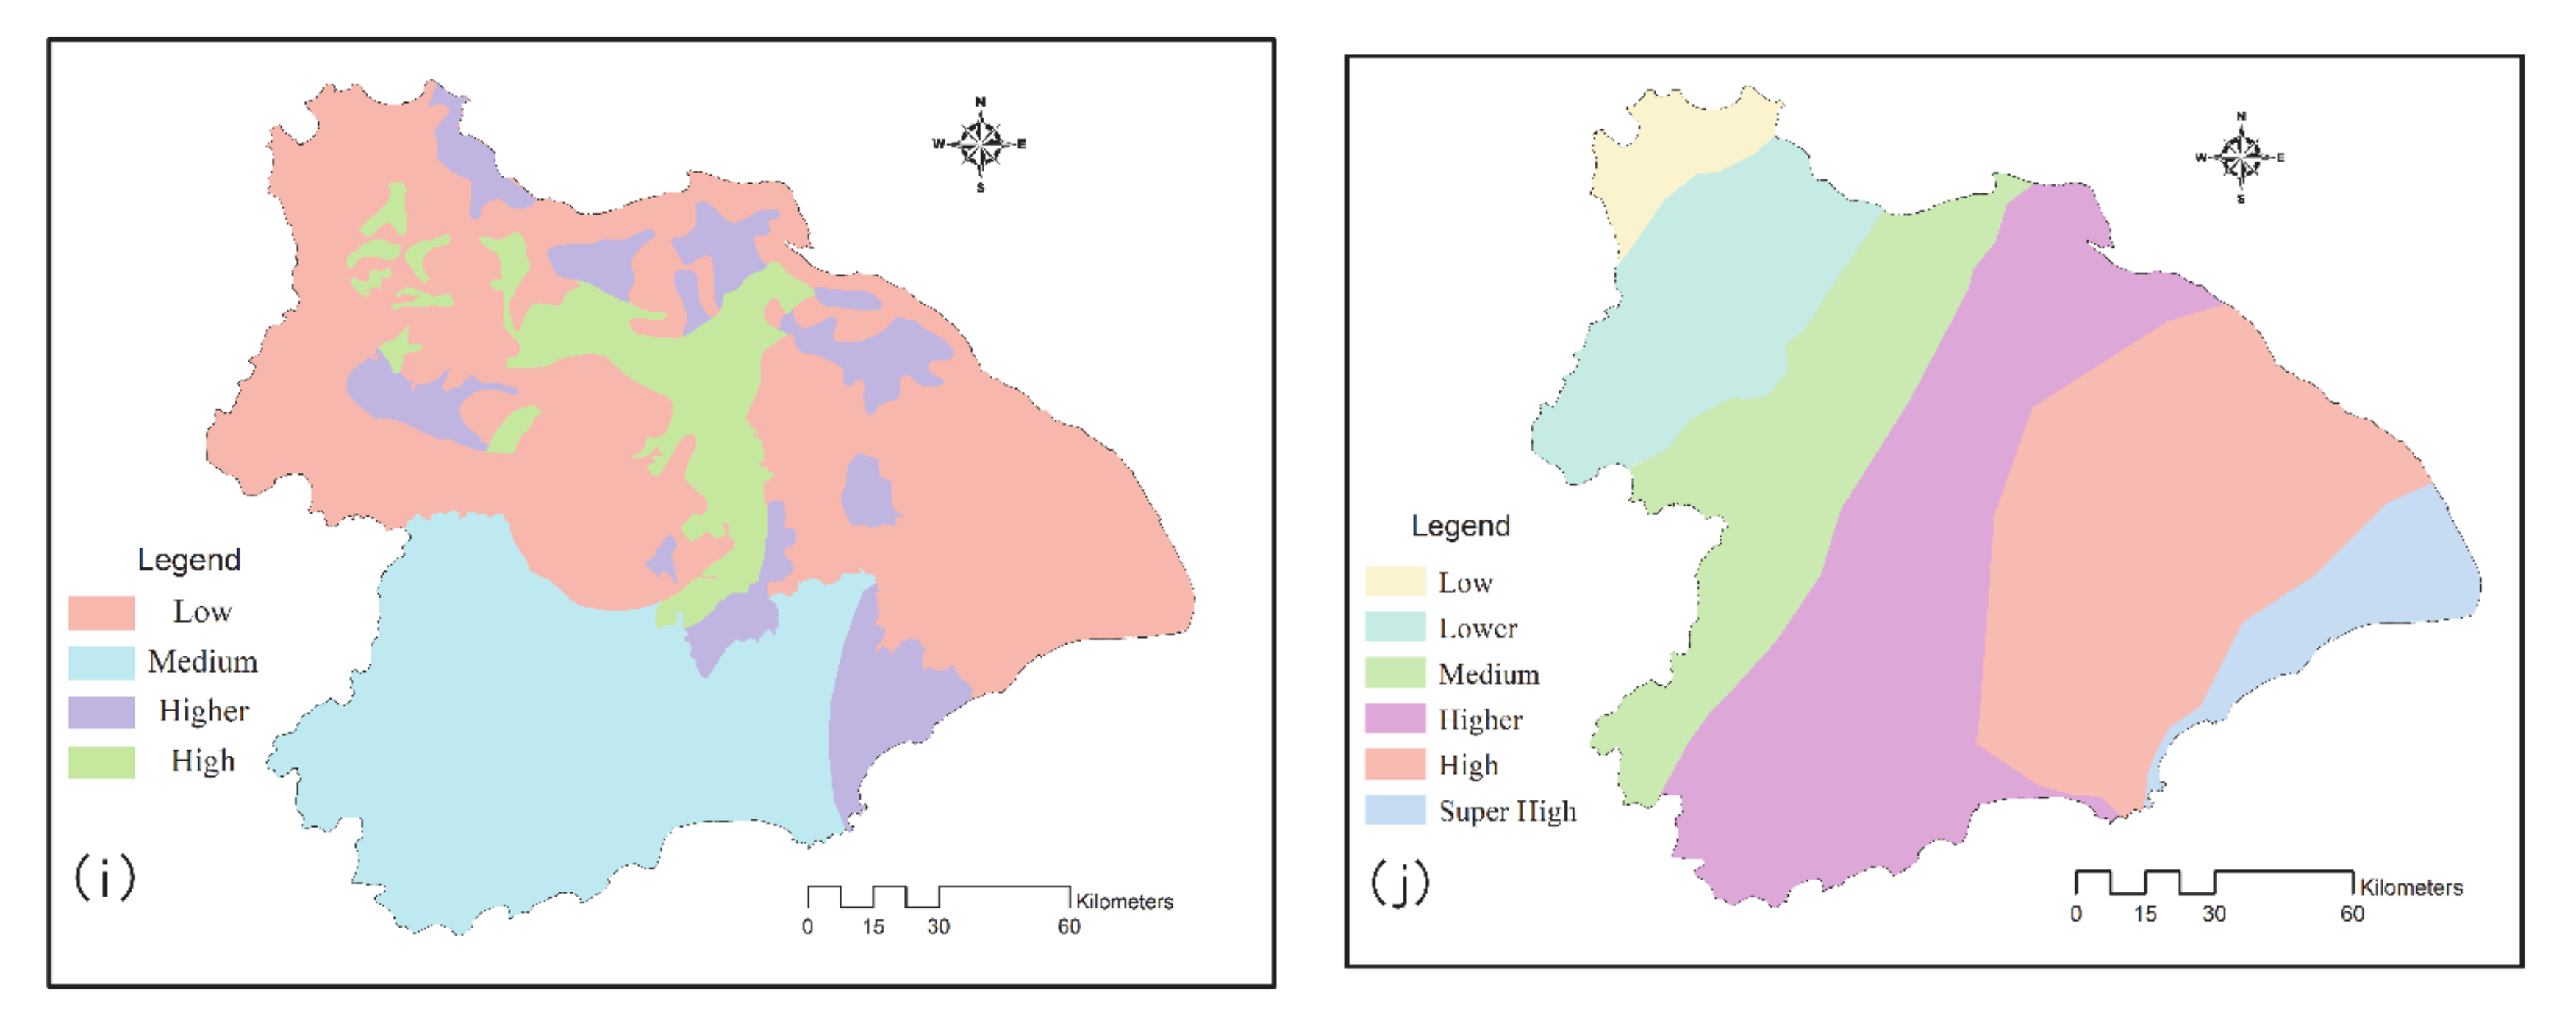
Figure 4.
Water sensitivity regionalization of Taihu Lake Basin.
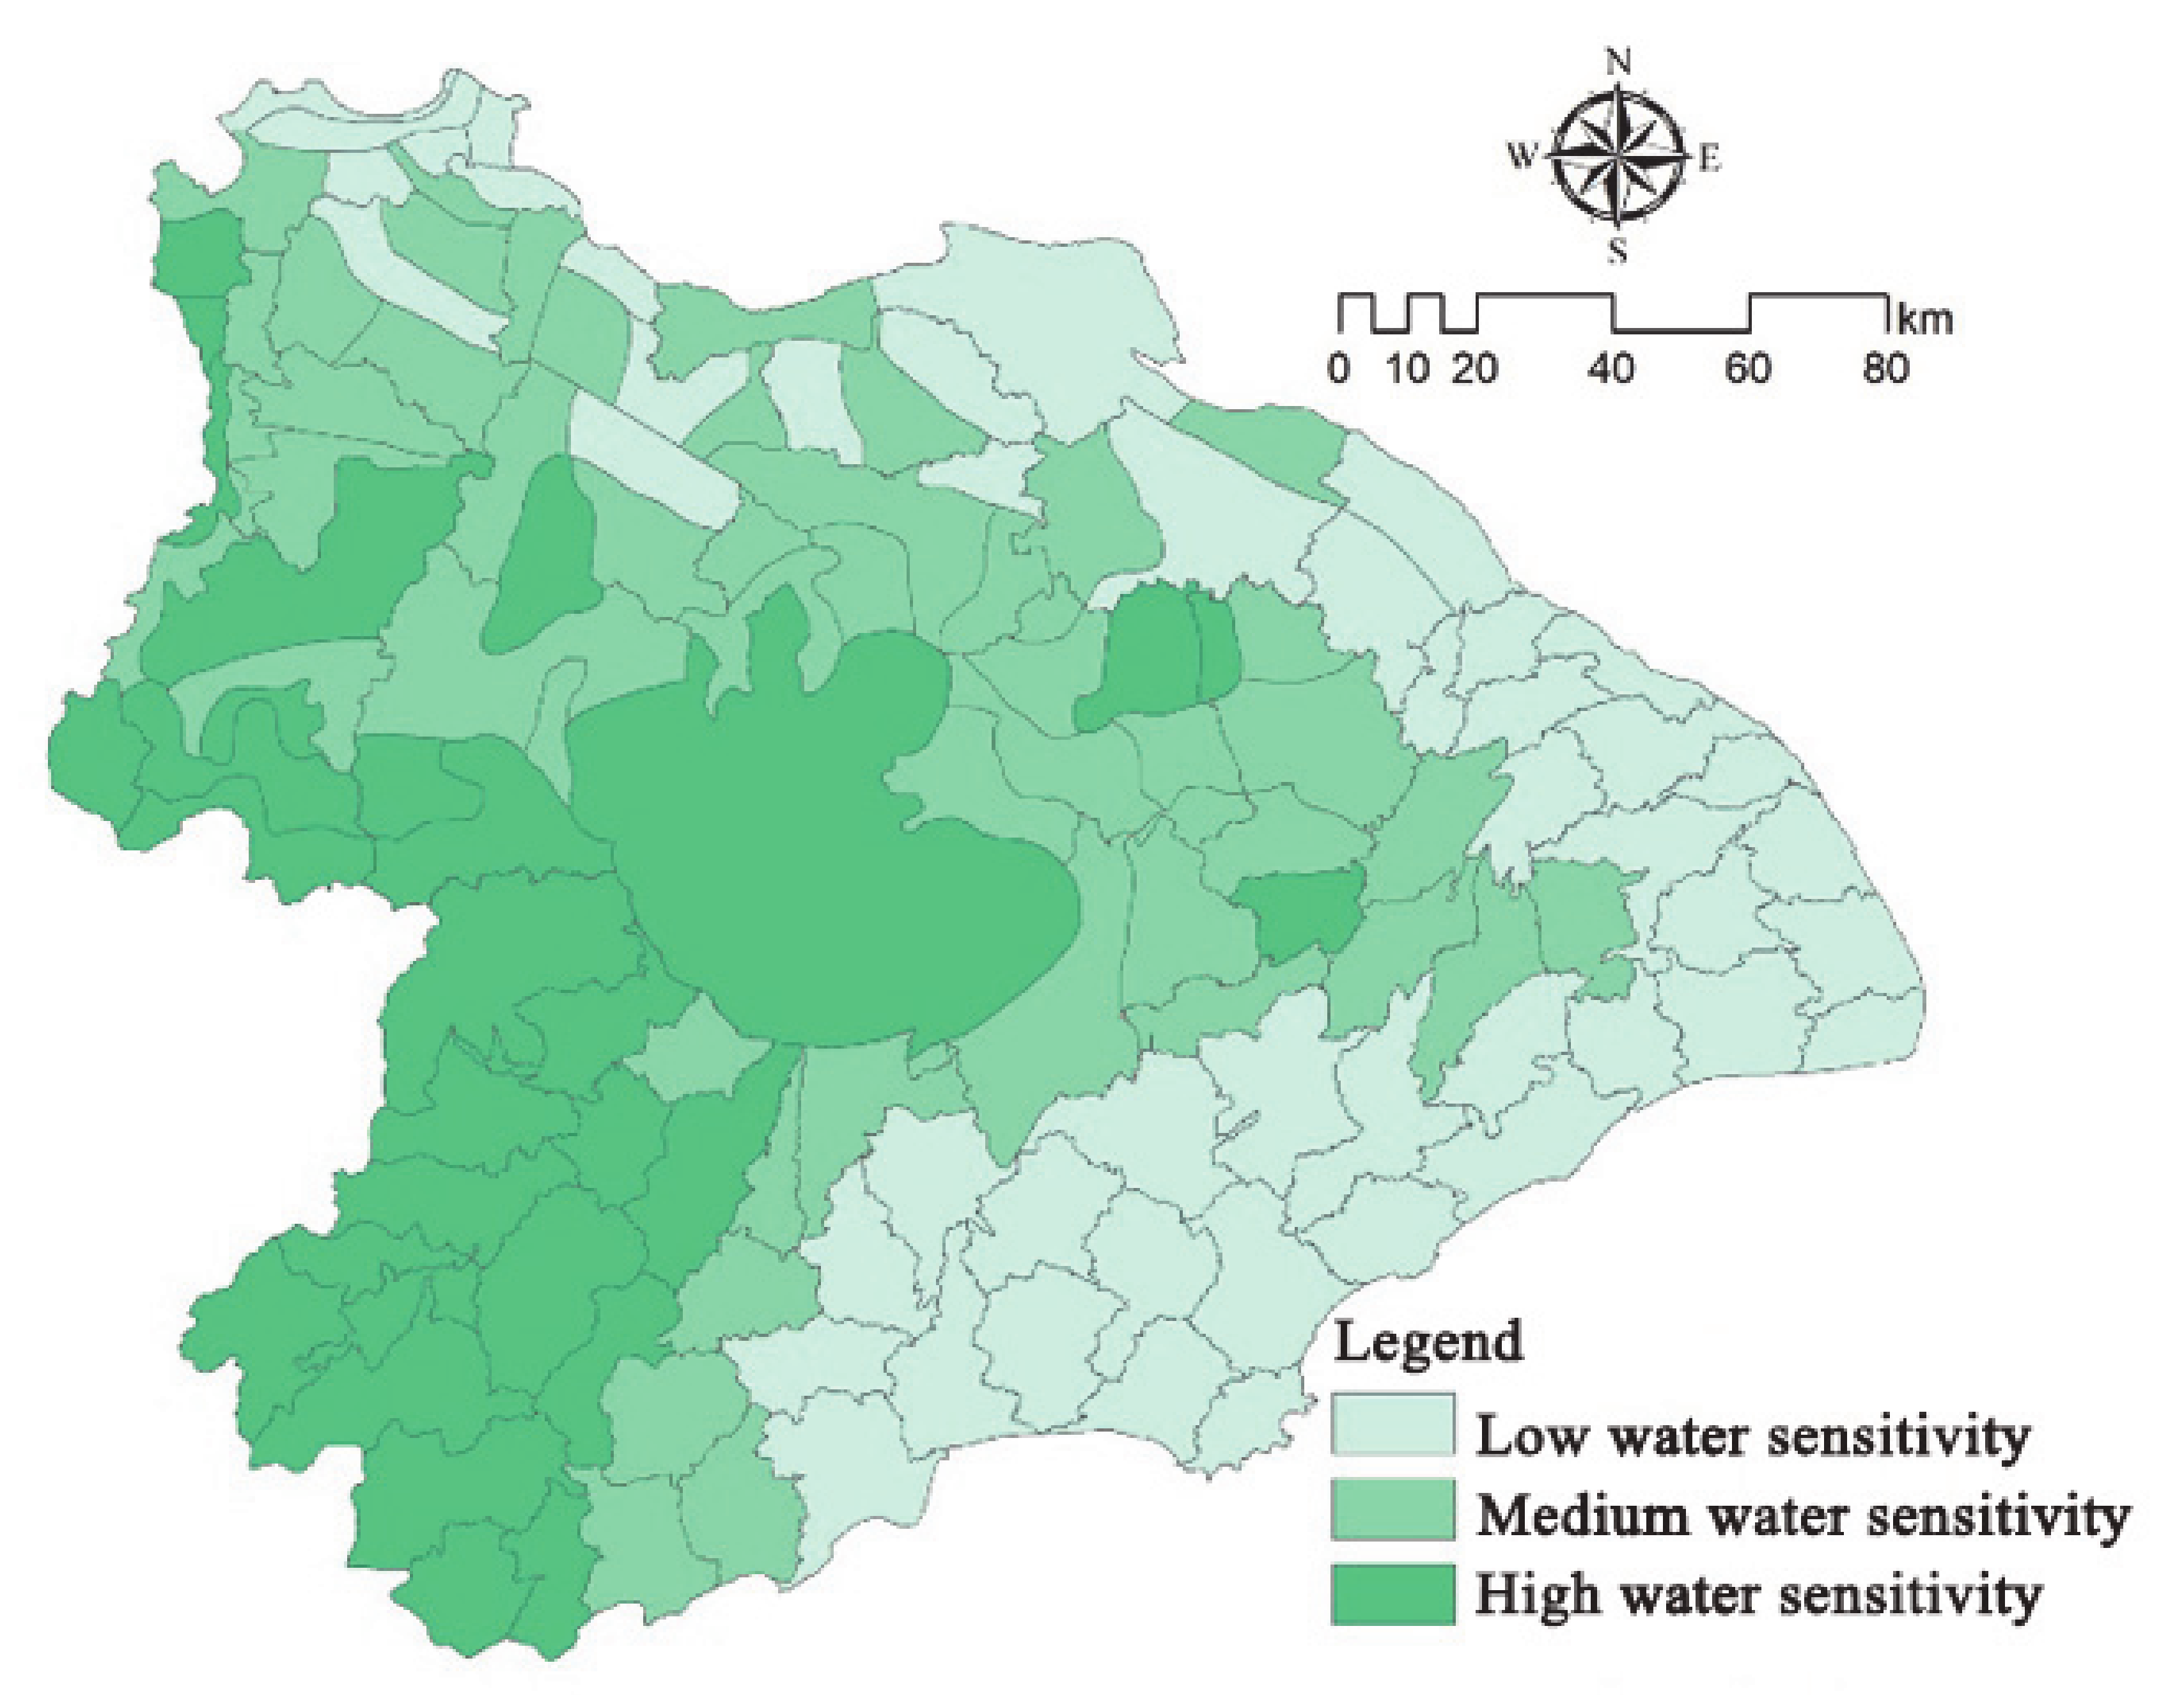
Figure 5.
Expansion intensity of construction land in 1985–1995, 1995–2007 and 2007–2017.
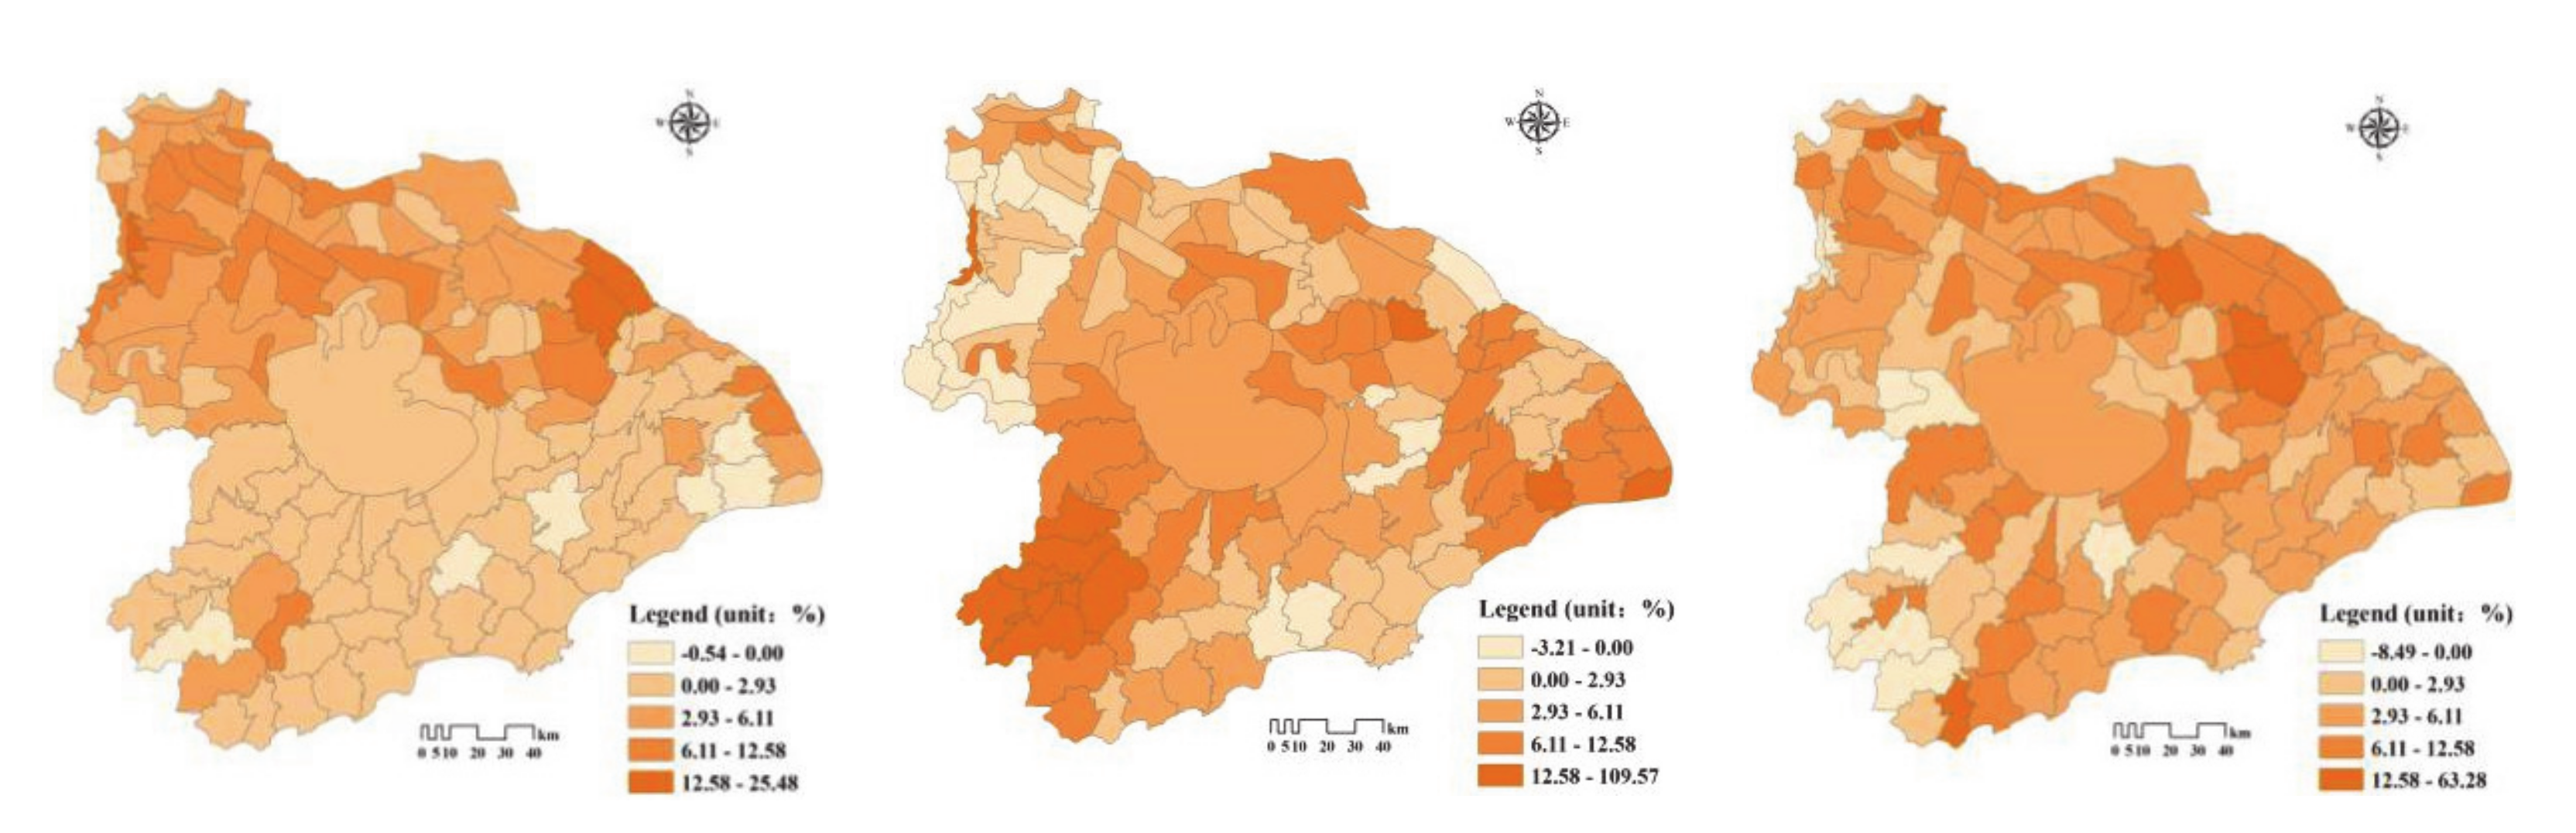
Figure 6.
Correlation analysis of expansion strength and water sensitivity from 1985 to 2017.

Table 1.
Surface water environmental function standard index.
| Classification | Standard |
|---|---|
| Class I | Mainly applicable to source water and national nature reserves. |
| Class II | Mainly suitable for primary protection zone of centralized drinking water, surface water sources, rare aquatic habitats, spawning grounds of fish and shrimp and feeding grounds for juvenile fish. |
| Class III | Mainly applicable to the secondary protection areas of centralized domestic drinking water and surface water sources, fish and shrimp winter-fields, migratory routes, aquaculture areas and other fishery waters and swimming areas. |
| Class IV | Mainly applicable to general industrial water-use areas and recreational water-use areas not directly in contact with human bodies. |
| Class V | Mainly applicable to agricultural water use areas and water areas with general landscape requirements. |
Table 2.
Regionalization evaluation indices of water sensitivity in the Taihu Basin.
| Factor Level | Index Level | Weight |
|---|---|---|
| Water resources (0.18) | Water system density | 0.64 |
| Relative abundance of water resources | 0.36 | |
| Water ecology (0.32) | Water sources and conservation areas (mountainous areas) | 0.35 |
| Fresh water channel maintenance areas | 0.22 | |
| Wetlands | 0.12 | |
| Large water surfaces | 0.31 | |
| Water environment (0.39) | Geomorphological characteristics | 0.21 |
| Water quality objectives | 0.18 | |
| Use functions | 0.10 | |
| Accessibility | 0.45 | |
| Freshwater channels | 0.06 | |
| Water disasters (0.11) | Flood risk | 0.71 |
| Typhoon risk | 0.29 |
Table 3.
The results of water sensitivity and spatial expansion intensity analyses of 128 small basin units in the Taihu Basin.
Table 3.
The results of water sensitivity and spatial expansion intensity analyses of 128 small basin units in the Taihu Basin.
| Unit No. | Water Sensitivity | Spatial Expansion Intensity (%) | Unit No. | Water Sensitivity | Spatial Expansion Intensity (%) | ||||
|---|---|---|---|---|---|---|---|---|---|
| 1985–1995 | 1995–2007 | 2007–2017 | 1985–1995 | 1995–2007 | 2007–2017 | ||||
| 1 | 0.31 | 4.00 | 7.38 | −3.93 | 65 | 0.60 | 3.82 | 11.10 | 3.05 |
| 2 | 0.31 | 2.71 | 8.07 | 1.79 | 66 | 0.39 | 1.92 | −2.85 | 6.48 |
| 3 | 0.32 | 2.06 | 109.57 | −8.50 | 67 | 0.77 | 7.44 | −3.22 | 7.61 |
| 4 | 0.32 | 1.25 | 96.20 | 1.24 | 68 | 0.58 | 10.03 | 4.95 | 14.72 |
| 5 | 0.42 | 3.54 | 0.29 | 8.99 | 69 | 0.21 | 1.47 | 1.06 | 4.25 |
| 6 | 0.42 | 6.11 | 0.38 | 6.47 | 70 | 0.10 | 0.84 | 7.25 | 2.57 |
| 7 | 0.36 | 0.36 | 13.91 | 1.89 | 71 | 0.10 | 2.62 | 9.03 | 5.10 |
| 8 | 0.42 | 0.80 | −1.78 | 3.84 | 72 | 0.10 | 1.45 | −0.62 | 5.21 |
| 9 | 0.37 | 16.90 | 1.25 | 7.60 | 73 | 0.10 | 0.79 | 11.09 | 11.35 |
| 10 | 0.49 | 2.94 | 4.88 | 4.59 | 74 | 0.63 | 7.25 | 1.07 | 5.36 |
| 11 | 0.22 | −0.17 | 4.20 | 1.54 | 75 | 0.55 | 1.92 | −1.59 | 4.36 |
| 12 | 0.25 | 0.64 | 1.46 | 3.51 | 76 | 0.60 | 1.78 | 2.64 | 4.33 |
| 13 | 0.43 | 8.15 | 6.18 | 6.83 | 77 | 0.46 | 5.97 | 3.42 | 7.09 |
| 14 | 0.37 | −0.54 | 15.59 | 2.49 | 78 | 0.60 | 3.99 | 0.78 | 22.50 |
| 15 | 0.46 | 25.48 | −0.74 | 6.67 | 79 | 0.70 | 6.77 | 1.06 | 6.70 |
| 16 | 0.47 | 3.91 | 10.02 | 3.59 | 80 | 0.70 | 6.96 | 4.96 | 0.04 |
| 17 | 0.42 | 9.28 | 14.81 | −6.34 | 81 | 0.83 | 3.44 | −1.16 | 63.28 |
| 18 | 0.49 | 1.44 | 8.49 | 2.91 | 82 | 0.83 | 6.51 | 3.14 | 8.16 |
| 19 | 0.73 | 5.67 | −1.77 | 3.72 | 83 | 0.73 | 4.68 | −2.79 | 5.90 |
| 20 | 0.69 | 3.27 | 2.15 | 4.28 | 84 | 0.83 | 6.65 | 1.72 | 3.25 |
| 21 | 0.37 | 0.32 | 17.92 | 11.05 | 85 | 0.73 | 3.53 | 3.50 | 7.67 |
| 22 | 0.48 | 4.21 | 4.67 | 4.91 | 86 | 0.70 | 12.58 | 0.61 | 4.97 |
| 23 | 0.49 | 4.28 | 0.65 | 61.28 | 87 | 0.70 | 3.48 | 5.01 | 7.10 |
| 24 | 0.51 | 2.43 | −0.96 | 3.74 | 88 | 0.60 | 5.26 | 2.99 | 2.75 |
| 25 | 0.59 | 3.74 | 1.57 | 4.71 | 89 | 0.50 | 18.22 | 2.63 | −2.76 |
| 26 | 0.57 | 3.46 | −0.01 | 1.67 | 90 | 0.50 | 7.07 | 5.72 | 4.81 |
| 27 | 0.44 | 0.16 | 4.02 | 5.21 | 91 | 0.50 | 3.71 | 7.51 | 6.18 |
| 28 | 0.49 | 3.24 | 6.97 | 15.83 | 92 | 0.27 | 1.92 | 4.78 | 6.78 |
| 29 | 0.60 | 11.21 | 14.49 | 13.78 | 93 | 0.27 | 1.52 | 3.53 | 4.20 |
| 30 | 0.56 | 7.25 | 4.15 | 2.17 | 94 | 0.56 | 4.37 | 10.76 | 7.30 |
| 31 | 0.49 | 4.25 | 7.94 | 4.44 | 95 | 0.44 | 3.14 | 4.53 | 5.17 |
| 32 | 0.49 | 2.79 | 4.99 | −2.29 | 96 | 0.38 | 4.91 | 5.30 | 1.95 |
| 33 | 0.50 | 3.67 | 3.78 | 1.02 | 97 | 0.31 | 0.69 | 30.23 | 6.19 |
| 34 | 0.50 | 1.29 | 5.19 | 2.99 | 98 | 0.27 | 1.78 | 4.86 | 3.50 |
| 35 | 0.50 | 0.85 | 5.24 | 10.07 | 99 | 0.37 | 3.89 | 9.07 | 1.31 |
| 36 | 0.44 | 2.60 | 2.40 | 9.64 | 100 | 0.22 | 0.15 | −0.86 | 8.07 |
| 37 | 0.44 | 5.77 | 1.54 | 5.57 | 101 | 0.26 | 0.65 | 10.03 | 2.45 |
| 38 | 0.33 | 1.17 | 4.52 | 7.12 | 102 | 0.26 | 0.29 | 2.34 | 6.21 |
| 39 | 0.53 | 3.37 | 0.70 | 8.72 | 103 | 0.22 | 0.08 | 1.59 | 4.15 |
| 40 | 0.80 | 5.16 | −1.22 | 8.34 | 104 | 0.38 | 4.02 | 2.74 | 7.01 |
| 41 | 0.49 | 6.43 | 1.92 | 2.15 | 105 | 0.22 | −0.11 | 4.95 | 4.60 |
| 42 | 0.31 | 1.11 | 2.72 | 21.14 | 106 | 0.22 | 0.53 | 0.13 | 4.70 |
| 43 | 0.32 | −0.20 | 18.50 | −1.92 | 107 | 0.26 | 0.49 | 3.37 | 6.13 |
| 44 | 0.42 | 8.39 | −2.30 | 4.49 | 108 | 0.10 | 1.99 | 7.93 | 5.93 |
| 45 | 0.55 | 3.06 | 10.60 | −1.08 | 109 | 0.10 | 3.38 | 9.34 | 4.31 |
| 46 | 0.44 | 2.17 | 2.79 | 1.03 | 110 | 0.10 | 0.98 | 2.48 | 3.68 |
| 47 | 0.19 | 1.43 | 7.23 | 4.64 | 111 | 0.10 | 4.27 | 0.48 | 3.33 |
| 48 | 0.24 | 0.46 | −0.18 | 5.58 | 112 | 0.22 | 0.86 | 2.71 | 2.41 |
| 49 | 0.17 | 0.03 | 8.23 | 1.52 | 113 | 0.22 | 0.74 | 1.67 | 0.96 |
| 50 | 0.33 | 1.39 | 4.21 | 7.54 | 114 | 0.36 | 0.60 | 7.41 | 6.47 |
| 51 | 0.28 | 10.43 | 12.42 | 2.22 | 115 | 0.45 | 8.08 | 0.71 | 6.49 |
| 52 | 0.33 | 0.58 | 27.02 | 0.00 | 116 | 0.42 | 12.58 | −2.99 | 4.89 |
| 53 | 0.26 | 0.32 | 1.34 | 5.69 | 117 | 0.57 | 1.61 | 6.99 | 0.90 |
| 54 | 0.22 | 0.51 | −1.23 | 7.36 | 118 | 0.10 | 2.06 | 0.16 | 0.89 |
| 55 | 0.30 | 5.70 | 23.49 | 0.77 | 119 | 0.10 | 7.03 | 3.54 | 5.56 |
| 56 | 0.22 | 0.47 | 3.70 | 5.95 | 120 | 0.10 | 4.01 | 1.79 | 6.46 |
| 57 | 0.38 | 3.68 | −0.04 | 3.69 | 121 | 0.26 | 0.39 | 4.09 | −0.12 |
| 58 | 0.37 | −0.29 | 6.96 | 0.38 | 122 | 0.10 | 1.49 | 1.08 | 3.46 |
| 59 | 0.48 | 9.56 | 3.10 | 11.18 | 123 | 0.10 | −0.08 | 6.38 | 10.58 |
| 60 | 0.27 | 0.13 | 1.18 | 6.57 | 124 | 0.14 | 0.77 | 1.66 | 4.16 |
| 61 | 0.60 | 2.74 | 7.04 | 2.60 | 125 | 0.36 | 1.85 | 7.41 | 5.24 |
| 62 | 0.50 | 1.74 | 4.97 | 2.20 | 126 | 0.25 | 1.38 | 10.35 | 2.60 |
| 63 | 0.58 | 10.85 | 5.05 | 5.73 | 127 | 0.10 | 6.64 | 6.36 | 4.36 |
| 64 | 0.60 | 2.90 | 8.15 | 10.59 | 128 | 0.14 | 1.37 | 7.15 | 3.94 |
Publisher’s Note: MDPI stays neutral with regard to jurisdictional claims in published maps and institutional affiliations. |
© 2020 by the authors. Licensee MDPI, Basel, Switzerland. This article is an open access article distributed under the terms and conditions of the Creative Commons Attribution (CC BY) license (http://creativecommons.org/licenses/by/4.0/).
Share and Cite
MDPI and ACS Style
Sun, W.; Wang, Y.; Chen, W.; He, B.; Liu, C.-G. Basin Water Sensitivity and Its Impact on Spatial Expansion: A Case Study of the Taihu Basin, China. Sustainability 2020, 12, 10353. https://doi.org/10.3390/su122410353
AMA Style
Sun W, Wang Y, Chen W, He B, Liu C-G. Basin Water Sensitivity and Its Impact on Spatial Expansion: A Case Study of the Taihu Basin, China. Sustainability. 2020; 12(24):10353. https://doi.org/10.3390/su122410353
Chicago/Turabian StyleSun, Wei, Yi Wang, Wen Chen, Bin He, and Chong-Gang Liu. 2020. "Basin Water Sensitivity and Its Impact on Spatial Expansion: A Case Study of the Taihu Basin, China" Sustainability 12, no. 24: 10353. https://doi.org/10.3390/su122410353
Note that from the first issue of 2016, this journal uses article numbers instead of page numbers. See further details here.