Article

Assessment of Forest Ecosystem Development in Coal Mine Degraded Land by Using Integrated Mine Soil Quality Index (IMSQI): The Evidence from India

by
Sneha Bandyopadhyay
1,
Luís A. B. Novo
2,
Marcin Pietrzykowski
3 and
Subodh Kumar Maiti
1,*
1
Ecological Restoration Laboratory, Department of Environmental Science and Engineering, Centre of Mining Environment, Indian Institute of Technology (Indian School of Mines), Dhanbad 826004, India
2
Scotland’s Rural College (SRUC), West Mains Road, Edinburgh EH9 3JG, UK
3
Department of Forest Ecology and Silviculture, University of Agriculture in Krakow, 31-120 Krakow, Poland
*
Author to whom correspondence should be addressed.
Forests 2020, 11(12), 1310; https://doi.org/10.3390/f11121310
Submission received: 9 November 2020 / Revised: 30 November 2020 / Accepted: 3 December 2020 / Published: 8 December 2020
(This article belongs to the Special Issue Forest Ecosystem Restoration on Postindustrial Sites)

Abstract

:
Research highlights: (1) Ecosystem development assessed in an afforested post-mining site. (2) Soil organic carbon (SOC) and total nitrogen (TN) stock reached close to the reference forest site after 25 years of afforestation. (3) Integrated mine soil quality index is developed to assess the reclamation success. Background and Objectives: Estimation of the mine soil quality is one of the most important criterions for evaluating the reclamation success and restoration of novel ecosystems of the post-industrial degraded lands. The aim of this long-term experiment was to investigate the influence of revegetation on Technosol (defined as anthropogenic soil resulted from reclamation of mine spoil materials) as the basic ecosystem development. Materials and Methods: A field study was carried out in the chronosequence afforested post-mining sites (5, 10, 25 years) and compared with natural forest site. We assessed the physicochemical properties and nutrient stock of mine soil and estimated general mine soil quality by using an integrated mine soil quality index (IMSQI). The studies were fully randomized in the chronosequence of afforested post-mining sites. Results: Nutrient dynamics and soil properties (physicochemical and biological) were recovered with the increase age of reclamation. Soil organic carbon (SOC) stock significantly increased from 9.11 Mg C ha−1 in 5 years to 41.37 Mg C ha−1 after 25 years of afforestation. Likewise, total nitrogen (TN) stock significantly increased from 1.06 Mg N ha−1 in 5 years to 4.45 Mg N ha−1 after 25 years of revegetation. Ecosystem carbon pool enhanced at a rate of 6.2 Mg C ha−1 year−1. A Principal Component Analysis (PCA)-based IMSQ index was employed to assess the reclamation success. The most influential properties controlling the health of reclaimed coal mine soil are fine earth fraction, moisture content, SOC and dehydrogenase activity. IMSQ index values are validated with vegetation characteristics. The estimated IMSQI ranged from 0.455 in 5-year-old (RMS5) to 0.746 in 25-year-old reclaimed dump (RMS25). Conclusions: A 25-year-old reclaimed dump having greater IMSQI (0.746) than reference forest soils (0.695) suggested the aptness of revegetation to retrieve soil quality and function in derelict mine land.

Graphical Abstract

1. Introduction

Coal dominates the global energy arena, for its abundance and large distribution. According to the annual report (2018–2019) of Central Electricity Authority (CEA) [1], total coal consumption by thermal power plant increased from 608 Mt (million tonnes) (2017–2018) to 628.9 Mt (2018–2019) along with the assumption for 2019–2020 that 698 Mt coal will be required for the production of 1059BU of electricity. Despite the considerable growth of renewable energies, coal still holds the major share of power generation in India, the world’s third largest energy consumer after China and USA, supplying 84% of its electricity. The majority of Indian coal reserves (82%) found at a depth of up to 300 m and are usually excavated using surface mining techniques (>90%) that alter natural landscape into degraded environment. Surface mining removes vegetation, topsoil cover, excavated and dumped rock overburden (OB) initially outside (external dumps), afterwards used for backfilling of mine voids (internal dumps). These OB dumps are dominated by sedimentary rock debris and may pollute the environment if not properly managed [2,3,4]. Moreover, deforestation due to mining activities significantly affects the hydrological regime, causing major depletion in biodiversity. Surface mining tremendously disturbs the Earth’s surface, decreases the carbon stock, soil fertility as well as destroys the carbon sink [5]. Reclamation is therefore inevitable for geotechnical stabilization of the waste dump, accelerating the recovery of post-mining ecosystem, generation of ecosystem services, sustainable land use and partially combating global warming by enhancing CO2 sequestration.
The concentration of Indian coal reserves in forest regions has driven the complete destruction of biodiversity, vegetation and soil cover, and, consequently, the depletion of forest ecosystem services and natural carbon sink. The Ministry of Coal, in its “Coal Vision-2025”, has given a long-term perception on coal production and overburden (OB) removal; it suggests that land depletion due to coal mining is obvious as large coal reserves are underneath thick forest cover and it has predicted that 35% of the future land will be provided by forest areas, which intensified with the severe environmental problems [6]. Though mining activities can be severely detrimental to well-established carbon sinks, proper reclamation can restore carbon stock, microbial communities, nutrient cycling, land and biomass productivity, and overall aesthetics of a given area. Forest environments have drawn worldwide concern about their ability to reduce global warming and their role in carbon sequestration. Furthermore, under the Kyoto Protocol, UNFCCC (United Nations Framework Convention on Climate Change) acknowledged the process of revegetation as a potential tool to sequester CO2 from the environment and to mitigate global warming [7]. Therefore, proper revegetation in derelict mine sites with native, draught resistant, and fast-growing species is a vital practice to restore the global carbon balance.
Post-mining derelict sites were restored in several countries through the plantation of fast-growing exotic trees. On the other hand, over the last decade, more attention has been focused on five-tier plantation (trees, shrubs, herbs, grass-legumes, climber), three-tier vegetation (i.e., grasses, understory vegetation, and trees), and diverse and native species composition that could enhance genetic diversity, influence soil quality and carbon dynamics and accelerate the recovery to a self-sustainable environment [8,9,10]. Hence, selection of proper plant species is an essential factor that affects revegetation success on mine-degraded lands due to the unfavorable mine spoil characteristics, such as high rock fragments (60–80%), low water holding capacity, low pH, high bulk density, poor microbial activity, low nutrient and soil organic carbon (SOC) content [3,11].
The development of forest cover on post-mining land is often a challenging effort for restoration ecologists and land managers due to the complete destruction of ecosystem characteristics. In recent history, the focus has shifted from just redeveloping the forest to assessing the health of the reclaimed site and quantifying the reclamation progress of the revegetated sites by indexing, modelling, and remote sensing [12,13]. The success of reclamation depends on the type of plant species selected for revegetation and their ameliorative effect on mine spoils rather than the mining strategy, height and slope of dumps, and geo-climatic condition. Individual parameters cannot determine the effect of tree species on the quality of the mine soil, as most of them are interconnected and difficult to comprehend. The identification of soil quality indicators is therefore important for evaluating the progress of mine soil reclamation [14]. It is worth noting that mine owners/stakeholders often want to know the health of the reclaimed area and the time needed for the development of self-sustaining forest cover from a management perspective. In this regard, to estimate the time needed for the development of self-sustaining forest cover, soil quality assessment of chronosequence sites is essential. To restore the eco-environmental integrity in derelict mine sites, a better understanding of soil development under age chronosequence is important. In order to assess the impact of restoration practices on development of soil, microbial communities and major changes in soil properties (physico-chemical, biological), a reclamation chronosequence approach is essential in post-mining derelict sites, particularly when initial soil characteristics are unknown [10,15,16].
Many authors have reported the impact of restoration activities on soil ecosystem functions and aimed to establish soil quality indicators by considering different soil properties [3,4,9,14,17]. Chodak and Niklinska [18] highlighted that successful restoration of degraded post-mining land mostly depends on formation of microbial communities. Shrestha and Lal [19] studied chronological variation of carbon and nitrogen stock after 25 years of reclamation and reported strong correlation between reclamation age and nutrient pool. Mukhopadhyay et al. [14] established the principal component analysis (PCA)-based mine soil quality index (MSQI) to evaluate reclamation trajectory over revegetation chronosequence and reported SOC, coarse fraction, soil CO2 flux, dehydrogenase activity (DHA), moisture and base saturation as influential parameters on reclamation success. Ahirwal et al. [20] developed a Technosol quality index (TQI) to study the reclamation potential of 15 years of afforested chronosequence post-mining ecosystems and observed DHA, silt percentage, and available nitrogen as the most influential soil properties on reclamation success. Hence, assessment of changes of soil quality in chronosequence mine soils is pivotal for determining the efficacy of reclamation success.
This research is based upon the hypothesis that recovery of soil quality, ecological structure and carbon stock in a post-mining degraded ecosystem relies on types and growth of tree species, nature of substrate and revegetation age (age of reclamation or years after afforestation with mixed tree species). The objectives of this study were to (i) evaluate the transformation of mine soil quality by using reclaimed chronosequence post-mining sites, (ii) estimate SOC and TN stock of afforested chronosequence sites, (iii) assess the influence of revegetation on soil health by quantifying an integrated mine soil quality index (IMSQI).

2. Materials and Methods
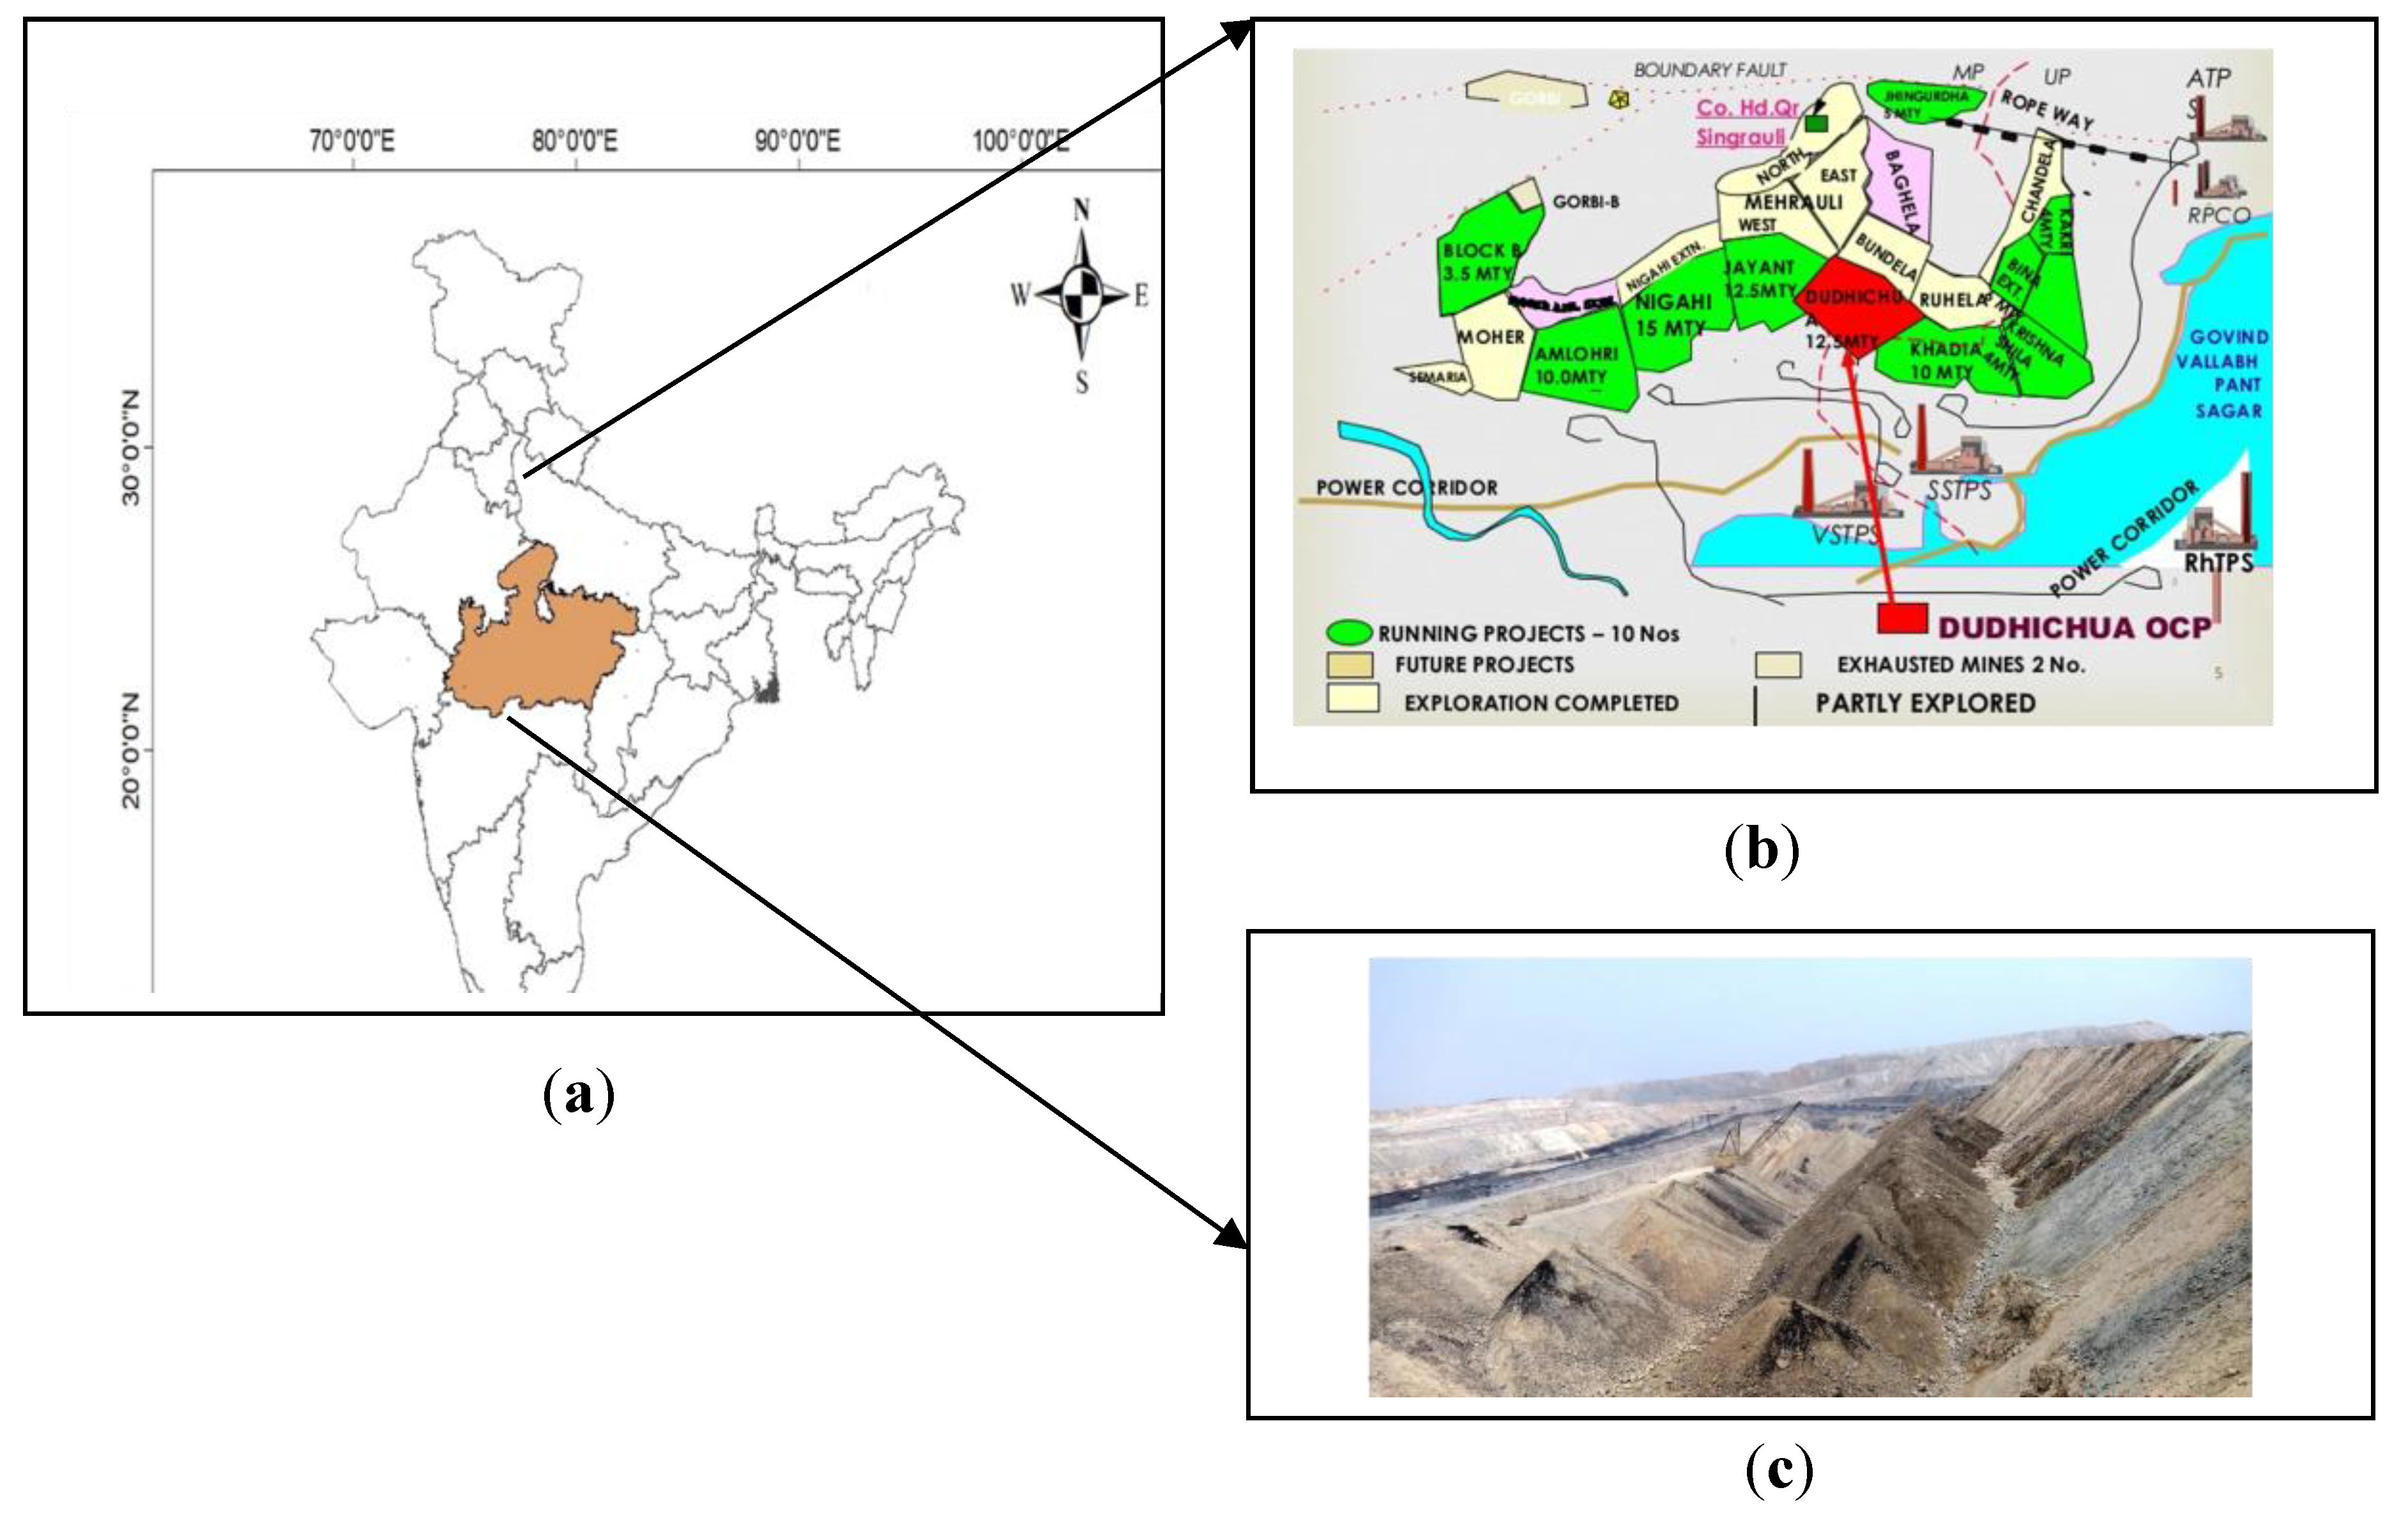
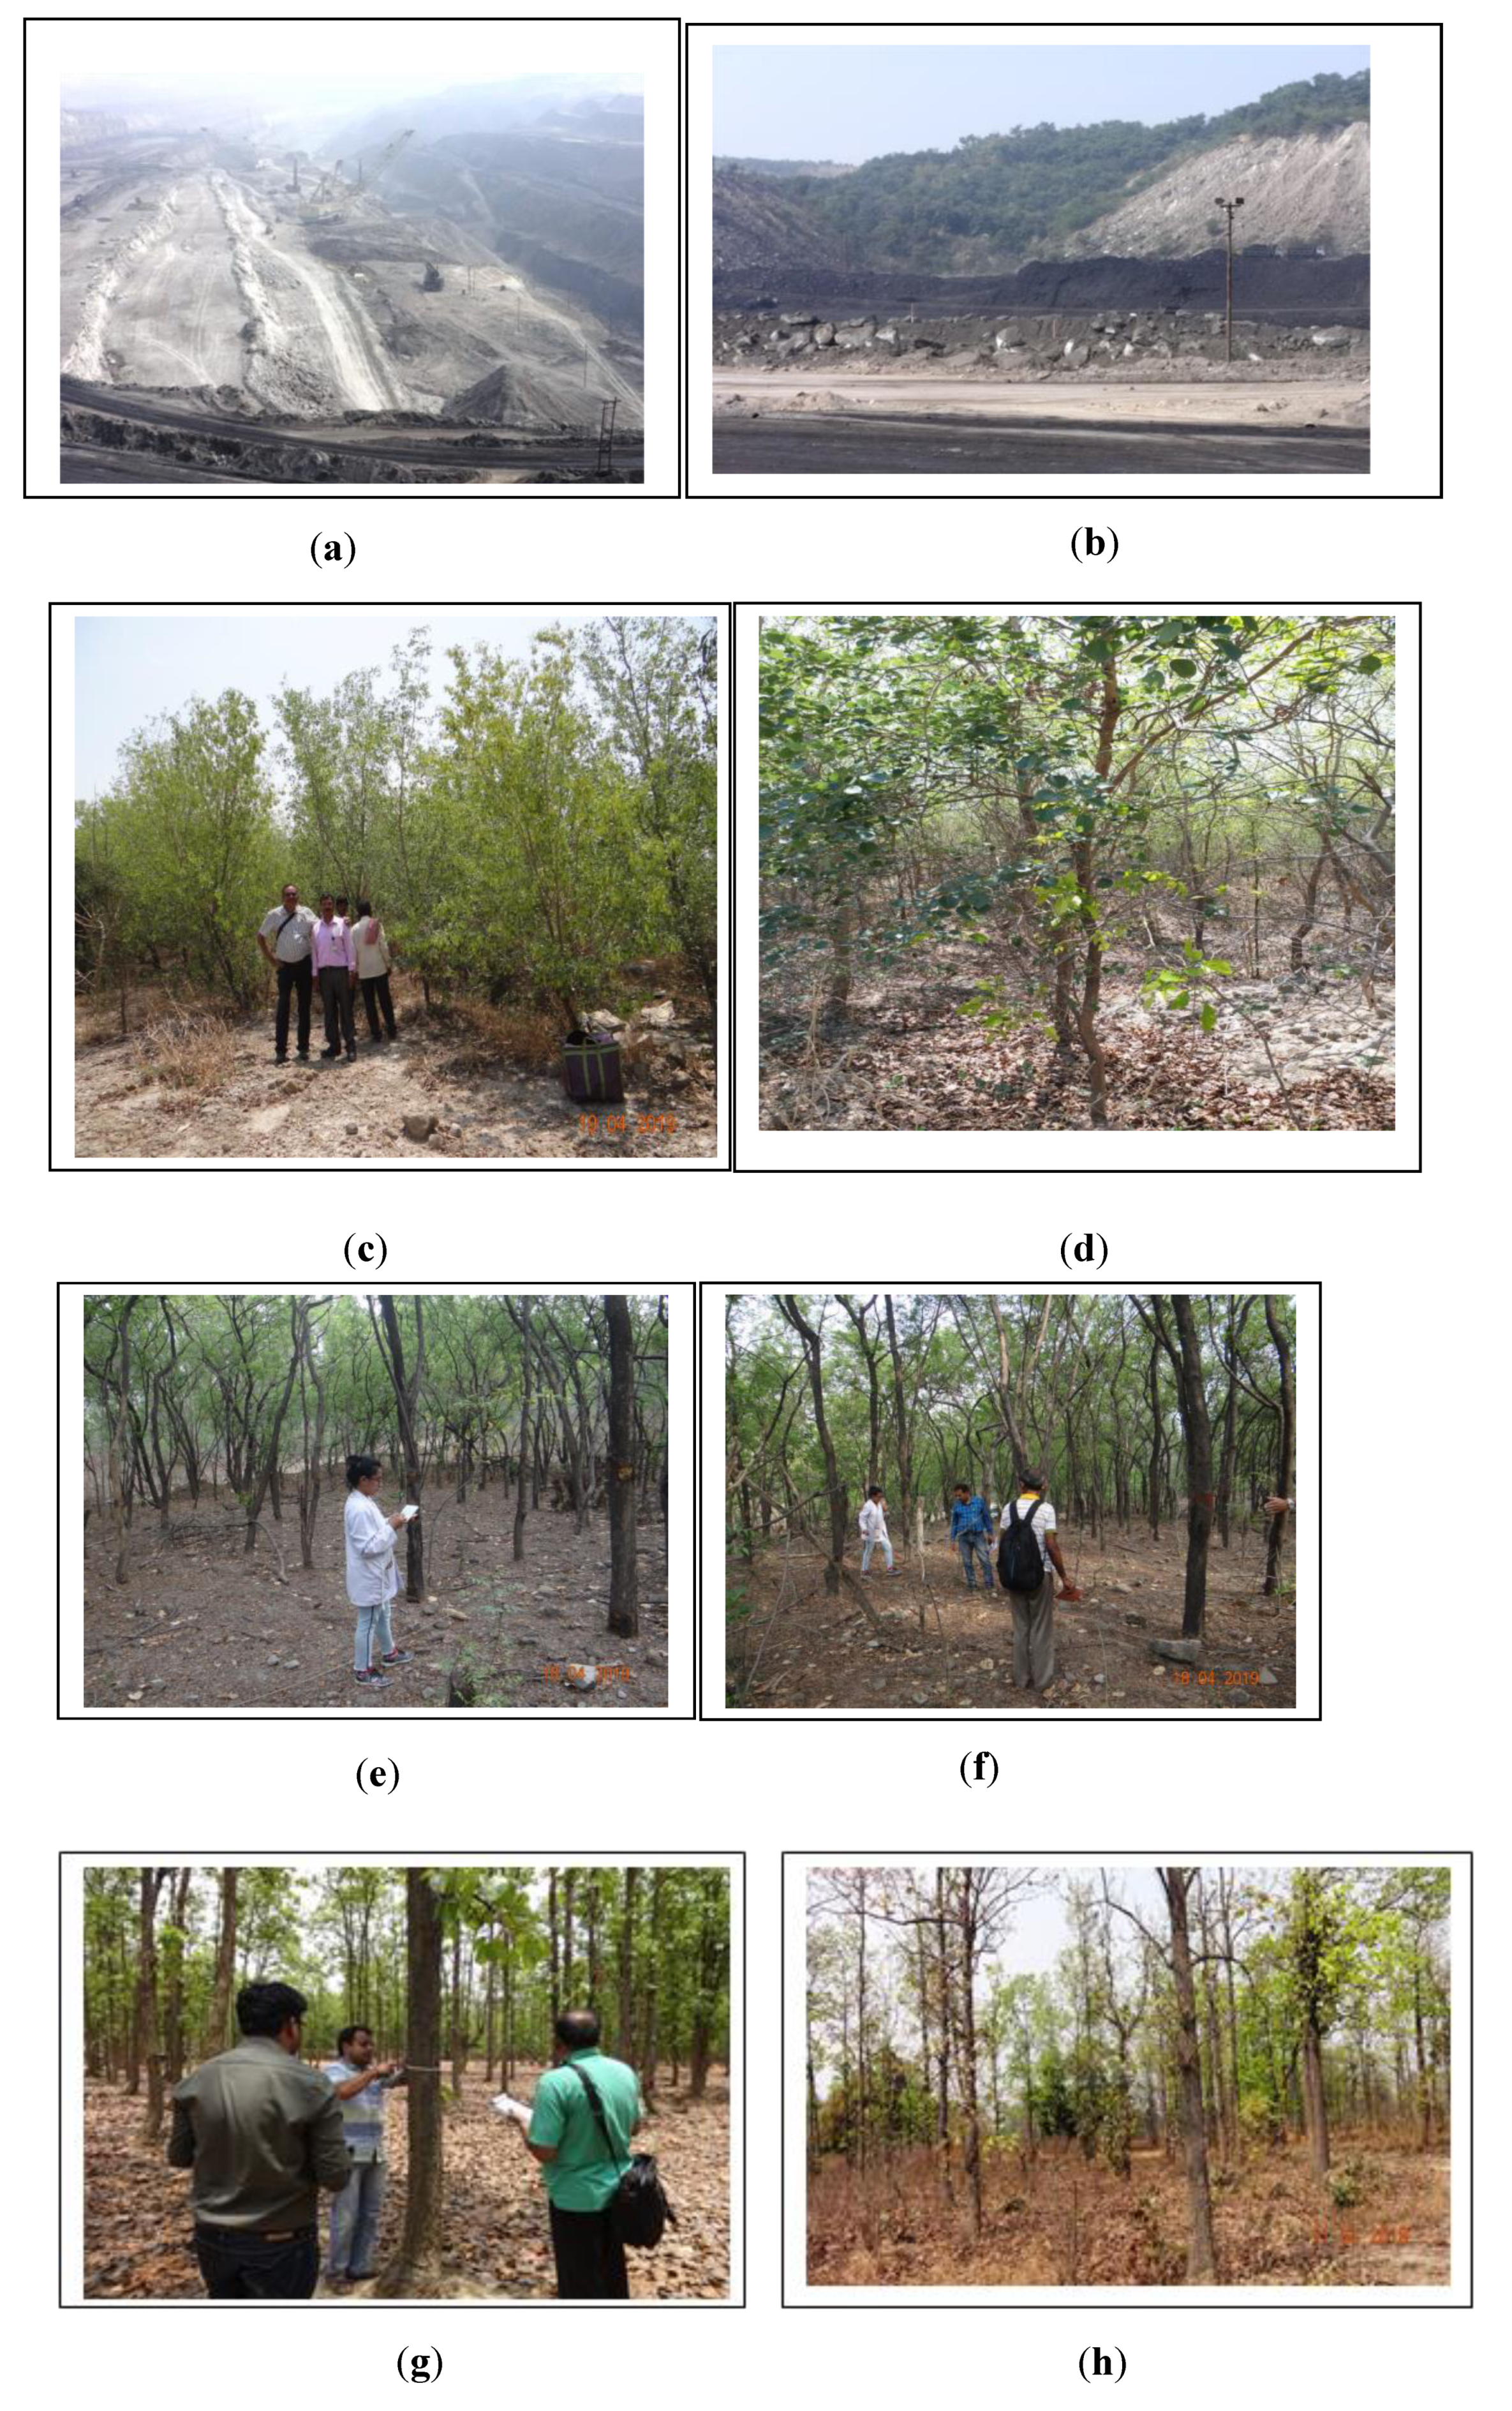
2.1. Study Area

A field study was conducted at the afforested OB dumps of Singrauli open-cast project (OCP) of Northern Coalfields Limited (NCL), a subordinate company of the Coal India Limited (CIL), Madhya Pradesh, India (Figure 1). The Singrauli coalfield is spread over nearly 2202 km2 out of which the coal reserves are identified in the north-western part of coalfield by the Geological Survey of India, covering an area around 220 km2. The study area is characterized by undulating, hilly terrain, 300–500 m above MSL (mean sea level). It is well defined by a prominent east-west trending fault along with Gondwana rocks (gneiss, quartzites, schists, phyllites) of Precambrian age. The area experiences a tropical climate with three definite seasons: summer (March–June), south-west monsoon (June–September) and winter (November–February). The maximum temperature in summer (during May–June) goes as high as 48 °C, and in winter (during November–February), it varies between 4–21 °C. The average annual rainfall of the area is approximately 1000 mm, out of which 95% is during the rainy season.
Jayant OCP covers an active mining area of 1519 ha from which 25 million tonnes (Mt) of coal is produced per annum and the life of the mine is estimated to be 16 years. Even though the coalmine is still active, reclamation has been carried out on the backfilled inactive (closed) dump. The area comprised a mineable coal reserve of 328 Mt, corresponding to an overburden of 836.7 mm3 (stripping ratio: 1:2.5). The total area of land under mine lease is 31.77 km2, out of which 11.80 km2 is under forest cover. A shovel dumper system is employed for mining with gentle dipping of coal seam (2–3°). The mine strike length of Jayant OCP is 5.10 km with 225 m of optimum working depth. The height and slope of OB dump is maintained in the range of 28–30°. After attaining the postulated height, OB dumps are stabilized by contouring and benching. Restoration of these backfilled dumps involved regrading of the mine spoil, and application of good quality topsoil followed by revegetation with tree species.
For this study, three afforested dump sites (Jayant project—24°06′26.08″–24°11′40.86″ North and 82°38′2.01″–82°40′55.64″ East of Singrauli OCP) of 5-, 10-, and 25-year-old (RMS5, RMS10, RMS25) were selected. The back-filled dumps were afforested with 6 months old nursery-grown mixed saplings (2500 sapling ha−1) consisting of Azadirachta indica A. Juss., Cassia siamea Lam. (syn = Senna siamea (Lam.) Irwin et Barneby), Dalbergia sissoo Robx., Terminalia chebula Retz., Terminalia arjuna (Roxb.) Wight & Arn., Gmelina arborea Roxb., Eucalyptus spp. An undisturbed forest site, 10 km from active mining area, was selected as a reference site to compare the recovery trajectory of soil attributes of post-mining ecosystems (Figure 2).

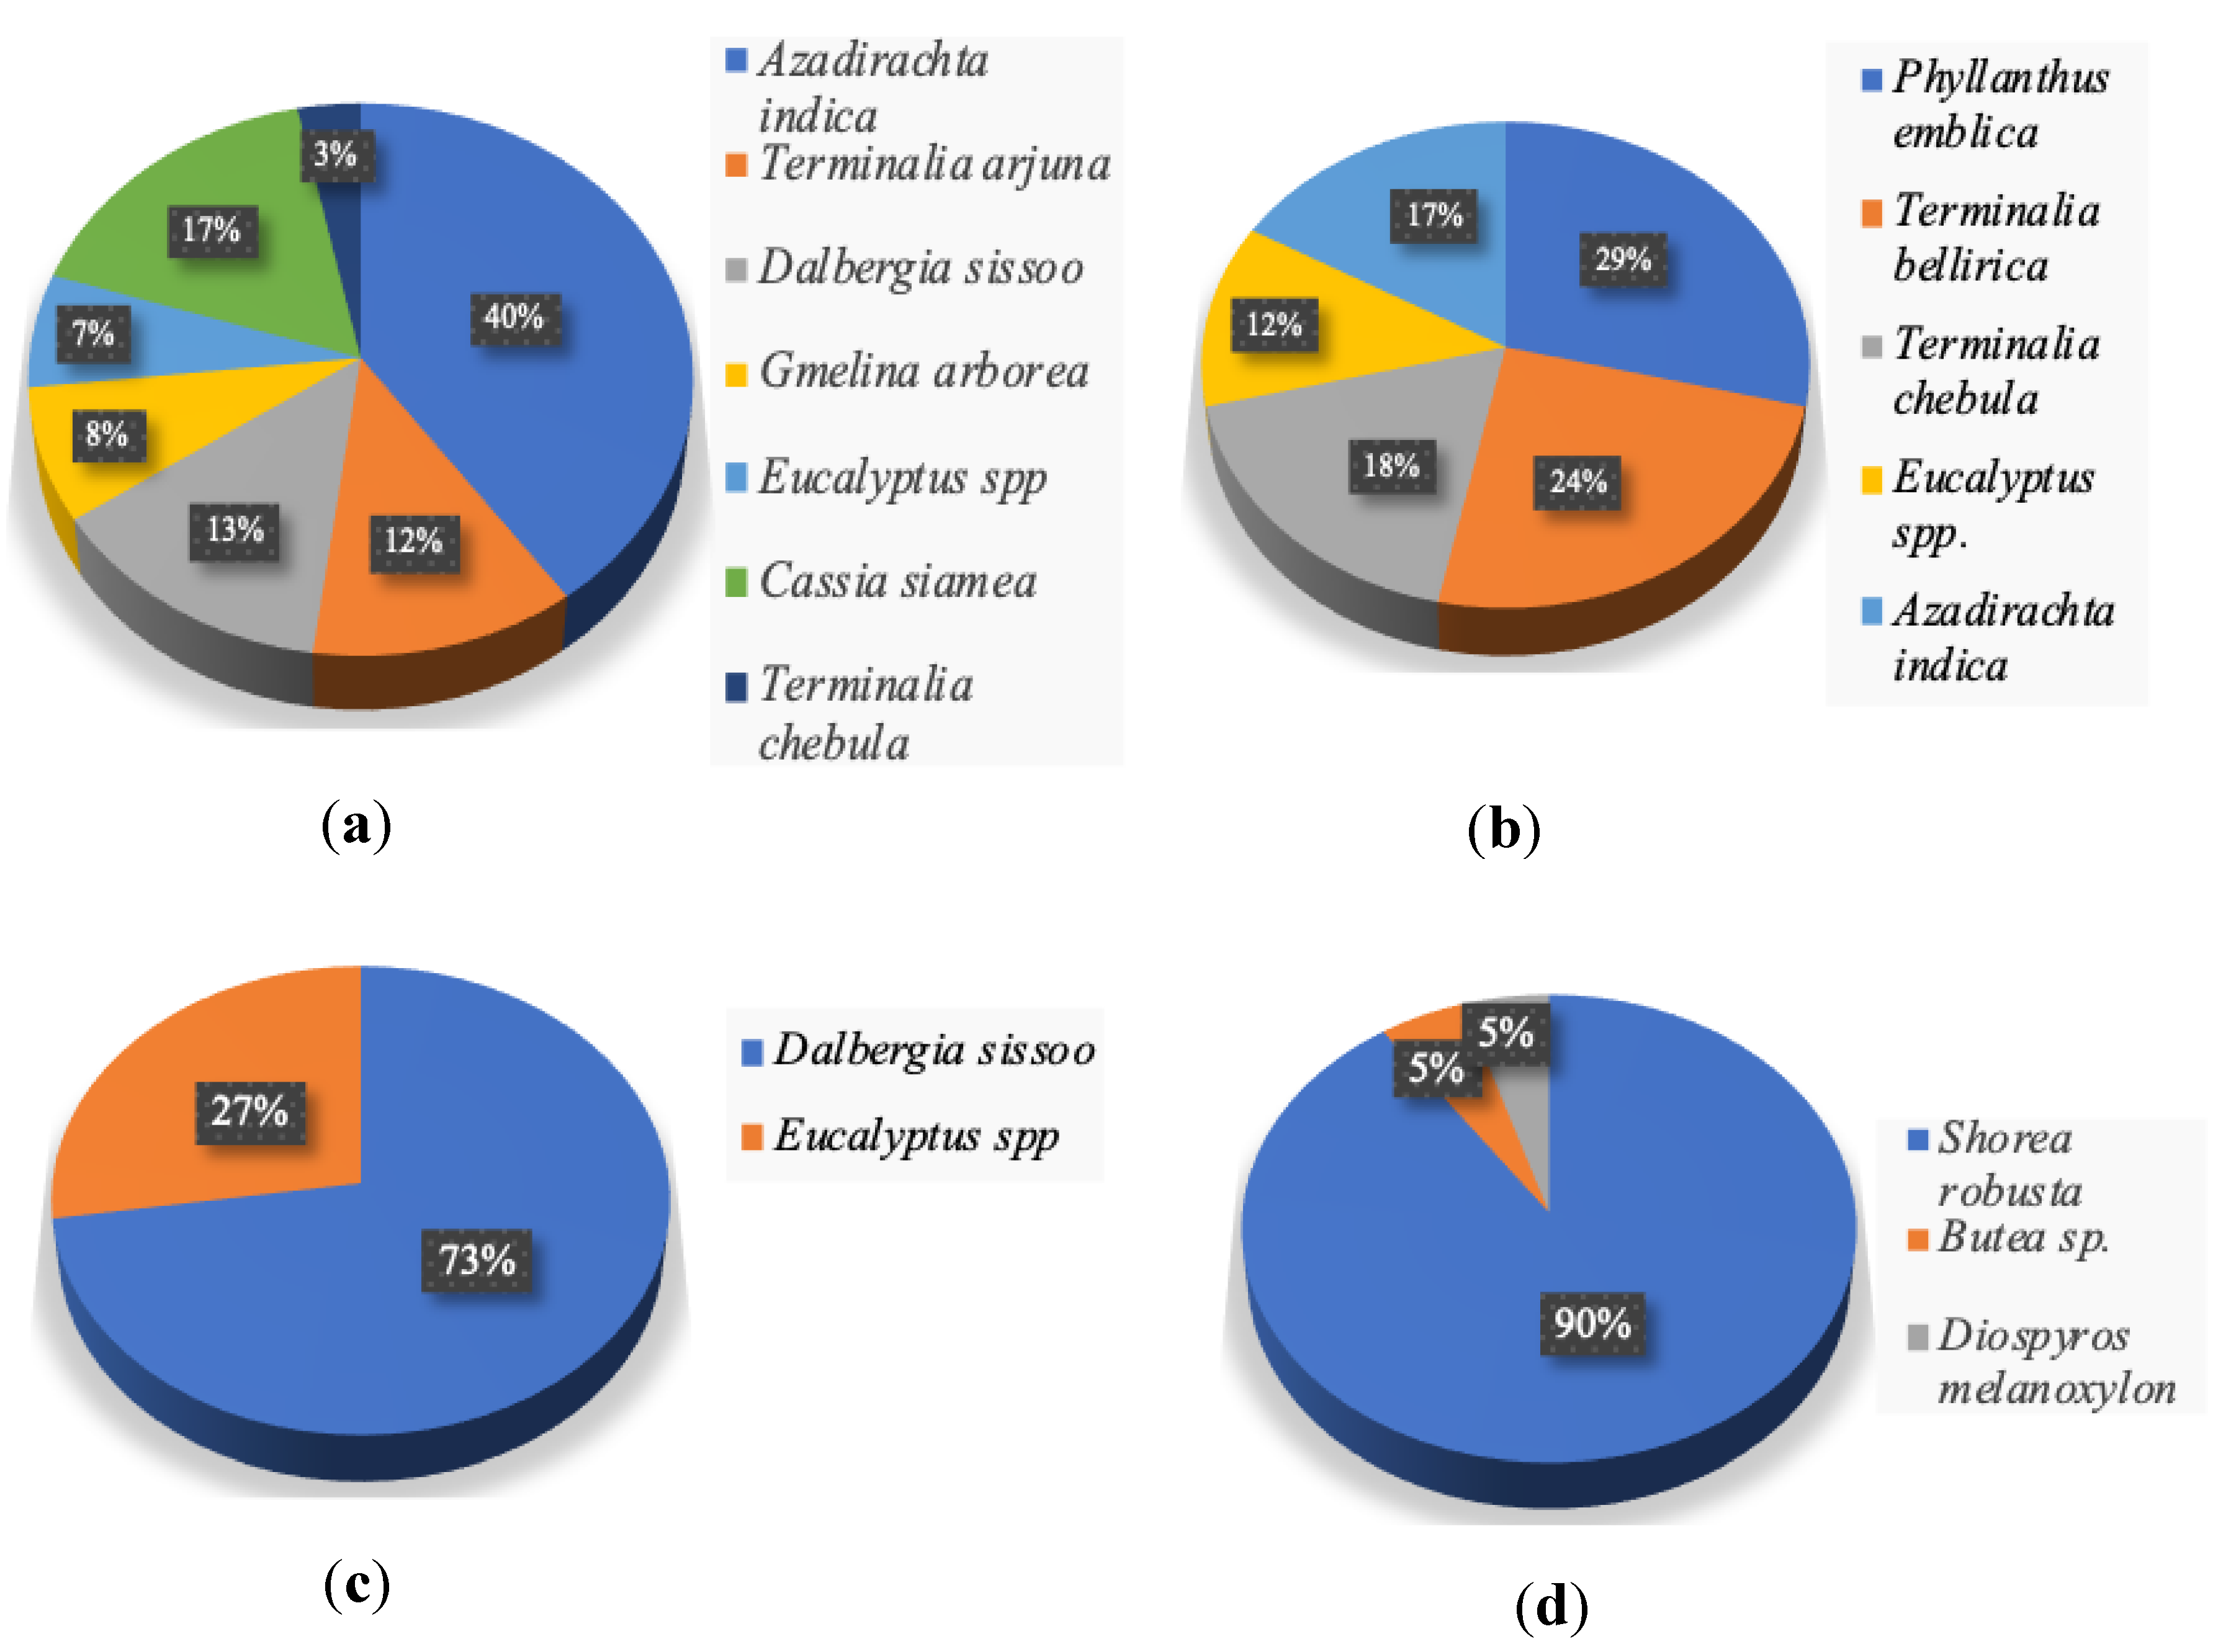
2.2. Vegetation Study

A phytosociological study was conducted at the afforested post-mining sites to survey the plant communities, their composition and development. The vegetation study was implemented at each revegetated site by laying down five 10 m × 10 m quadrates randomly. A total of 15 quadrates were sampled to estimate plant diversity and heterogeneity. Canopy covers were estimated by the line intercept method [21]. Diameter at breast height (DBH) was measured at 1.37 m trunk height by a digital Vernier caliper, and the approximate height of trees was measured by a Distometer. By estimating the dry mass of the 1 cm3 stem sample, collected at 1.3 m height with stem borer, wood-specific gravity was determined. During the month of February, tree litter was collected to a great extent under the tree canopy using litter trap (1 m × 1 m). The coal mine dumps were reclaimed by planting mixed tree species (six months old nursery raised seedlings of different tree species), at a spacing of 2 m × 2 m during the onset of monsoon, which were mainly comprised of: A. indica, C. siamea, D. sissoo, T. arjuna, T. chebula, G. arborea, Eucalyptus spp., Phyllanthus emblica L. While surveying the afforested species, a few incidental tree species such as Pongamia pinnata, Mangifera indica, Citrus limon, Terminalia bellirica, Vachellia nilotica, Aegle marmelos, Delonix regia, Bambusa spp., Albizia lebbeck were also observed. Their origin may be related to avifaunal dispersal (endozoochory) and wind action. The reference site was a natural forest, which is of mixed dry deciduous type, dominated by Shorea robusta (Sal tree), along with Madhuca latifolia, Diospyros melanoxylon, Anogeissus latifolia, Acacia nilotica, and Chloxylon sp.
The relative density (RD) of each tree species was calculated using the following formula.
Relative density (%) = (No. of individuals of a particular species/No. of individuals of all species) × 100

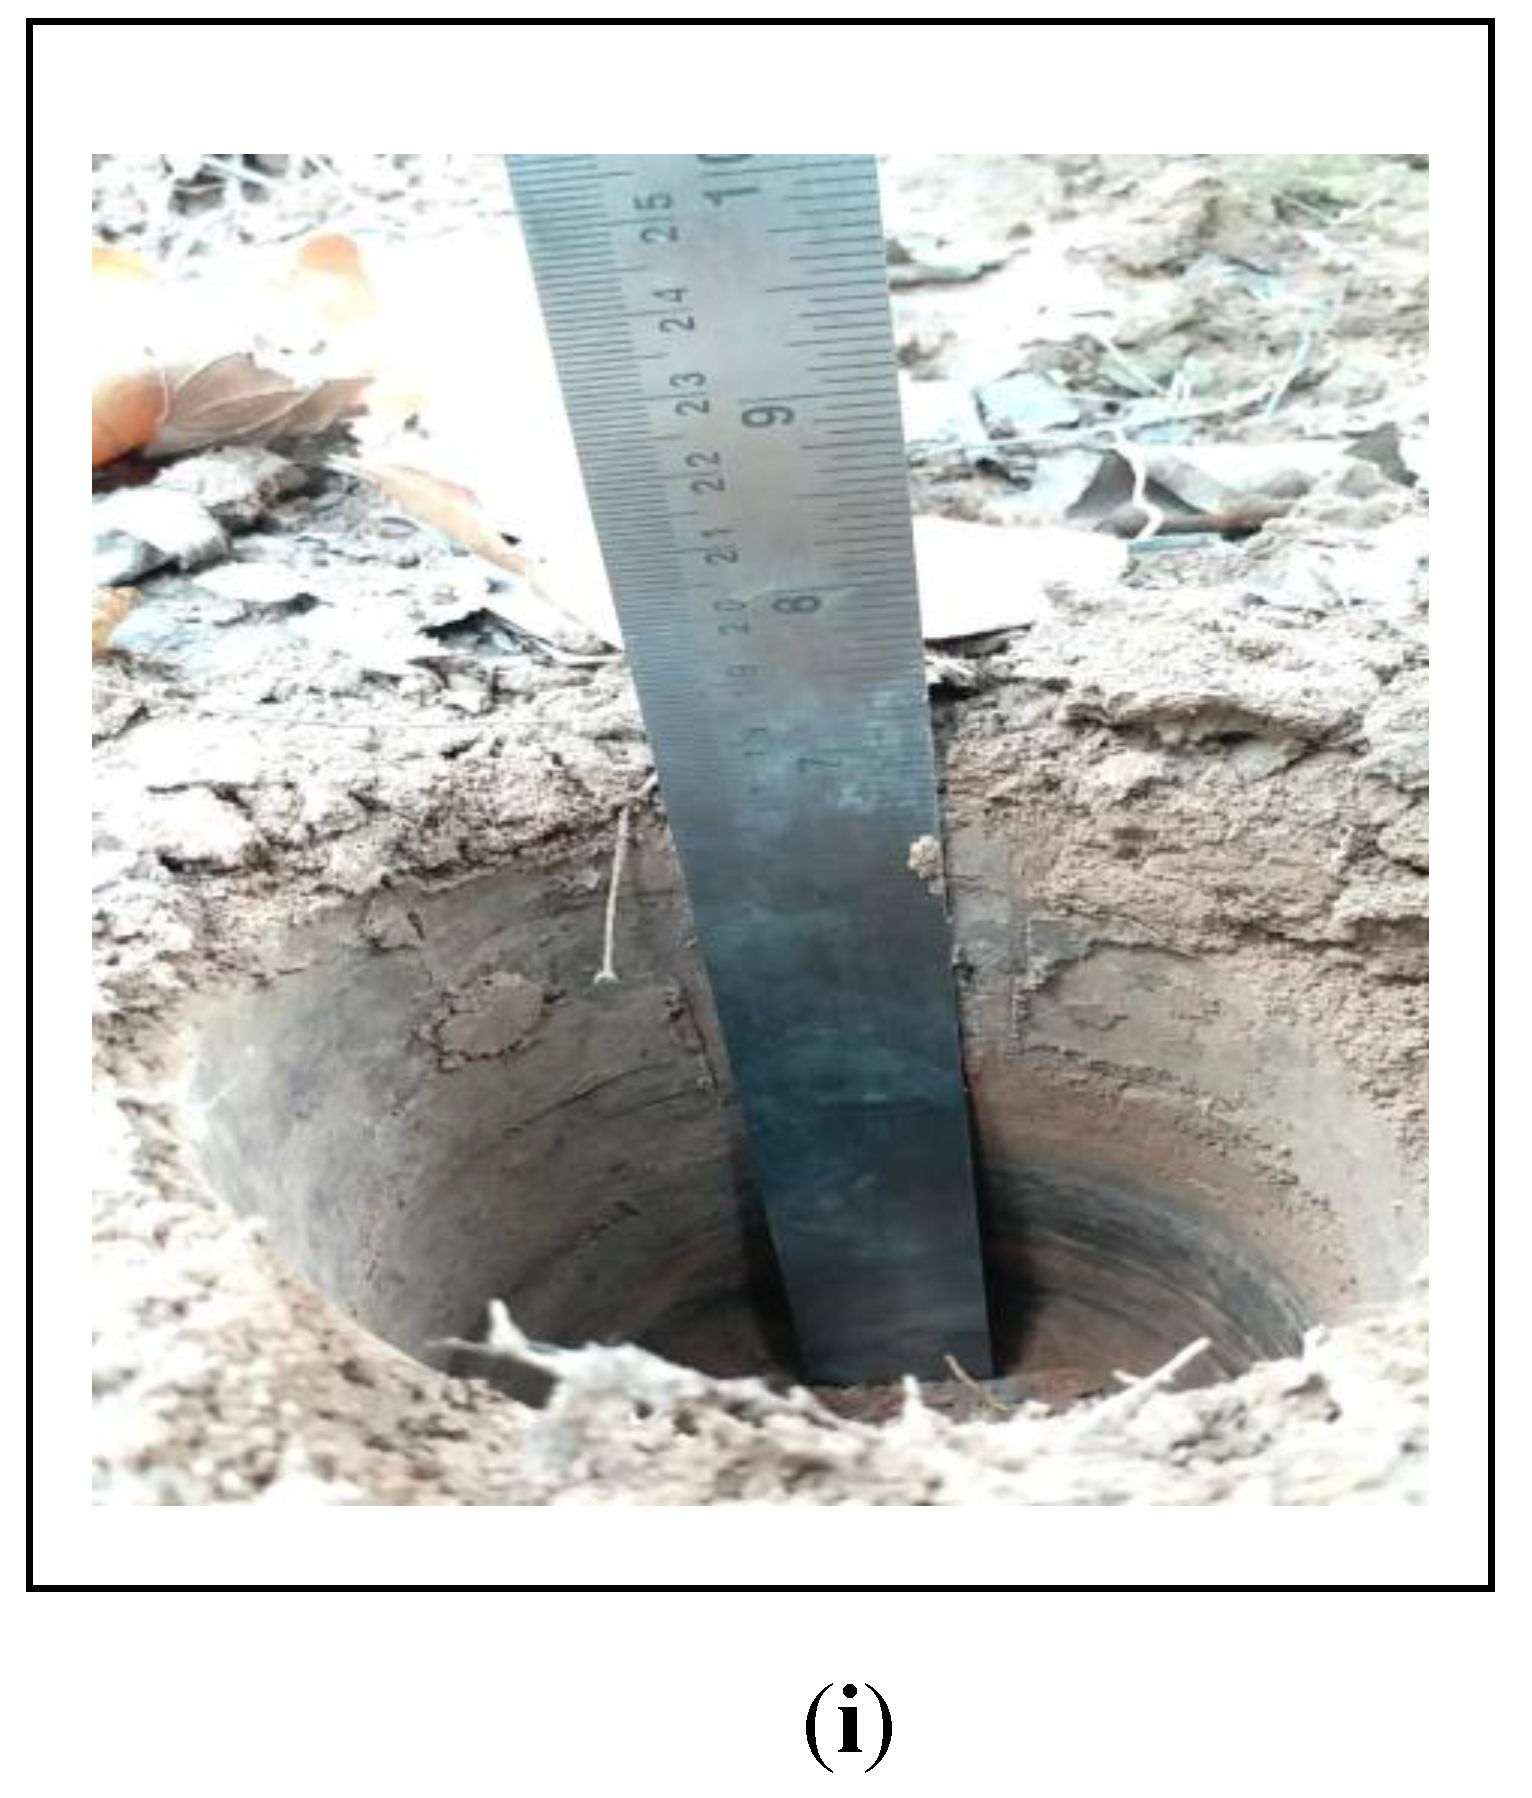
2.3. Collection of Mine Soil Sample

After a phytosociological and geo-botanical study of the area, sampling plots were selected. The rhizospheric soil samples were collected during the winter of 2019 from the three reclaimed coalmine OB dumps (RMS5, RMS10, RMS25) of Jayant OCP and control site (reference forest). Five quadrates (10 m × 10 m) were laid down at each sampling site, 5 mine soil sub samples were collected (0–20 cm depth) using soil corer (8 cm diameter and 20 cm height) from each quadrate and mixed thoroughly, and the weight reduced to approximately 0.5 kg by the conning–quartering method to yield one composite sample per quadrate. Therefore, a total of five replicate soil samples from each study site were collected from the same grids in which vegetation was studied. For the collection of soil samples from the reference forest, a similar sampling approach was also adopted. Thus, from 3 afforested reclaimed sites and 1 reference forest, a total number of 20 soil samples were collected. All the field moist samples were transferred to airtight polypropylene zip bags and carried in ice boxes to the laboratory for analysis to allow the assessment of biological properties.

2.4. Analysis of Soil Samples

In the laboratory, initially after removal of coarse materials (>2 mm) and plant debris, the collected soil samples were separated into two portions: the first part was separately stored at 4 °C for analysis of biological parameters, and the second part was used for soil physicochemical analysis. For physicochemical analysis, field moist soil samples were air-dried for a week at room temperature (25–30 °C), then lightly crushed with mortar and pestle, and passed through a 2 mm sieve to separate fine earth fraction (soil fraction, i.e., <2 mm) from coarse rock debris [22]. Moisture content of field moist soil samples was determined gravimetrically (oven dried at 105 °C for 48 h) [23]. International pipette method was used for the determination of soil texture using sodium hexametaphosphate (NaPO3)6 as a dispersing reagent [24]. By measuring the dry mass of soil in the metallic core [25], field bulk density was calculated. To estimate SOC and N stock of reclaimed mine soil, corrected bulk density and fine earth fraction (<2 mm) were used. The perforated circular Keen box (diameter—5.6 cm; height—1.6 cm; perforated bottom with holes of 0.75 mm diameter) was used to estimate maximum water holding capacity (WHC) of the soil fraction. With the filter paper inside, the Keen boxes (filled with the oven dried soil fraction) were kept overnight in a water-containing tray for saturation of the soil. The difference of weight between dry and saturated soil was considered as WHC [24]. Soil pH and electrical conductivity (EC) were measured potentiometrically in the soil: deionized water suspensions (1:2.5, w/v) by a pH and conductivity meter, respectively (HI-2020, Hanna Instruments, Navi Mumbai, India). Exchangeable potassium (K) was measured after extraction with neutral (1 N) ammonium acetate solution (soil: extractant; w/v, 1:10) and analyzed by a flame photometer (Microprocessor flame photometer, ESICO-1388, ESICO INTERNATIONAL, Himachal Pradesh, India) [26]. Sodium saturation method was used to estimate cation exchange capacity (CEC) [26]. Available phosphorus (P) was estimated by the Olsen method and quantified by a spectrophotometer (UV-1800, UV-VIS Spectrophotometer, Shimadzu Corporation, Kyoto, Japan) [27]. Soil organic carbon (SOC) was determined using the rapid dichromate oxidation method [28]. CHNS analyzer (CHNS-O Elemental Analyzer-Eurovector Euro EA 3000, Redavalle (Pavia), Italy) along with reference soil material (Soil #3 standard; N = 0.262%; Eurovector, Pavia, Italy) was used to quantify total nitrogen (TN). The alkaline potassium permanganate method was used to estimate available nitrogen (Av-N) by using semi-automatic KJELOPLUS nitrogen estimation system (KJELODIST-EAS VA, Pelican equipment’s Inc., Chennai, India) [29]. Soil dehydrogenase activity (DHA) was estimated as per Casida et al. [30] using 2,3,5-triphenyl tetrazolium chloride (TTC) as the substrate. Microbial biomass carbon (MBC) was determined by the chloroform fumigation and extraction method [31].

2.5. Estimation of Carbon (SOC) and Nitrogen (N) Stock

By estimating SOC and TN along an age gradient, the temporal changes in the SOC and TN stocks were evaluated. The soil stock was determined on the basis of SOC, TN concentration, corrected bulk density (Bdc) and soil profile thickness [32]. As the presence of a high coarse fraction in mine soils interferes with the measurement of stocks, the quantification of Bdc was essential. The latter is calculated as follows:
Corrected bulk density (Bdc; Mg/m3) = [Weight of soil sample (Mg) × Fine earth fraction (%)]/[Volume of soil corer (m3) × 100]
From the respective SOC and TN concentrations, Bdc, fine earth fraction (100% of coarse fraction) and soil profile thickness; the SOC and TN stock of the chronosequence sites were determined as follows:
SOC stock (Mg/ha) = (SOC (%) × corrected bulk density (Mg/m3) × T(m) × 104 (m2/ha))/100
TN stock (Mg/ha) = (TN (%) × corrected bulk density (Mg/m3) × T (m) × 104 (m2/ha))/100
where, SOC = concentration of SOC, TN = concentration of total Nitrogen, T = soil profile thickness.

2.6. Estimation of Carbon Sequestration

The allometric equation for the above-ground biomass (AGB) estimation is commonly stated as a function of the tree height and diameter at breast height (DBH; 1.37 m from ground level). For a large variety of climatic conditions and forest types, this function frequently differs. Local empirical equations based on species-specific parameters such as DBH, height, wood density, crown cover, age and basal area were used for estimating the tree biomass of a specific area [33,34,35,36,37]. There is presently no particular allometric equation, especially for a mixed stand of the reclaimed areas, for the Indian conditions. Chave et al. [38] have formulated an improved allometric equation from a large number of datasets (4004 trees from 53 undisturbed and 5 secondary forest sites across tropics including Southeast Asia), and developed a generic model that provides more stable and robust allometric relationship. As this generic model is concentrated on mixed stand plantation on reclaimed and reference forest site, its application is suitable on the current study. Total tree biomass in the reclaimed afforested coalmine dump and reference forest was determined using the species-specific DBH, wood density and height. Data were subjected to an enhance allometric equation to estimate AGB [38]:
AGB = 0.0673 × (ρD2H)0.976
where, AGB = above-ground biomass (kg), ρ = wood density (g/cm3), D = DBH (cm), H = tree height (m).
Estimation of below-ground biomass (BGB) in tropical forests has not been much explored and is usually calculated using the allometric equation from AGB. Several researchers have reported that root biomass is approximately 25% of the total AGB [7,39]. However, in the present study, BGB was calculated using an allometric equation for the tropical ecosystem (IPCC 2003):
BGB = exp (−1.0587 + 0.8836 × ln (AGB))
where BGB = below-ground biomass (Mg/ha) and AGB = above-ground biomass (Mg/ha).
Total biomass content, comprising trees above-ground biomass (AGB), below-ground biomass (BGB), and litter biomass was converted to Mg/ha. A conversion factor of 0.5 was used to determine carbon stock [40,41]. The litter biomass carbon content was quantified as an average of 48 ± 2.01%. Total carbon sequestration potential of the study area was calculated by adding the estimated carbon sequestered in soils (0–20 cm depth), AGB, BGB, and litter biomass. The equivalent quantity of CO2 sequestered (Mg/ha) by the revegetated sites was determined by the factor of 3.667:
CO2 sequestered (Mg/ha) = Carbon stock (Mg/ha) × 3.667
The ecosystem C pool was calculated by aggregation of the C stocks present in the various components of the ecosystem:
Ecosystem carbon (C) pool = C pool(AGB+BGB) + C pool[Soil (0–20 cm)] + C pool(litter)

2.7. Integrated Soil Quality Index Based on PCA

Three major steps were followed to calculate the integrated mine soil quality index (IMSQI). First, to identify the minimum data set (MDS) based on weighting factor, PCA was performed on 17 selected soil physicochemical and biological properties. Principal components (PCs) with minimum 5% variance of the datasets and large eigenvalues (≥1) were considered to generate minimum data set (MDS). To compare soil characteristics within a specific PC based on correlation test, the retained PCs were subjected to varimax rotation [42]. Pearson correlation test was employed to check redundancy of variables and to eliminate them from the index if there was more than one highly loaded variable observed under the same PC [43]. If the variables were highly correlated with each other (r ≥ 0.7), the variable with the highest factor loading was retained for indexing; if variables showed high factor loading but not correlated with each other, each factor was retained for indexing [44]. High factor loadings were defined as having absolute values within 10% of the highest factor loading [45].
Second, non-linear scoring techniques were employed to convert the MDS into a dimensionless value varying from 0 to 1 after defining the variables for the MDS. An equation based on a sigmoidal curve with an asymptote varying from 0 to 1 was used to calculate the score of an individual soil parameter.
S = a/(1 + (x/x0)b)
where x = value of an individual soil characteristics, “a” = maximum dimensionless value of the soil characteristics (=1.00), x0 = mean value of each soil characteristics, and b = slope of the sigmoidal curve equation.
To obtain a sigmoidal curve, the slope was assumed +2.5 (less is better) and −2.5 (more is better). After calculating the score of each loading variable, the variables for MDS from each observation were weighted using the PCA results. The variance percentage explained by individual PC was divided by the variance percentage explained by all factors showing eigenvalues ≥ 1 to calculate the weighting factor (Wi). Then, the calculated Wi was normalized and used to calculate IMSQI. The final normalized weights were calculated as per the equation below:
Normalized weight = PCAσi2/(∑Wi/100)
where PCAσi2 is the variance explained by the individual PCs.
Third, IMSQI was computed according to the following weighted-addition equation, using scoring values and the weighting factor of each PC [45]:
IMSQI = ∑WiSi
where Wi was the weighting factor of the soil quality indices and Si was the non-linear score.
The final measured IMSQI was considered an overall indicator of Technosol quality, where a higher IMSQI value corresponded to better soil quality. The IMSQI was further validated by determining the relationship between IMSQI and vegetation characteristics.

2.8. Statistical Analysis

The Shapiro–Wilk test and Levene’s test were employed to test normal distribution and homogeneity of variance of the dataset, respectively. Thereafter, in order to compare the differences in means of soil properties among chronosequence afforested sites, one-way analysis of variance (ANOVA) was performed. The Duncan Multiple Range Test (DMRT) was employed as post hoc test at α ≤ 0.05 significance level to separate means. To evaluate the relationship between IMSQI and other independent ecosystem variables (vegetation characteristics), linear regression analysis was employed. All the statistical analyses were performed using SPSS 21.0 (SPSS Inc., Chicago, IL, USA).

3. Results

3.1. Vegetation Biomass and Carbon Dynamics in Reclaimed Chronosequence

The prime purpose of the ecological restoration process is the re-establishment of a self-sustainable and resilient ecosystem on the post-mining derelict site, alike the one existing before the mining activities [46,47]. Vegetation biomass and carbon dynamics of different dominant plant species (i.e., A. indica, D. sissoo, Eucalyptus spp. in RMS 25; P. emblica, T. bellirica, in RMS 10; D. sissoo, Eucalyptus spp. in RMS 5), growing on the afforested post-mining site, were compared with the natural tropical forest. Tree density in the afforested post-mining site (1600–2000 trees ha−1) was higher than the natural reference forest (1300 trees ha−1). A total of nine types of tree species (six families) were recorded at different reclaimed chronosequence dumps compared with the three types of tree species (three families) growing on the reference forest site. The relative density of plant species showed the dominance of A. indica, with other co-dominant species such as T. arjuna, D. sissoo in RMS 25; P. emblica with T. bellirica and T. chebula in RMS 10; D. sissoo with Eucalyptus spp in RMS 5 (Figure 3). Total tree biomass (AGB + BGB) of different aged revegetated sites was found in the order of RMS 25 (222.79 Mg/ha) > RMS 10 (70.38 Mg/ha) > RMS 5 (16.69 Mg/ha) (Table 1).
Contribution of plant species growing on different aged revegetated dumps to the total woody biomass (AGB + BGB) was found in the order of Eucalyptus spp. (37.4%) > A. indica (29%) > T. arjuna (23.3%) for RMS 25; Eucalyptus spp. (36%) >T. bellirica (22%) > P. emblica (17.7%) for RMS 10 and Eucalyptus spp. (61.7%) > D. Sissoo (38.3%) for RMS 5. Contribution to carbon sequestration by different plant species growing on afforested post-mining land is depicted in Table 2. Accumulation of tree biomass carbon (Mg C ha−1) at different revegetated and reference sites was found in the order of forest (260.58) > RMS 25 (111.40) > RMS 10 (35.19) > RMS 5 (8.35). In the present study, among revegetated sites, RMS 25 shows higher biomass C stock with an accumulation rate of 4.5 Mg C ha−1 year−1. In terms of equivalent CO2 sequestration (Mg ha−1), the reference forest site exhibits the highest potential followed by RMS 25 > RMS 10 > RMS 5. The CO2 sequestration potential of plant biomass of older revegetated site (RMS 25) recovered 42.75% in comparison with the forest site (Table 1). Contribution of plant species to tree carbon stock and equivalent CO2 sequestration potential in reclaimed dump was observed in the order of Eucalyptus > D. sissoo for RMS 5; Eucalyptus > T. bellirica > P. emblica for RMS 10; Eucalyptus > A. indica > T. arjuna for RMS 25. At all afforested post-mining sites, Eucalyptus showed higher biomass stock, hence contributing to greater carbon stock and sequestering more CO2 when compared with the other species (Table 2). This study showed that the younger revegetated site (RMS 5) sequestered low levels of carbon, mainly via Eucalyptus spp. (61.69%). This could be due to species-specific characteristics such as high biomass, fast growing, high photosynthetic rate.

3.2. Litter Carbon Stock and CO2 Sequestration in Reclaimed Chronosequence

Estimation of litter accumulation underneath different tree species growing on revegetated chronosequence dumps was carried out in this study. The present work exhibited a varied increase in litter C stock with age (0.142 Mg C ha−1 year−1) in reclaimed chronosequence sites that could be due to tree density, species composition, and climatic conditions (Table 3). Contribution of different plant species upon accumulation of litter biomass and carbon stock in reclaimed chronosequence sites is depicted in Table 4. The enhancement of litter C with age gradient may improve SOC accretion and the ecosystem of the mining environment. Average litter accumulation and litter C stock in different aged reclaimed OB dumps was observed in the order of RMS 25 > RMS 10 > RMS 5. The highest litter biomass and C stock was found in the reference forest site. In terms of recovery of litter C stock and its equivalent CO2 sequestration potential, RMS 25 exhibited highest recovery (90%) followed by RMS 10 (80.8%) and RMS 5 (56.8%).

3.3. Soil Physicochemical Properties

Changes in soil properties (physical, chemical and biological) ought to be considered to provide a comprehensive understanding of reclamation impact on RMSs. Assessment of soil physicochemical and biological characteristics of the revegetated dumps (5, 10, 25 years after revegetation) under various fast-growing plant species and reference forest site exhibited significant (p < 0.05) differences along the revegetation chronosequence (Table 5). The results from this study exhibited significant differences between fine earth fraction (<2 mm) of reclaimed and forest soils. The younger revegetated OB dump (RMS5) showed significantly lower fine earth fraction (46%) compared to the older (RMS25) revegetated post-mining site (76%) and the forest site (79%). Particle size distribution of the studied RMS indicated that sand, silt and clay content were significantly (p < 0.05) different among the reclaimed sites, which can be categorized in the range of sandy loam to loamy sand. Bulk density of RMSs was varied significantly (p < 0.05) with reclamation chronosequence and was highest in the younger (RMS5) revegetated site (1.76 Mg m−3). The interaction between soil macrofauna (e.g., earthworm) and rhizospheric activities (e.g., root penetration) could be one of the reasons behind decreasing bulk density with increasing reclamation age. In this study, high coarse fraction in RMS5 remarkably reduced the soil moisture that damages tree growth and carbon sequestration potential compared to other revegetated sites. In addition, WHC ranged between 29% and 40% in chronosequence RMS. Technosol pH varied from 7.09 to 7.41 (slightly alkaline) under different plant species, while the reference forest soil showed acidic pH (5.68). In ecological restoration, pH plays a significant function as a controlling factor of plant nutrients availability. Fertile topsoil application [2,48], plant litter decomposition, carbonate rich OB materials and the type of parent rock may alter pH of mine soil. Differences in EC were observed from chronosequence revegetated dump to forest site. EC ranged from 113 µS/cm to 198 µS/cm in Technosol and decreased with increasing age of reclamation.
After 25 years of afforestation, the concentration of SOC at 0–20 cm depth, significantly increased from 0.99 to 2.71% (2.8-fold increase). This could be due to tree growth and organic matter input to the studied soils. The variation in SOC concentration at reclaimed mine soil could also be related to the uneven distribution of coal particles in mine spoils. Similarly, accretion of Av-N (66–139 mg/kg), Av-P (0.4–1.5 mg/kg) and Ex-K (45–149 mg/kg) was also observed from 5 to 25 years after revegetation. Concentration of P in the reference forest soil was significantly higher (5.11 mg/kg) in comparison with the RMS of all ages. A 2.5-fold increase in TN concentration in RMS was observed with the increase in revegetation age. This increase could be explained by the development of vegetation stand with high nitrogen fixing potential like C. siamea, D. sissoo. The maximum concentration was found in the reference forest site (2983 mg/kg). CEC showed an increasing trend from 9.6 to 22.7 cmol/kg after 25 years of reclamation.
The present investigation exhibits a comparative recovery of microbial activities in terms of DHA and MBC estimation in RMS and reference forest soils. With the increase in revegetation age, soil DHA and MBC increased significantly (p < 0.05), showing highest activity in the 25-year-old reclaimed site in comparison to the forest. Highest biological activity in RMS than that in the reference forest strongly suggests the recovery of soil health (nutrient cycling, microbial activity, and fertility).

3.4. Soil Organic Carbon (SOC) and Total Nitrogen (TN) Stock

Accretion of SOC and TN stock with temporal variation in afforested post-mining sites (RMS 5, RMS 10, RMS 25) was estimated in present study (Table 6). It can be observed that RMS 25 exhibits stock of 41.37 ± 3.76 Mg C ha−1, which is higher than reference forest site (31.70 ± 1.40 Mg C ha−1). The RMS 5 and RMS 10 exhibited 78% and 52% less SOC stock compared to RMS 25. In addition, TN stock was highest in reference forest site (4.70 ± 0.21 Mg N ha−1) followed by RMS 25 (4.45 ± 0.36 Mg N ha−1) > RMS 10 (2.12 ± 0.17 Mg N ha−1) > RMS 5 (1.06 ± 0.22 Mg N ha−1). Increase in TN stock in technosols predicted 319% recovery over the reclaimed chronosequence. This accretion of TN stock along the reclaimed chronosequence sites could be linked to the vegetation growth and litter decomposition. Corresponding TN stock in reference forest soil was 5% higher than that of RMS 25. Revegetation with nitrogen fixing plant species (such as D. sissoo), litter decomposition, and vegetation growth may account for higher TN stock. The rate of SOC sequestration was found greater in RMS 10 (1.99 Mg C ha−1 year−1) followed by RMS 5 (1.82 Mg C ha−1 year−1) and RMS 25 (1.65 Mg C ha−1 year−1). Though there is no specific trend for SOC sequestration, it mainly depends on the amount of carbon returned back to the soil by the biomass.

3.5. Ecosystem Carbon Pool

Carbon accumulation in different ecosystem components and equivalent sequestration of CO2 improved with increasing revegetation age. It was significantly greater in the reference forest site, followed by RMS 25 > RMS 10 > RMS 5 (Table 7). The RMS 5 had an ecosystem carbon pool of 18.17 Mg C ha−1 that increased 8.47-fold in RMS 25 and reached 153.9 Mg C ha−1. Ecosystem carbon pool of the afforested post-mining sites increased at a rate of 6.2 Mg C ha−1 year−1. Similarly, RMS 5 exhibited the lower potential of CO2 sequestration of 66.68 Mg CO2 ha−1, which increased 8.47-fold in RMS 25. In comparison to the forest site, RMS 25 recovered 52.4% of sequestering potential of atmospheric CO2. The rate of carbon accumulation depends on the plant density, their composition, plantation age and anthropogenic disturbances. The broad-scale variability in the ecosystem carbon pool of the afforested pos-mining site corresponds to geo-climatic conditions, plant species heterogeneity and substrate nature. The results showed that afforestation with different plant species significantly altered the ecosystem carbon pool from 5 to 25 years after revegetation. Increased revegetation age and tree biomass, and greater accumulation of carbon in plant species and mine soil, could possibly offset high CO2 emission due to mining.

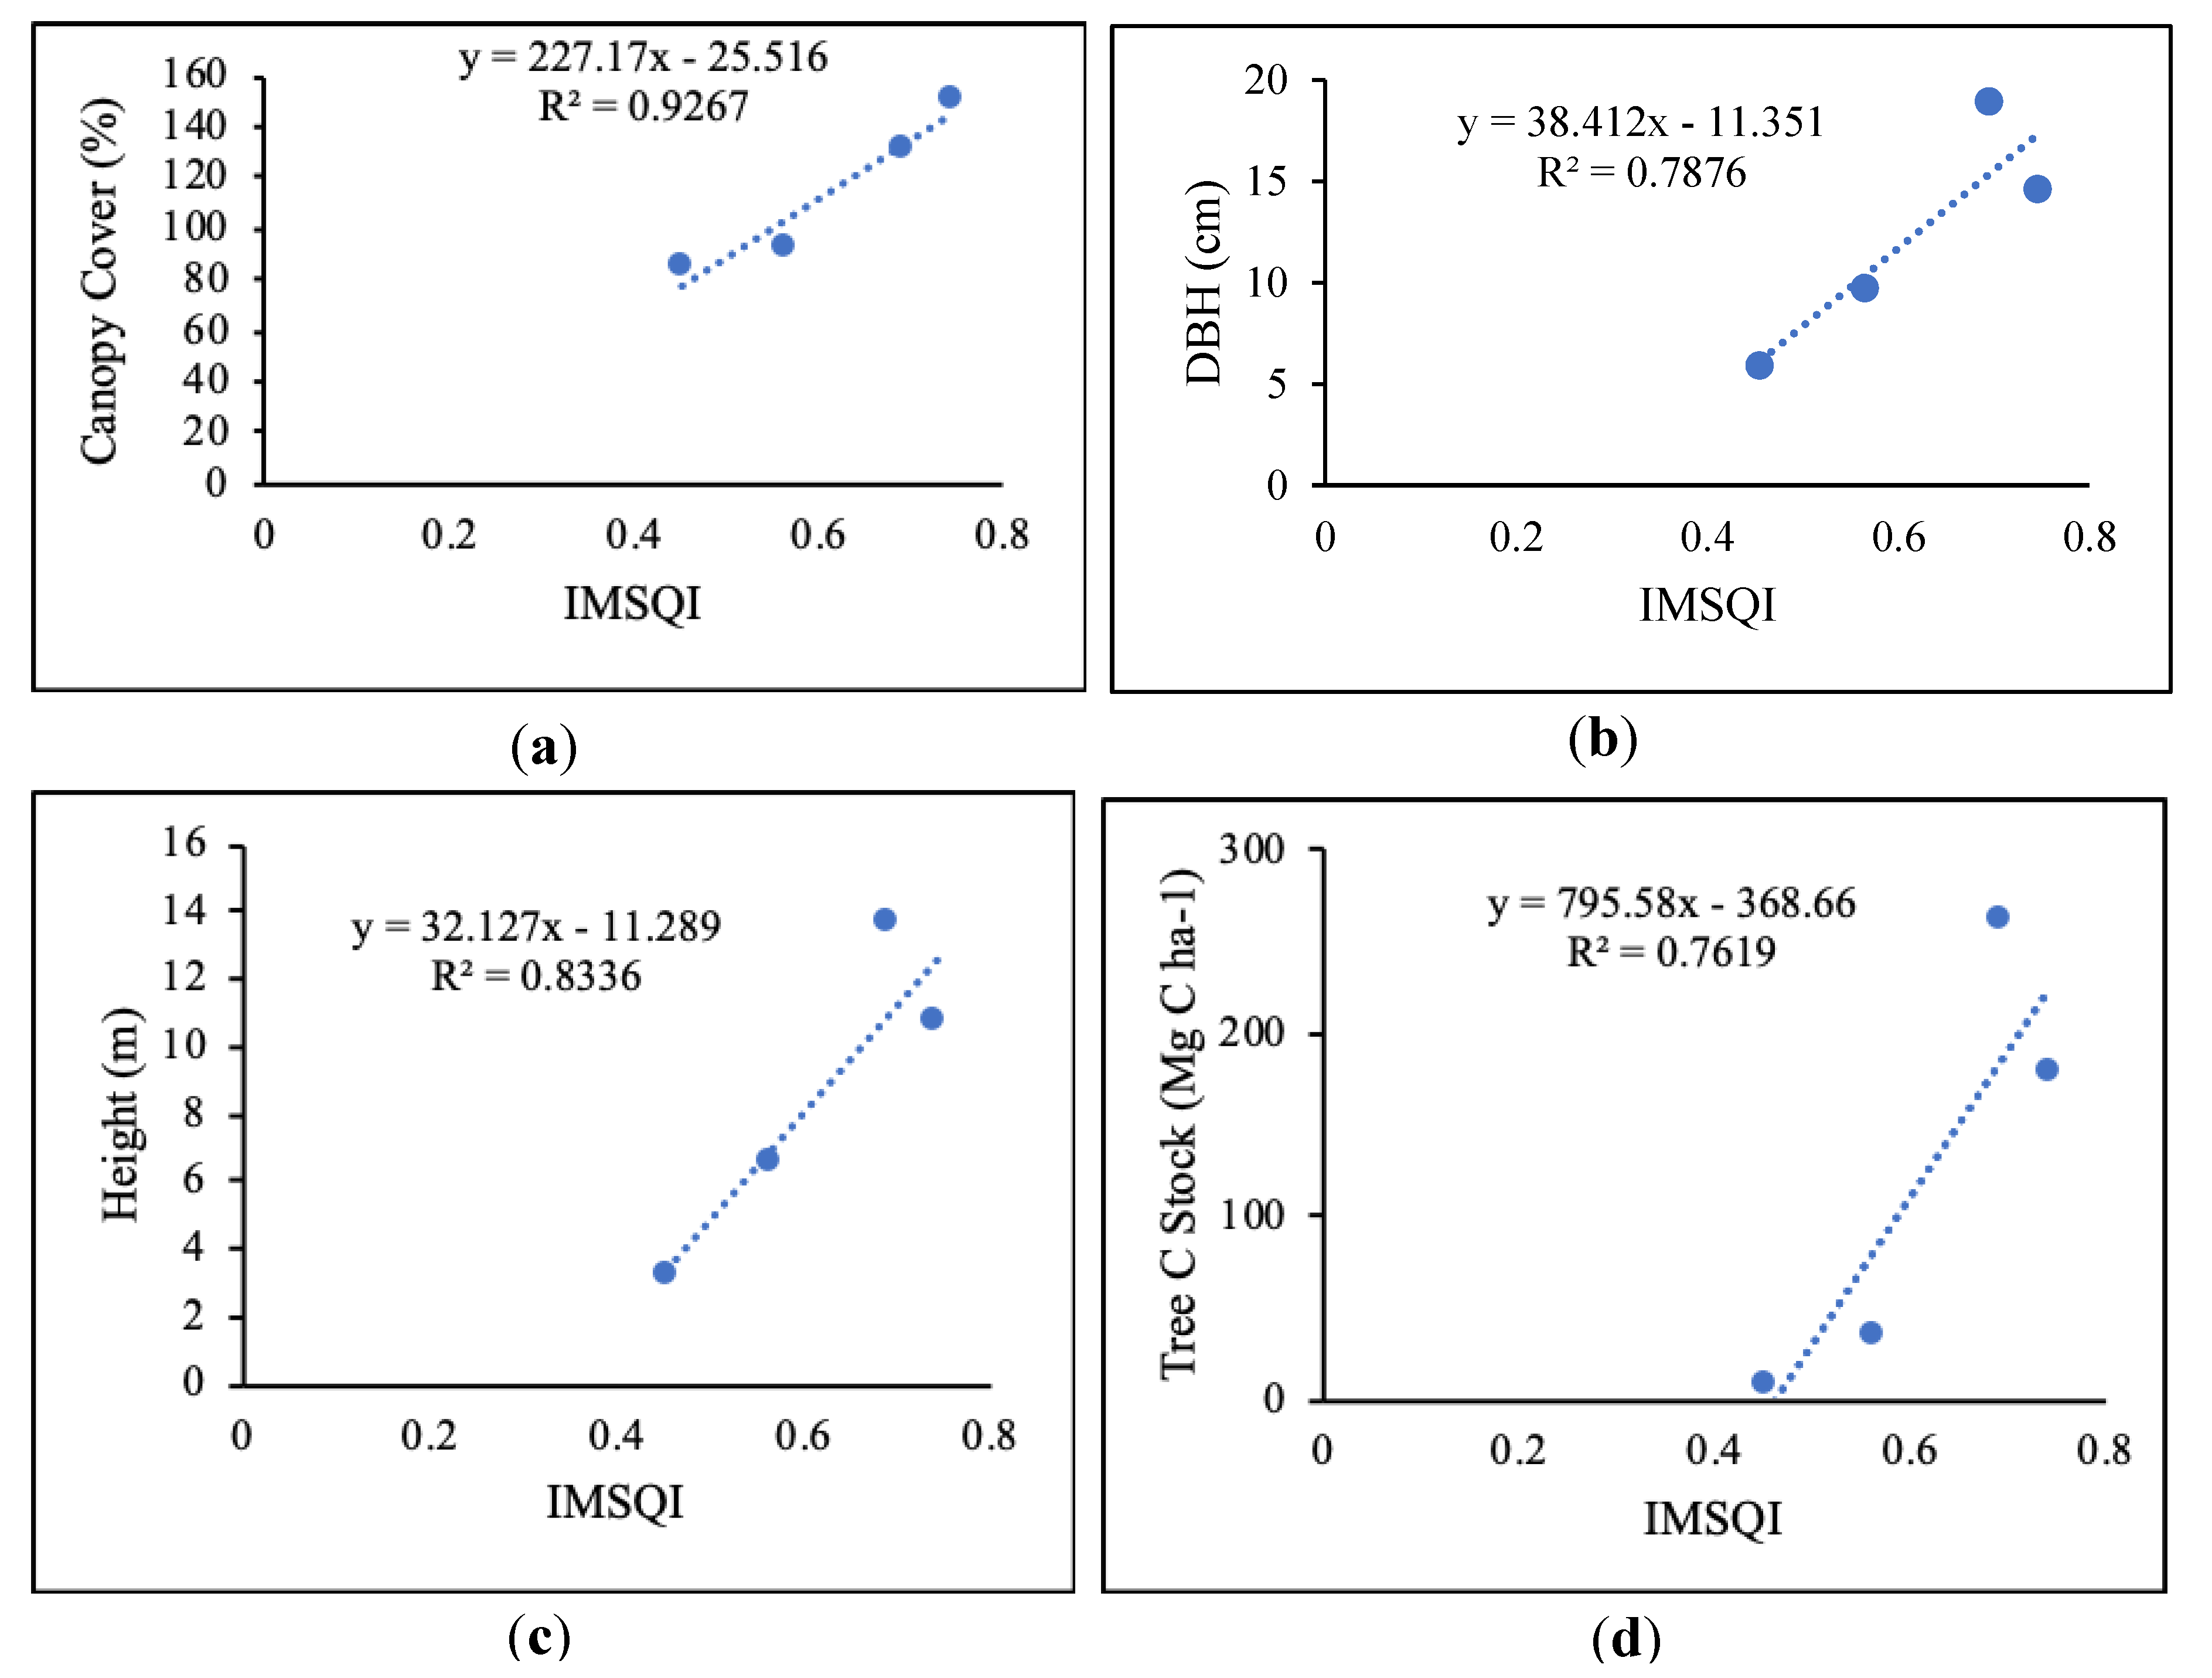
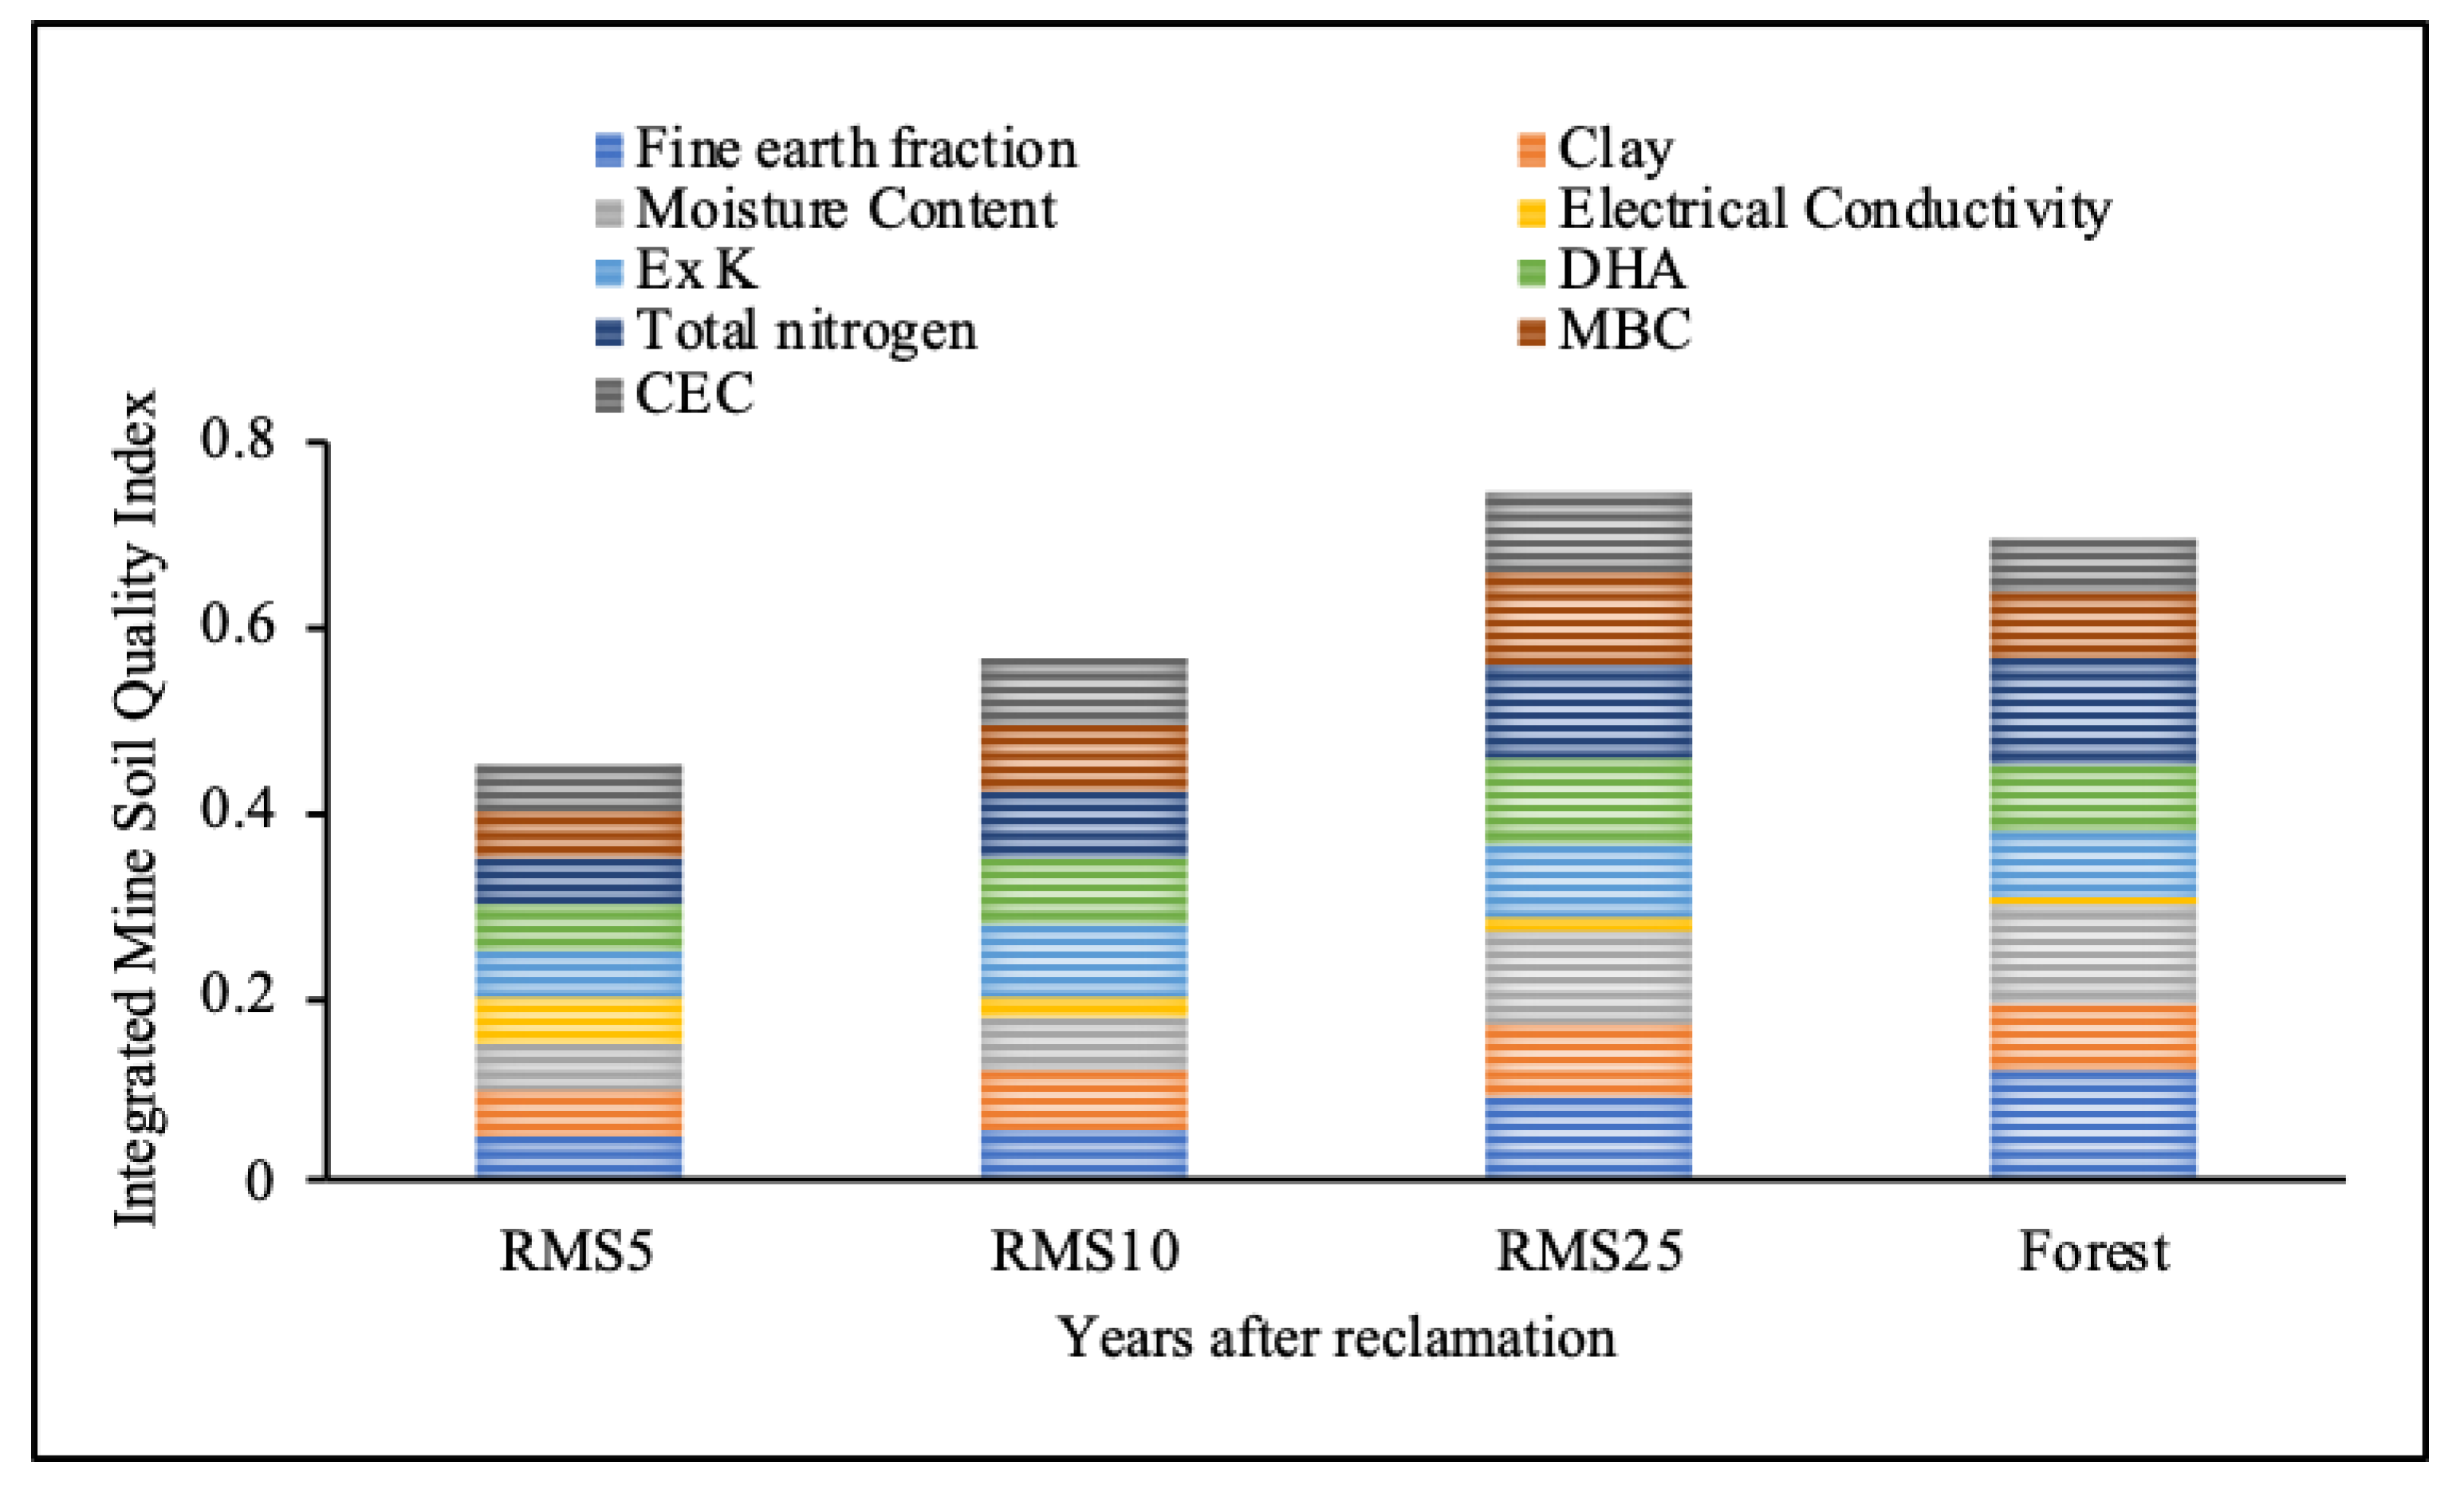
3.6. Identification of Key Soil Parameters and Estimation of Integrated Mine Soil Quality Index (IMSQI)

Integrated mine soil quality index was developed with 17 selected soil physiochemical and biological characteristics as total data set (TDS) and subjected to PCA to define crucial soil properties. In this work, three PCs with eigenvalue ≥ 1 explained 93.83% of the total variance in the total dataset (TDS) that was analyzed for the estimation of IMSQI (Table 8). PC-1 explained 25.56% of the total variance in the TDS with a high factor loading for organic carbon, CEC and MBC. MBC had the highest loading (0.936) and was significantly (p < 0.05) correlated with the other high factor loading variable under PC-1 (Table 9). As MBC had the highest loaded factor, MBC opted for the MDS (minimum dataset). However, relying on a single soil parameter, formulation of IMSQI has not been preferred [39]. Thus, the soil characteristic with the next highest loading factor, CEC in this case, was selected to complete the MDS. PC-2 explained 16.36% of the total variance in the TDS and showed a high loading factor for EC and total nitrogen, therefore, both were selected for the MDS. PC-3 explained 14.83% of the variance in the TDS and showed high loading factor for exchangeable potassium and DHA. PC-4 explained 13.99% of the variance in the TDS and showed high factor loading for fine earth fraction and bulk density. Similarly, as PC-1, only the highest loaded factor (fine earth fraction) was selected for the MDS. PC-5 and PC-6 explained 12% and 11% of the variance in the TDS and showed high factor loading for clay and moisture content, respectively. Overall, the high loaded variables from the PCs were selected for MDS, which were MBC, CEC, EC, total nitrogen, exchangeable potassium, DHA, fine earth fraction, clay and moisture content.
The percentage of variance explained by the respective PCs determined the weight of the loaded variable chosen for the MDS. The weight was divided evenly if more than one variable had significant loading under the single PC and was correlated with each other. When the variables were not correlated with each other, all the parameters were given the full weight. By normalizing the weight between 0 and 1, the final IMSQI was determined as follows:
IMSQI = 0.2725 × S (MBC + CEC) + 0.1743 × S (EC + TN) + 0.1580 × S (Ex K + DHA) + 0.1492 × S (FE) + 0.1284 × S (Clay) + 0.1174 × S (MC)
Regression analysis with various vegetation characteristics such as DBH, canopy cover, and height have been conducted in order to validate the IMSQI. The DBH (R2 = 0.79), canopy cover (R2 = 0.93), height (R2 = 0.83) and tree carbon stock (R2 = 0.76) of plant species are strongly correlated to the IMSQI (Figure 4). The functional utility of the IMSQI is confirmed by these regression results. The IMSQI observed for the 25-year-old site (0.746) is higher than that of the reference forest (0.695) to some extent, suggesting soil recovery with time.
The IMSQI obtained using the PCA is presented in Figure 5, where the influence of each soil indicator parameter on estimated IMSQI is also shown. The calculated IMSQI varied from 0.455 in 5-year-old reclaimed dump to 0.746 in 25-year-old reclaimed dump and compared with natural forest where IMSQI value obtained as 0.695. However, in the present study, PCA was used for development of IMSQI which is also indicating the improvement of mine soil quality with increasing age of reclamation.

4. Discussion

4.1. Effect of Revegetation in Recuperation of Soil Quality

Revegetation plays a significant role in mine spoil reclamation as it alters soil properties and accelerates soil development (pedogenesis) by providing biomass (AGB and BGB) to soil. The present study analyzed the effect of revegetation in enhancement of post-mining ecosystem development through age chronosequence approach. Mine spoil (OB materials) exhibits a high coarse fraction (i.e., high rock contents and boulders) that is regraded during technical reclamation, while natural forest soils contain higher fine earth fractions due to their geological formation. Moreover, the bulk density and fine earth fraction play a significant role in the estimation of carbon accumulation and nutrient stock in Technosols. Lower fine earth fraction in RMS (Technosols) could be due to translocation of topsoil during mining and mixing of mine spoil excavated from various depths. Several studies have reported high coarse fraction in reclaimed site [49] that decreases with increasing revegetation age [11]. Due to frequent movement of heavy machineries for levelling of dump surface and land preparation in reclamation, mine soils become compacted, leading to low soil moisture and high bulk density [50]. As the mine soils are pedogenically young and composed of unaltered spoil materials, they exhibit low moisture content at the early reclamation stage, but it was significantly higher (p < 0.05) in RMS25 (13.73%). In agreement with other studies, soil bulk densities decreased with increasing reclamation age in this work [39,50,51,52,53,54]. The interaction between soil macrofauna (e.g., earthworm) and rhizospheric activities (e.g., root penetration) could be one of the reasons behind decreasing bulk density with increasing reclamation age. In alignment with the pertaining literature, silt and clay content in RMS significantly increased, while coarse sand percentage decreased [14,54]—becoming more identical to the reference forest soils. During the early stage of afforestation, the observed lower WHC could be due to the higher coarse fraction when compared to the 25 years results. In ecological restoration, pH plays a significant function as a controlling factor of plant nutrients availability. Fertile topsoil application [2,48], plant litter decomposition, carbonate rich OB materials and the type of parent rock may alter pH of mine soil. This study showed slightly alkaline pH that was higher than that of natural forest soils. The significant difference between Technosol and forest pH could be due to presence of quartzite rocks as underlying parent material of the study area. This is in tune with the findings of Liu et al. [4]; Yuan et al. [55]; Ganjegute et al. [56]; Juwarkar et al. [57]; Ahirwal et al. [58].
Most of the selected soil properties were closely linked to the revegetation age, indicating that the afforestation approach is successful for mine soil quality. The derelict mine site has been subjected to different biochemical and biological changes that affect the mine soil functions. Moreover, the evaluation of microbial activity is also important to quantify mine soil development and ecosystem functions [59]. There was a 173% and 157% increase in SOC and TN concentration after 25 years of revegetation that may be due to higher litterfall, dominance of high N-fixing plant species (C. siamea, D. sissoo for present study) and microbial degradation. Mukhopadhyay and Masto [49] reported the development of carbon pool of RMS of tropical climate and found a linear increase in SOC stock with increasing reclamation age. The 2.8-fold increase in SOC after 25 years of revegetation could be due to the tree growth and organic matter input to the studied soil. The variation in SOC concentration at reclaimed mine soil could also be related to the uneven distribution of coal particles in mine spoils. Generally, mine soils are devoid of soil nutrients, but reclamation activities have the aptitude to reduce the loss of soil nutrients (N, P, K) explaining why N, P, K concentration increased with greater reclamation age [4]. In this work, N (65.9 mg/kg), P (0.39 mg/kg), and K (45.35 mg/kg) concentrations were much smaller after 5 years of reclamation. Yet, after 25 years their levels become sufficient to support plant growth. Similar findings were reported by Kumar et al. [51]; Tripathi et al. [60] and Mukhopadhyay et al. [14] in coal mine reclaimed OB dump under analogous climatic conditions. Das and Mondal [61] also reported N, P, and K concentrations as the major limiting nutrients in mining regions that returned through litter deposition, highlighting their vital role in soil health and tree growth. Alike other reports [9,39,62], soil DHA and MBC enhanced up to 128% and 368% after 5 to 25 years of afforestation, respectively, as a consequence of the nature of substrate, vegetation types and microbial activity.

4.2. Accretion of Carbon (C) and Total Nitrogen (TN) Stock

Soil serves as a reservoir of nutrients and microorganisms in terrestrial ecosystems [63]. During surface mining, nutrient stocks are drastically reduced, resulting in ecological destruction [19]. Accretion of SOC and TN stock in mine soil may act as indicator of ecosystem reestablishment. The SOC and TN stock in RMS 5 were only 28.73% and 22.55%, respectively, of those found in reference forest soils. These figures slowly approached the forest site levels with increasing reclamation age. Development of SOC and TN stock in RMS with age could be due to litter decomposition, biomass productivity and weathering of parent materials. This finding is in agreement with the result of Tripathi et al. [64]; Ahirwal and Maiti [11]. In addition, aligned with other studies [11,65], the accumulation of SOC stock in RMS 5 was found at a rate of 1.8 Mg C ha−1 year−1. The same outcome has been observed in other countries. For instance, in China, Yuan et al. [66] found SOC accumulation at a rate of 0.2–2.8 Mg C ha−1 year−1 in 22–25-year-old RMS. In Poland, Pietrzykowski and Krzaklewski [67] reported accumulation of SOC at a rate of 1.5 Mg C ha−1 year−1 in mine soil. The accumulation rate of SOC can differ with vegetation cover, reclamation age, and environmental conditions. After 25 years of afforestation, this study exhibited a significant amount of SOC stock in RMS. A higher rate of SOC sequestration in RMS 25 suggests that the revegetated ecosystem accumulates more CO2 in a short time span, thereby helping to balance increased CO2 in environment.

4.3. Ecosystem Carbon (C) Pool

The removal of forest cover prior to surface mining and the eventual afforestation on backfilled dump are the major mechanisms liable for the changes in C pool of ecosystems from mining regions. In this study, ecosystem C pool of afforested and natural forest site was found in the order of RMS 5 < RMS 10 < RMS 25 < Forest. RMS 5 sequestered only 6.2% of reference forest carbon pool, while RMS 10 and RMS 25 sequestered 19% and 52.4%, respectively. Similarly, in another study conducted by Avera et al. [68], 21 years of reclamation of a mine site in the USA showed 42% recovery of the ecosystem C pool compared to the forest site. In terms of equivalent CO2 sequestered, reference forest sequestered 1077.25 Mg CO2 ha−1 followed by RMS 25 (564.81 Mg CO2 ha−1) > RMS 10 (205.85 Mg CO2 ha−1) > RMS 5 (66.68 Mg CO2 ha−1). Therefore, the accumulation of ecosystem carbon pool in RMS occurred at a rate of 6.2 Mg C ha−1 year−1. Under similar environmental conditions, Tripathi et al. [64] recorded that in a 4-year-old RMS, the ecosystem carbon pool sequestered at a rate of 4.87 Mg C ha−1 year−1. In another study carried out by Pietrzykowski and Daniels [69], it was reported that the ecosystem sequestered carbon at a rate of 1.6–5.6 Mg C ha−1 year−1 at an afforested (pine plantation) post-mining site in Poland. In 25 years of reclamation of a mine site in the USA, Shrestha and Lal [19] reported the improvement of ecosystem C pool at a rate of 5.10 Mg C ha−1 year−1. In an Indian tropical environment, the annual accumulation of carbon in revegetated mine spoil was reported as 3.64 Mg C ha−1 year−1 [65]. Thus, revegetation of backfilled dumps enhances the carbon accumulation potential of ecosystem and persists as a dominant carbon sink throughout reclamation.
Contribution of different ecosystem components to the ecosystem C pool of reclaimed chronosequence sites varies significantly due to revegetation age, heterogeneity of plant species, nature of substrate and climatic conditions. Concerning the ecosystem C pool in each revegetated site, tree biomass (AGB + BGB) C contributes with the highest C stock, followed by SOC and litter C. In the forest ecosystem, maximum (88.7%) C stock was provided by plant biomass, followed by SOC (10.8%) and litter C (0.43%). The percentage of contribution of plant biomass C, SOC and litter C to the ecosystem C pool of RMS 5, RMS 10 and RMS 25 are 46%, 50%, 4%; 63%, 34%, 2%; 72.4%, 26.8%, 0.73%, respectively. The RMS 25 displayed 52.4% recovery of the total forest ecosystem C pool. In terms of equivalent CO2 sequestration, RMS 25 sequestered 564.81 Mg CO2 ha−1, which is 1.91-fold lower than the forest ecosystem (1077.25 Mg CO2 ha−1).

4.4. Integrated Mine Soil Quality Index (IMSQI)–Tool to Evaluate Restoration Success

Evaluation of ecological restoration success in the context of soil functionality usually requires the assessment of soil properties as it is interconnected with the soil capability to function suitably as a part of a healthy ecosystem. IMSQI based upon combination of mine soil properties may therefore provide a clear estimation of reclamation success. In this regard, several reclamationists emphasized the implementation of ordination technique (PCA, RDA, CCA) to evaluate the relationship between soil biota development with plant succession in post-mining degraded sites to determine reclamation success [70,71,72]. In addition, an IMSQI is important for comparative analysis of soil quality amongst reclaimed chronosequence dumps. In order to explain mine soil quality, there are very few indices that have been suggested by researchers [39,43,45]. Depending upon IMSQI, soil properties in the RMS 25 improved among the chronosequence afforested sites, suggesting the beneficial effect of revegetation on the recovery of soil quality. Different parameters of soil quality were also reported by several authors under different land uses. For instance, Mukhopadhyay et al. [39] reported that pH, coarse fraction, SOC, EC, DHA, calcium, P, and sulphur were the best parameters to evaluate RMS quality. In another study, Zhao et al. [73] found that soil bulk density, field capacity, organic matter, available nitrogen and total microbial population were appropriate to investigate RMS development with reclamation age under revegetation with Hippophae rhamnoides ssp. sinensis (Sea buckthorn) in Pingshuo opencast coal mine in Shanxi, China. It has been reported that it usually takes 20 years or more for disturbed soils to reach the levels of native soils in semiarid mined lands.
As a larger IMSQI value is an indicator of successful mine soil reclamation, therefore, it is proposed that eco-restored mine sites with an IMSQI of >0.500 should be considered as ecologically sustainable post-mining land, where adequate reclamation strategies have been adopted. The reclamation age was found to have a significant effect on the microbial and nutritional properties of the mine soils. Therefore, the IMSQI, calculated based on the soil indicator parameters such as fine earth fraction, moisture content, exchangeable potassium, total nitrogen, cation exchange capacity, clay content, electrical conductivity, dehydrogenase activity and microbial biomass carbon, could be used as a model for evaluating the progress of the reclamation. The significant correlation between the IMSQI and vegetation characteristics (canopy, tree height, DBH, and tree C stock) in post-mining ecosystems, highlights the influence of tree species on mine soil quality. This IMSQI can be extended to other mining sites, but validation for each site is suggested.

5. Conclusions

Regeneration of secondary forest through plantation of fast-growing tree species showed substantial development in soil quality. Soil properties (physico-chemical and biological) of chronosequence revegetated dump sites were estimated to evaluate the improvement of mine soil and the corresponding sustainable and successful reclamation. The post-mining ecosystem after 25 years of reclamation exhibits potential to sequester 153.9 Mg C ha−1, suggesting that afforestation of post-mining sites is a promising tool to enhance carbon sequestration and to balance the adverse effects of global warming. PCA-based integrated mine soil quality index showed that the main soil indicator parameters were MBC, CEC, EC, total nitrogen, exchangeable potassium, DHA, fine earth fraction, clay and moisture content. The IMSQI increased with increasing revegetation age. The IMSQI in the 25-year-old revegetated site suggests a recovery of soil quality comparable to that of the undisturbed reference forest site. Besides assessing the reclamation status of the mine soil, this indexing approach can be useful as a tool for selection of plant species and role of amendments on the improvement of soil functions, to meet the desired eco-restoration goals.

Author Contributions

S.K.M. and M.P. designed the research; S.B. performed experiments and analyzed data; S.B. and S.K.M. drafted the initial manuscript; L.A.B.N., M.P. and S.K.M. revised and approved the manuscript. All authors gave final approval for publication. All authors have read and agreed to the published version of the manuscript.

Funding

This research received no external funding.

Acknowledgments

The authors would like to thank the Indian Institute of Technology (Indian School of Mines) Dhanbad for providing research facilities and Northern Coalfields Limited (NCL) Singrauli for providing sites to study. S. Bandyopadhyay acknowledges the Research Fellowship funded by the Ministry of Human Resource Development (MHRD).

Conflicts of Interest

The authors declare no conflict of interest.

References

  1. Central Electricity Authority (CEA). Annual Report 2018–2019. Available online: http://www.cea.nic.in/reports/annual/annualreports/annual_report-2019.pdf (accessed on 5 October 2020).
  2. Rivas-Pérez, I.M.; Fernández-Sanjurjo, M.J.; Núñez-Delgado, A.; Monterroso, C.; Macías, F.; Álvarez-Rodríguez, E. Evolution of chemical characteristics of Technosols in an afforested coal mine dump over a 20-year period. Land Degrad. Dev. 2016, 27, 1640–1649. [Google Scholar] [CrossRef]
  3. Józefowska, A.; PietrzykowskiM, W.B.; Cajthaml, T.; Frouz, J. Theeffects of tree species and substrate on carbon sequestration andchemical and biological properties in reforested post-mining soils. Geoderma 2017, 292, 9–16. [Google Scholar] [CrossRef]
  4. Liu, X.; Bai, Z.; Zhou, W.; Cao, Y.; Zhang, G. Changes in soil properties in the soil profile after mining and reclamation in an opencast coalmine on the loess plateau, China. Ecol. Eng. 2017, 98, 228–239. [Google Scholar] [CrossRef] [Green Version]
  5. Ličina, V.; Akšić, M.F.; Tomić, Z.; Trajković, I.; Mladenović, S.A.; Marjanović, M.; Rinklebe, J. Bioassessment of heavy metals in the surface soil layer of an opencast mine aimed for its rehabilitation. J. Environ. Manag. 2017, 186, 240–252. [Google Scholar] [CrossRef] [PubMed]
  6. Ministry of Coal, Government of India. Report of the Working Group on Coal and Lignite for Formulation of 11th Five-Year Plan (2007–2012). Available online: https://niti.gov.in/planningcommission.gov.in/docs/aboutus/committee/wrkgrp11/wg11_coal.doc (accessed on 5 October 2020).
  7. IPCC Intergovernmental Panel on Climate Change (IPCC). IPCC Guidelines for National Greenhouse Gas Inventories; Intergovernmental Panel on Climate Change, NGGIP Publications, IGES: Japan, 2006; Available online: https://www.ipcc-nggip.iges.or.jp/meeting/pdfiles/Washington_Report.pdf (accessed on 11 October 2020).
  8. Ussiri, D.A.N.; Lal, R.; Jacinthe, P.A. Soil properties and carbon sequestrationof afforested pastures in reclaimed minesoils of Ohio. Soil Sci. Soc. Am. J. 2006, 70, 1797–1806. [Google Scholar] [CrossRef]
  9. Ahirwal, J.; Maiti, S.K.; Singh, A.K. Changes in ecosystem carbon pool and soil CO2flux following post-mine reclamation in dry tropical environment, India. Sci Total Environ. 2017, 583, 153–162. [Google Scholar] [CrossRef]
  10. Yuan, Y.; Ren, Y.; Gao, G.; Zhao, Z.; Niu, S. Intra-and Interspecific Interactions among Pioneer Trees Affect Forest-Biomass Carbon Accumulation in a Nutrient-Deficient Reclaimed Coal Mine Spoil. Forests 2020, 11, 819. [Google Scholar] [CrossRef]
  11. Ahirwal, J.; Maiti, S.K. Assessment of carbon sequestration potential of revegetated coal mine overburden dumps: A chronosequence study from dry tropical climate. J. Environ. Manag. 2017, 201, 369–377. [Google Scholar] [CrossRef]
  12. Karan, S.K.; Samadder, S.R.; Maiti, S.K. Assessment of the capability of remotesensing and GIS techniques for monitoring reclamation success in coal mine degraded lands. J. Environ. Manag. 2016, 182, 272–283. [Google Scholar] [CrossRef]
  13. Quinkenstein, A.; Jochheim, H. Assessing the carbon sequestration potential of poplar and black locust short rotation coppices on mine reclamation sites in Eastern Germanye Model development and application. J. Environ. Manag. 2016, 168, 53–66. [Google Scholar] [CrossRef]
  14. Pietrzykowski, M. Soil quality index as a tool for Scots pine (Pinus sylvestris) monoculture conversion planning on afforested, reclaimed mine land. J. For. Res. 2014, 25, 63–74. [Google Scholar] [CrossRef]
  15. Feng, Y.; Wang, J.; Bai, Z.; Reading, L. Effects of surface coal mining and land reclamation on soil properties: A review. Earth Sci. Rev. 2019, 191, 12–25. [Google Scholar] [CrossRef]
  16. Sena, K.; Agouridis, C.; Miller, J.; Barton, C. Spoil type influences soil genesis and forest development on an Appalachian surface coal mine ten years after placement. Forests 2018, 9, 780. [Google Scholar] [CrossRef] [Green Version]
  17. Mukhopadhyay, S.; Maiti, S.K.; Masto, R.E. Development of Mine Soil Quality Index (MSQI) for evaluation of reclamation success: A chronosequence study. Ecol. Eng. 2014, 71, 10–20. [Google Scholar] [CrossRef]
  18. Chodak, M.; Niklinska, M. Effect of texture and tree species on microbialproperties of mine soils. Appl. Soil Ecol. 2010, 46, 268–275. [Google Scholar] [CrossRef]
  19. Shrestha, R.K.; Lal, R. Carbon and nitrogen pools in reclaimed landunder forest and pasture ecosystems in Ohio, USA. Geoderma 2010, 157, 196–205. [Google Scholar] [CrossRef]
  20. Ahirwal, J.; Kumar, A.; Pietrzykowski, M.; Maiti, S.K. Reclamation of coal mine spoil and its effect on Technosol quality and carbon sequestration: A case study from India. Environ. Sci. Pollut. Res. 2018, 25, 27992–28003. [Google Scholar] [CrossRef]
  21. Johnson, C.D.; Skousen, J.G. Minesoil properties of 15 abandoned mine land sites in West Virginia. J. Environ. Qual. 1995, 24, 635–643. [Google Scholar] [CrossRef]
  22. Indian Standards: 2720. In Grain Size Analysis; Part IV; Indian Standard Institute: New Delhi, India, 1985.
  23. Dakshinamurthi, C.; Gupta, R.P. Practicals in Soil Physics; IARI: New Delhi, Indian, 1968. [Google Scholar]
  24. Piper, C.S. Soil and Plant Analysis; Hans Publishers: Bombay, Mumbai, 1966. [Google Scholar]
  25. Blake, G.R.; Hartge, K.H. Bulk density. In Methods of Soil Analysis. Part 1—Physical and Mineralogical Methods, 2nd ed.; Klute, A., Ed.; SSSA Book Series 5; American Society of Agronomy, Soil Science Society of America: Madison, WI, USA, 1986. [Google Scholar] [CrossRef]
  26. Jackson, M.L. Soil Chemical Analysis; PHI Pvt. Ltd.: New Delhi, India, 1973; pp. 183–197. [Google Scholar]
  27. Olsen, S.R.; Sommer, L.E. Phosphorus. In Methods of Soil Analysis, Part 2; Page, A.L., Ed.; SSSA: Madison, WI, USA, 1982; pp. 403–430. [Google Scholar]
  28. Nelson, D.W.; Sommers, L.E. Total carbon, organic carbon, and organic matter. In Methods of Soil Analysis. Part 3, Chemical Methods, 3rd ed.; Sparks, D.L., Ed.; SSSA Book Series 5; ASA and SSSA: Madison, WI, USA, 1996; pp. 961–1010. [Google Scholar] [CrossRef]
  29. Subbiah, B.V.; Asija, G.L. A rapid procedure for the determination of availablenitrogen in soils. Curr. Sci. 1956, 25, 259–260. [Google Scholar]
  30. Casida, L.E., Jr.; Klein, D.A.; Santoro, T. Soil dehydrogenase activity. Soil Sci. 1964, 98, 371–376. [Google Scholar] [CrossRef]
  31. Vance, E.D.; Brookes, P.C.; Jenkinson, D.S. An extraction method for measuring soil microbial biomass C. Soil Biol. Biochem. 1987, 19, 703–707. [Google Scholar] [CrossRef]
  32. Chatterjee, A.; Lal, R.; Shrestha, R.K.; Ussiri, D.A.N. Soil carbon pools of reclaimed minesoils under grass and forest landuses. Land Degrad. Dev. 2009, 20, 300–307. [Google Scholar] [CrossRef]
  33. Brown, S.; Gillespie, A.; Lugo, A.E. Biomass estimation methodsfor tropical forests with applications to forest inventory data. For. Sci. 1989, 35, 881–902. [Google Scholar] [CrossRef]
  34. Lodhiyal, L.S.; Singh, R.P.; Singh, S.P. Structure and function of anage series of poplar plantations in central Himalaya: I dry matterdynamics. Ann. Bot. 1995, 76, 191–199. [Google Scholar] [CrossRef]
  35. Chave, J.; Andalo, C.; Brown, S.; Cairns, M.A.; Chambers, J.Q.; Eamus, D.; Fölster, H.; Fromard, F.; Higuchi, N.; Kira, T.; et al. Treeallometry and improved estimation of carbon stocks and balancein tropical forests. Oecologia 2005, 145, 87–99. [Google Scholar] [CrossRef]
  36. Socha, J.; Wezyk, P. Allometric equations for estimating the foliagebiomass of Scots pine. Eur. J. For. Res. 2007, 126, 263–270. [Google Scholar] [CrossRef]
  37. Pietrzykowski, M.; Socha, J. An estimation of Scots pine (Pinus sylvestris L.) ecosystem productivity on reclaimed post-miningsites in Poland (central Europe) using of allometric equations. EcolEng 2011, 37, 381–386. [Google Scholar] [CrossRef]
  38. Chave, J.; Réjou-Méchain, M.; Búrquez, A.; Chidumayo, E.; Colgan, M.S.; Delitti, W.B.; Duque, A.; Eid, T.; Fearnside, P.M.; Goodman, R.C.; et al. Improved allometric models to estimate the abovegroundbiomass of tropical trees. Glob. Chang. Biol. 2014, 20, 3177–3190. [Google Scholar] [CrossRef]
  39. Mukhopadhyay, S.; Masto, R.E.; Yadav, A.; George, J.; Ram, L.C.; Shukla, S.P. Soil quality index for evaluation of reclaimed coal minespoil. Sci. Total Environ. 2016, 542, 540–550. [Google Scholar] [CrossRef]
  40. IPCC. Intergovernmental panel on climate change 2000. In Land Use, Land Use Change and Forestry; Special Report; Cambridge Univ. Press: Cambridge, UK, 2000. [Google Scholar]
  41. FAO. Global Forest Resources Assessment 2005. Global Assessment of Growing Stock, Biomass and Carbon Stock. Available online: www.fao.org/docrep/013/i1757e/i1757e.pdf (accessed on 11 October 2020).
  42. Vasu, D.; Singh, S.K.; Ray, S.K.; Duraisami, V.P.; Tiwary, P.; Chandran, P.; Nimkar, A.M.; Anantwar, S.G. Soil quality index (SQI) as a toolto evaluate crop productivity in semi-arid Deccan plateau, India. Geoderma 2016, 282, 70–79. [Google Scholar] [CrossRef]
  43. Masto, R.E.; Chhonkar, P.K.; Singh, D.; Patra, A.K. Alternative soil quality indicesfor evaluating the effect of intensive cropping, fertilization and manuring for 31years in the semi-arid soils of India. Environ. Monit. Assess. 2008, 136, 419–435. [Google Scholar] [CrossRef] [PubMed]
  44. Andrews, S.S.; Carroll, C.R. Designing a soil quality assessment tool for sustainable agroecosystem management. Ecol. Appl. 2001, 11, 1573–1585. [Google Scholar] [CrossRef]
  45. Andrews, S.S.; Karlen, D.L.; Mitchell, J.P. A comparison of soil quality indexing methods for vegetable production systems in northern California. Agric. Ecosyst. Environ. 2002, 90, 25–45. [Google Scholar] [CrossRef]
  46. Society for Ecological Restoration International Science & Policy Working Group. The SER International Primer on Ecological Restoration; Society for Ecological Restoration International: Tucson, AZ, USA, 2004; Available online: http://www.ser.org/pdf/primer3.pdf (accessed on 11 October 2020).
  47. Macdonald, S.E.; Landhäusser, S.M.; Skousen, J.; Franklin, J.; Frouz, J.; Hall, S.; Jacobs, D.F.; Quideau, S. Forest restoration following surface mining disturbance:challenges and solutions. New For. 2015, 46, 703–732. [Google Scholar] [CrossRef] [Green Version]
  48. Qu, J.F.; Hou, Y.L.; Ge, M.Y.; Wang, K.; Liu, S.; Zhang, S.L.; Li, G.; Chen, F. Carbon dynamics of reclaimed coal mine soil under agriculturaluse: A chronosequence study in the dongtan mining area, Shandong Province, China. Sustainability 2017, 9, 629. [Google Scholar] [CrossRef] [Green Version]
  49. Mukhopadhyay, S.; Masto, R.E. Carbon storage in coal mine spoil by DalbergiasissooRoxb. Geoderma 2016, 84, 204–213. [Google Scholar] [CrossRef]
  50. Shrestha, R.K.; Lal, R. Changes in physical and chemical properties of soil after surface mining and reclamation. Geoderma 2011, 161, 168–176. [Google Scholar] [CrossRef]
  51. Kumar, S.; Maiti, S.K.; Chaudhuri, S. Soil development in 2–21 years old coalmine reclaimed spoil with trees: A case study from Sonepur-Bazari opencast project, Raniganj Coalfield, India. Ecol. Eng. 2015, 84, 311–324. [Google Scholar] [CrossRef]
  52. Mukhopadhyay, S.; Maiti, S.K. Trace metal accumulation and naturalmycorrhizal colonisation in an afforested coalmine overburden dump—Acase study from India. Int. J. Min. Reclam. Environ. 2011, 25, 187–207. [Google Scholar] [CrossRef]
  53. Ahirwal, J.; Maiti, S.K. Assessment of soil properties of different land uses generated due to surface coal mining activities in tropical Sal (Shorea robusta) forest, India. Catena 2016, 140, 155–163. [Google Scholar] [CrossRef]
  54. Lei, H.; Peng, Z.; Yigang, H.; Yang, Z. Vegetation and soil restoration in refuse dumps from open pit coal mines. Ecol. Eng. 2016, 94, 638–646. [Google Scholar] [CrossRef]
  55. Yuan, Y.; Zhao, Z.; Niu, S.; Li, X.; Wang, Y.; Bai, Z. Reclamation promotes the succession of the soil and vegetation in opencast coal mine: A case study from Robiniapseudoacacia reclaimed forests, Pingshuo mine, China. Catena 2018, 165, 72–79. [Google Scholar] [CrossRef]
  56. Ganjegunte, G.K.; Wick, A.F.; Stahl, P.D.; Vance, G.F. Accumulation and compositionof total organic carbon in reclaimed coal mine lands. Land Degrad. Dev. 2009, 20, 156–175. [Google Scholar] [CrossRef]
  57. Juwarkar, A.A.; Mehrotraa, K.L.; Nair, R.; Wanjari, T.; Singh, S.K.; Chakrabarti, T. Carbon sequestration in reclaimed manganese mine land at Gumgaon, India. Environ. Monit. Assess. 2010, 160, 457–464. [Google Scholar] [CrossRef] [PubMed]
  58. Ahirwal, J.; Kumar, A.; Maiti, S.K. Effect of Fast-Growing Trees on Soil Properties and Carbon Storage in an Afforested Coal Mine Land (India). Minerals 2020, 10, 840. [Google Scholar] [CrossRef]
  59. Zhao, Z.; Shahrour, I.; Bai, Z.; Fan, W.; Feng, L.; Li, H. Soils development in opencast coal mine spoils reclaimed for 1–13 years in the West-Northern Loess Plateau of China. Eur. J. Soil Biol. 2013, 55, 40–46. [Google Scholar] [CrossRef]
  60. Tripathi, N.; Singh, R.S.; Chaulya, S.K. Dump stability and soil fertility of a coalmine spoil in Indian dry tropical environment: A long-term study. Environ. Manag. 2012, 50, 695–706. [Google Scholar] [CrossRef]
  61. Das, C.; Mondal, N.K. Litter fall, decomposition and nutrient release of Shorearobusta and Tectona grandis in a sub-tropical forest of West Bengal, Eastern India. J. For. Res. 2016, 27, 1055–1065. [Google Scholar] [CrossRef]
  62. Banning, N.C.; Grant, C.D.; Jones, D.L.; Murphy, D.V. Recovery of soil organic matter, organic matter turnover and nitrogen cycling in a post-mining forest rehabilitation chronosequence. Soil Biol. Biochem. 2008, 40, 2021–2031. [Google Scholar] [CrossRef]
  63. Akala, V.A.; Lal, R. Soil organic carbon pools and sequestration rates in reclaimed mine soils in Ohio. J. Environ. Qual. 2001, 30, 2098–2104. [Google Scholar] [CrossRef]
  64. Tripathi, N.; Singh, R.S.; Hills, C.D. Soil carbon development in rejuvenated Indiancoal mine spoil. Ecol. Eng. 2016, 90, 482–490. [Google Scholar] [CrossRef]
  65. Tripathi, N.; Singh, R.S.; Nathanail, C.P. Mine spoil acts as a sink of carbon dioxide in Indian dry tropical environment. Sci. Total Environ. 2014, 468, 1162–1171. [Google Scholar] [CrossRef] [PubMed]
  66. Yuan, Y.; Zhao, Z.; Zhang, P.; Chen, L.; Hu, T.; Niu, S.; Bai, Z. Soil organic carbon and nitrogen pools in reclaimed mine soils under forest and cropland ecosystems in the Loess Plateau, China. Ecol. Eng. 2017, 102, 137–144. [Google Scholar] [CrossRef]
  67. Pietrzykowski, M.; Krzaklewski, W. Potential for carbon sequestration in reclaimed mine soil on reforested surface mining areasin Poland. Nat. Sci. 2010, 2, 1015–1021. [Google Scholar] [CrossRef]
  68. Avera, B.N.; Strahm, B.D.; Burger, J.A.; Zipper, C.E. Development of ecosystem structure and function on reforested surface-mined lands in the Central Appalachian Coal Basin of the United States. New For. 2015, 46, 683–702. [Google Scholar] [CrossRef]
  69. Pietrzykowski, M.; Daniels, W.L. Estimation of carbon sequestration by pine (Pinus sylvestris L.) ecosystems developed on reforested post-mining sites in Poland on differing mine soil substrates. Ecol. Eng. 2014, 73, 209–218. [Google Scholar] [CrossRef]
  70. Frouz, J.; Jílková, V.; Cajthaml, T.; Pižl, V.; Tajovský, K.; Háněl, L.; Burešová, A.; Šimáčková, H.; Kolaříková, K.; Franklin, J.; et al. Soil biota in post-mining sites along a climatic gradient in the USA: Simple communities in shortgrass prairie recover faster than complex communities in tallgrass prairie and forest. Soil Biol. Biochem. 2013, 67, 212–225. [Google Scholar] [CrossRef]
  71. Vicentini, F.; Hendrychova, M.; Tajovský, K.; Pižl, V.; Frouz, J. The Effect of Topography on Long-Term Spontaneous Development of Soil and Woody Cover on Graded and Untreated Overburden. Forests 2020, 11, 602. [Google Scholar] [CrossRef]
  72. Baldrian, P.; Trögl, J.; Frouz, J.; Šnajdr, J.; Valášková, V.; Merhautová, V.; Cajthaml, T.; Herinková, J. Enzyme activities and microbial biomass in topsoil layer during spontaneous succession in spoil heaps after brown coal mining. Soil Biol. Biochem. 2008, 40, 2107–2115. [Google Scholar] [CrossRef]
  73. Anderson, J.D.; Ingram, L.J.; Stahl, P.D. Influence of reclamation management practices on microbial biomass carbon and soil organic carbon accumulation in semiarid mined lands of Wyoming. Appl. Soil Ecol. 2008, 40, 387–397. [Google Scholar] [CrossRef]
Figure 1. (a) Location of the study area (Madhya Pradesh, India). (b) Location of different project in Singrauli coalfield. (c) Land degradation due to dumping of overburden dumps created by draglines in the project.
Forests 11 01310 g001
Figure 2. (a) Distant view of land degradation caused by opencast mining. (b) Distant view of reclaimed dump. (c) Reclaimed overburden (OB) dump after 5 years of plantation. (d) Reclaimed OB dump after 10 years of plantation. (e,f) Reclaimed OB dump after 25 years of plantation. (g,h) Natural forest site (reference site). (i) Profile (0–20 cm) sampling of reclaimed mine soil.
Forests 11 01310 g002aForests 11 01310 g002b
Figure 3. Tree species growing in the reclaimed mine soil chronosequence sites along with relative density: (a) 25-year-, (b) 10-year-, (c) 5-year-old afforested dump and (d) reference forest.
Forests 11 01310 g003
Figure 4. Correlation between mine soil quality index and plant growth parameters (a) canopy cover (b) diameter at breast height (DBH) (c) tree height (d) tree carbon stock.
Forests 11 01310 g004
Figure 5. Contribution of each soil indicator parameter on calculated IMSQI with age of reclamation.
Forests 11 01310 g005
Table 1. Vegetation characteristics and accumulation of biomass carbon in afforested chronosequence dumps and reference forest (mean ± SE, n = 5).
Vegetation CharacteristicsRMS 5RMS 10RMS 25Reference Forest
AGB (Mg ha−1)13.29 ± 2.0657.89 ± 13.45187.53 ± 52.73445.40 ± 109.41
BGB (Mg ha−1)3.41 ± 0.4712.49 ± 2.5635.26 ± 8.7675.77 ± 16.68
Total tree biomass (Mg ha−1)16.69 ± 2.5270.38 ± 16.00222.79 ± 61.49521.17 ± 126.09
Tree C stock (Mg C ha−1)8.35 ± 1.2635.19 ± 8.00111.40 ± 30.75260.58 ± 63.05
CO2 sequestered (Mg ha−1)30.61 ± 8.36129.04 ± 32.71408.49 ± 94.60955.56 ± 279.63
AGB; Aboveground biomass, BGB; Belowground biomass.
Table 2. Estimation of tree biomass (Mg ha−1), tree carbon stock (Mg C ha−1) and CO2 sequestered by tree species of revegetated chronosequence dumps and reference forest.
Tree SpeciesRMS5RMS10RMS25Reference Forest
AGBBGBC StockCO2 SequesteredAGBBGBC StockCO2 SequesteredAGBBGBC StockCO2 SequesteredAGBBGBC StockCO2 Sequestered
Azadirachta indica----36.348.3022.3281.84261.647.5154.5566.74----
Terminalia arjuna--------208.9138.92123.91454.38----
Dalbergia sissoo25.36.0215.6457.36----22.055.3413.7050.22----
Gmelina arborea--------19.034.6811.8643.48----
Eucalyptus spp.41.29.2625.2192.46106.121.463.7233.68338.459.6199.01729.78----
Cassia siamea--------30.667.1418.969.30----
Phyllanthus emblica----51.211.231.2114.43--------
Terminalia bellirica----63.713.638.7141.82--------
Terminalia chebula----32.17.4419.872.5516.184.0610.1237.12----
Shorea robusta------------2151.2305.461228.34504.19
Diospyros melanoxylon------------14.983.799.3834.41
Butea monosperma------------60.913.136.9135.65
Table 3. Estimation of litter carbon stock in reclaimed chronosequence and reference forest site.
Tree Litter RMS 5RMS 10RMS 25Reference Forest
Litter biomass (Mg ha−1)1.51 ± 0.032.10 ± 0.122.31 ± 0.222.50 ± 0.05
Litter C stock (Mg C ha−1)0.71 ± 0.021.01 ± 0.061.13 ± 0.111.25 ± 0.03
Equivalent CO2 sequestered (Mg ha−1)2.59 ± 0.303.72 ± 0.604.16 ± 0.754.58 ± 0.30
Table 4. Estimation of tree litter biomass (Mg ha−1) and litter carbon stock (Mg ha−1) by tree species of reclaimed chronosequence dumps and reference forest site (mean ± SE, n = 5).
Tree SpeciesRMS 5RMS 10RMS 25Reference Forest
Litter BiomassLitter CarbonLitter BiomassLitter CarbonLitter BiomassLitter CarbonLitter BiomassLitter Carbon
Azadirachta indica--2.1 ± 0.391.01 ± 0.192.24 ± 0.391.1 ± 0.19--
Terminalia arjuna----2.1 ± 0.431.03 ± 0.21--
Dalbergia sissoo1.48 ± 0.180.7 ± 0.08--2.52 ± 0.331.24 ± 0.16--
Gmelina arborea----2.66 ± 0.231.31 ± 0.11--
Eucalyptus spp.1.57 ± 0.160.74 ± 0.072.11 ± 0.321.01 ± 0.152.24 ± 0.461.1 ± 0.23--
Cassia siamea----2.37 ± 0.451.16 ± 0.22--
Phyllanthus emblica--2.12 ± 0.321.02 ± 0.15----
Terminalia bellirica--2.22 ± 0.351.06 ± 0.16----
Terminalia chebula--1.94 ± 0.310.93 ± 0.152.2 ± 0.281.07 ± 0.14--
Shorea robusta------2.5 ± 0.151.25 ± 0.08
Diospyros melanoxylon------2.54 ± 0.21.27 ± 0.1
Butea monosperma------2.38 ± 0.311.19 ± 0.15
Table 5. Physico-chemical characterization of reclaimed mine soil chronosequence sites and natural forest (mean ± SD, n = 5).
Soil Quality ParameterYear after ReclamationReference Forest
RMS 5RMS 10RMS 25
Fine earth fraction (%)46.5 ± 6.76 c65.04 ± 4.33 b76.45 ± 5.38 a79.03 ± 3.15 a
Water holding capacity (%)28.65 ± 1.60 c35.43 ± 1.37 b40.19 ± 1.07 a35.71 ± 1.05 b
Bulk density (Mg m−3)1.76 ± 0.05 a1.69 ± 0.08 a1.23 ± 0.08 b1.25 ± 0.01 b
Moisture content (%)3.97 ± 0.39 d6.45 ± 0.47 c13.73 ± 3.88 b18.57 ± 1.66 a
Sand (%)76.78 ± 2.49 b73.13 ± 1.49 c68.83 ± 2.12 d79.31 ± 2.22 a
Silt (%)14.39 ± 2.52 b18.73 ± 2.13 a19.12 ± 2.61 a10.79 ± 1.50 c
Clay (%)8.83 ± 0.28 c8.15 ± 0.84 c12.05 ± 2.72 a9.90 ± 1.71 b
pH (1:2.5, w/v)7.09 ± 0.06 b7.29 ± 0.10 a7.41 ± 0.11 a5.68 ± 0.23 c
EC (1:2.5, w/v) (µS/cm)198.29 ± 17.46 a150.27 ± 19.80 b113.20 ± 22.82 c80.1 ± 6.54 d
Soil organic carbon (%)0.99 ± 0.10 d1.54 ± 0.14 c2.71 ± 0.22 a2.01 ± 0.03 b
Available nitrogen (mg kg−1)65.93 ± 6.27 d78.96 ± 9.41 c139.65 ± 6.56 a99.97 ± 1.36 b
Total nitrogen (mg kg−1)1133.40 ± 98.72 c1635.09 ± 156.92 b2914.09 ± 179.45 a2983.10 ± 101.47 a
Available phosphorus (mg kg−1)0.39 ± 0.1 d0.68 ± 0.2 c1.53 ± 0.29 b5.11 ± 0.05 a
Available potassium (mg kg−1)45.35 ± 6.23 d91.71 ± 8.12 c149.23 ± 12.44 a140.3 ± 2.43 b
CEC (cmol+ kg−1)9.57 ± 0.84 c12.22 ± 0.95 b22.67 ± 1.98 a8.73 ± 0.07 c
DHA (µg TPF g−1 h−1)39.57 ± 5.30 d75.67 ± 6.46 b90.59 ± 7.31 a61.46 ± 3.99 c
MBC (Mg kg−1)97.41 ± 12.64 d178.90 ± 23.16 c456.73 ± 35.52 a322.65 ± 24.84 b
EC; electrical conductivity, CEC; cation exchange capacity, DHA; dehydrogenase activity, MBC; microbial biomass carbon, FE; fine earth fraction, BD; bulk density, MC; moisture content, SOC; soil organic carbon, TN; total nitrogen, Ex K; exchangeable potassium. Different alphabets in same row indicates significant (p < 0.05) difference among different sites.
Table 6. Estimation of SOC and TN stock in reclaimed chronosequence and forest site.
Stock CalculationRMS 5RMS 10RMS 25Forest
SOC stock (Mg C ha−1)9.11 ± 1.2319.89 ± 1.6241.37 ± 3.7631.70 ± 1.40
TN stock (Mg N ha−1)1.06 ± 0.222.12 ± 0.174.45 ± 0.364.70 ± 0.21
Table 7. Partitioning of carbon pool (Mg C ha−1) in different ecosystem components.
Carbon (C) Pool (Mg ha−1)RMS 5RMS 10RMS 25Forest
Tree carbon stock8.3535.19111.40260.58
Litter carbon stock0.711.011.131.25
Soil organic carbon stock9.1119.8941.3731.70
Ecosystem carbon pool18.1756.09153.9293.53
Equivalent CO2 sequestered66.68205.85564.811077.25
Table 8. Results of principal component analysis of soil parameters from reclaimed mine soil chronosequence sites.
Principal ComponentPC1PC2PC3PC4PC5PC6
Eigen value4.3462.7812.5212.3792.0491.874
Variance (%)25.56716.36014.83113.99612.05611.025
Cumulative variance (%)25.56741.92756.75970.75582.81193.835
Fine earth fraction0.152−0.1740.1960.9090.041−0.114
Sand0.7970.2960.122−0.0920.425−0.084
Silt−0.620−0.273−0.0970.119−0.6980.003
Clay−0.0650.088−0.005−0.1150.9200.171
Bulk density−0.1750.203−0.1220.906−0.2930.044
Moisture content−0.0190.0860.034−0.1610.0730.966
WHC0.3320.5060.0900.2630.1820.718
pH0.4500.7910.0560.125−0.1320.086
EC0.2410.833−0.380−0.0890.2450.164
Organic carbon0.8040.0470.489−0.1640.1160.216
Available nitrogen0.332−0.2840.080−0.4500.461−0.006
Total nitrogen0.168−0.884−0.306−0.027−0.099−0.113
Av P0.635−0.2300.483−0.4770.2340.149
Exchangeable K0.1490.1340.848−0.1890.1600.347
CEC0.8880.011−0.3200.126−0.0810.285
DHA−0.148−0.010−0.913−0.2610.0830.199
MBC0.9360.1480.2440.021−0.037−0.132
Boldface factors correspond to the parameters included in the index, boldface italic factors correspond to the highly loaded parameter.
Table 9. Pearson correlation coefficients between the highly loaded variables from the principal component analysis.
FEBDClayMCECSOCTNEx KCECDHAMBC
FE10.718 *−0.157−0.259−0.2490.0080.081−0.0210.140−0.4380.190
BD 1−0.345−0.0980.027−0.367−0.182−0.3160.037−0.124−0.143
Clay 10.2200.3040.155−0.1120.275−0.1030.183−0.063
MC 10.2470.231−0.2390.3830.2250.192−0.150
EC 10.113−0.631−0.0580.3580.3840.218
SOC 1−0.0550.676 *0.591−0.4670.858 **
TN 1−0.3500.1990.2730.012
Ex K 1−0.089−0.6250.342
CEC 10.1670.715 *
DHA 1−0.376
MBC 1
* Correlation is significant at 0.05 level (2-tailed), ** correlation is significant at 0.01 level (2-tailed).
Publisher’s Note: MDPI stays neutral with regard to jurisdictional claims in published maps and institutional affiliations.

