Abstract
Rework for defective items is very common in practical shopfloors; however, it generally causes unnecessary energy consumptions and operational costs. In order to address this problem, we propose a novel approach called the intelligent rework process management (i-RPM) system. The proposed system is based on intelligent rework policy, which provides a preventive rework procedure for items with latent defects. Such items can be detected before quality tests by applying conventional classification techniques. Moreover, training sets for the classification algorithms can be collected by using modern information and communications technology (ICT) infrastructures. Items with latent defects are not allowed to proceed to the following processes under intelligent rework policy. Instead, they are returned to the preceding processes for rework in order to avoid unnecessary losses on the shopfloor. Consequently, the proposed system helps to achieve a sustainable manufacturing system. Nevertheless, misclassification by the classification model can degrade the performance of intelligent rework policy. Therefore, the i-RPM system is designed to compare rework policies based on classification accuracy and choose the best one of them. For illustration, we applied the i-RPM system to the rework procedure of a steel manufacturer located in Busan, South Korea, and our experiment results revealed that the cost reduction effect of the intelligent rework policy is affected by several input parameters.
1. Introduction
Emerging information and communications technologies (ICT) have enabled the advent of the fourth industrial revolution, so-called Industry 4.0, which is characterized by the seamless integration of physical objects and digital information [1,2,3]. The paradigm of Industry 4.0 is also being applied to the manufacturing industry, and many manufacturing companies are focusing on integrating human, machines and materials within their shopfloors by applying emerging ICTs, such as Internet of Things (IoT), wireless sensor networks and mobile internet, etc. [4,5,6]. Manufacturing facilities integrated with modern ICT infrastructures are referred to as smart factories, and it is expected that smart factories greatly contribute to enhancing the competitiveness of the manufacturing industry [5]. In this context, the smart factory is recognized as one of the key elements of Industry 4.0 [3,7], and many governments and companies are making significant efforts to transform the existing factories to smart factories [1,2].
The smart factory has a wide range of objectives, such as cost reduction, quality improvement, efficient resource allocation, energy reduction and improved safety, etc. [3,5,6,8,9]. Such objectives can be achieved by collecting digital data from the shopfloor in real-time, decision making, and systematic operations management based on the collected data [10,11,12,13]. Data analysis techniques, such as artificial intelligence (AI) and data mining, can be used to extract meaningful knowledge and patterns from the collected data. Such knowledge and patterns can enable the manufacturing processes to operate in a more intelligent way, and the intelligent manufacturing process is an important aspect of the smart factory [14]. Nevertheless, many companies still rely on manufacturing processes that operate in traditional ways, even though modern ICT infrastructures for collecting data from their shopfloors are established [15]. For example, the data gathered by IoT devices are sometimes used only to calculate some simple statistics, such as averages or counts [16].
In contrast, this paper aims to propose a smart factory system that can be used to make existing manufacturing process more intelligent. In particular, we focus on the innovation of the rework process for defective items, which is very common in practical manufacturing facilities. Typically, the objective of the rework process is to transform defective items, identified by a quality test, into non-defective items that can be delivered to customers. This procedure helps to reduce the scrapped items on the shopfloor. However, the traditional rework procedure is not intelligent in that both defective and non-defective items go through the same manufacturing processes until a quality test is performed. In other words, a defective item cannot be detected until the quality test, and this can cause unnecessary losses associated with additional materials, energy consumptions and labor expenses.
In order to address this problem, we propose a novel approach called the intelligent rework process management (i-RPM) system, which helps to reduce the losses caused by the rework process in a systematic way. The basic idea of the i-RPM system is that the operational cost associated with rework can be reduced by detecting items with latent defects before quality testing and performing preventive rework if an appropriate classification model is given. The classification model is used to classify the quality label of each item, and it can be obtained by applying conventional classification algorithms to a training set comprising predictor attributes about the characteristics of materials or working conditions observed in earlier processes, and quality labels observed in quality test. Moreover, the values of predictor attributes and the quality label are collected in real-time by modern ICT infrastructures under the smart factory environment. If the accuracy of the classification model is not adequate, however, it might be difficult to obtain a meaningful cost reduction effect by performing preventive rework. Therefore, the i-RPM system compares rework policies based on the accuracy of the classification model, and chooses the optimal policy suitable for reducing the operational cost associated with the rework.
In summary, the primary contributions of this paper are two-fold. Firstly, this paper suggests an ICT-based process of innovation strategy that can be widely applied to a diversity of manufacturing companies, given that the rework procedure is quite common in practical shopfloors. Secondly, the i-RPM system proposed in this paper represents how classification models can be utilized in decision-making related to the sustainability of manufacturing systems. In particular, the i-RPM system can identify the optimal transportation route for a specific item even if the accuracy of the classification model is not quite satisfactory. For illustration, the i-RPM system was applied to a steel manufacturing company in Korea, and we expect that this paper will provide a meaningful insight into the process innovation and sustainability of a smart factory.
The remainder of this paper is organized as follows: Section 2 provides a literature review on the data mining techniques and their applications for quality classification. In Section 3, the overall structures and components of the i-RPM system are outlined. Section 4 demonstrates an example of the i-RPM system, which is applied to a steel manufacturing company in Korea. Finally, the concluding remarks and the future research directions are given in Section 5.
2. Research Backgrounds
Data mining is the non-trivial process of extracting useful patterns or knowledge hidden within large data sets [17]. Typically, data mining tasks are grouped into two categories, supervised learning (predictive analysis) and unsupervised learning (descriptive analysis). The objective of supervised learning algorithms is to predict the value of the target variable, while unsupervised learning algorithms are used to identify or summarize the underlying structures and characteristics of given data sets [18]. Moreover, supervised learning tasks are grouped into two sub-categories, classification and regression, according to the type of target variable. Classification algorithms are designed to predict the value of the categorical target variable, and a categorical target variable and its values are often called class and labels, respectively. In other words, the objective of classification algorithms is to choose an appropriate label for a given unlabeled data set, and examples of classification algorithm include decision trees, Bayesian classifiers, nearest neighbor classifier and random forest, etc. [19]. On the contrary, regression algorithms deal with continuous (numerical) target values, and some examples are linear regression analysis and neural networks [20]. In this paper, conventional classification algorithms are used to develop i-RPM system.
During the past few decades, data mining techniques have been widely applied to a variety of manufacturing processes, and the goals of data mining applications in the manufacturing industry include fault detection, predictive maintenance, decision support and solving quality-related problems, etc. [16]. In particular, quality classification is one of the most important quality-related problems, which has been much studied [21,22]. Typically, the objective of quality classification is to predict the quality-related label of an individual product (for example, bad (defective) or not and number of faults, etc.) or a lot of materials (for example, high yield/low yield) before the quality test is performed, and many classification algorithms have been applied to achieve this.
For example, Kang et al. [23], Braha and Shmilovici [24], Li et al. [25], Wang et al. [26], Chien et al. [27], Bakir et al. [28], Kerdprasop and Kerdprasop [29], Arif et al. [30], Ronowicz et al. [31] and Song et al. [32] applied decision tree algorithms to construct classification models for quality classification. Decision tree-based classification models in particular can also be used to find the optimal work conditions that minimize defect rate, since decision tree algorithms generate classification rules that can be easily interpreted. On the other hand, the artificial neural network generates classification models with complicated structures that are hard to interpret; however, it can represent the complex relationships between various factors and quality-related labels more effectively. Shin and Park [33], Correa et al. [34], Shanmugamani et al. [35], Kang and Kang [36] and Song et al. [32] applied artificial neural networks to obtain quality classification models. Additionally, there are a number of research papers that have studied quality classification models based on data mining techniques, such as the Bayesian classifier [29,35,37], the nearest neighbor classifier [29,35,38,39], and the support vector machine [32,35,38,40,41].
While the previous research papers contribute to demonstrating that classification algorithms can be successfully applied to predict the values of quality-related labels in the manufacturing industry, they have two important limitations. Firstly, almost of the previous research papers focused primarily on obtaining quality classification models with high accuracy, without appropriate consideration of the misclassifications caused by the models. Some researchers have made significant efforts to minimize the occurrence of misclassification by appropriately updating their classification models [36,40]; however, what is important is that misclassification is typically unavoidable. In other words, the classification accuracies of practical quality classification models are not 100%, and this should be carefully considered. Secondly, the classification models were not utilized in a systematic way. Some research papers suggested that the quality classification models can be used for quality monitoring, early defect warning, defect cause analysis and work condition optimization [21,22,23,30]; however, the additional procedures for these objectives were often not explained in detail. Consequently, managers in practical manufacturing companies have difficulties in understanding how quality classification models can be utilized to innovate the existing manufacturing processes.
On the contrary, this paper focuses on the manufacturing process innovation rather than the accuracy of classification model, and proposes a novel rework process management framework called the i-RPM system that uses classification models to determine the routing policy for individual materials. In particular, the i-RPM system aims to innovate the rework process for defective products, which is very common in practical shopfloors, so it is expected that this paper provides meaningful insights into manufacturing process innovation in smart factory environments.
3. Intelligent Rework Process Management System
3.1. Rework Policy under Smart Factory Environment
Typically, materials or products that have been processed are classified into one of two categories, good (not defective) items and bad (defective) items, after the quality test. If all the bad items are reworkable, they will be returned to the preceding processes for reprocessing, as shown in Figure 1, where denotes an individual process that corresponds to the -hop predecessor of the quality test. In addition, indicates the quality test itself. If a bad item is transferred to at first, it must go through , , …, again. Thus, a set of these processes is called the repeating part in this paper. Some bad items that are not reworkable can be scrapped in real shopfloors. Additionally, a reworkable item can become non-reworkable after several rounds of reworks. However, scrap is not considered in this paper, which means an item is assumed to always be reworkable. Moreover, the objective of the i-RPM system is to reduce the operational cost related to the traditional rework policy depicted in Figure 1.
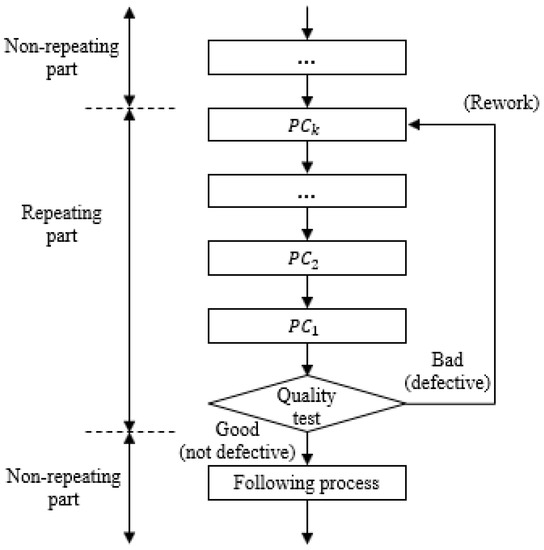
Figure 1.
Schematic representation of traditional rework policy.
This paper suggests that quality classification models enable the enhanced rework policy shown in Figure 2, which is called the intelligent rework policy. What is important is that quality classification has to be performed within the repeating part under the intelligent rework policy. Let () denote the decision point, which is defined as a process in the repeating part immediately followed by quality classification. Moreover, a set of , , …, is called the upstream part, while a set of the other processes in the repeating part is called the downstream part. The classification model after can be obtained by applying classification algorithms to the training set that consists of the predictor attributes collected from the processes within the upstream part and the quality label collected from the quality test. The predictor attributes are related to the characteristics of items and working conditions observed in the upstream part, which can be monitored and gathered by sensors or IoT devices in the smart factory environment. On the contrary, the value of the quality label for an individual item is recorded after the quality test, and this paper assumes that the quality label is a binary variable which takes two values, good (not defective) and bad (defective).
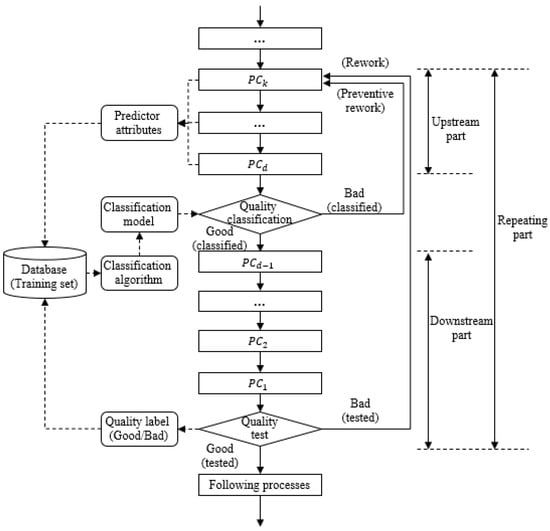
Figure 2.
Schematic representation of intelligent rework policy.
When the for an item is finished, the classification model is applied to classify the quality of the item, and it is transferred to the downstream part if, and only if, it is classified as good. On the contrary, the items classified as bad are returned to , the first process of the upstream part, since they are likely to create defective products. Note that this return procedure is represented as a preventive rework in Figure 2. If a reliable classification model is given, the intelligent rework policy will contribute to reducing the operational cost associated with the rework, since the potential defective items do not go through the , , …, process included in the downstream part. However, a classification model with poor accuracy can significantly degrade the performance of the intelligent rework policy. Therefore, we have to carefully choose the optimal rework policy, with considerations of the operational cost of each process in the repeating part and the performance of the classification model.
In this context, the i-RPM system calculates the performance indicator called the total cost ratio by using input parameters, including the overall defect rate and the operational cost of each process, and performance measures of the classification model. The total cost ratio is used to choose an optimal policy among traditional rework and intelligent rework. This rework policy decision procedure of the i-RPM system is summarized in Figure 3.
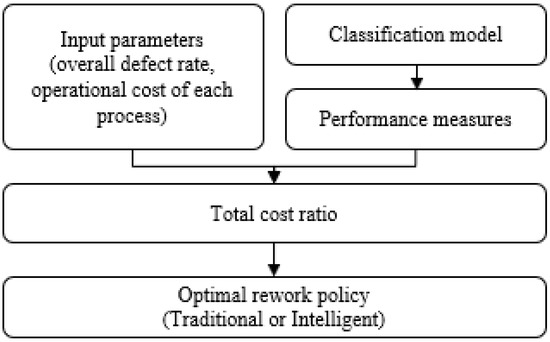
Figure 3.
Rework policy decision procedure.
3.2. Rework Policy Decision Procedure Based on Total Cost Ratio
Let denote the number of items to be processed, the per-item cost of ( = 0, 1, 2, …, ), and the overall defect rate. Then, the per-item costs of the upstream part and the downstream part, and , are calculated as follows:
Note that a transportation procedure can also be regarded as if it incurs a significant amount of cost. Under the traditional rework policy, all items go through , , …, . Thus, the cost of first processing for items is . After first processing, bad items will be obtained, while ) good items are transferred to the following processes. This means that items have to go through a second processing, and the cost of this is . Consequently, the cost of th processing is , and the total cost for processing items under the traditional rework policy, , is calculated as follows:
On the other hand, the total cost under intelligent rework policy should be calculated based on the performance of the classification model. Table 1 shows the confusion matrix of the classification model for the intelligent rework policy, which can be obtained by applying the classification algorithm to the training set.

Table 1.
Confusion matrix of classification model.
For convenience, we define the relative frequency of each case in the confusion matrix as follows:
Note that , , and are not conditional probabilities. Moreover, the accuracy of the classification model = + , and its error rate = + , is straightforward. Initially, all of the items go through the upstream part for the first processing under the intelligent rework policy. However, of them are classified as bad items, and only the other items are transferred to the downstream part, where () is the probability of an item being classified as good (bad) by the classification model. and can be obtained as follows:
It is worth noting that the data set with a quality label as class is typically imbalanced, in that almost all records are good-labeled. Thus, we often even up the class labels in the training set for classification analysis by deleting some of the good-labeled records, or over-sampling bad-labeled records. In this case, and in (8) and (9) cannot be applied to future data objects with unknown quality labels. In this context, if the training set for classification analysis has been evened up, and are replaced by modified probabilities and , such that
Therefore, the cost of first processing is .
Let be the probability of an individual item passing the quality test, , and the probability of an individual item failing to pass . Then, we have
In the first processing, out of items that entered the downstream part will fail to pass the quality test, and only the other items will proceed to the following processes. In the meantime, items from the quality classification and items from the quality test will be returned to for second processing, which means that the ratio of items returned to for rework, , is
Then, the cost of th processing is , and we can calculate the total cost for processing items under the intelligent rework policy, , as follows:
Consequently, the total cost ratio, , is defined as the ratio of to , and the intelligent rework policy should be applied if and only if < 1. On the contrary, an larger than 1 indicates that the traditional rework policy outperforms the intelligent rework policy.
In addition, the expected number of visits by an item to each process can be calculated in a similar manner to (3) and (15). Let and denote the expected visit counts for an upstream process and a downstream process under the traditional rework policy, respectively. Then, we have
In contrast, the expected visit counts under the intelligent rework policy, and , can be calculated as follows:
Note that in (19) should be replaced by if the class label of the training set has not been evened up. Table 2 summarizes the expected number of visits by an item to each process, where the first and the second columns indicate visits to upstream and downstream processes, respectively.
Table 2.
Expected number of visits to .
3.3. Overall Structure of i-RPM System
On the basis of the total cost ratio, this paper proposes an i-RPM system that enables an efficient rework process. As shown in Figure 4, the i-RPM system has two main procedures—the offline policy decision and online process control. The objective of the offline policy decision is to determine the optimal rework policy. To this end, a training set which comprises the predictor attributes collected from the upstream part and a quality label collected from the quality test should be prepared. Then, the i-RPM system performs classification analysis by using conventional classification algorithms, provided by the classification analysis module, so that the classification model and relative frequencies, , , and are obtained. The input parameters include overall defect rate and the per-item cost of each process in the repeating part associated with the rework. While the overall defect rate can be obtained from the quality label values recorded in the training set, the per-time costs of s ( = 0, 1, 2, …, ) have to be provided by the users. The input parameters are used to calculate the total cost ratio, , and then we can determine the optimal rework policy based on the . Note that the term ‘offline’ indicates that this procedure is not performed for specific items in real-time. Moreover, the offline policy decision procedure can be executed whenever it is required. For instance, we can perform offline policy decision procedure when the performance of the classification model is degraded.
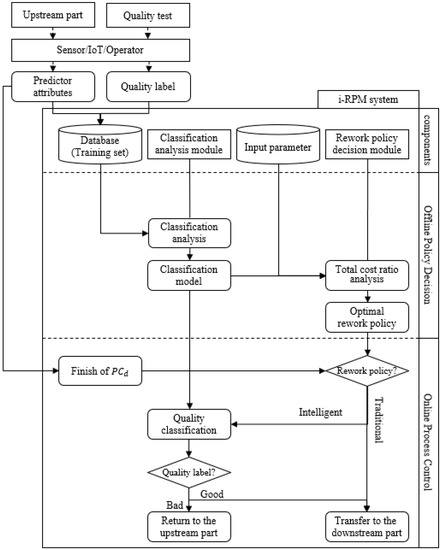
Figure 4.
Main components and procedures of intelligent rework process management (i-RPM) system.
On the other hand, the online process control procedure is used to manage the transportation routes for specific items in real-time. The online process control procedure for a single item is started when , the last process of the upstream part for the item, is finished, as shown in the lower part of Figure 4. Note that the predictor attribute values for have been collected while it is being processed in the upstream part. Next, the i-RPM system checks which rework policy is being applied. If a traditional rework policy is being applied, can proceed to the downstream part without quality classification. Otherwise, the classification model built by the offline policy decision procedure is utilized to classify the quality label of , and it can proceed to the downstream part if and only if its quality label is classified as good. In contrast, is returned to the upstream part if its quality label is classified as bad by the classification model.
4. Case Study for a Steel Manufacturer
This paper applies the i-RPM system to the rework procedure of a steel manufacturer located in Busan, South Korea, which produces steel products from scrap iron. The end-products of the company are subjected to a quality test, and defective items with bad quality are returned to the preceding processes for rework. Note that all the defective items are reworkable since they can be reused after melting. Therefore, the first process of the repeating part is melting, which is followed by refining, continuous casting, and quality tests, as shown in Table 3. During the refining process, a small amount of sample is drawn from the molten steel, which is forwarded to the in-house quality laboratory room. The contents of various elements are measured by staff of the quality laboratory room, and they are uploaded to the shopfloor management system. Thus, the refining process is chosen as the decision point, which means that the melting and refining processes are included in the upstream part, while the continuous casting process and quality test belong to the downstream part. Consequently, = 3, = , = 1.26 and = 1.00. An end product passes the quality test if its mechanical properties, such as yield strength, tensile strength and elasticity, are within their acceptable ranges. The quality label of an end product is also uploaded to the shopfloor management system after the quality test. An industrial communication network system, such as programmable logic controller (PLC), is used to transfer the digital data within the shopfloor. The managers of the steel manufacturer have estimated that the per-item cost of the upstream part is about 26% higher than that of the downstream part. Moreover, a contact type temperature sensor is utilized to monitor the status of the molten steel in real-time. In summary, the steel manufacturer has established ICT infrastructures for collecting data from the shopfloor; however, the statistics provided by the infrastructures are used only for checking if they are within their acceptable ranges. Thus, we sought to propose a novel approach that enables us to utilize the statistics in a more systematic way.
Table 3.
Processes included within the repeating part for rework.
Note that the third column of Table 3 contains relative per-item cost values, where the per-item cost of the downstream part is 1.00. Moreover, a batch of molten steel is regarded as an item in this case study. After the quality test, the quality label of each item was also recorded in the shopfloor management system, and the overall defective rate was estimated as about 0.05 (5%).
Next, we created a training set for classification analysis by collecting the values of the predictor attributes and a quality label from the shopfloor management system. Since the number of good-labeled records in the shopfloor management system is much larger than that of the bad-labeled ones, we evened up the class labels in the training set by over-sampling bad-labeled records. The initial training set comprised 20 predictor attributes and 1 class, as shown in Table 4. Additionally, the training set contains 200 records; 100 of them are good-labeled and the others are bad-labeled. The good-labeled records were collected over 4 business days. In contrast, the bad-labeled records were chosen from a production history of 2 months. Thus, the duplication of bad-labeled records was avoided and we expect that the general properties of the bad-labeled records are reflected in the training set, though they are rarely observed in the shopfloor management system.
Table 4.
Attributes in initial training set.
A well-known data mining tool, the WEKA software, was used to apply conventional classification algorithms to the training set. In order to avoid the curse of dimensionality, we tried to select some relevant predictor attributes by applying correlation-based feature selection (CBFS), one of the well-known conventional feature selection methods. After feature selection, 10 predictor attributes, including , , , , , , , , and , were selected. In other words, we used a training set with 10 predictor attributes for classification analysis. Note that the reduction in the number of predictor variables had no impact on the classification accuracy. In other words, CBFS helps to obtain simpler classification models and avoid overfitting, while maintaining the classification accuracies in this paper.
In order to build a classification model, we applied several conventional classification algorithms, including decision trees, naïve Bayesian classifiers, -nearest neighbors and random forests, to the training set, and the result is summarized in Table 5. The accuracies of the classification algorithms were evaluated by applying a 10-fold cross validation scheme provided by the WEKA software. High accuracies in Table 5 indicate that the predictor variables have significant impacts on the class and quality label. We can see that the -nearest neighbor was the most suitable for our training set, though all classification algorithms showed competitive performances in terms of classification accuracy. Therefore, we chose the -nearest neighbor as the classifier for the rework procedure of the steel manufacturer. Moreover, Table 6 shows the relative frequency of each case in the confusion matrix obtained by applying the -nearest neighbor to the training set.
Table 5.
Performances of classification algorithms.
Table 6.
Relative frequency matrix.
From Table 6, we can obtain = 0.9505, = 0.0495, = 0.9901 and = 0.0099, which yield = 0.0589. Thus, the expected numbers of visits to the processes are calculated as shown in Table 7. Note that both an upstream process and a downstream process have identical expected visit counts under the traditional rework policy. In contrast, is higher than , as shown in the second row of Table 7. Since an item can be returned to the first process of the upstream part if it is classified as bad after the decision point, an individual item visits the upstream process more times than the downstream processes. Additionally, we can see that and in Table 7. In other words, the expected visit count for an upstream process increases under the intelligent rework policy, whereas the expected visit count for a downstream process decreases. In addition, is larger than , which means the intelligent rework policy has a larger impact on visit count for the downstream processes. Therefore, we can conclude that the intelligent rework policy is especially helpful for reducing the unnecessary losses associated with processes in the downstream part.
Table 7.
Expected number of visits to the processes of the steel manufacturer.
The relative differences in expected visit counts for defective rate from 0.0 to 0.2 are depicted in Figure 5. Although is always higher than , their relative difference (+0.75%~+1.00%) is small. In other words, the intelligent rework policy has a negative effect on the processes in the upstream part; however, it is nominal. In contrast, the relative difference between and ranges from −19.20% ( = 0.2) to +1.00% ( = 0.0) in Figure 5. This suggests that the intelligent rework policy is especially helpful when the overall defective rate is relatively high.
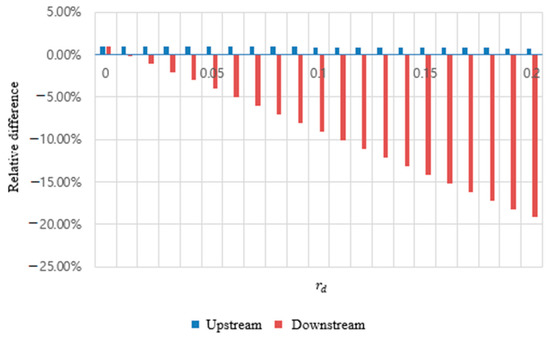
Figure 5.
Relative difference in expected visit count.
Figure 6 shows that the rework probability is inversely proportional to the classification accuracy. In contrast, is directly proportional to the defect rate . In particular, is much larger than when the classification accuracy is low, which may lead to the poor performance of the intelligent rework policy.
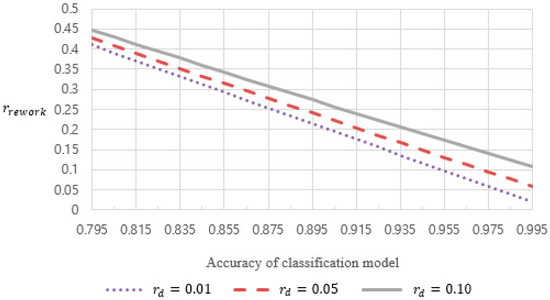
Figure 6.
The effect of classification accuracy on rework probability.
The total cost ratio, , for the rework procedure of the steel manufacturer is 0.9874, and we can conclude that the operational cost for the rework procedure can be reduced by about 1.3% by adopting an intelligent rework policy. Furthermore, we analyzed the sensitivities of to input parameters, and the results are shown in Figure 7 and Figure 8. Figure 7 shows the effect of classification accuracy on for the steel manufacturer. Since the accuracy of the classification model based on the -nearest neighbor, 0.995, was quite high, we calculated values under lower accuracies, obtained by decreasing and while increasing and . In Figure 7, we can see that a lower classification accuracy increases . For instance, the is about 1.4 when the classification accuracy is 0.795, which means that the operational cost of the intelligent rework policy is 1.4 times higher than that of the traditional rework policy. In other words, we have to maintain the traditional rework policy if a classification model with sufficient accuracy has not been obtained.
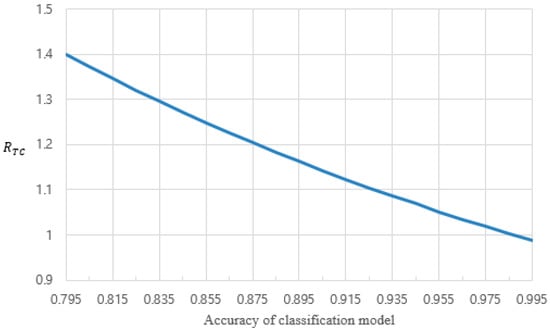
Figure 7.
The effect of classification accuracy on total cost ratio.
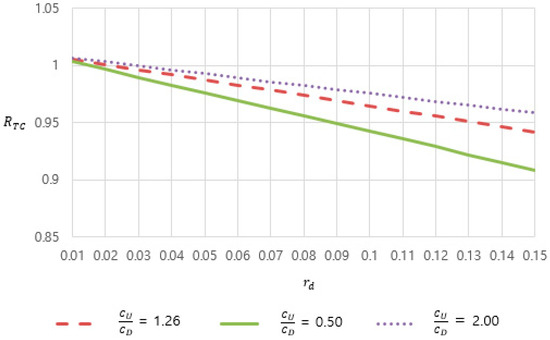
Figure 8.
The effect of overall defect rate and per-item cost ratio on total cost ratio.
On the other hand, Figure 8 shows the effect of the overall defect rate, and the per-item cost ratio, /, on under a fixed classification accuracy, 0.995. From Figure 8, we can make the following observations: First, is inversely proportional to , which means that the intelligent rework policy shows a better performance under a higher . The intelligent rework policy is characterized by preventive rework, which prevents the items likely to cause defects from entering the downstream part, since they cause unnecessary operational costs in the downstream part. Moreover, such unnecessary cost is directly proportional to . As such, we can reduce the operational cost related to the rework procedure by applying the intelligent rework policy when the overall defect rate is high. Second, is directly proportional to per-item cost ratio. In other words, the intelligent rework policy has a more evident cost reduction effect if is much larger than . As explained above, the unnecessary cost caused by defective items is , which can be avoided by the preventive rework of the intelligent rework policy. Thus, the intelligent rework policy is helpful for the shopfloor with a much larger than the . Conversely, the traditional rework policy can outperform the intelligent rework policy if the is larger than the , and the is low.
5. Conclusions and Further Remarks
In this paper, we proposed a novel approach for innovating the rework procedure, which is called the i-RPM system. Under the traditional rework policy, all defect items go through the entire repeating part of the rework procedure, which causes unnecessary losses in material, energy, and labor cost. In order to overcome this limitation, we suggested an intelligent rework policy that contains preventive rework based on the classification model. The classification model is used to classify the quality labels of items, and an item cannot enter the downstream part of the rework procedure if it is classified as bad. Therefore, the intelligent rework policy can reduce the unnecessary losses associated with the downstream part. Moreover, the i-RPM system enables one to compare the performances of traditional and intelligent rework policies, and choose the superior one for the minimization of operational costs or losses on the shopfloor. Additionally, the i-RPM system can be used to achieve a sustainable manufacturing system if the losses of material and energy are appropriately considered in approximating s.
We applied the i-RPM system to the rework procedure of a steel manufacturer in South Korea, in order to investigate its benefits. The experiment results showed that the intelligent rework policy is helpful for reducing the losses associated with the downstream part, especially under a high defective rate. This suggests that the preventive rework procedure should be carefully designed so that many processes belong to the downstream part. If the downstream part contains too many processes, however, it becomes harder to obtain classification models with high accuracy. Note that the values of the predictor variables of the training set for classification analysis are collected from () processes in the upstream part. Additionally, we can see that the intelligent rework policy produces a smaller operational cost than the traditional rework policy for the steel manufacturer. The sensitivity analysis results revealed that the i-RPM system is especially suitable for manufacturing processes that satisfy two conditions: Firstly, the predictor variables observed during the early part of the manufacturing process have significant impact on the quality label. In other words, the intelligent rework policy is likely to show poor performances if the accuracy of the classification model is low. In this context, a classification model with enough accuracy is a key element of the i-RPM system. Secondly, the later part of manufacturing process incurs higher operational costs. Intrinsically, the i-RPM system helps to reduce the unnecessary work associated with the downstream processes. Thus, both upstream processes with low per-item costs and downstream processes with high per-item costs are helpful in maximizing the performance of the i-RPM system.
From the perspective of quality label classification, the important limitations of the existing studies have been overcome in the i-RPM system. Firstly, a classification model can be used to develop an i-RPM system even if its accuracy is not so high. Although the performance of the intelligent rework policy is proportional to the accuracy of the classification model, the i-RPM system has another alternative, which is the traditional rework policy. Additionally, a classification model with moderate accuracy can be replaced by another one with higher accuracy at any time. Secondly, the rework policy decision procedure of the i-RPM system is a systematic way of utilizing the results of classification analysis, which is missing in almost all the existing studies on classification analysis. Thus, practitioners can design and develop an i-RPM system conveniently.
This paper also suggests several additional implications. The digital data collected from different processes can have meaningful relationships with each other. We can implement an intelligent manufacturing process for the smart factory by analyzing such relationships. Many intelligent systems based on classification analysis assume high classification accuracy; however, misclassification is also carefully considered in designing and developing predictive analysis-based intelligent manufacturing process. For instance, the i-RPM system can be used even if the classification accuracy is not so high. Another benefit of the i-RPM system is that its performance can be evaluated in terms of cost reduction, instead of classification accuracy. This may enable the practitioners to make decisions about the i-RPM system conveniently.
Since quality tests and reworks are very common in practical shopfloors, it is expected that this paper will provide meaningful insights to a wide range of manufacturing companies. Finally, we suggest several research topics for further studies. First, the i-RPM system proposed in this paper assumes that all defective items are reworkable and there is no scrap. However, scrap is also a very common procedure in many practical shopfloors. As such, we plan to refine the concepts and procedures of the i-RPM system so that the scrap of defective items can be considered. Second, the performance of the classification model of the i-RPM system sometimes can be degraded due to the corrosion or abrasion of equipment, the skill level of workers, and so on. Additionally, the per-item cost of an individual process can vary over time. In particular, the training set used in this paper contains observations only during short periods. In other words, it is hard to guarantee that the intelligent rework policy outperforms the traditional rework policy in steel manufacturing for a long period of time. As such, the classification accuracy and total cost ratio should be monitored and analyzed constantly in order to determine if the i-RPM system needs to be updated, and this might be another future research topic. The last topic is the optimal position of the decision point (). As mentioned above, if is large, accurate classification models are hard to obtain. On the other hand, should be large in order to decrease the per-item cost ratio. Therefore, determining the value of can be a non-trivial task in practical shopfloors, and systematic approaches to this issue should be developed.
Author Contributions
Conceptualization, J.-W.K.; software, D.-S.J. and T.-W.K.; validation, D.-S.J. and J.-W.K.; formal analysis, D.-S.J. and T.-W.K.; investigation, T.-W.K. and J.-W.K.; resource, T.-W.K. and J.-W.K.; data curation, T.-W.K.; writing—original draft preparation, D.-S.J. and J.-W.K.; writing—review and editing, J.-W.K.; visualization, D.-S.J. and J.-W.K.; supervision, J.-W.K.; project administration, J.-W.K.; funding acquisition, J.-W.K. All authors have read and agreed to the published version of the manuscript.
Funding
This research was supported by the Korea Institute for Advancement of Technology (KIAT) grant funded by the Korea Government (MOTIE: Ministry of Trade Industry and Energy; Grant No. N0002429).
Conflicts of Interest
The authors declare no conflict of interest.
References
- Chen, B.; Wan, J.; Shu, L.; Li, P.; Mukherjee, M.; Yin, B. Smart factory of Industry 4.0: Key technologies, application case, and challenges. IEEE Access 2018, 6, 6505–6519. [Google Scholar] [CrossRef]
- Lee, J. Smart factory systems. Inform. Spektrum 2015, 38, 230–235. [Google Scholar] [CrossRef]
- Shrouf, F.; Ordieres, J.; Miragliotta, G. Smart factories in Industry 4.0: A review of the concept and of energy management approached in production based on the Internet of Things paradigm. In Proceedings of the 2014 IEEE International Conference on Industrial Engineering and Engineering Management, Selangor Darul Ehsan, Malaysia, 9–12 December 2014; pp. 697–701. [Google Scholar] [CrossRef]
- Lass, S.; Gronau, N. A factory operating system for extending existing factories to Industry 4.0. Comput. Ind. 2020, 115, e103128. [Google Scholar] [CrossRef]
- Mabkhot, M.; Al-Ahmari, A.; Salah, B.; Alkhalefah, H. Requirements of the smart factory system: A survey and perspective. Machines 2018, 6, 23. [Google Scholar] [CrossRef]
- Wan, J.; Tang, S.; Li, D.; Imran, M.; Zhang, C.; Liu, C.; Pang, Z. Reconfigurable smart factory for drug packing in healthcare Industry 4.0. IEEE Trans. Ind. Inform. 2019, 15, 507–516. [Google Scholar] [CrossRef]
- Wang, S.; Wan, J.; Zhang, D.; Li, D.; Zhang, C. Towards smart factory for industry 4.0: A self-organized multi-agent system with big data based feedback and coordination. Comput. Netw. 2016, 101, 158–168. [Google Scholar] [CrossRef]
- Goryachev, A.; Kozhevnikov, S.; Kolbova, E.; Kuznetsov, O.; Simonova, E.; Skobelev, P.; Tsarev, A.; Shepilov, Y. “Smart factory”: Intelligent system for workshop resource allocation, scheduling, optimization and controlling in real time. Adv. Mater. Res. 2013, 630, 508–513. [Google Scholar] [CrossRef]
- Longo, F.; Nicoletti, L.; Padovano, A. Smart operators in industry 4.0: A human-centered approach to enhance operators’ capabilities and competencies within the new smart factory context. Comput. Ind. Eng. 2017, 113, 144–159. [Google Scholar] [CrossRef]
- Carrasco, U.; Coronado, P.D.U.; Parto, M.; Kurfess, T. Indoor location service in support of a smart manufacturing facility. Comput. Ind. 2018, 103, 132–140. [Google Scholar] [CrossRef]
- Helu, M.; Libes, D.; Lubell, J.; Lyons, K.; Morris, K.C. Enabling smart manufacturing technologies for decision-making support. In Proceedings of the ASME 2016 International Design Engineering Technical Conferences and Computers and Information in Engineering Conference, Charlotte, NC, USA, 21–24 August 2016; pp. 1–10. [Google Scholar]
- Kusiak, A. Smart manufacturing. Int. J. Prod. Res. 2018, 56, 508–517. [Google Scholar] [CrossRef]
- Radziwon, A.; Bilberg, A.; Bogers, M.; Madsen, E.S. The smart factory: Exploring adaptive and flexible manufacturing solutions. Procedia Eng. 2014, 69, 1184–1190. [Google Scholar] [CrossRef]
- Trstenjak, M.; Opetuk, T.; Cajner, H.; Tosanovic, N. Process planning in Industry 4.0—current state, potential and management of transformation. Sustainability 2020, 12, 5878. [Google Scholar] [CrossRef]
- Herrmann, F. The smart factory and its risks. Systems 2018, 6, 38. [Google Scholar] [CrossRef]
- Harding, J.A.; Shahbaz, M.; Srinivas, S.; Kusiak, A. Data mining in manufacturing: A review. J. Manuf. Sci. Eng. 2006, 128, 969–976. [Google Scholar] [CrossRef]
- Tan, P.N.; Steinbach, M.; Kumar, V. Introduction to Data Mining; Addison-Wesley: Boston, MA, USA, 2005. [Google Scholar]
- Witten, I.H.; Frank, E.; Hall, M.A.; Pal, C.J. Data Mining: Practical Machine Learning Tools and Techniques; Morgan Kaufmann: Burlington, MA, USA, 2016. [Google Scholar]
- Kotsiantis, S.B. Supervised machine learning: A review of classification techniques. Informatica 2007, 31, 249–268. [Google Scholar]
- Liao, S.-H.; Chu, P.-H.; Hsiao, P.-Y. Data mining techniques and applications—A decade review from 2000 to 2011. Expert Syst. Appl. 2012, 39, 11303–11311. [Google Scholar] [CrossRef]
- Choudhary, A.K.; Harding, J.A.; Tiwari, M.K. Data mining in manufacturing: A review based on the kind of knowledge. J. Intell. Manuf. 2009, 20, 501–521. [Google Scholar] [CrossRef]
- Köksal, G.; Batmaz, İ.; Testik, M.C. A review of data mining applications for quality improvement in manufacturing industry. Expert Syst. Appl. 2011, 38, 13448–13467. [Google Scholar] [CrossRef]
- Kang, B.S.; Choe, D.H.; Park, S.C. Intelligent process control in manufacturing industry with sequential processes. Int. J. Prod. Econ. 1999, 60, 583–590. [Google Scholar] [CrossRef]
- Braha, D.; Schmilovici, A. Data mining for improving a cleaning process in the semiconductor industry. Ieee Trans. Semicond. Manuf. 2002, 15, 91–101. [Google Scholar] [CrossRef]
- Li, T.S.; Huang, C.L.; Wu, Z.Y. Data mining using genetic programming for construction of a semiconductor manufacturing yield rate production system. J. Intell. Manuf. 2006, 17, 355–361. [Google Scholar] [CrossRef]
- Wang, C.-H.; Wang, S.-J.; Lee, W.-D. Automatic identification of spatial defect patterns for semiconductor manufacturing. Int. J. Prod. Res. 2006, 44, 5169–5185. [Google Scholar] [CrossRef]
- Chien, C.F.; Wang, W.C.; Cheng, J.C. Data mining for yield enhancement in semiconductor manufacturing and an empirical study. Expert Syst. Appl. 2007, 33, 192–198. [Google Scholar] [CrossRef]
- Bakir, B.; Batmaz, İ.; Güntürkün, F.A.; İpekçi, İ.A.; Köksal, G.; Özdemirel, N.E. Defect cause modeling with decision tree and regression analysis. Int. J. Mech. Aerosp. Ind. Mechatron. Manuf. Eng. 2006, 2, 1334–1337. [Google Scholar]
- Kerdprasop, K.; Kerdprasop, N. A data mining approach to automate fault detection model development in the semiconductor manufacturing process. Int. J. Mech. 2011, 5, 336–344. [Google Scholar]
- Arif, F.; Suryana, N.; Hussin, B. A data mining approach for developing quality prediction model in multi-stage manufacturing. Int. J. Comput. Appl. 2013, 69, 35–40. [Google Scholar] [CrossRef]
- Ronowicz, J.; Thommes, M.; Kleinebudde, P.; Krysiński, J. A data mining approach to optimize pellets manufacturing process based on a decision tree algorithm. Eur. J. Pharm. Sci. 2015, 73, 44–48. [Google Scholar] [CrossRef] [PubMed]
- Song, J.D.; Kim, Y.G.; Park, T.H. SMT defect classification by feature extraction region optimization and machine learning. Int. J. Adv. Manuf. Technol. 2019, 101, 1303–1313. [Google Scholar] [CrossRef]
- Shin, C.K.; Park, S.C. A machine learning approach to yield management in semiconductor manufacturing. Int. J. Prod. Res. 2000, 38, 4261–4271. [Google Scholar] [CrossRef]
- Correa, M.; Bielza, C.; Pamies-Teixeira, J. Comparison of Bayesian networks and artificial neural networks for quality detection in a machining process. Expert Syst. Appl. 2009, 36, 7270–7279. [Google Scholar] [CrossRef]
- Shanmugamani, R.; Sadique, M.; Ramamoorthy, B. Detection and classification of surface defects of gun barrels using computer vision and machine learning. Measurement 2015, 60, 222–230. [Google Scholar] [CrossRef]
- Kang, S.; Kang, P. An intelligent virtual metrology system using adaptive update for semiconductor manufacturing. J. Process Control 2017, 52, 66–74. [Google Scholar] [CrossRef]
- Al-Habaibeh, A.; Zorriassatine, F.; Parkin, R.M.; Jackson, M.R. Application of infrared technology for quality control of diesel engine glow plugs. Proc. Inst. Mech. Eng. Part. B J. Eng. Manuf. 2005, 219, 483–489. [Google Scholar] [CrossRef]
- Moosavian, A.; Ahmadi, H.; Sakhaei, B.; Labbafi, R. Support vector machine and K-nearest neighbor for unbalanced fault detection. J. Qual. Maint. Eng. 2014, 20, 65–75. [Google Scholar] [CrossRef]
- Wang, L.; Kowk, S.K.; Ip, W.H. A radio frequency identification-based quality evaluation system design for the wine industry. Int. J. Comput. Integr. Manuf. 2012, 25, 11–19. [Google Scholar] [CrossRef]
- Chen, Y.J.; Fan, C.Y.; Chang, K.H. Manufacturing intelligence for reducing false alarm of defect classification by integrating similarity matching approach in CMOS image sensor manufacturing. Comput. Ind. Eng. 2016, 99, 465–473. [Google Scholar] [CrossRef]
- Chou, P.H.; Wu, M.J.; Chen, K.K. Integrating support vector machine and genetic algorithm to implement dynamic wafer quality prediction system. Expert Syst. Appl. 2010, 37, 4413–4424. [Google Scholar] [CrossRef]
Publisher’s Note: MDPI stays neutral with regard to jurisdictional claims in published maps and institutional affiliations. |
© 2020 by the authors. Licensee MDPI, Basel, Switzerland. This article is an open access article distributed under the terms and conditions of the Creative Commons Attribution (CC BY) license (http://creativecommons.org/licenses/by/4.0/).