Impact of Dy2O3 Substitution on the Physical, Structural and Optical Properties of Lithium–Aluminium–Borate Glass System


 , ,
, , 
Abstract
1. Introduction
2. Materials and Methods
2.1. Glass Preparation
2.2. Structural and Physical Parameters
2.3. Optical Properties
2.3.1. UV-Vis-NIR Absorption Spectra
2.3.2. Photoluminescence (PL) Spectrum
3. Results and Discussion
4. Conclusions
Author Contributions
Funding
Acknowledgments
Conflicts of Interest
References
- Anjaiah, J.; Laxmikanth, C.; Veeraiah, N.; Nalluri, V. Spectroscopic properties and luminescence behaviour of europium doped lithium borate glasses. Phys. B Condens. Matter 2014, 454, 148–156. [Google Scholar] [CrossRef]
- Alajerami, Y.S.M.; Hashim, S.; Ghoshal, S.K.; Saleh, M.A.; Kadni, T.; Saripan, M.I.; Saripand, K.; Alzimamie, Z.; Bradley, D.A. The Effect of TiO2 and MgO on the Thermoluminescence Properties of a Lithium Potassium Borate Glass System. J. Phys. Chem. Solids 2013, 74, 1816–1822. [Google Scholar] [CrossRef]
- Okasha, A.; Abdelghany, A.; Marzouk, S. The influence of Ba2+ and Sr2+ ions with the Dy3+ ions on the optical properties of lead borate glasses: Experimental and Judd–Ofelt comparative study. J. Mater. Res. Technol. 2020, 9, 59–66. [Google Scholar] [CrossRef]
- Ramteke, D.D.; Gedam, R.S. Study of Li2O–B2O3–Dy2O3 glasses by impedance spectroscopy. Solid State Ion. 2014, 258, 82–87. [Google Scholar] [CrossRef]
- Damodaraiah, S.; Prasad, V.R.; Babu, S.; Ratnakaram, Y. Structural and luminescence properties of Dy3+ doped bismuth phosphate glasses for greenish yellow light applications. Opt. Mater. 2017, 67, 14–24. [Google Scholar] [CrossRef]
- Pawar, P.; Munishwar, S.; Gautam, S.; Gedam, R. Physical, thermal, structural and optical properties of Dy3+ doped lithium alumino-borate glasses for bright W-LED. J. Lumin. 2017, 183, 79–88. [Google Scholar] [CrossRef]
- Chimalawong, P.; Kirdsiri, K.; Kaewkhao, J.; Limsuwan, P. Investigation on the Physical and Optical Properties of Dy3+ Doped Soda-Lime-Silicate Glasses. Procedia Eng. 2012, 32, 690–698. [Google Scholar] [CrossRef]
- Yusof, N.N.; Ghoshal, S.K.; Omar, M.F. Physical, structural, optical and thermoluminescence behavior of Dy2O3 doped sodium magnesium borosilicate glasses. Results Phys. 2019, 12, 827–839. [Google Scholar]
- Anwar, A.; Zulfiqar, S.; Yousuf, M.A.; Ragab, S.A.; Khan, M.A.; Shakir, I.; Warsi, M.F. Impact of rare earth Dy+3 cations on the various parameters of nanocrystalline nickel spinel ferrite. J. Mater. Res. Technol. 2020, 9, 5313–5325. [Google Scholar] [CrossRef]
- Mhareb, M.; Hashim, S.; Ghoshal, S.; Alajerami, Y.; Bqoor, M.J.; Hamdan, A.I.; Saleh, M.A.; Karim, M.K.A. Effect of Dy2O3 impurities on the physical, optical and thermoluminescence properties of lithium borate glass. J. Lumin. 2016, 177, 366–372. [Google Scholar] [CrossRef]
- Mhareb, M.; Hashim, S.; Ghoshal, S.K.; Alajerami, Y.S.M.; Saleh, M.A.; Azizan, S.A.B.; Razak, N.A.B.; Karim, M.K.A. Influences of dysprosium and phosphorous oxides co-doping on thermoluminescence features and kinetic parameters of lithium magnesium borate glass. J. Radioanal. Nucl. Chem. 2015, 305, 469–477. [Google Scholar] [CrossRef]
- Pawar, P.P.; Munishwar, S.R.; Gautam, S.; Gedam, R.S. Structural and photoluminescence properties of Dy3+ doped different modifier oxide-based lithium borate glasses. J. Lumin. 2012, 132, 2984–2991. [Google Scholar]
- Zelati, A.; Amirabadizadeh, A.; Hosseini, A. A facile approach to synthesize dysprosium oxide nanoparticles. Int. J. Ind. Chem. 2014, 5, 69–75. [Google Scholar] [CrossRef][Green Version]
- Khan, I.; Rooh, G.; Rajaramakrishna, R.; Srisittipokakun, N.; Kim, H.J.; Kaewkhao, J.; Ruangtaweep, Y. Photoluminescence Properties of Dy3+ Ion-Doped Li2O-PbO-Gd2O3-SiO2 Glasses for White Light Application. Braz. J. Phys. 2019, 49, 605–614. [Google Scholar] [CrossRef]
- Mhareb, M.; Almessiere, M.; Sayyed, M.; Alajerami, Y. Physical, structural, optical and photons attenuation attributes of lithium-magnesium-borate glasses: Role of Tm2O3 doping. Optik 2019, 182, 821–831. [Google Scholar] [CrossRef]
- Kamaruddin, W.; Rohani, M.; Sahar, M.; Liu, H.; Sang, Y. Synthesis and characterization of lithium niobium borate glasses containing neodymium. J. Rare Earths 2016, 34, 1199–1205. [Google Scholar] [CrossRef]
- Ichoja, A.; Hashim, S.; Ghoshal, S.; Hashim, I.H.; Omar, R. Physical, structural and optical studies on magnesium borate glasses doped with dysprosium ion. J. Rare Earths 2018, 36, 1264–1271. [Google Scholar] [CrossRef]
- Effendy, N.; Wahab, Z.A.; Aziz, S.A.; Matori, K.A.; Zaid, M.H.M.; Rashid, S.S.A.; Nuraidayani, E.; Abdul, W.Z.; Hj., A.A.S.; Amin, M.K.; et al. Characterization and optical properties of erbium oxide doped ZnO–SLS glass for potential optical and optoelectronic materials. Mater. Express 2017, 7, 59–65. [Google Scholar] [CrossRef]
- Shaaban, K.; El-Maaref, A.; Abdelawwad, M.; Saddeek, Y.B.; Wilke, H.; Hillmer, H. Spectroscopic properties and Judd-Ofelt analysis of Dy3+ ions in molybdenum borosilicate glasses. J. Lumin. 2018, 196, 477–484. [Google Scholar] [CrossRef]
- Babu, M.R.; Babu, A.M.; Moorthy, L.R. Structural and optical properties of Nd3+-doped lead borosilicate glasses for broadband laser amplification. Int. J. Appl. Eng. Res. 2018, 13, 7692–7700. [Google Scholar]
- Bhatia, B.; Meena, S.L.; Parihar, V.; Poonia, M. Optical Basicity and Polarizability of Nd3+-Doped Bismuth Borate Glasses. New J. Glas. Ceram. 2015, 5, 44–52. [Google Scholar] [CrossRef]
- Gedam, R.; Ramteke, D. Influence of CeO2 addition on the electrical and optical properties of lithium borate glasses. J. Phys. Chem. Solids 2013, 74, 1399–1402. [Google Scholar] [CrossRef]
- Hasnimulyati, L.; Halimah, M.K.; Zakaria, A.; Halim, S.A.; Ishak, M.; Eevon, C. Structural and optical properties of Tm2O3-doped zinc borotellurite glass system. J. Ovonic Res. 2016, 12, 291–299. [Google Scholar]
- Kundu, V.; Dhiman, R.L.; Maan, A.S.; Goyal, D.R.; Garg, A.B.; Mittal, R.; Mukhopadhyay, R. Optical Properties of Alkaline Earth Ions Doped Bismuth Borate Glasses. AIP Conf. Proc. 2011, 1349, 545. [Google Scholar] [CrossRef]
- Kaur, P.; Singh, K.; Kurudirek, M.; Thakur, S. Study of environment friendly bismuth incorporated lithium borate glass system for structural, gamma-ray and fast neutron shielding properties. Spectrochim. Acta Part A Mol. Biomol. Spectrosc. 2019, 223, 117309. [Google Scholar] [CrossRef]
- Algradee, M.A.; Sultan, M.; Samir, O.M.; Alwany, A.E.B. Electronic polarizability, optical basicity and interaction parameter for Nd2O3 doped lithium–zinc–phosphate glasses. Appl. Phys. A Mate. Sci. Process. 2017, 123, 524. [Google Scholar] [CrossRef]
- Pawar, P.; Munishwar, S.R.; Gedam, R. Eu2O3 doped bright orange-red luminescent lithium alumino-borate glasses for solid state lighting. J. Lumin. 2018, 200, 216–224. [Google Scholar] [CrossRef]
- Deepa, A.V.; Priya, M.; Suresh, S. Influence of Samarium Oxide ions on structural and optical properties of borate glasses. Sci. Res. Essays 2016, 11, 57–63. [Google Scholar] [CrossRef]
- Chandrasekhar, M.; Nagabhushana, H.; SudheerKumar, K.; Dhananjaya, N.; Sharma, S.; Kavyashree, D.; Shivakumara, C.; Nagabhushana, B. Comparison of structural and luminescence properties of Dy2O3 nanopowders synthesized by co-precipitation and green combustion routes. Mater. Res. Bull. 2014, 55, 237–245. [Google Scholar] [CrossRef]
- Ramteke, D.; Ganvir, V.; Munishwar, S.R.; Gedam, R. Concentration Effect of Sm3+ Ions on Structural and Luminescence Properties of Lithium Borate Glasses. Phys. Procedia 2015, 76, 25–30. [Google Scholar] [CrossRef]
- Pawar, P.; Munishwar, S.; Gedam, R. Intense white light luminescent Dy3+ doped lithium borate glasses for W-LED: A correlation between physical, thermal, structural and optical properties. Solid State Sci. 2017, 64, 41–50. [Google Scholar] [CrossRef]
- Shamshad, L.; Rooh, G.; Kirdsiri, K.; Srisittipokakun, N.; Damdee, B.; Kim, H.; Kaewkhao, J. Photoluminescence and white light generation behavior of lithium gadolinium silicoborate glasses. J. Alloys Compd. 2017, 695, 2347–2355. [Google Scholar] [CrossRef]
- Deopa, N.; Rao, A. Photoluminescence and energy transfer studies of Dy3+ ions doped lithium lead alumino borate glasses for w-LED and laser applications. J. Lumin. 2017, 192, 832–841. [Google Scholar] [CrossRef]
- Dawaud, R.S.E.S.; Hashim, S.; Alajerami, Y.; Mhareb, M.; Tamchek, N. Optical and structural properties of lithium sodium borate glasses doped Dy3+ ions. J. Mol. Struct. 2014, 1075, 113–117. [Google Scholar] [CrossRef]
- Pawar, P.; Munishwar, S.; Ramteke, D.; Gedam, R. Physical, structural, thermal and spectroscopic investigation of Sm2O3 doped LAB glasses for orange LED. J. Lumin. 2019, 208, 443–452. [Google Scholar] [CrossRef]
- Azizan, S.A.; Hashim, S.; Razak, N.A.; Mhareb, M.H.A.; Alajerami, Y.S.M.; Tamchek, N. Physical and optical properties of Dy3+: Li2O–K2O–B2O3 glasses. J. Mol. Struct. 2014, 1076, 20–25. [Google Scholar] [CrossRef]
- Obayes, H.K.; Hussin, R.; Wagiran, H.; Saeed, M. Strontium ion concentration effects on structural and spectral properties of Li4Sr(BO3)3 glass. J. Non-Cryst. Solids 2015, 427, 83–90. [Google Scholar] [CrossRef]
- Yusof, N.N.; Ghoshal, S.; Omar, M.F. Modified absorption attributes of neodymium doped magnesium-zinc-sulfophosphate glass. Malays. J. Fundam. Appl. Sci. 2017, 13, 258–262. [Google Scholar] [CrossRef]
- Bulus, I.; Dalhatu, S.A.; Isah, M.; Hussin, R.; Soje, E.A. Structural and Luminescence Characterization of Lithium-Borosulfophosphate Glasses Containing Dysprosium Ions. Sci. World J. 2017, 12, 98–101. [Google Scholar]
- Rani, P.R.; Venkateswarlu, M.; Mahamuda, S.; Swapna, K.; Deopa, N.; Rao, A. Spectroscopic studies of Dy3+ ions doped barium lead alumino fluoro borate glasses. J. Alloys Compd. 2019, 787, 503–518. [Google Scholar] [CrossRef]
- Babu, A.M.; Jamalaiah, B.; Kumar, J.S.; Sasikala, T.; Moorthy, L.R. Spectroscopic and photoluminescence properties of Dy3+-doped lead tungsten tellurite glasses for laser materials. J. Alloys Compd. 2011, 509, 457–462. [Google Scholar] [CrossRef]
- Shasmal, N.; Karmakar, B. White light-emitting Dy3+-doped transparent chloroborosilicate glass: Synthesis and optical properties. J. Asian Ceram. Soc. 2018, 7, 42–52. [Google Scholar] [CrossRef]
- Deopa, N.; Rao, A.; Gupta, M.; Prakash, G.V. Spectroscopic investigations of Nd3+ doped Lithium Lead Alumino Borate glasses for 1.06 μm laser applications. Opt. Mater. 2018, 75, 127–134. [Google Scholar] [CrossRef]


| Glass Samples | mol% | |||
|---|---|---|---|---|
| Li2O | Al2O3 | B2O3 | Dy2O3 | |
| LABD-0.0 | 23 | 7.5 | 69.5 | 0.0 |
| LABD-0.2 | 23 | 7.5 | 69.3 | 0.2 |
| LABD-0.4 | 23 | 7.5 | 69.1 | 0.4 |
| LABD-0.6 | 23 | 7.5 | 68.9 | 0.6 |
| LABD-0.8 | 23 | 7.5 | 68.7 | 0.8 |
| LABD-1 | 23 | 7.5 | 68.5 | 1 |
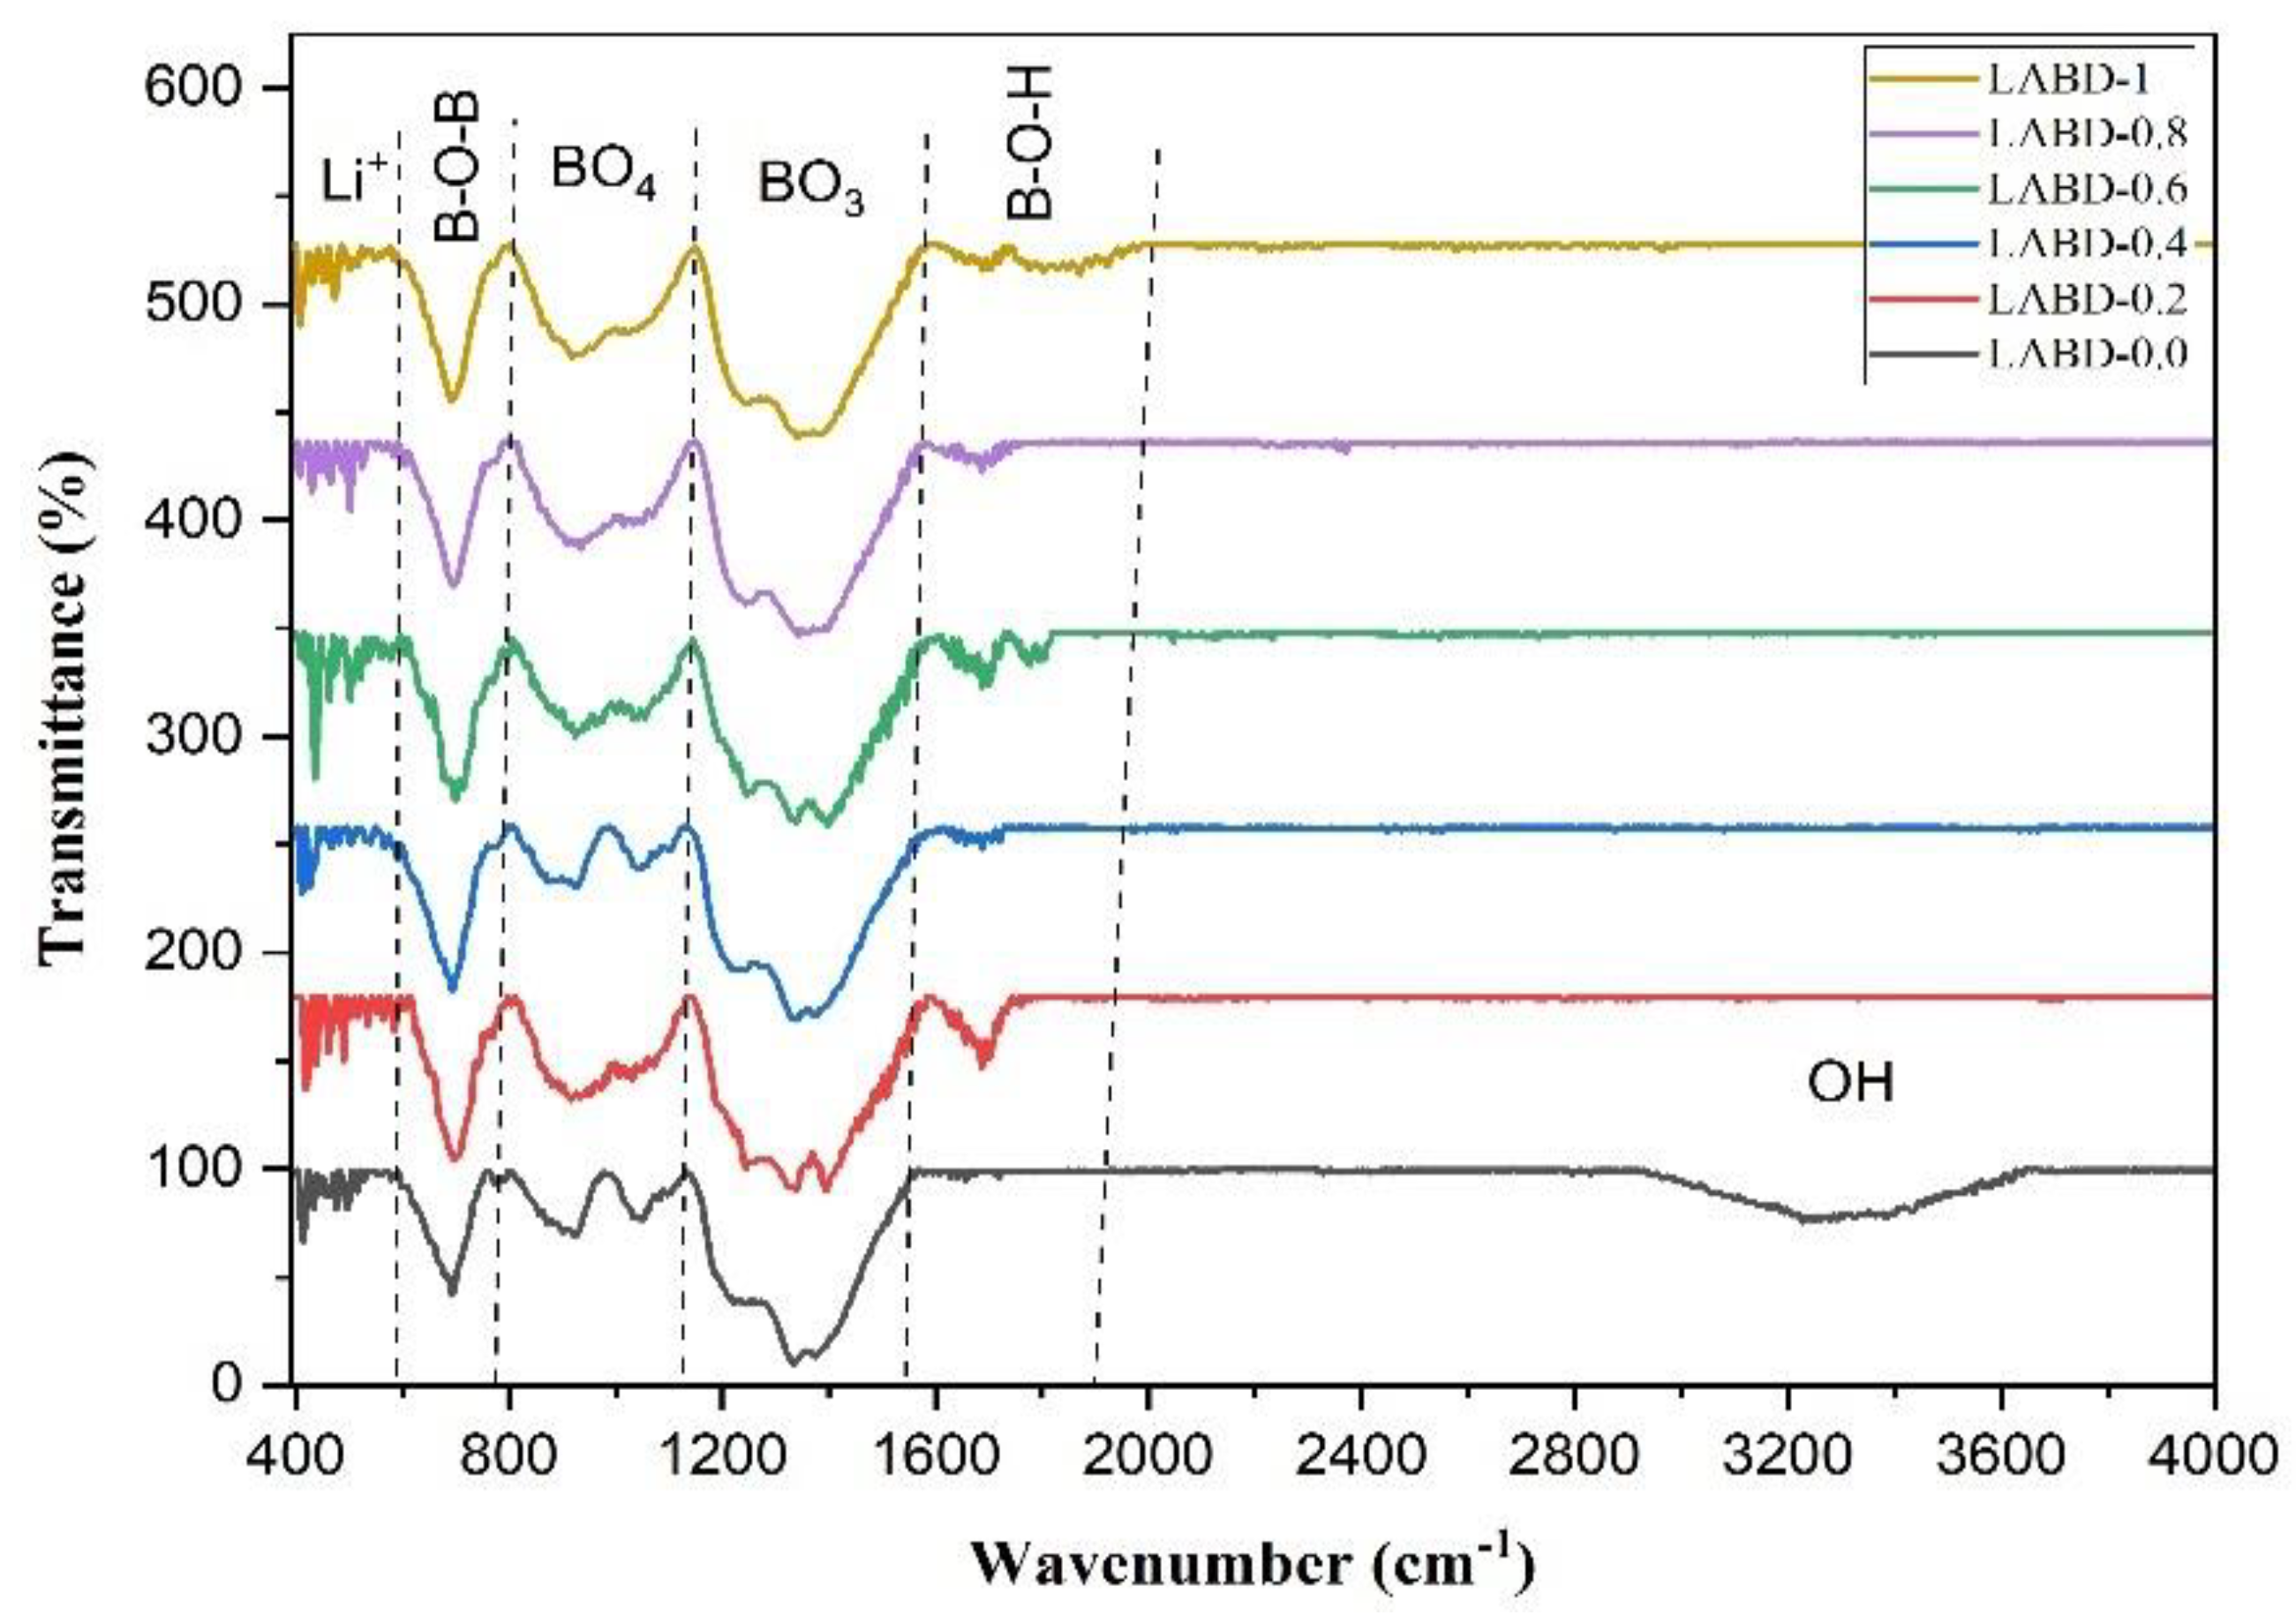
| Positions of Band (cm−1) for LAB Glasses with Diverse Dy3+ Ions Contents (mol%) | Band Assignments | |||||
|---|---|---|---|---|---|---|
| 0.0 | 0.2 | 0.4 | 0.6 | 0.8 | 1.0 | |
| 412.7, 526.5 | 416.6, 586.3 | 426.2, 540.06 | 433.9, 578.6 | 406.6, 588.3 | 406.9, 563.2 | Vibrations of Li+ ions [6]. |
| 692.4 | 696.3 | 694.3 | 700.1 | 696.3 | 692.4 | Bending vibration B-O-B linkages with BO3 units altogether with B-O-B bending vibration of bridging oxygen’s in BO3 and bonds in AlO6 groups [27]. |
| 925.8, 1051.2 | 918.1, 1056.9 | 925.8, 1043.4 | 923.9, 1055.06 | 933.5, 1033.8 | 920.05, 1024.2 | B-O stretching of tetrahedral BO4 bond [10]. |
| 1227.9, 1334.7, 1375.2 | 1244.09, 1332.8, 1396.4 | 1236.3, 1340.5, 1375.2 | 1246.02, 1328.9, 1390.6 | 1246.2, 1377.1 | 1247.9, 1382.9 | B–O–, stretching in pyroborate units Stretching of the trigonal BO3 units [8]. |
| 1687.7 | 1687.7 | 1687.7, 1801.5 | 1687.7 | 1687.7, 1870.9 | B-O-H bridge, OH bending vibration [28]. | |
| 3269.3 | -- | -- | -- | -- | -- | Stretching of OH groups or O-H (H2O bond) [29]. |
| Physical Parameters * | Units | Doping (mol% Dy2O3) | |||||
|---|---|---|---|---|---|---|---|
| 0.0 | 0.2 | 0.4 | 0.6 | 0.8 | 1 | ||
| Density | (g.cm−3) | 2.144 | 2.162 | 2.182 | 2.210 | 2.238 | 2.260 |
| Molecular weight, MT | g | 62.903 | 63.509 | 64.116 | 64.723 | 65.330 | 65.937 |
| (cm3/mol) | 29.339 | 29.375 | 29.384 | 29.286 | 29.191 | 29.175 | |
| The volume of boron atoms per mole | 16.031 | 11.959 | 11.886 | 11.058 | 11.656 | 11.576 | |
| Ion concentration (N) × 1020 | (ions/cm3) | 0.410 | 0.819 | 1.233 | 1.650 | 2.064 | |
| Polaron radius (rp) × 10−8 | 11.687 | 9.279 | 8.096 | 7.347 | 6.819 | ||
| Inter-nuclear distance (ri) × 10−8 | 29.0004 | 23.027 | 20.091 | 18.232 | 16.921 | ||
| Field strength (F) × 1016 | (cm−2) | 1.189 | 1.887 | 2.479 | 3.010 | 3.494 | |
| Average of boron-boron distance ‹dB-B› | nm | 0.298 | 0.270 | 0.270 | 0.263 | 0.268 | 0.267 |
| Absorption Transition | Wavelength (nm) | Energy (×10−3cm−1) | Oscillator Strength fexp (×10−6) |
|---|---|---|---|
| 6H15/2 → 6P7/2 | 352 | 29.321 | 0.451 |
| 6H15/2 → 4F7/2 | 393 | 25.945 | 0.520 |
| 6H15/2 → 4I15/2 | 458 | 22.234 | 0.696 |
| 6H15/2 → 4F9/2 | 669 | 13.523 | 0.554 |
| 6H15/2 → 6F3/2 | 802 | 12.644 | 0.615 |
| 6H15/2 → 6F5/2 | 841 | 11.113 | 0.478 |
| 6H15/2 → 6F7/2 | 902 | 10.145 | 1.305 |
| 6H15/2 → 6F9/2 + 6H7/2 | 1095 | 9.267 | 1.821 |
| 6H15/2 → 6F11/2 + 6H9/2 | 1271 | 7.834 | 3.218 |
| 6H15/2 → 6H11/2 | 1703 | 3.533 | 3.046 |
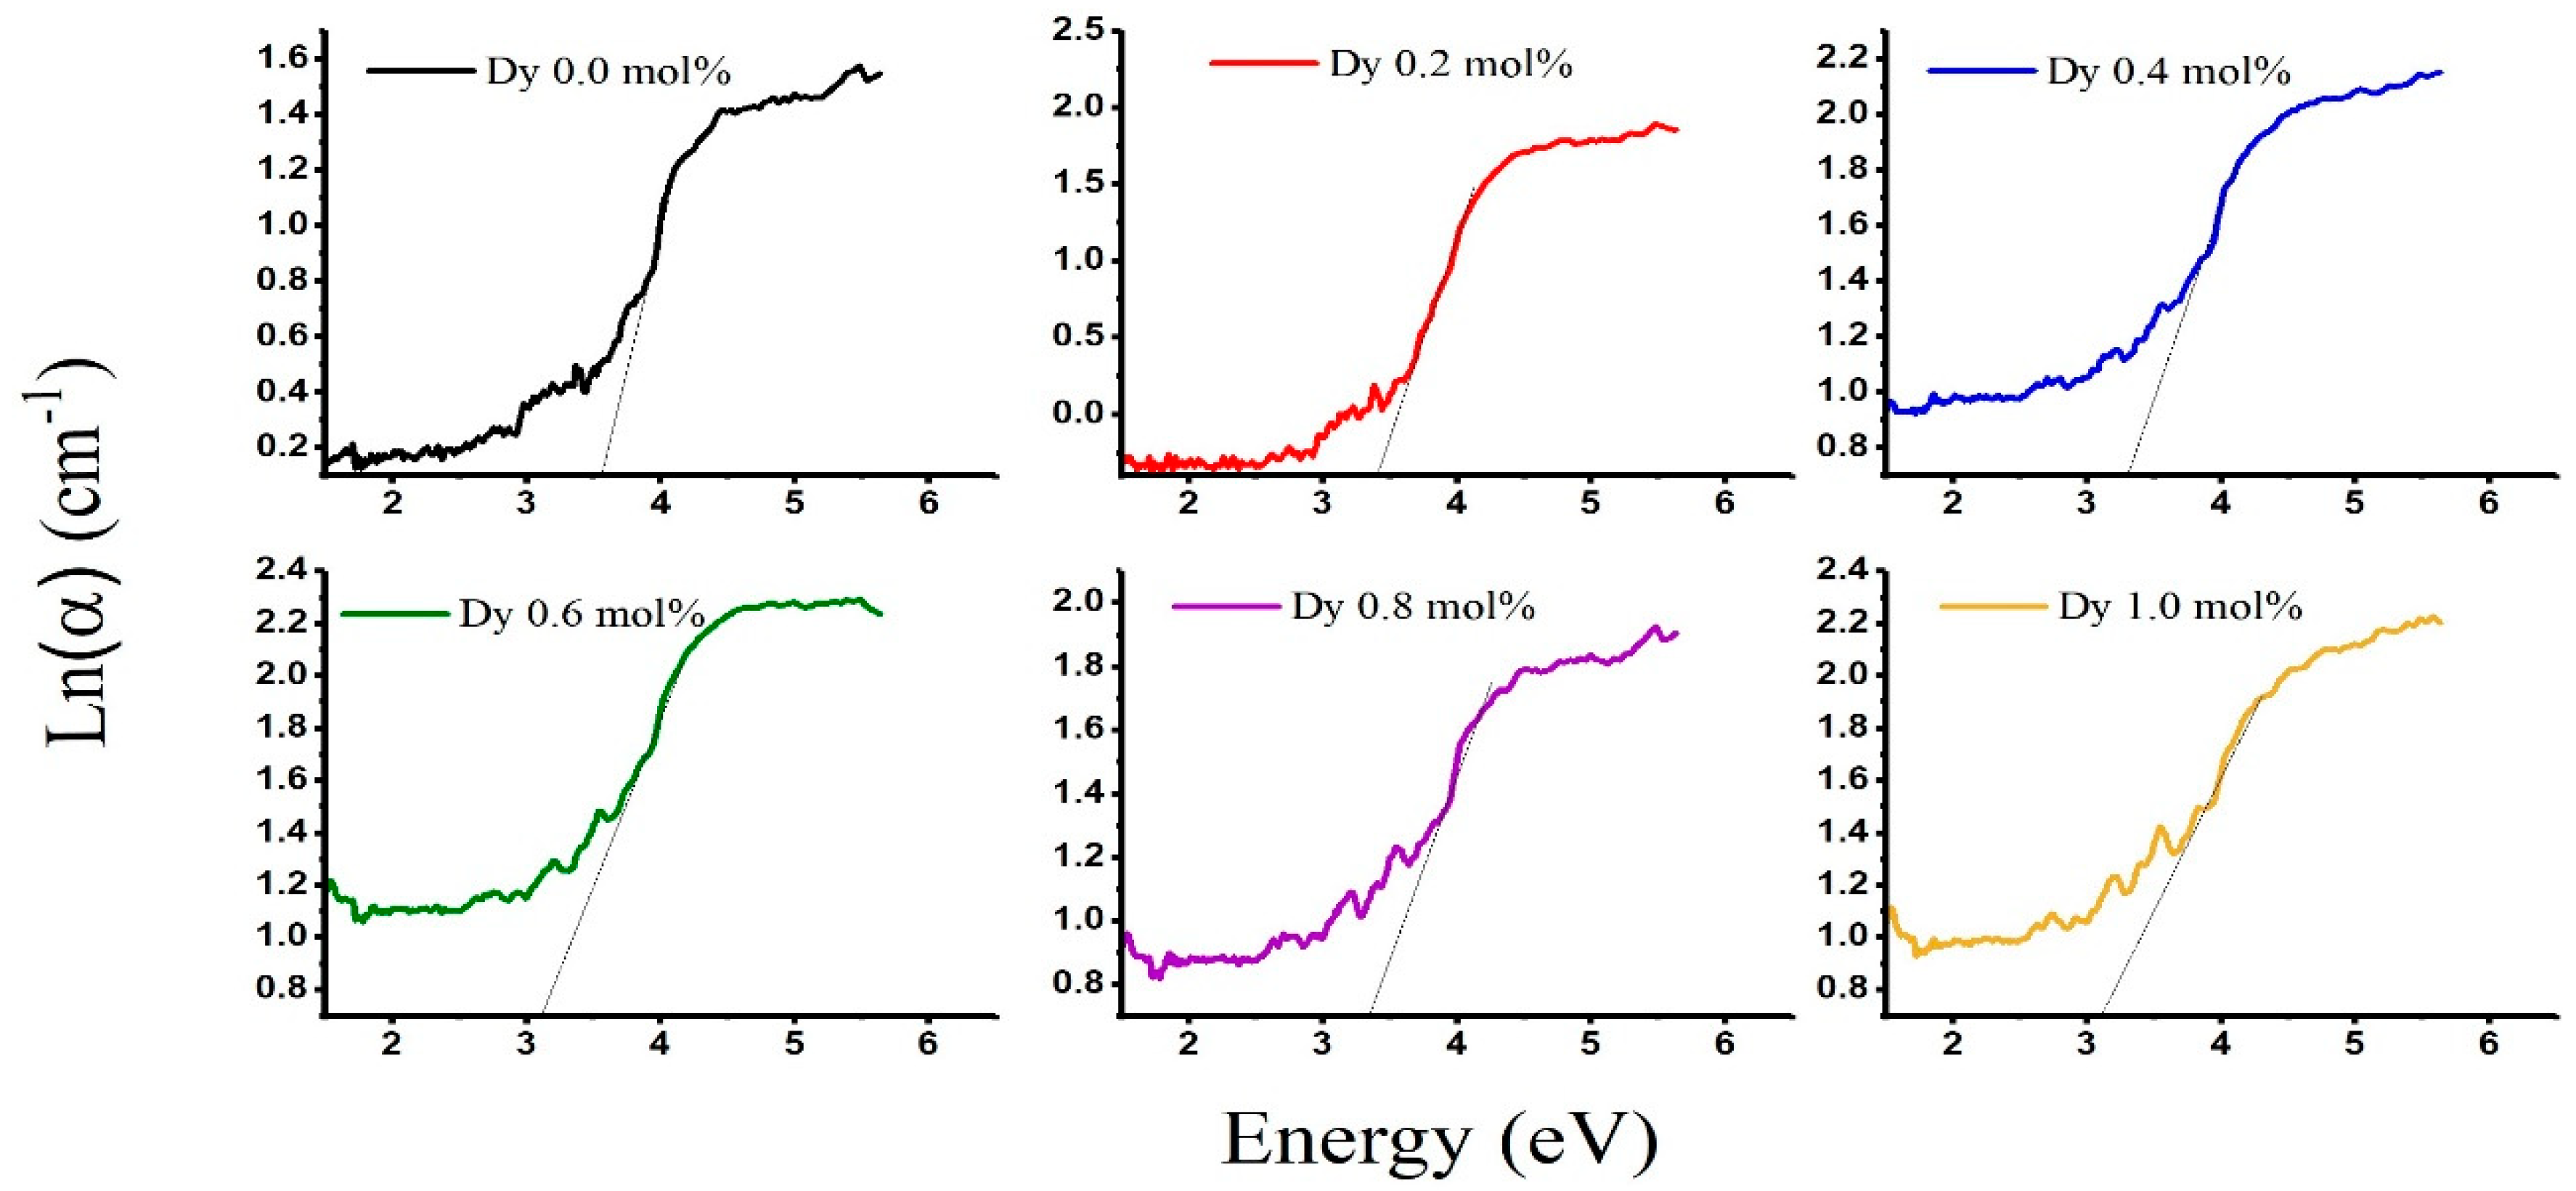
| Sample | Edir (eV) | Eindir (eV) | Eu (eV) | λc [nm] |
|---|---|---|---|---|
| LABD-0.0 | 3.580 | 3.189 | 3.520 | 362.36 |
| LADB-0.2 | 3.706 | 3.166 | 3.337 | 368.83 |
| LABD-0.4 | 3.566 | 2.919 | 3.272 | 376.44 |
| LABD-0.6 | 3.585 | 2.886 | 3.075 | 385.81 |
| LABD-0.8 | 3.473 | 2.7005 | 3.352 | 394.15 |
| LABD-1 | 3.650 | 2.556 | 3.058 | 401.81 |
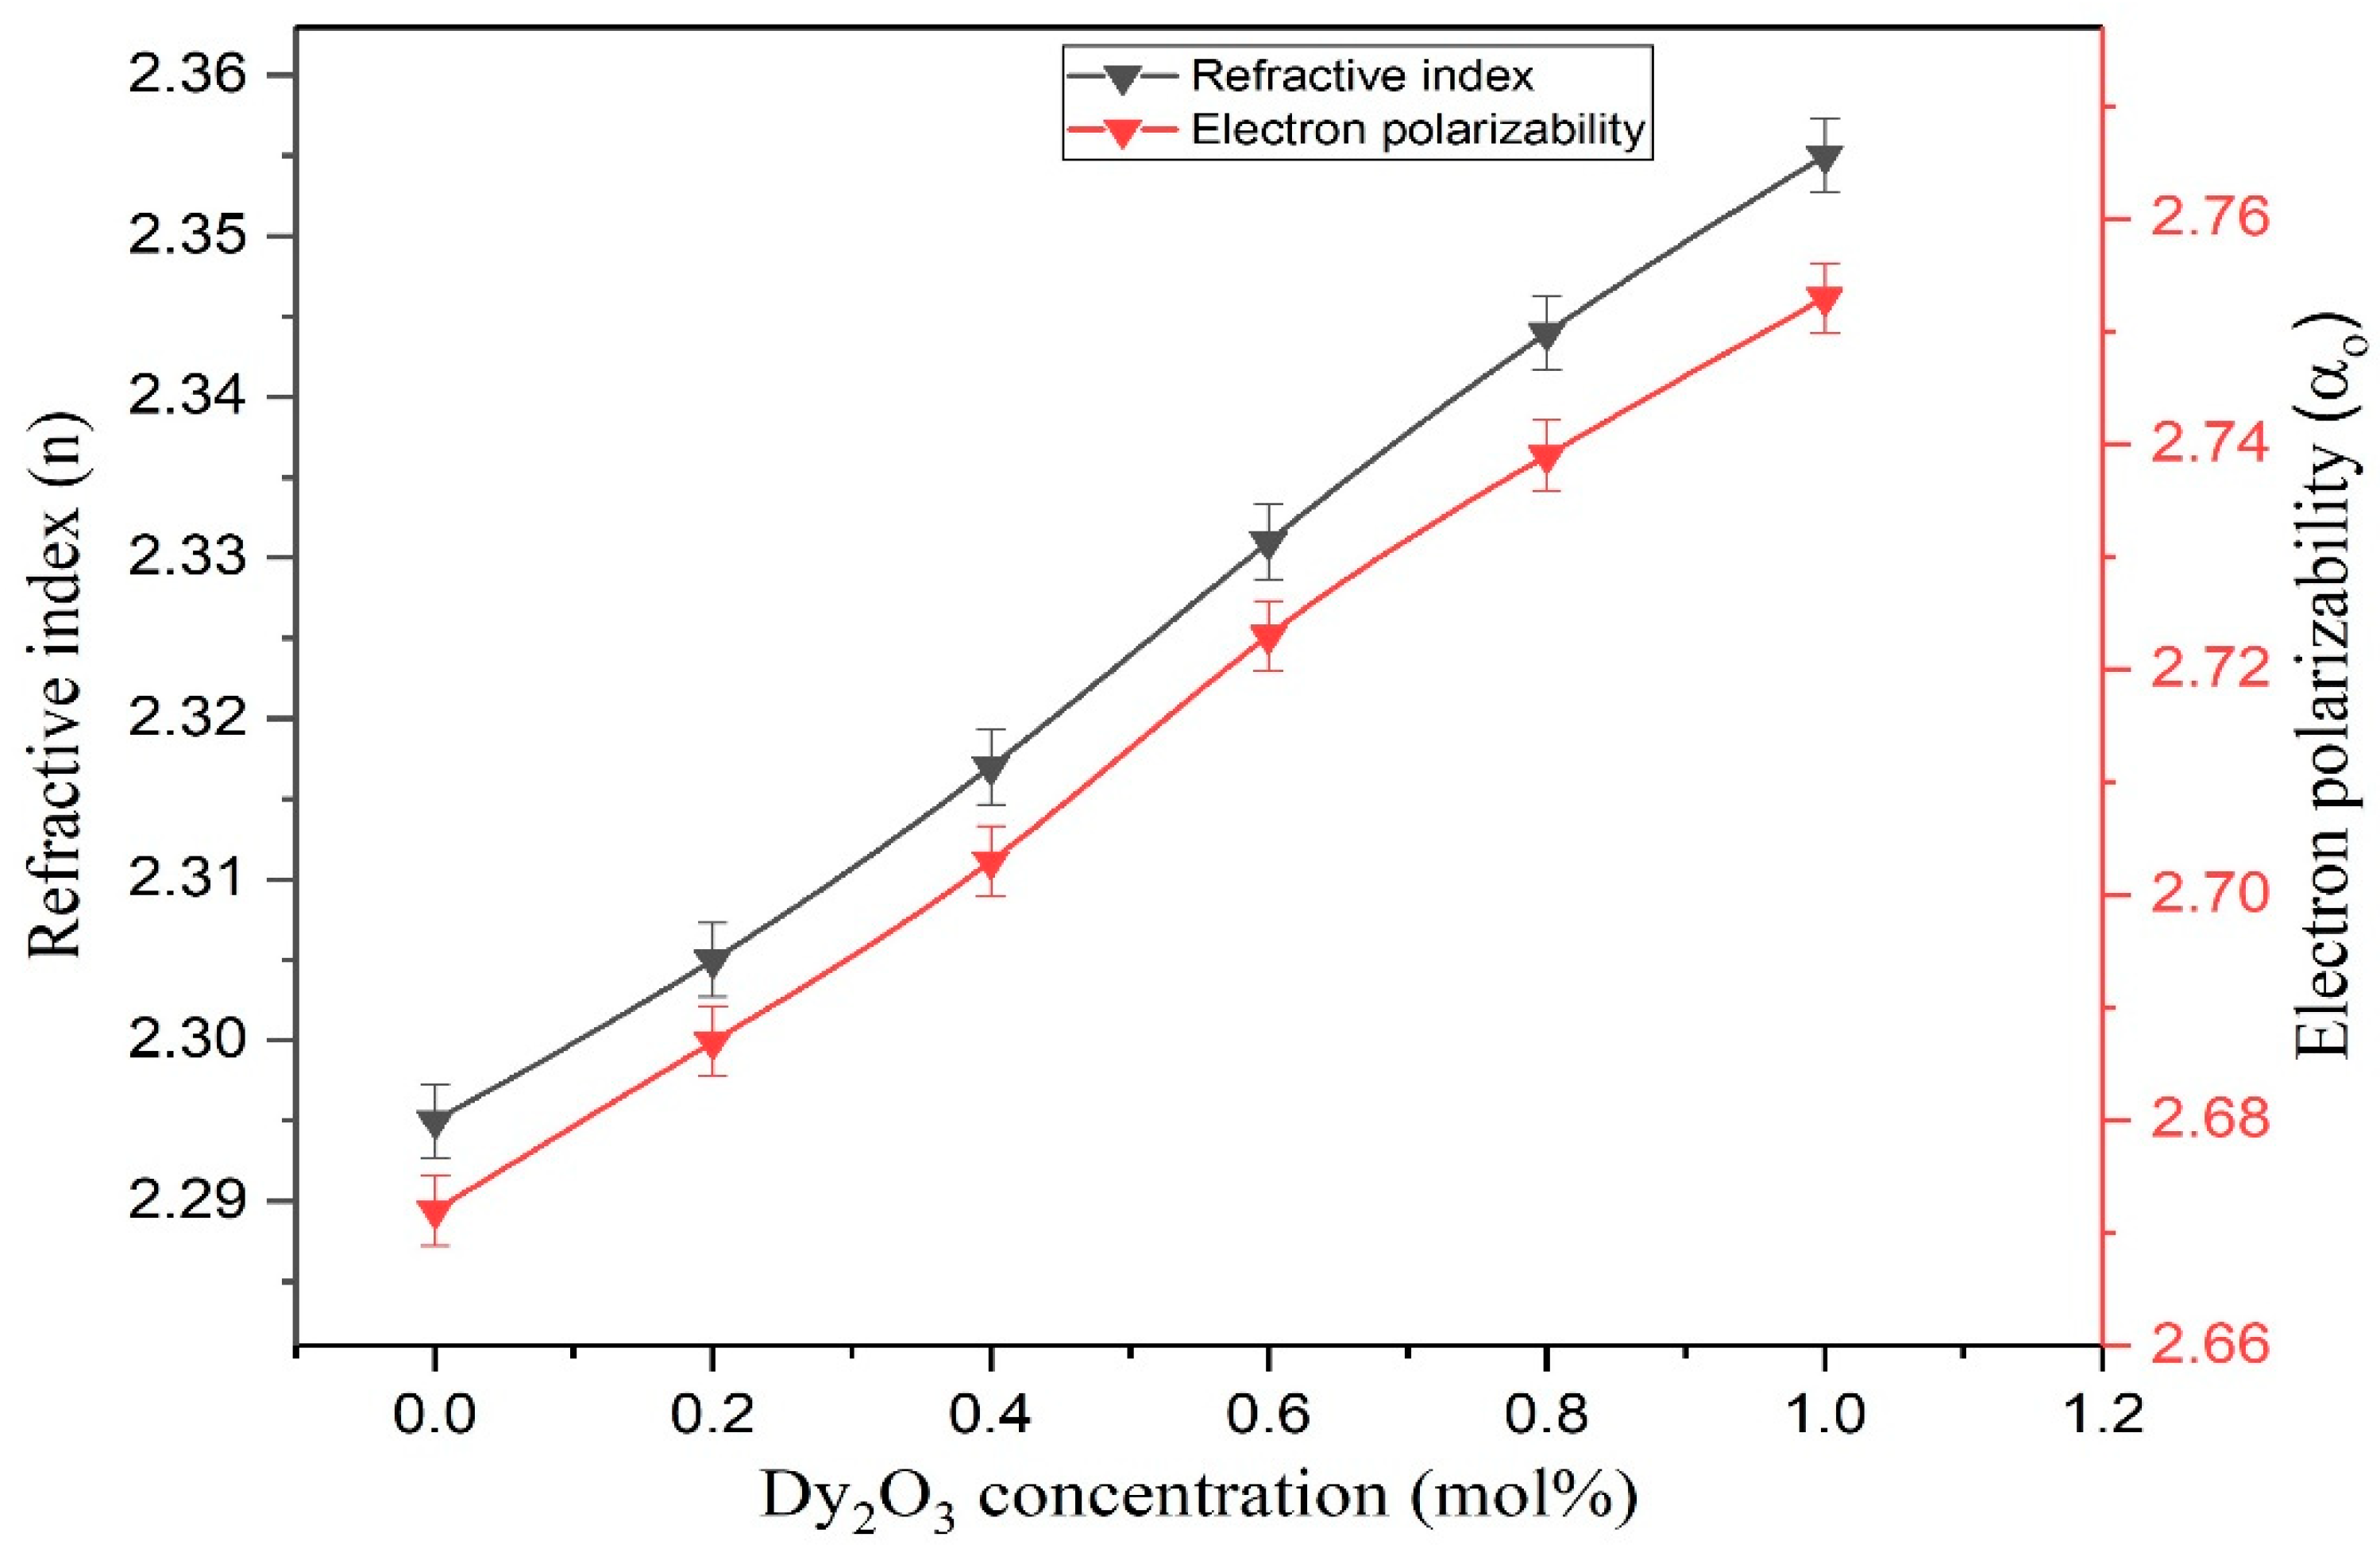
| Measurement | Dy3+ Doped Concentration, mol% | |||||
|---|---|---|---|---|---|---|
| 0.0 | 0.2 | 0.4 | 0.6 | 0.8 | 1.0 | |
| Refractive index (n) | 2.295 | 2.305 | 2.317 | 2.331 | 2.344 | 2.355 |
| Reflection loss (RL) | 0.154 | 0.155 | 0.157 | 0.159 | 0.161 | 0.163 |
| Molar refraction (Rm) (cm−3) | 5.741 | 4.330 | 4.355 | 4.366 | 4.375 | 4.393 |
| Oxygen packing density (OPD) | 86.57 | 86.46 | 86.44 | 86.72 | 87.01 | 87.81 |
| Optical basicity (Λ) | 1.240 | 1.248 | 1.257 | 1.268 | 1.277 | 1.285 |
| Optical electronegativity (χ) | 0.919 | 0.903 | 0.885 | 0.863 | 0.845 | 0.829 |
| Metallisation criterion (M) | 0.412 | 0.410 | 0.407 | 0.403 | 0.400 | 0.397 |
| Molar refractivity (RM) (cm−3) | 17.227 | 17.324 | 17.420 | 17.467 | 17.505 | 17.576 |
| Molar polarizability (αm) ×10−24 (cm−3) | 2.275 | 1.716 | 1.716 | 1.730 | 1.734 | 1.741 |
| Dielectric constant (ε) | 5.267 | 5.313 | 5.368 | 5.433 | 5.494 | 5.546 |
| Optical dielectric constant | 4.267 | 4.313 | 4.368 | 4.433 | 4.494 | 4.546 |
| Electron polarizability (αo) | 2.672 | 2.687 | 2.703 | 2.723 | 2.739 | 2.753 |
Publisher’s Note: MDPI stays neutral with regard to jurisdictional claims in published maps and institutional affiliations. |
© 2020 by the authors. Licensee MDPI, Basel, Switzerland. This article is an open access article distributed under the terms and conditions of the Creative Commons Attribution (CC BY) license (http://creativecommons.org/licenses/by/4.0/).
Share and Cite
Bagi Aljewaw, O.; Karim, M.K.A.; Mohamed Kamari, H.; Mohd Zaid, M.H.; Mohd Noor, N.; Che Isa, I.N.; Abu Mhareb, M.H. Impact of Dy2O3 Substitution on the Physical, Structural and Optical Properties of Lithium–Aluminium–Borate Glass System. Appl. Sci. 2020, 10, 8183. https://doi.org/10.3390/app10228183
Bagi Aljewaw O, Karim MKA, Mohamed Kamari H, Mohd Zaid MH, Mohd Noor N, Che Isa IN, Abu Mhareb MH. Impact of Dy2O3 Substitution on the Physical, Structural and Optical Properties of Lithium–Aluminium–Borate Glass System. Applied Sciences. 2020; 10(22):8183. https://doi.org/10.3390/app10228183
Chicago/Turabian StyleBagi Aljewaw, Osama, Muhammad Khalis Abdul Karim, Halimah Mohamed Kamari, Mohd Hafiz Mohd Zaid, Noramaliza Mohd Noor, Iza Nurzawani Che Isa, and Mohammad Hasan Abu Mhareb. 2020. "Impact of Dy2O3 Substitution on the Physical, Structural and Optical Properties of Lithium–Aluminium–Borate Glass System" Applied Sciences 10, no. 22: 8183. https://doi.org/10.3390/app10228183
APA StyleBagi Aljewaw, O., Karim, M. K. A., Mohamed Kamari, H., Mohd Zaid, M. H., Mohd Noor, N., Che Isa, I. N., & Abu Mhareb, M. H. (2020). Impact of Dy2O3 Substitution on the Physical, Structural and Optical Properties of Lithium–Aluminium–Borate Glass System. Applied Sciences, 10(22), 8183. https://doi.org/10.3390/app10228183