The Positive Feedback Loop between the Impacts of Climate Change and Agricultural Expansion and Relocation

Abstract
:
1. Introduction

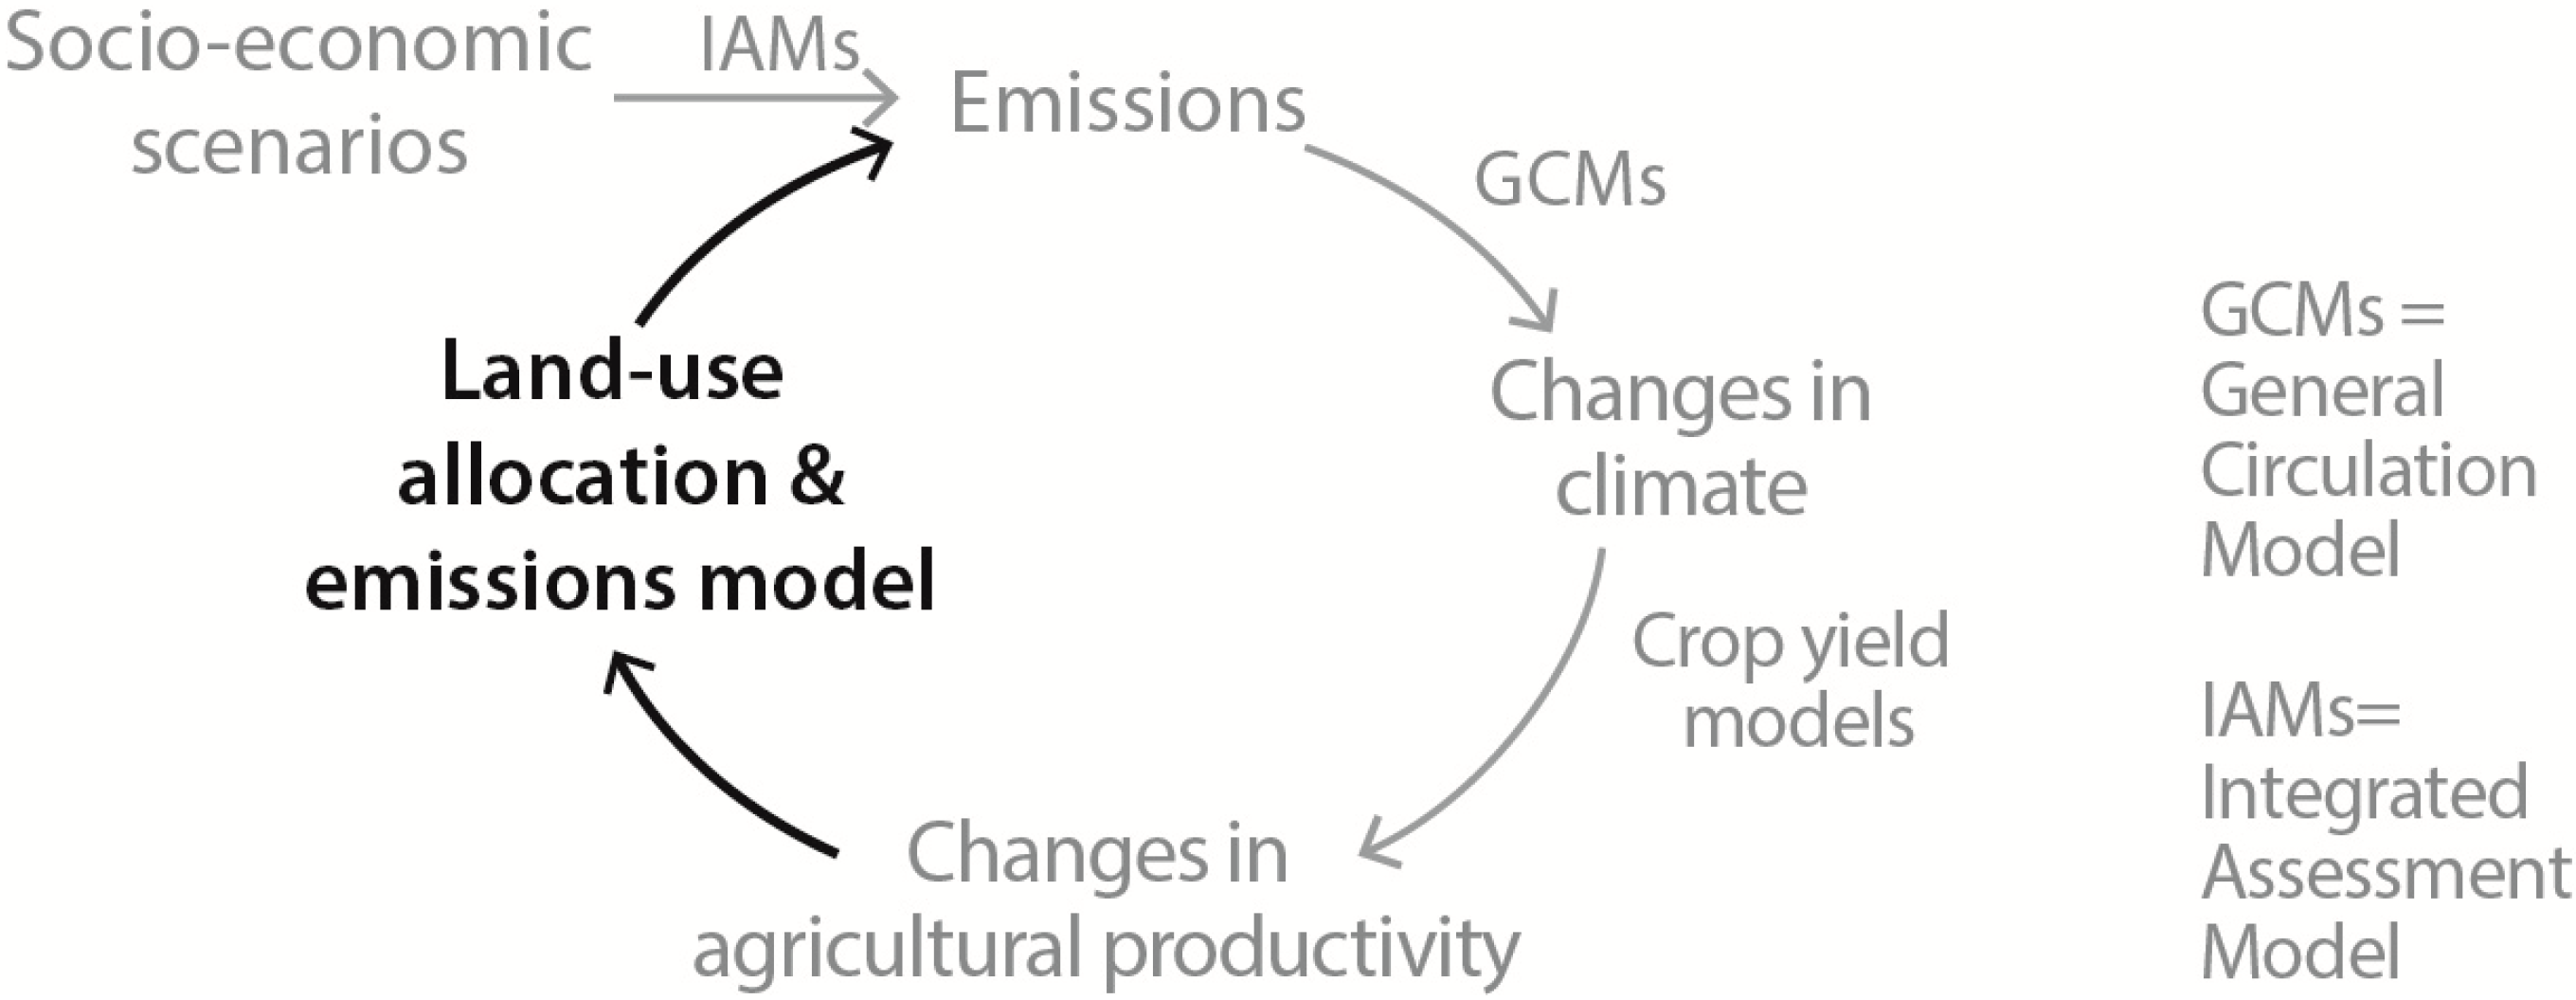
- Change in yields, followed by a change in the area needed to supply the same amount of food. As discussed above, yields are projected to be affected from mildly positively to severely negatively, meaning that overall cropland will have to expand further into natural vegetation to compensate for somewhat lower average yields.
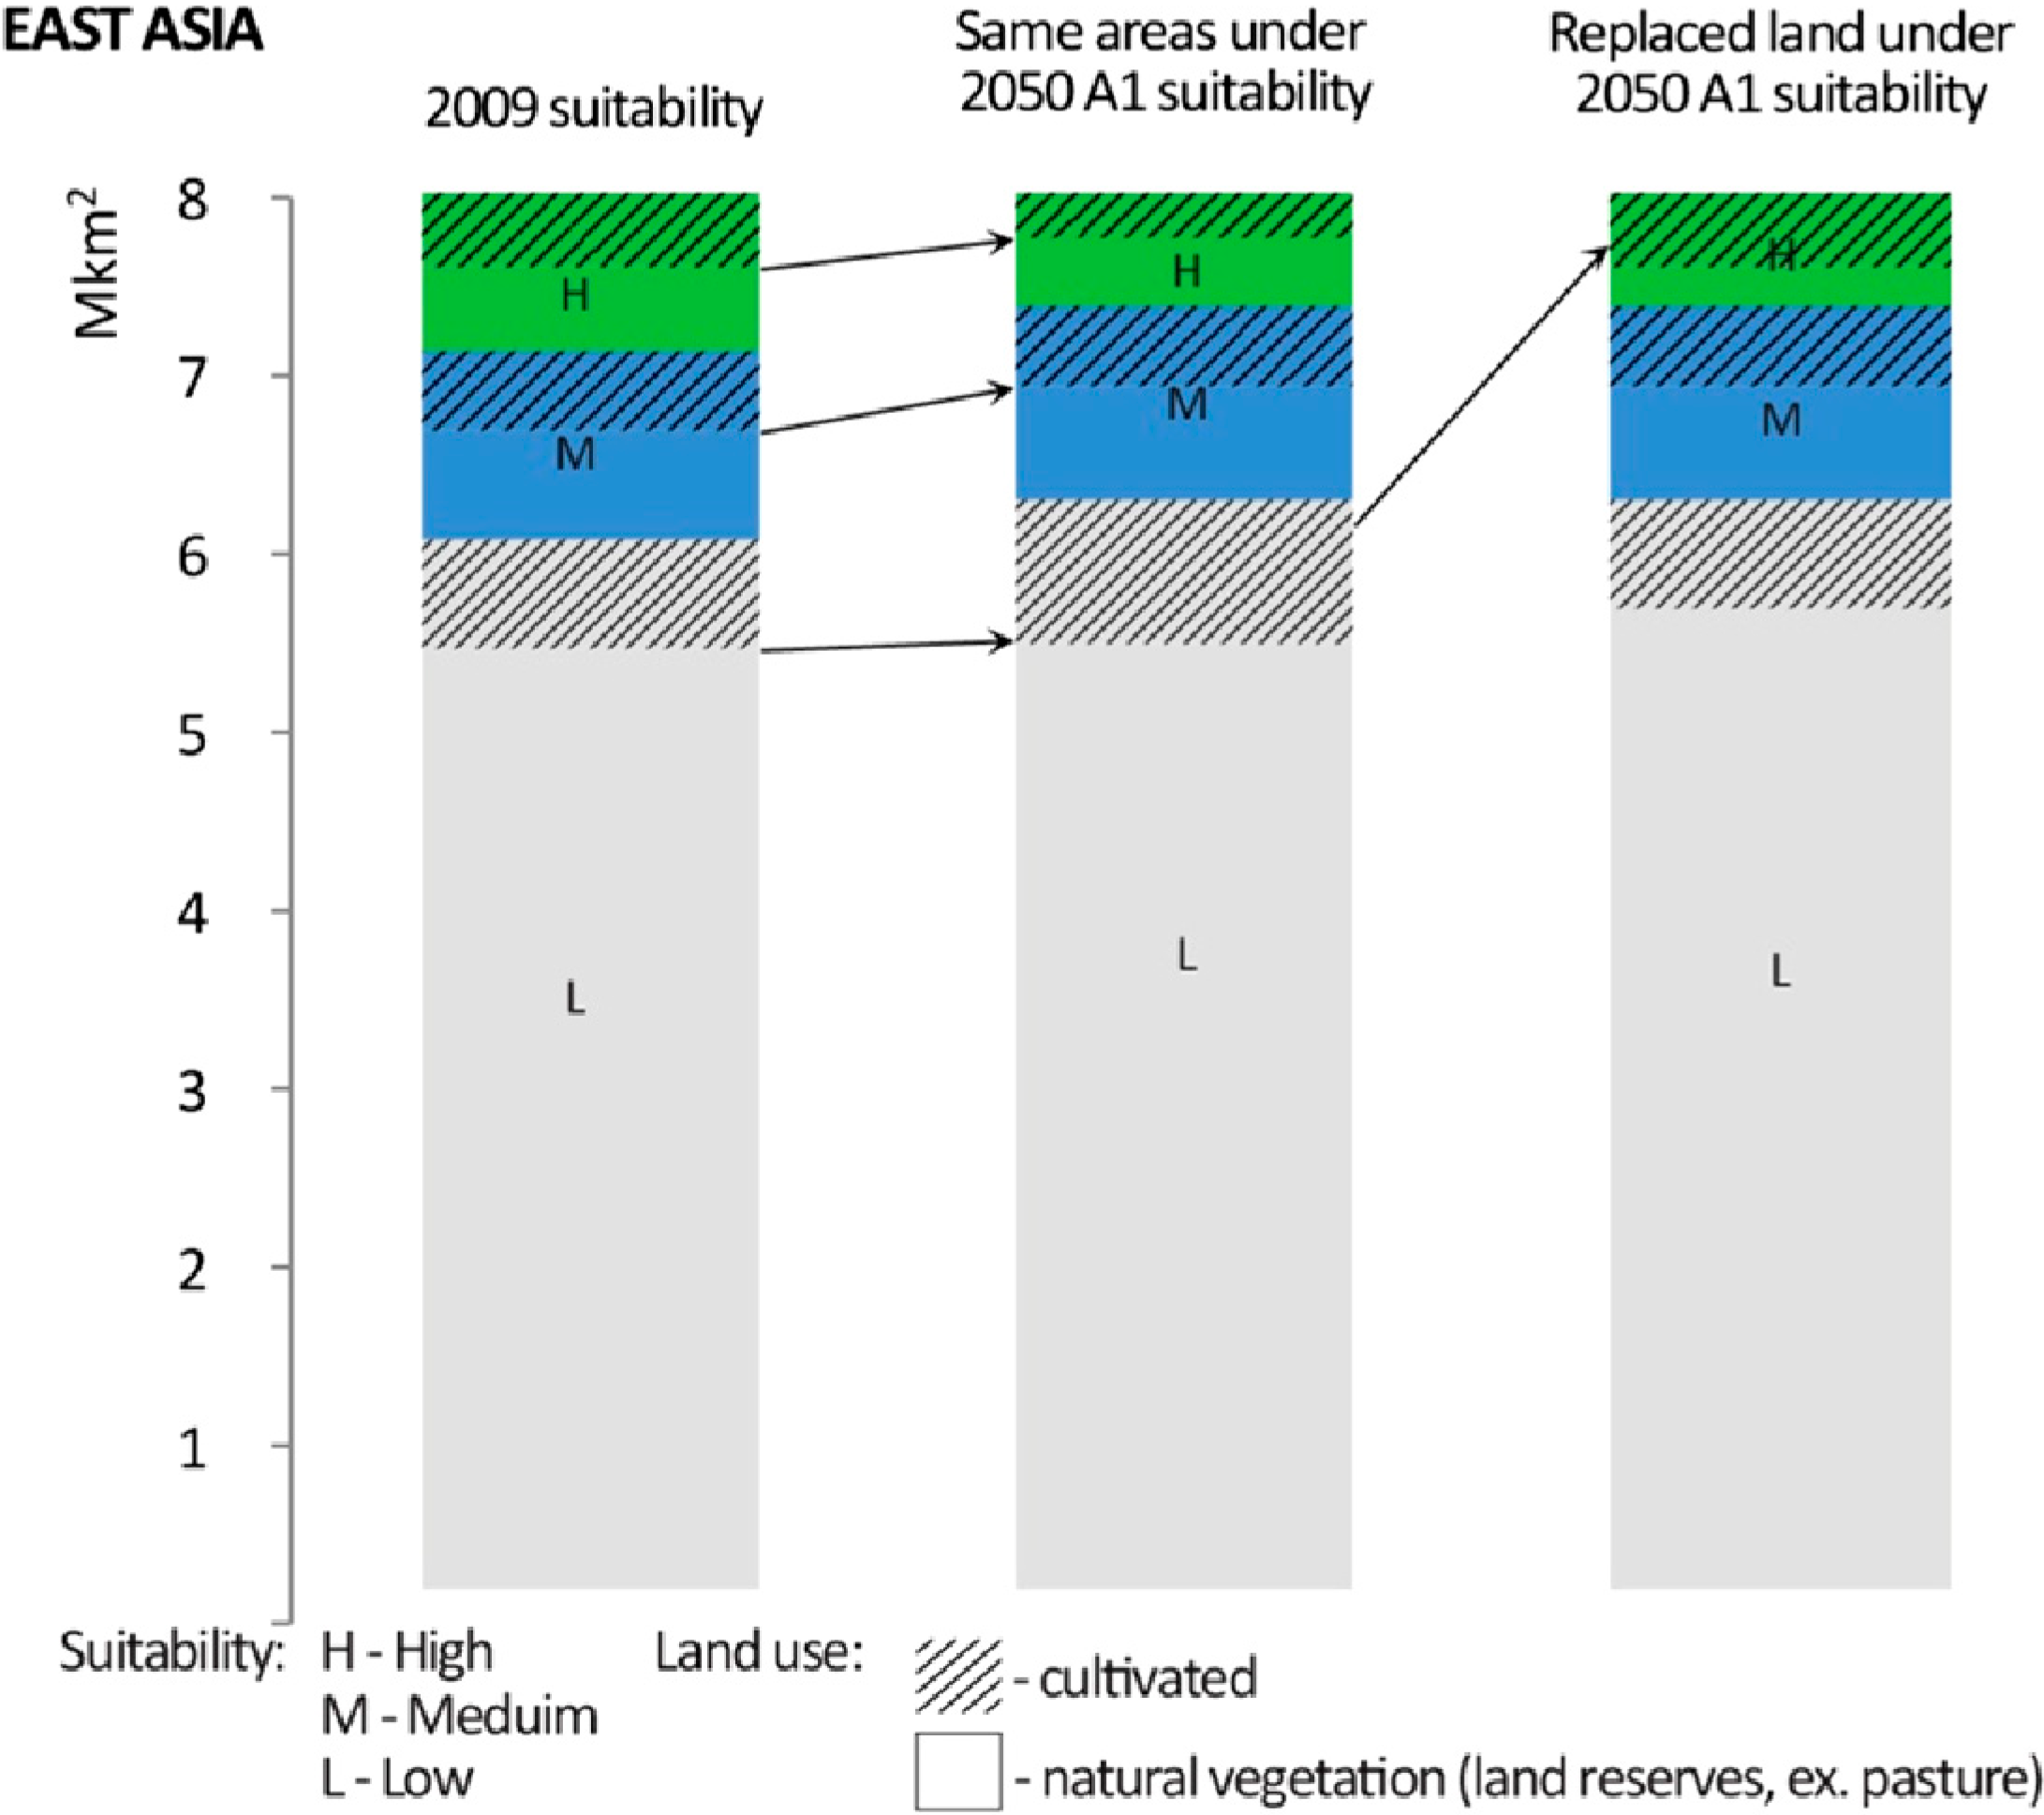
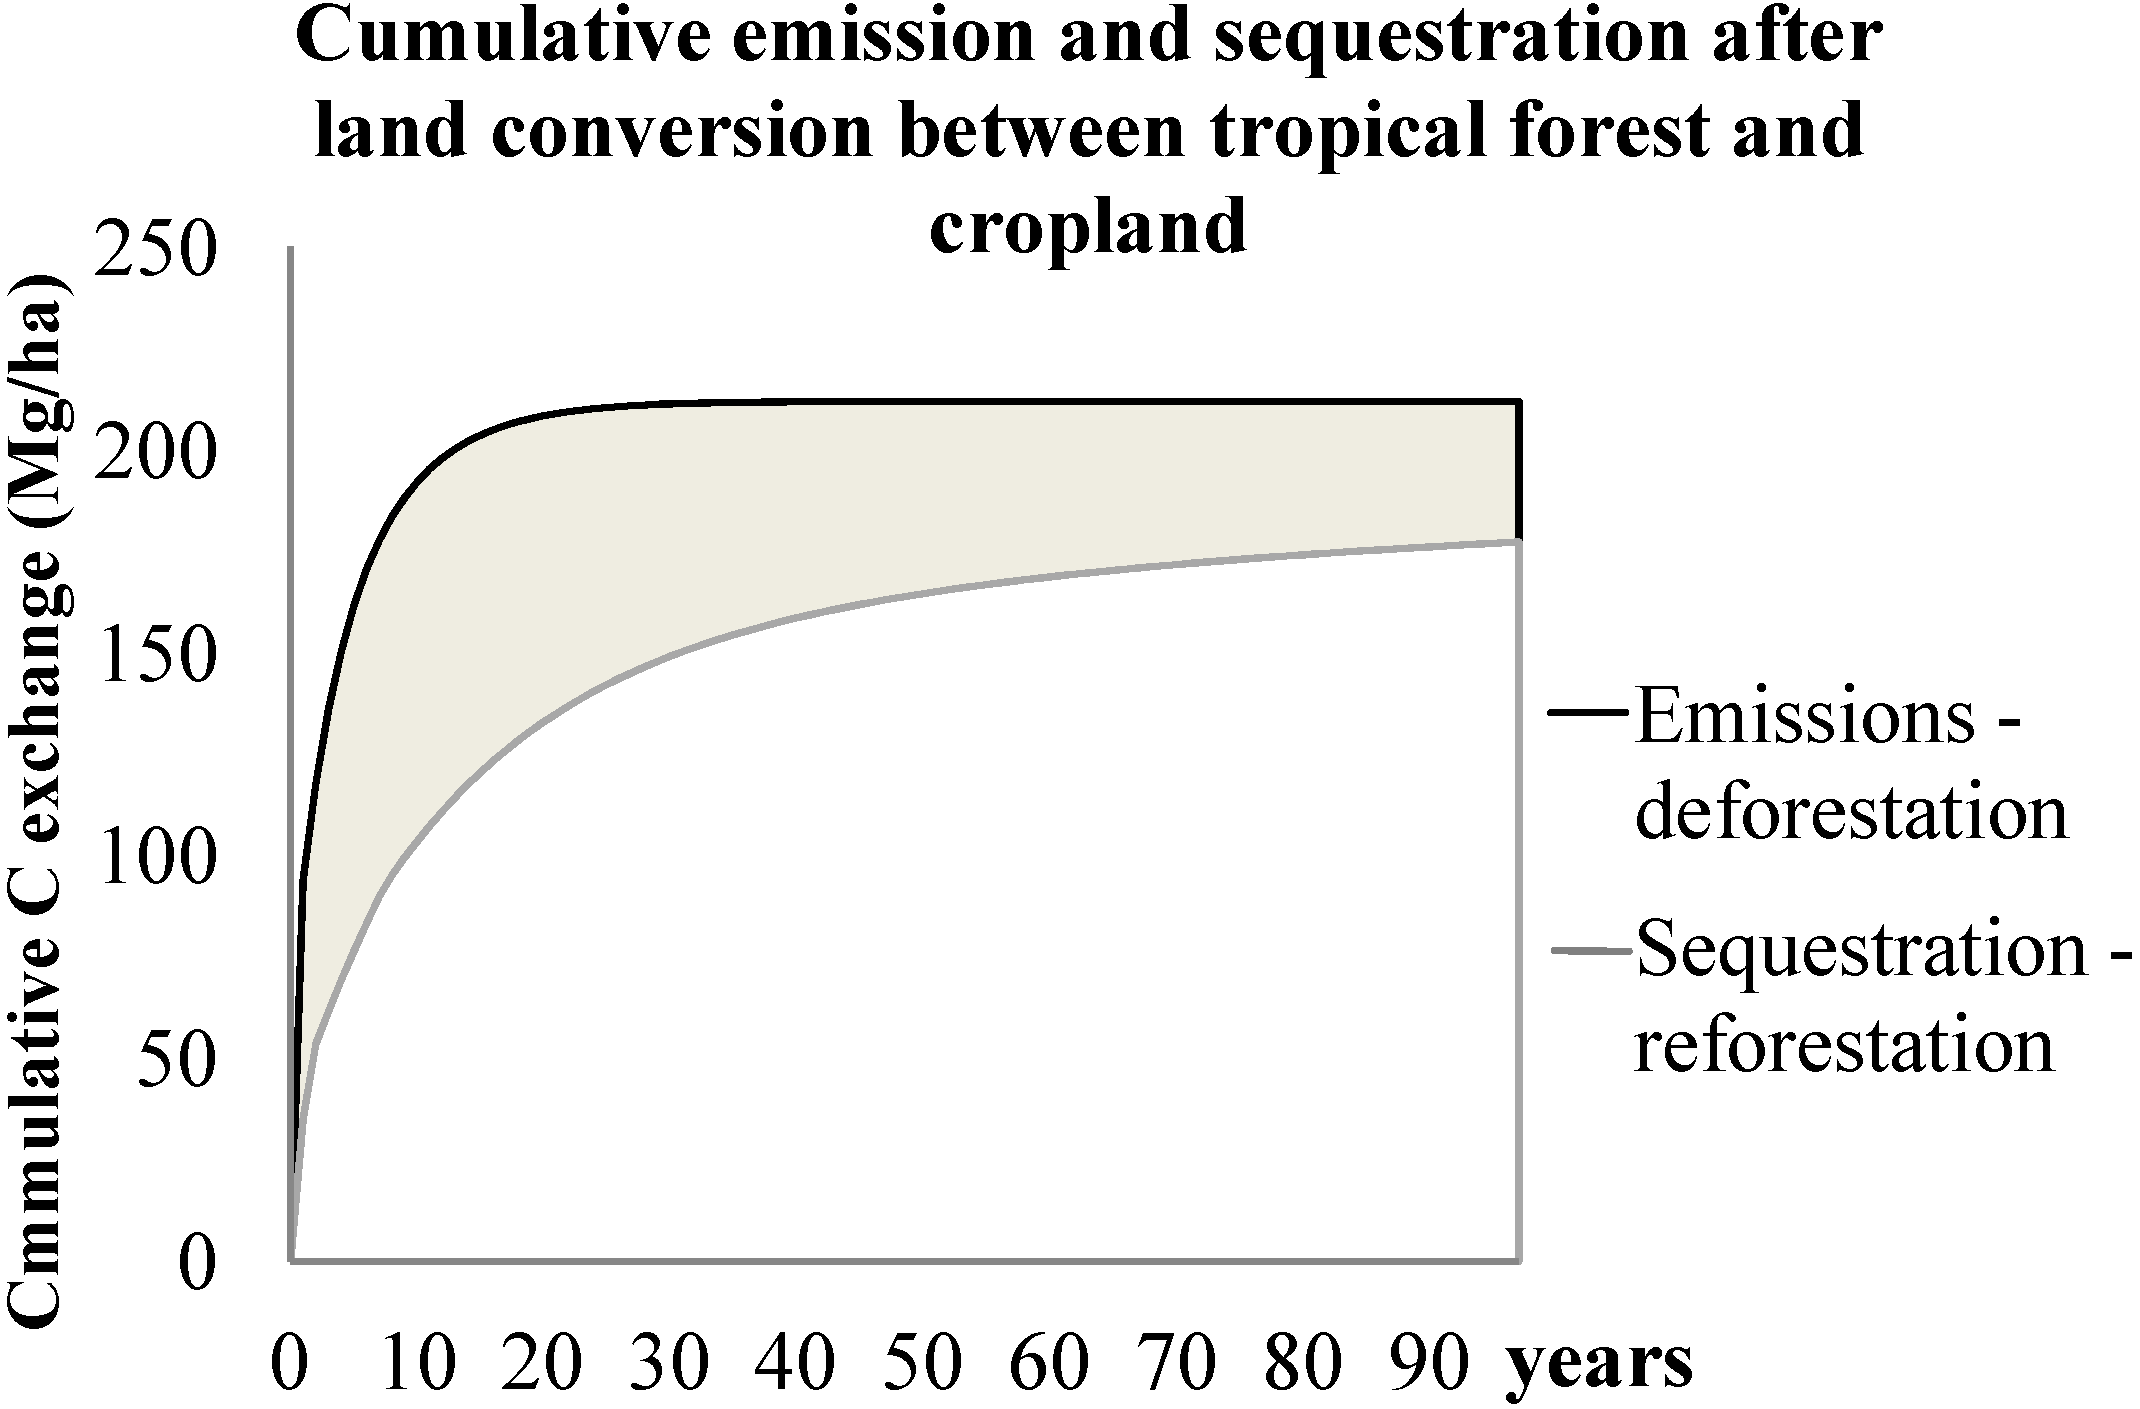
- Shifts in agricultural suitability, followed by relocation of agriculture. Cropping will follow agricultural suitability into higher latitudes, sometimes higher altitudes, causing deforestation of previously uncultivated areas and some reforestation on abandoned land.
- Changes in water demand for irrigated agriculture. In crop yield models, areas equipped with irrigation are “protected” from any changes in precipitation and optimal evapotranspiration. That is, the models assume that enough water will be available for optimum irrigation. In reality, yields of irrigated agriculture can be affected if climate change alters the balance between the water available for irrigation and irrigation water demand (it can influence both the supply and demand sides). This again would result in cropland expansion as compensation for lower yields. Because of the problem of a lack of reliable data on the availability of irrigation water, this pathway is not included in the present paper.

| Method/Model | Crops | No of GCMs | SRES Scenarios | Adaptation | C Fertilisation | Global Impact on Yields | |
|---|---|---|---|---|---|---|---|
| Rosenzweig et al. [8], Iglesias et al. [10] | Process-based crop yield models (CERES, SOYGRO) | W R M | 1 (HadCM3) | A1Fl, A1B, A2, B1, B2 | Yes | Yes | −1% to −16% |
| Cline [13] | Merges Ricardian approach with the results from Parry et al. [9] | W R M | 6 | A2 | Yes | Yes | −3% to −6% |
| Tebaldi et al. [12] (For 2030) | Regression analysis of y = f(T,p) + pdfs from GCMs | W M B | 25 | A1B | No | Yes | W + 1.6% M −14.1% B −1.8% |
| IFPRI [15] | Process-based crop yield model (DSSAT) + IMPACT (PE model) | M, R, W, Potato, Cassava, Sorghum | 2 (CSIRO, MIROC) | A1B, B1 | Yes (economic) | Yes | LIC HIC M −0.3% to −2.6% R −16.5% to −4.5% W −1.3% to +2.8% |
| Jaggard et al. [16] | Compilation of several models | W M R S Sugar Cane | 1 | A1B | Yes | Yes | W −2.5% to +2.8% M −2.5% to −0.3% R −16.5% to −4.5% S −6% to −3.2% |
| Osborne et al. [17] | Process-based crop yield model (GLAM) | W S | 14 | A1B | Yes, 3 levels | Yes | 0% to −50% |
2. Methodology

3. Results and Discussion
3.1. Emissions Associated with the Climate Change Impacts on Yields
| IPR Average Yield Improvement between 2009 and 2050 | Climate Change Scenario: A1 | Climate Change Scenario: B1 | |||
|---|---|---|---|---|---|
| CCI | Net GHG Emissions (Gt∙CO2e/yr) | CCI | Net GHG Emissions (Gt∙CO2e/yr) | ||
| Boreal N America | +36% | +5% | −0.007 | +6% | −0.008 |
| Central Asia | +73% | −1% | 0.001 | −2% | 0.002 |
| East Asia | +52% | +2% | −0.018 | +1% | −0.014 |
| Eastern Europe | +3% | −9% | 0.142 | −5% | 0.067 |
| Tropical Latin America | +64% | −5% | 0.072 | −5% | 0.059 |
| North Africa | +55% | −4% | 0.002 | −2% | −0.002 |
| Temp N America | +51% | −3% | 0.011 | −2% | 0.013 |
| Oceania | +13% | +1% | −0.019 | +1% | −0.021 |
| SE Asia | +79% | +3% | −0.061 | +3% | −0.054 |
| Southern Asia | +63% | −4% | 0.068 | −3% | 0.051 |
| Temp Latin America | +66% | +7% | −0.014 | +7% | −0.013 |
| Western Europe | +25% | +3% | −0.004 | +4% | −0.026 |
| Western Asia | +40% | −1% | 0.004 | −1% | 0.005 |
| Sub-Saharan Africa | +62% | −5% | 0.118 | −3% | 0.060 |
| WORLD | 0.297 | 0.119 | |||
3.2. Emissions Resulting from Cropland Relocation
| Climate Change Scenario: A1 | Climate Change Scenario: B1 | |||||
|---|---|---|---|---|---|---|
| (km2) | % of Total Cropland Becoming Unsuitable | Net GHG Emissions (Gt∙CO2e/yr) | (km2) | % of Total Cropland Becoming Unsuitable | Net GHG Emissions (Gt·CO2e/yr) | |
| Boreal N America | 315 | 0% | 0.0 | 1955 | 0% | 0.0 |
| Central Asia | 4862 | 2% | 0.0 | 7051 | 3% | 0.0 |
| East Asia | 178,749 | 20% | 0.014 | 92,726 | 10% | 0.006 |
| Eastern Europe | 8409 | 0% | 0.003 | 11,853 | 1% | 0.0 |
| Tropical Latin America | 81,476 | 9% | 0.059 | 65,534 | 8% | 0.047 |
| North Africa | 35,777 | 14% | 0.005 | 22,241 | 9% | 0.003 |
| Temp Northern America | 111,772 | 7% | 0.157 | 65,461 | 4% | 0.091 |
| Oceania | 74,387 | 42% | 0.029 | 63,899 | 36% | 0.025 |
| SE Asia | 45,694 | 6% | 0.021 | 32,393 | 4% | 0.015 |
| South Asia | 44,086 | 3% | 0.0 | 51,476 | 3% | 0.0 |
| Temp Latin America | 1189 | 0% | 0.0 | 893 | 0% | 0.0 |
| Western Europe | 46,844 | 7% | 0.011 | 35,796 | 5% | 0.009 |
| Western Asia | 18,551 | 8% | 0.005 | 11,861 | 5% | 0.003 |
| Sub-Saharan Africa | 75,629 | 6% | 0.043 | 76,281 | 6% | 0.043 |
| WORLD | 652,112 | 4.2% | 0.395 | 463,140 | 3.0% | 0.244 |

3.3. Combined Effects
| 2009 | No CC Scenario | Climate Change (A1) | Climate Change (B1) | ||||
|---|---|---|---|---|---|---|---|
| Cropland | Mkm2 | 15.6 | 21.1 | 21.7 | +3% | 21.5 | +2% |
| Pasture | Mkm2 | 34.3 | 36.1 | 36.4 | +1% | 36.4 | +1% |
| Net Forest cover | Mkm2 | 40.2 | 37.2 | 35.6 | −4% | 35.7 | −4% |
| Tropical Pristine Forest cover | Mkm2 | 7.9 | 7.2 | 6.8 | −6% | 6.8 | −5% |
| Land use change GHG emissions | Pg∙CO2/yr | 4.0 | 5.8 | 6.6 | +13% | 6.3 | +8% |
| Total GHG emissions | Pg∙CO2/yr | 11.4 | 18.2 | 19.0 | +5% | 18.7 | +3% |
3.4. The Regional Interplay between Demand Increases and Climate Change Impacts
| Changes in Demand | Climate Change Impacts on Yields | Changes in Overall Land Suitability | |||
|---|---|---|---|---|---|
| A1 | B1 | A1 | B1 | ||
| Boreal N America | +38% | +5% | +6% | +12% | +6% |
| Central Asia | +115% | −1% | −2% | −6% | −9% |
| East Asia | +47% | +2% | +1% | −3% | −1% |
| Eastern Europe | +19% | −9% | −5% | +15% | +13% |
| Tropical Latin America | +92% | −5% | −5% | −10% | −7% |
| North Africa | +150% | −4% | −2% | -% | -% |
| Temp N America | +38% | −3% | −2% | +5% | +6% |
| Oceania | +89% | +1% | +1% | −6% | −10% |
| South-Eastern Asia | +119% | +3% | +3% | −3% | −2% |
| Southern Asia | +103% | −4% | −3% | +3% | +1% |
| Temp Latin America | +92% | +7% | +7% | +8% | +7% |
| West Europe | +10% | +3% | +4% | −4% | −4% |
| Western Asia | +139% | −1% | −1% | −4% | −3% |
| Sub-Saharan Africa | +228% | −5% | −3% | −1% | −2% |
| Trade Scenario | Units | Trade Fixed to 2009 Levels | Proportional Trade Increase | Enhanced Trade | ||
|---|---|---|---|---|---|---|
| Total food exported | Tg∙C | 157,552 | 225,272 | (+43%) | 382,522 | (+143%) |
| Land area | Mkm2 | 21.6 | 21.4 | (−1%) | 20.8 | (−4%) |
| LUC Emissions | Pg∙CO2e | 6.5 | 6.3 | (−2%) | 6.0 | (−7%) |
| Exporting regions | 1. N America | 1. N America | ↓ | 1. W Europe | ↑ | |
| 2. E Europe | 2. Temp Latin America | ↑ | 2. BN America | ↑ | ||
| 3. BN America | 3. BN America | ↑ | 3. N America | ↓ | ||
| 4. Temp Latin America | 4. W Europe | ↑ | 4. Temp Latin America | ↑ | ||
| Trade Scenario | Units | Trade Fixed to 2009 Levels | Proportional Trade Increase | Enhanced Trade | Trade Scenario | Units |
| Importing regions | 1. E Asia | 1. E Asia | ↓ | 1. S Asia | ↑ | |
| 2. W Asia | 2. S Asia | ↑ | 2. SubS. Africa | ↑ | ||
| 3. W Europe | 3. SubS. Africa | ↑ | 3. W Asia | ↑ | ||
| 4. SubS. Africa | 4. W Asia | ↑ | 4. N Africa | ↑ | ||
| 5. N Africa | 5. N Africa | ↑ | 5. E Asia | ↓ | ||
4. Conclusions
Acknowledgments
Author Contributions
Conflicts of Interest
References
- Houghton, R.A. Carbon emissions and the drivers of deforestation and forest degradation in the tropics. Curr. Opin. Environ. Sustain. 2012, 4, 1–7. [Google Scholar] [CrossRef]
- Smith, P.; Davies, C.A.; Ogle, S.; Zanchi, G.; Bellarby, J.; Bird, N.; Boddey, R.M.; Namara, N.P.M.; Powlson, D.; Cowie, A.; et al. Towards an integrated global framework to assess the impacts of land use and management change on soil carbon: Current capability and future vision. Glob. Chang. Biol. 2012, 18, 2089–2101. [Google Scholar] [CrossRef]
- U.S. Environmental Protection Agency. Global Anthropogenic Non-CO2 Greenhouse Gas Emissions: 1990–2030. 2012. Available online: http://www.epa.gov/climatechange/EPAactivities/economics/nonco2projections.html (accessed on 23 July 2014).
- Bajželj, B.; Richards, K.S.; Allwood, J.M.; Smith, P.A.; Dennis, J.S.; Curmi, E.; Gilligan, C.A. The importance of food demand management for climate mitigation. Nat. Clim. Chang. 2014, in press. [Google Scholar]
- Porter, J.R.; Xie, l. Food security and food production systems. Climate Change 2014: Impacts, Adaptation, and Vulnerability. Volume I: Global and Sectoral Aspects. Available online: http://www.ipcc.ch/report/ar5/wg2/ (accessed on 23 July 2014).
- The Netherland’s Environmental Assessment Agency. IMAGE User Manual; The Netherland’s Environmental Assessment Agency: Bilthoven, The Netherlands, 2010. [Google Scholar]
- Nakicenovic, N.; Davidson, O.; Davis, G.; Grübler, A.; Kram, T.; La Rovere, E.L.; Metz, B.; Morita, T.; Pepper, W.; Pitcher, H.; et al. IPCC Special Report Emissions Scenarios; Cambridge University Press: Cambridge, UK, 2000. [Google Scholar]
- Rosenzweig, C.; Iglesias, A. Potential Impacts of Climate Change on World Food Supply: Datasets from a Major Crop Modeling Study 1999; NASA Socioeconomic Data and Applications Center (SEDAC): Palisades, NY, USA. Available online: http://dx.doi.org/10.7927/H43R0QR1 (accessed on 23 July 2014).
- Parry, M.; Rosenzweig, C.; Iglesias, A.; Livermore, M.; Fischer, G. Effects of climate change on global food production under SRES emissions and socio-economic scenarios. Glob. Environ. Chang. 2004, 14, 53–67. [Google Scholar] [CrossRef]
- Iglesias, A.; Rosensweig, C. Effects of climate change on global food production from SRES emissions and socioeconomic scenarios. Glob. Environ. Chang. 2009, 14, 53–67. [Google Scholar]
- Rosenzweig, C.; Jones, J.W.; Hatfield, J.L.; Ruane, A.C.; Boote, K.J.; Thorburn, P.; Antle, J.M.; Nelson, G.C.; Porter, C.; Janssen, S.; et al. The Agricultural Model Intercomparison and Improvement Project (AgMIP): Protocols and pilot studies. Agric. For. Meteorol. 2013, 170, 166–182. [Google Scholar] [CrossRef]
- Tebaldi, C.; Lobell, D.B. Towards probabilistic projections of climate change impacts on global crop yields. Geophys. Res. Lett. 2008, 35, 2–7. [Google Scholar]
- Cline, W.R. Global Warming and Agriculture: Impact Estimates by Country; Peterson Institute for International Economics: Washington, DC, USA, 2007; Volume 17. [Google Scholar]
- International Institute for Applied Systems Analysis (IIASA) and Food and Agriculture Organization (FAO). Global Agro-Ecological Zones (GAEZ v3.0); IIASA: Laxenburg, Austria; FAO: Rome, Italy, 2010. [Google Scholar]
- Nelson, G.C.; Rosegrant, M.W.; Palazzo, A.; Gray, I.; Ingersoll, C.; Robertson, R.; Tokgoz, S.; Zhu, T. Food Security, Farming and Climate Change to 2050; International Food Policy Research Institute (IFPRI®): Washington, DC, USA, 2010. [Google Scholar]
- Jaggard, K.W.; Qi, A.; Ober, E.S. Possible changes to arable crop yields by 2050. Philos. Trans. R. Soc. Lond. B Biol. Sci. 2010, 365, 2835–2851. [Google Scholar] [CrossRef]
- Osborne, T.; Rose, G.; Wheeler, T. Variation in the global-scale impacts of climate change on crop productivity due to climate model uncertainty and adaptation. Agric. For. Meteorol. 2013, 170, 183–194. [Google Scholar] [CrossRef]
- Leakey, A.D.B. Rising atmospheric carbon dioxide concentration and the future of C4 crops for food and fuel. Proc. R. Soc. 2009, 276, 2333–2343. [Google Scholar] [CrossRef]
- Ray, D.K.; Mueller, N.D.; West, P.C.; Foley, J.A. Yield trends are insufficient to double global crop production by 2050. PLoS One 2013, 8. [Google Scholar] [CrossRef]
- Alexandratos, N.; Bruinsma, J. World Agriculture Towards 2030/2050; Food and Agriculture Organization: Rome, Italy, 2012. [Google Scholar]
- Ramankutty, N.; Foley, J.A. ISLSCP II Potential Natural Vegetation Cover. Available online: http://daac.ornl.gov/ISLSCP_II/guides/potential_veg_xdeg.html (accessed on 21 July 2014).
- Vuuren, D.P.; Edmonds, J.; Kainuma, M.; Riahi, K.; Thomson, A.; Hibbard, K.; Hurtt, G.C.; Kram, T.; Krey, V.; Lamarque, J.-F.; et al. The representative concentration pathways: An overview. Clim. Chang. 2011, 109, 5–31. [Google Scholar] [CrossRef]
- Knox, J.; Hess, T.; Daccache, A.; Wheeler, T. Climate change impacts on crop productivity in Africa and South Asia. Environ. Res. Lett. 2012, 7, 034032. [Google Scholar] [CrossRef]
- Kumar, N.; Aggarwal, P.K.; Saxena, R.; Rani, S.; Jain, S.; Chauhan, N. An assessment of regional vulnerability of rice to climate change in India. Clim. Chang. 2013, 118, 683–699. [Google Scholar] [CrossRef]
- Tilman, D.; Balzer, C.; Hill, J.; Befort, B.L. Global food demand and the sustainable intensification of agriculture. Proc. Natl. Acad. Sci. USA 2011, 108, 1–5. [Google Scholar] [CrossRef]
- United Nations. World Population Prospects: The 2012 Revision; United Nations Department of Economic and Social Affairs, Population Division: New York, NY, USA, 2013. Available online: http://esa.un.org/unpd/wpp/index.htm (accessed on 23 July 2014).
- Ramankutty, N.; Evan, A.T.; Monfreda, C.; Foley, J.A. Farming the planet: 1. Geographic distribution of global agricultural lands in the year 2000. Glob. Biogeochem. Cycles 2008, 22, 1–19. [Google Scholar]
- Food and Agriculture Organization. Food Balance Sheets. Available online: http://faostat.fao.org/site/368/default.aspx#ancor (acessed on 21 July 2014).
- Wirsenius, S. Human Use of Land and Organic Materials Modeling the Turnover of Biomass in the Global Food System; Chalmers University of Technology and Göteborg University: Göteborg, Sweden, 2000. [Google Scholar]
- Gustavsson, J.; Cederberg, C.; Sonnesson, U.; van Otterdijk, R.; Meybeck, A. Global Food Losses and Food Waste; Food and Agriculture Organization (FAO): Rome, Italy, 2011. [Google Scholar]
- Scarlat, N.; Martinov, M.; Dallemand, J.-F. Assessment of the availability of agricultural crop residues in the European Union: Potential and limitations for bioenergy use. Waste Manag. 2010, 30, 1889–1897. [Google Scholar] [CrossRef]
- Haberl, H.; Erb, K.H.; Krausmann, F.; Gaube, V.; Bondeau, A.; Plutzar, C.; Gingrich, S.; Lucht, W.; Fischer-kowalski, M. Quantifying and mapping the human appropriation of net primary production in Earth’ s terrestrial ecosystems. Proc. Natl. Acad. Sci. USA 2007, 104, 12942–12947. [Google Scholar] [CrossRef]
- Oerke, E.; Dehne, H. Global crop production and the efficacy of crop protection—Current situation and future trends. Eur. J. Plant. Pathol. 1997, 103, 203–215. [Google Scholar] [CrossRef]
- Streets, D.G.; Yarber, K.F.; Woo, J.H.; Carmichael, G.R. Biomass burning in Asia: Annual and seasonal estimates and atmospheric emissions. Glob. Biogeochem. Cycles 2003, 17. [Google Scholar]
- Smil, V. Crop residues: Agriculture’s largest harvest. Bioscience 1999, 49, 299–309. [Google Scholar] [CrossRef]
- Delgado, C.; Rosegrant, M.; Steinfeld, H.; Ehui, S.; Courbois, C. Livestock to 2020 The Next Food Revolution; Food and Agriculture Organization: Rome, Italy, 1999. [Google Scholar]
- Baltenweck, I.; Staal, S.; Ibrahim, M.N.M.; Herrero, M.; Holmann, F.; Jabbar, M.; Manyong, V.; Patil, B.R.; Thornton, P.; Williams, T.; et al. Crop-Livestock Intensification and Interaction Across Three Continents; University of Peradeniya: Peradeniya, Sri Lanka, 2003. [Google Scholar]
- Havlík, P.; Valin, H.; Herrero, M.; Obersteiner, M.; Schmid, E.; Rufino, M.C.; Mosniera, A.; Thornton, P.K.; Böttcher, H.; Conan, R.T.; et al. Climate change mitigation through livestock system transitions. Proc. Natl. Acad. Sci. USA 2014, 111, 3709–3714. [Google Scholar] [CrossRef]
- Intergovernmental Panel on Climate Change (IPCC). IPCC Guidelines for National Greenhouse Gas. Inventories; Eggleston, H.S., Buendia, L., Miwa, K., Ngara, T., Tanabe, K., Eds.; IPCC: London, UK, 2006. [Google Scholar]
- Anderson-Teixeira, K.J.; DeLucia, E.H. The greenhouse gas value of ecosystems. Glob. Chang. Biol. 2011, 17, 425–438. [Google Scholar] [CrossRef]
- Feldpausch, T.R.; Rondon, M.A.; Fernandes, E.C.M.; Riha, S.J.; Wandelli, E. Carbon and nutrient accumulation in secondary forests regenerating on pastures in central Amazonia. Ecol. Appl. 2004, 14, 164–176. [Google Scholar]
- Bajželj, B.; Allwood, J.M.; Cullen, J.M. Designing climate change mitigation plans that add up. Environ. Sci. Technol. 2013, 47, 8062–8069. [Google Scholar] [CrossRef]
- European Commission, Joint Research Centre. Netherlands Environmental Assessment Agency Emission Database for Global Atmospheric Research (EDGAR), release version 4.2.; 2012. Available online: http://edgar.jrc.ec.europa.eu (accessed on 21 July 2014).
- Steinfeld, H.; Gerber, P.; Wassenaar, T.; Castel, V.; Rosales, M.; de Haan, C. Livestock’s Long Shadow: Environmental Issues and Options; Food and Agriculture Organization of the United Nations: Rome, Italy, 2006; p. 390. [Google Scholar]
- Smith, P.; Haberl, H.; Popp, A.; Erb, K.-H.; Lauk, C.; Harper, R.; Tubiello, F.N.; de Siqueira Pinto, A.; Jafari, M.; Sohi, S.; et al. How much land-based greenhouse gas mitigation can be achieved without compromising food security and environmental goals? Glob. Chang. Biol. 2013, 19, 2285–2302. [Google Scholar] [CrossRef]
- Rogelj, J.; Hare, W.; Lowe, J.; van Vuuren, D.P.; Riahi, K.; Matthews, B.; Hanaoka, T.; Jiang, K.; Meinshausen, M. Emission pathways consistent with a 2 °C global temperature limit. Nat. Clim. Chang. 2011, 1, 413–418. [Google Scholar] [CrossRef]
© 2014 by the authors; licensee MDPI, Basel, Switzerland. This article is an open access article distributed under the terms and conditions of the Creative Commons Attribution license (http://creativecommons.org/licenses/by/3.0/).
Share and Cite
Bajželj, B.; Richards, K.S. The Positive Feedback Loop between the Impacts of Climate Change and Agricultural Expansion and Relocation. Land 2014, 3, 898-916. https://doi.org/10.3390/land3030898
Bajželj B, Richards KS. The Positive Feedback Loop between the Impacts of Climate Change and Agricultural Expansion and Relocation. Land. 2014; 3(3):898-916. https://doi.org/10.3390/land3030898
Chicago/Turabian StyleBajželj, Bojana, and Keith S. Richards. 2014. "The Positive Feedback Loop between the Impacts of Climate Change and Agricultural Expansion and Relocation" Land 3, no. 3: 898-916. https://doi.org/10.3390/land3030898
APA StyleBajželj, B., & Richards, K. S. (2014). The Positive Feedback Loop between the Impacts of Climate Change and Agricultural Expansion and Relocation. Land, 3(3), 898-916. https://doi.org/10.3390/land3030898