Article

Application of Landsat-8, Sentinel-2, ASTER and WorldView-3 Spectral Imagery for Exploration of Carbonate-Hosted Pb-Zn Deposits in the Central Iranian Terrane (CIT)

1
Department of Mining Engineering, Shahid Bahonar University of Kerman, Kerman 7616913439, Iran
2
The Iran Minerals Production and Supply Company (IMPASCO), 14155–3598, Vali-Asr Sq., Tehran 1594643118, Iran
3
Institute of Oceanography and Environment (INOS), Universiti Malaysia Terengganu (UMT), Kuala Nerus 21030, Malaysia
4
Mahabad Branch, Islamic Azad University, Mahabad 59135-433, Iran
5
Department of Natural Resources Engineering and Management, School of Science and Engineering, University of Kurdistan Hewlêr (UKH), Erbil 44001, Iraq
6
Geoscience and Digital Earth Centre (INSTeG), Research Institute for Sustainable Environment, Universiti Teknologi Malaysia, Johor Bahru, Skudai 81310, Malaysia
7
Department of Geology, Faculty of Science, Benha University, Benha 13518, Egypt
8
Institute of Geosciences, University of Kiel, Ludewig-Meyn Str. 10, 24118 Kiel, Germany
9
The Centre for Advanced Modelling and Geospatial Information Systems (CAMGIS), Faculty of Engineering and Information Technology, University of Technology Sydney, Sydney 2007, Australia
10
Department of Energy and Mineral Resources Engineering, Sejong University, Choongmu-gwan, 209 Neungdong-ro Gwangjin-gu, Seoul 05006, Korea
11
Faculty of Chemical Engineering, Urmia University of Technology, Urmia 57155-419, Iran
*
Author to whom correspondence should be addressed.
Remote Sens. 2020, 12(8), 1239; https://doi.org/10.3390/rs12081239
Submission received: 18 March 2020 / Revised: 6 April 2020 / Accepted: 8 April 2020 / Published: 13 April 2020

Abstract

:
The exploration of carbonate-hosted Pb-Zn mineralization is challenging due to the complex structural-geological settings and costly using geophysical and geochemical techniques. Hydrothermal alteration minerals and structural features are typically associated with this type of mineralization. Application of multi-sensor remote sensing satellite imagery as a fast and inexpensive tool for mapping alteration zones and lithological units associated with carbonate-hosted Pb-Zn deposits is worthwhile. Multiple sources of spectral data derived from different remote sensing sensors can be utilized for detailed mapping a variety of hydrothermal alteration minerals in the visible near infrared (VNIR) and the shortwave infrared (SWIR) regions. In this research, Landsat-8, Sentinel-2, Advanced Spaceborne Thermal Emission and Reflection Radiometer (ASTER) and WorldView-3 (WV-3) satellite remote sensing sensors were used for prospecting Zn-Pb mineralization in the central part of the Kashmar–Kerman Tectonic Zone (KKTZ), the Central Iranian Terrane (CIT). The KKTZ has high potential for hosting Pb-Zn mineralization due to its specific geodynamic conditions (folded and thrust belt) and the occurrence of large carbonate platforms. For the processing of the satellite remote sensing datasets, band ratios and principal component analysis (PCA) techniques were adopted and implemented. Fuzzy logic modeling was applied to integrate the thematic layers produced by image processing techniques for generating mineral prospectivity maps of the study area. The spatial distribution of iron oxide/hydroxides, hydroxyl-bearing and carbonate minerals and dolomite were mapped using specialized band ratios and analyzing eigenvector loadings of the PC images. Subsequently, mineral prospectivity maps of the study area were generated by fusing the selected PC thematic layers using fuzzy logic modeling. The most favorable/prospective zones for hydrothermal ore mineralizations and carbonate-hosted Pb-Zn mineralization in the study region were particularly mapped and indicated. Confusion matrix, field reconnaissance and laboratory analysis were carried out to verify the occurrence of alteration zones and highly prospective locations of carbonate-hosted Pb-Zn mineralization in the study area. Results indicate that the spectral data derived from multi-sensor remote sensing satellite datasets can be broadly used for generating remote sensing-based prospectivity maps for exploration of carbonate-hosted Pb-Zn mineralization in many metallogenic provinces around the world.

Graphical Abstract

1. Introduction

Remote sensing has provided tools for geological exploration for almost four decades. Nowadays, many satellite remote sensing datasets are accessible freely and can be extensively used for mineral exploration projects [1,2,3,4,5,6,7,8,9,10,11,12,13,14,15]. Pb-Zn sulfide mineralization is typically associated with hydrothermal alteration zones, the contact boundaries of lithological units and structural features such as faults and fractures [5,16,17,18,19]. According to World Bank Commodities Price Forecast (WBCPF), the price and consumption of Pb and Zn are increasing annually [20]. Pb and Zn are a necessity for the steady development of many countries around the world [21]. Accordingly, the exploration of Pb-Zn deposits using remote sensing satellite imagery as an available and inexpensive tool is of practical and economic interest.
Carbonate-hosted Pb-Zn deposits are some of the most significant sources of Pb and Zn [22]. The major hydrothermal alteration zones associated with carbonate-hosted Pb-Zn deposits are: (i) dissolution and hydrothermal brecciation, (ii) dolomite and calcite alteration, (iii) silicification and (iv) clay, mica, and feldspar diagenesis [22,23,24]. Besides, gossans as oxidation products of sulphide mineralized rocks are documented with carbonate-hosted Pb-Zn mineralization [25]. Particularly, studies on carbonate-hosted Pb-Zn deposits in Iran, India, China and Greenland have shown the possibility to identify hydrothermal alteration and iron oxides associated with Pb–Zn deposits using Landsat-8 and ASTER satellite imagery [5,16,17,18,19]. The application of multi-sensor remote sensing satellite imagery and fusing the most informative alteration thematic layers using geostatistical models can provide a low-cost exploration approach for generating remote sensing-based prospectivity maps [15]. Multiple sources of spectral data derived from different remote sensing sensors can be utilized for detailed mapping a variety of hydrothermal alteration minerals in the VNIR and the SWIR regions.
Landsat-8 imagery contains nine bands (0.433 to 2.290 µm; 30 m spatial resolution) in the VNIR and SWIR regions (Table 1). The VNIR spectral bands are particularly sensitive for mapping iron oxides/hydroxides, while SWIR spectral bands are responsive for detecting hydroxyl-bearing minerals and carbonates. These spectral bands have been broadly used for mapping hydrothermal alteration zones associated with hydrothermal ore mineralizations [3,5,12,15]. Sentinel-2 has thirteen spectral bands in the VNIR and the SWIR regions (0.433 to 2.280 µm; spatial resolutions from 10 to 60 m) (Table 1) which are useful to identify iron oxides/hydroxides and hydroxyl-bearing minerals [6]. Six spectral bands in the SWIR range (1.600 to 2.430 µm; 30 m spatial resolution) allow the ASTER sensor to map clay and carbonate minerals (Table 1). Detailed detection and discrimination of hydroxyl-bearing minerals and carbonates using ASTER SWIR bands is documented [1,4,8,13]. Moreover, ASTER VNIR bands (0.52 to 0.86 µm; 15 m spatial resolution) can map iron oxides/hydroxides [2,9]. The VNIR spectral bands of WV-2 and WV-3 (0.400 to 1.040 µm; 1.24 m spatial resolution) were used to discriminate Fe2+ and Fe3+ mineral groups [10,14]. Al-OH, Mg-Fe-OH, CO3, and Si-OH alteration minerals were mapped in detail using SWIR bands of WV-3 (1.195 to 2.365 µm; 3.70 m spatial resolution) (Table 1) [10]. Therefore, multi-sensor satellite imagery can provide multiple sources of spectral data for mapping and discriminating hydrothermal alteration minerals to generate remote sensing-based prospectivity maps for metallogenic provinces.
The Central Iranian Terrane (CIT) of Iran has high potential for carbonate-hosted Pb-Zn deposits as a result of tectonic conditions related to its folded and thrust belt and the occurrence of large carbonate platforms [26]. The CIT consists of three N-S oriented crustal domains, namely the Lut, Tabas and Yazd blocks [27]. The Tabas and Yazd blocks are separated by a long, arcuate and structurally complex belt defined as the Kashmar–Kerman Tectonic Zone (KKTZ) (Figure 1), which has several occurrences of carbonate-hosted Pb-Zn deposits [28]. The KKTZ contains metamorphic rocks, limestones, pyroclastic and volcanic rocks, sandstone, dolomite and sandstone, slate and phyllite [28]. Ghanbari et al. [29] investigated the potential of rare earth element (REE) mineralization in the KKTZ using a fuzzy model. Geophysics, geochemistry, geology and remote sensing data were fused to indicate the prospective zones of REE mineralization. The favorability areas for REE mineralization sites were identified and prospectivity map for the study area was generated. However, lack of detailed geology map and comprehensive field surveying are the main issues that can be easily seen for the analysis.
Detailed mapping of hydrothermal alteration mineral zones associated with the carbonate-hosted Pb-Zn mineralization is one the essential factors for reconnaissance stages of Pb-Zn exploration in the CIT. However, there is no comprehensive remote sensing study for detailed identification of hydrothermal alteration mineral zones and lithological units for exploration Pb-Zn mineralization in the CIT, yet. In this research, Landsat-8, Sentinel-2, ASTER and WV-3 satellite remote sensing data were used for prospecting the carbonate-hosted Pb-Zn mineralization in the central part of the KKTZ, the CIT (Iran, Figure 1). The main objectives of this study are: (i) to map hydrothermal alteration minerals and lithological units by implementing band ratios and Principal Component Analysis (PCA) techniques to Landsat-8, Sentinel-2, ASTER and WV-3 datasets; (ii) to generate mineral prospectivity maps by fusing the most rational thematic layers using fuzzy logic modeling; and (iii) to verify the remote sensing results by field reconnaissance, laboratory analysis and confusion matrix.

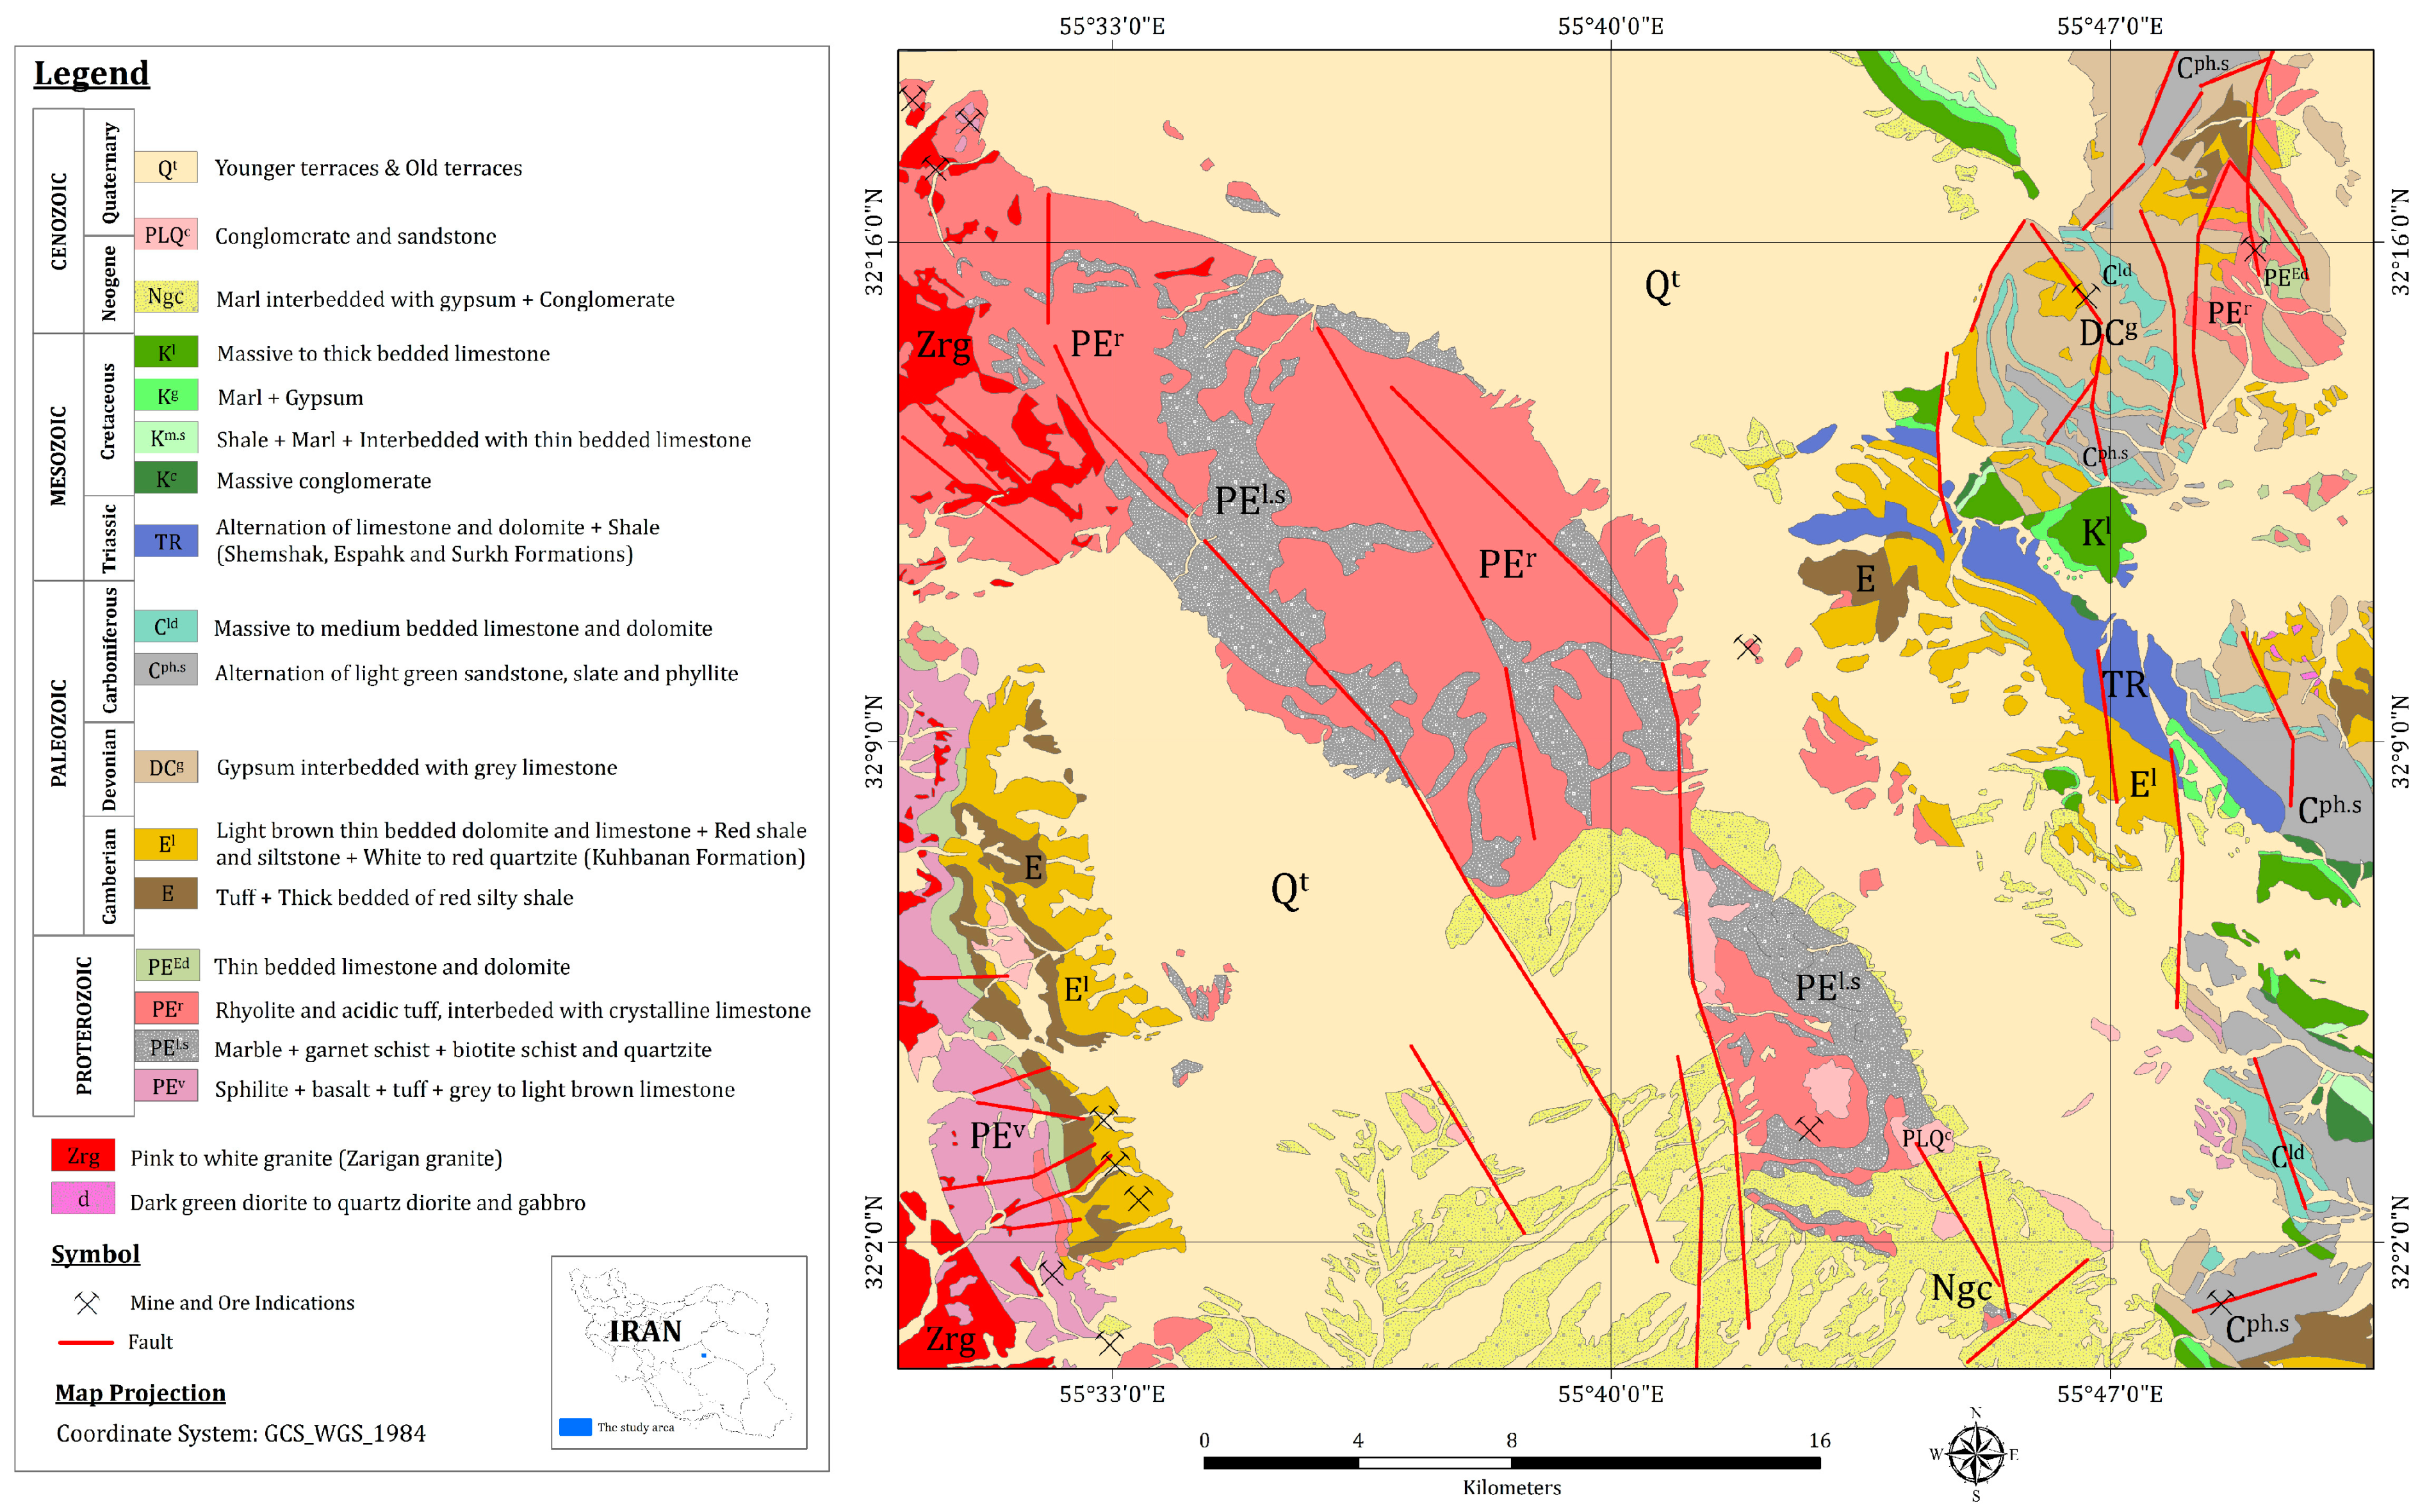
2. Geologic Setting of the KKTZ

The formation of the CIT is attributed to the Late Precambrian Katangan/Pan-African orogenesis [30,31,32]. The KKTZ closely follows the trends of the predominant fault structures of the CIT. Three first-order fault systems are identified within the CIT, including (i) the N-trending system such as Nayband and Nehbandan faults, (ii) the NE system such as Poshteh-Badam and Kalmard faults and (iii) the NW system such as Kuhbanan and Rafsanjan faults. The NE and NW fault systems dominate the western part of the terrane, which also includes the KKTZ [31,33]. The KKTZ is part of the Poshte Badam-Bafgh basin [34]. Lithological outcrops in the KKTZ have an N-S trend. The folding and formation of these rocks is followed by a N-S faulting event [35]. Lithological units in this area are volcanic and schist units, dolomitic units and Quaternary deposits [33,36,37] (Figure 1).
The occurrence of magmatism in the Poshte Badam-Bafgh basin is associated with a back-arc extension zone during the Late Neoproterozoic to Early Cambrian [35,38,39]. Numerous ore mineralizations in the region have occurred in connection with the alkaline volcanic activity and extensional tectonics [36]. The carbonate-hosted Pb-Zn mineralization in the study area was formed during synchronous faulting activities with sedimentation, detrital sedimentation associated with faulting activities, emplacement of rhyolitic volcanic rocks and formation of rift sediments and subsidence [35,38]. In the KKTZ, Upper Precambrian series of volcano-sediments, detrital and carbonate rocks (especially dolomites) are overlying sandstone, conglomerate and tuff (the Tashk Formation) with a discontinuity [28,40,41].

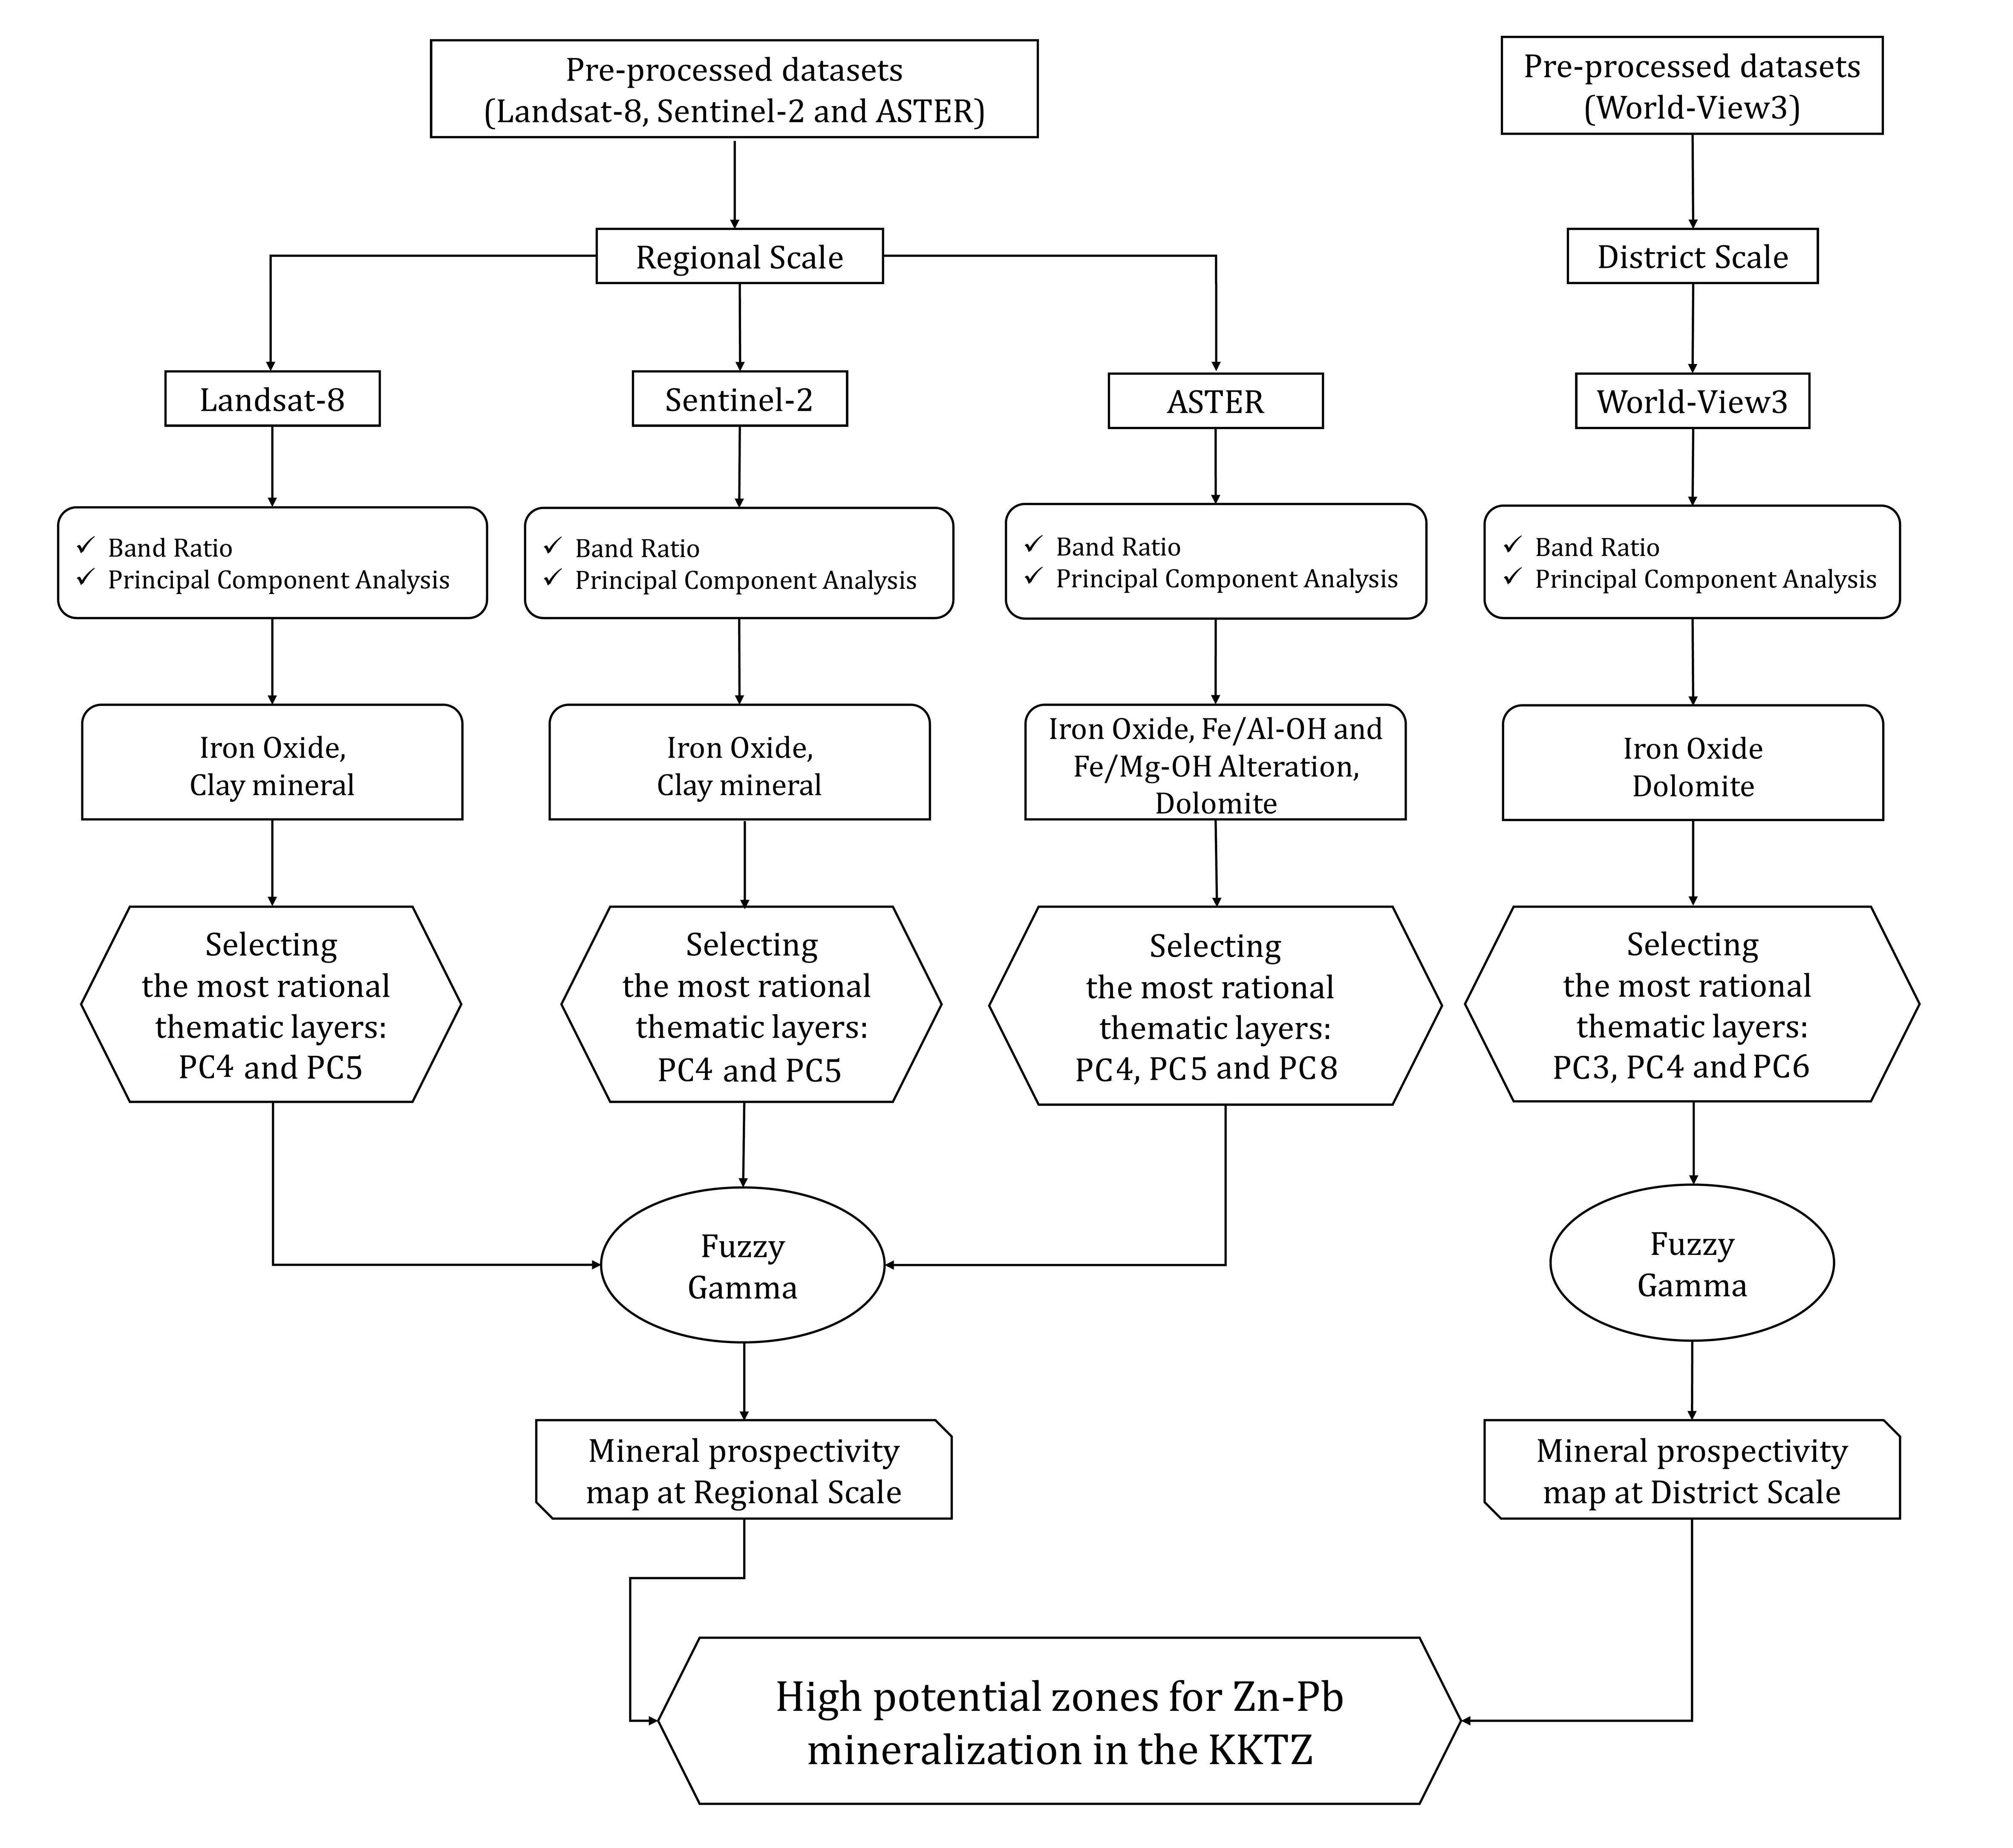
3. Materials and Methods

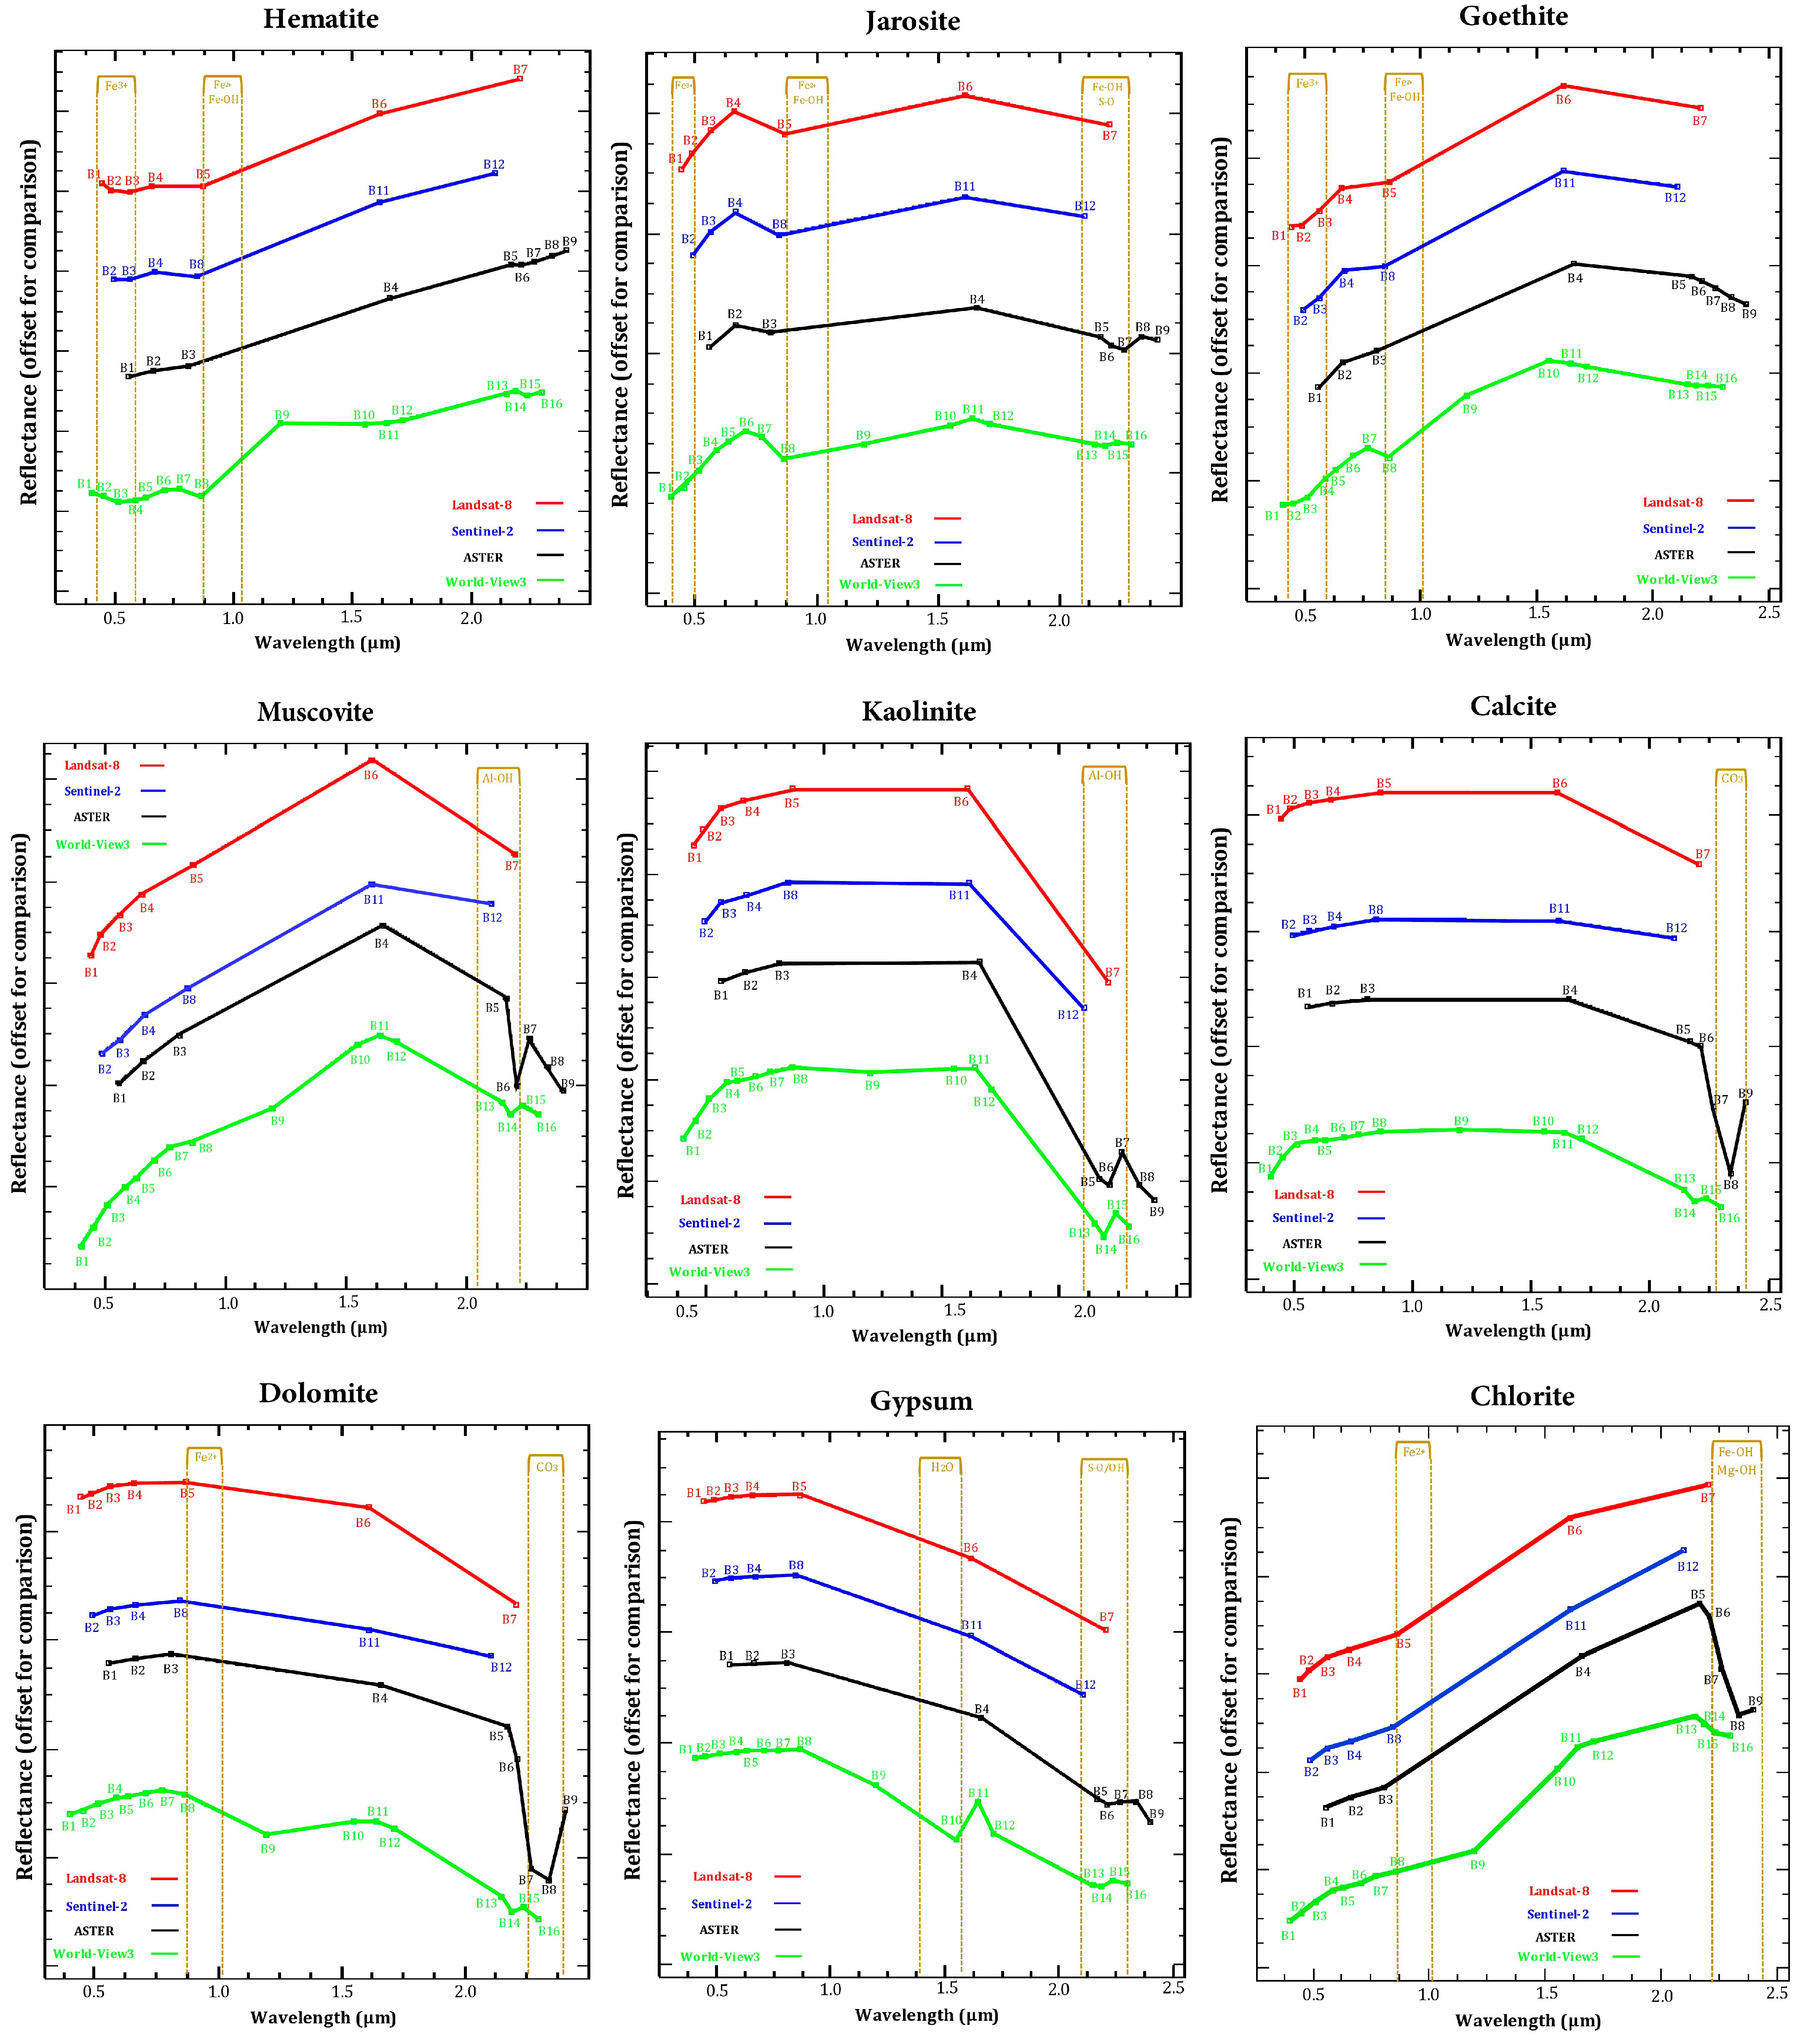
3.1. Multi-Sensor Data Characteristics

In this investigation, multi-sensor satellite imagery, including Landsat-8, Sentinel-2, ASTER, and WV-3, was utilized for prospecting the carbonate-hosted Pb-Zn mineralization in the central part of the KKTZ region. Table 1 summarizes the technical performance and attributes of the Landsat-8, Sentinel-2, ASTER and WV-3 sensors. Broad spectral bands of Landsat-8 and Sentinel-2 were selected and used to discriminate lithological units and alteration zones for regional mapping of the study area. Narrow spectral bands of ASTER and WV-3 were used for detailed mapping of clay and carbonate minerals and Fe2+ and Fe3+ mineral groups.
A cloud-free Landsat-8 scene (LC08_L1TP_161038_20170517, Path/Raw: 161/038) covering the central part of KKTZ was obtained from the U.S. Geological Survey Earth Resources Observation and Science Center (EROS) [48] for this analysis. It is level 1T (terrain corrected) data, which was acquired on 17 June 2017. A cloud-free Sentinel-2 (S2A_OPER_PRD_MSIL1C_PDMC_ 20160929T125040) scene covering the central part of KKTZ was obtained from the European Space Agency (Copernicus Open Access Hub), which was acquired on 29 September 2016. The Sentinel-2A utilized in this study is a Level-1C top-of-atmosphere (TOA) reflectance (100 km × 100 km tile) product, which includes radiometric and geometric corrections (UTM projection with WGS84 datum) along with orthorectification [49]. An ASTER scene covering the study region was acquired on 16 March 2003. It was cloud-free level 1T product that obtained from USGS EROS center [50]. A level 2 A WV-3 image (M2AS-056451539010_01_P001) covering the study area was purchased from the Arka Company (Tehran, Iran). Unfortunately, SWIR bands were not available for the study region. The WV-3 VNIR imagery was cloud-free and acquired on 20 April 2017. The level 2A WV-3 is a sensor and radiometrically corrected product, which is geometrically projected to the UTM with WGS84 datum [51,52]. The Landsat-8, Sentinel-2, ASTER and WV-3 images used in this study have been already georeferenced to the UTM zone 40 North projection using the WGS84 datum. For processing the remote sensing datasets, the ENVI (Environment for Visualizing Images) [53], version 5.2 and ArcGIS version 10.3 (ESRI, Redlands, CA, USA) software packages were used.

3.2. PrePprocessing of the Remote Sensing Datasets

The Fast Line-of-sight Atmospheric Analysis of Hypercubes (FLAASH) algorithm [54] were applied to Landsat-8 (Operational Land Imager (OLI) bands) by implementing the Mid-Latitude Summer (MLS) and Rural aerosol models [55]. Sentinel-2 data layer stacked of VNIR+SWIR bands (bands 2, 3, 4, 8, 11 and 12) with 10 m spatial dimension was generated to obtain a six-band dataset. The QUick Atmospheric Correction (QUAC) was performed on this dataset by using mud filtering to eliminate highly structured materials such as shallow water, mud and vegetation [55]. ASTER data layer stacked of VNIR+SWIR bands with 30-meter spatial dimensions was generated by using Pan-sharpening method [56]. Internal Average Relative Reflectance (IARR) calibration [57] was applied to Crosstalk corrected [58] ASTER data for atmospheric correction. The conversion to the Top-of-Atmosphere (TOA) spectral radiance and absolute radiometric correction are required for the WV-3 relative radiometrically corrected images [59]. Therefore, the corrections were executed and FLAASH algorithm was applied to the WV-3 data.

3.3. Image Processing Techniques

Band Ratios and Principal Components Analysis (PCA) image processing procedures were executed to extract key information related to alteration minerals and lithological units from the pre-processed remote sensing datasets. Successively, the most rational thematic layers of the alteration zones were fused using fuzzy logic modeling to generate mineral prospectivity maps of the study area. Finally, field reconnaissance, laboratory analysis and confusion matrix were carried out for verifying the remote sensing results. An overview of the methodological flowchart used in this study is displayed in Figure 2.

3.3.1. Band Ratios

Band ratios method is broadly used for mapping hydrothermal alteration minerals and lithological units [2,3,4,60,61,62,63]. By ratioing bands that correspond to certain absorptions and reflectance, the pixels with particular mineral or mineral groups are highlighted [64,65,66,67]. Furthermore, this technique is proficient in reducing the topographic effects generated by slope orientations and solar illumination angles [68]. Several mathematical expressions were used for detecting alteration minerals or mineral groups, which are generally called Relative Absorption Band Depth (RBD) [69]. It includes three-point ratio formulation for revealing the mineral spectral intensities attributed to Fe2+, Fe3+, Fe-OH, Al-OH, Fe, Mg-OH, Si-OH, SO, CO3 and SiO2 [60,70,71,72]. For a particular absorption or emissivity distinction, the numerator is the sum of the bands indicating the shoulders and the denominator is the band placed nearby the absorption or emissivity feature minimum [69].
To characterize iron oxide/hydroxides (hematite, goethite and jarosite), the VNIR spectral bands contain the most important information due to electronic transitions of Fe3+/Fe2+ in the VNIR region from 0.45 to 1.2 µm [73,74] (Figure 3). In this study for detecting iron oxide at a regional scale, 4/2 band ratio of Landsat-8, Sentinel-2 and ASTER was selected to highlight iron oxide/hydroxides. Hydroxyl-bearing (Al-OH) alteration and carbonates (muscovite, kaolinite, gypsum, calcite and dolomite) show spectral absorption features in the 2.1–2.5 µm region due to overtones and combinations of the fundamental vibrations [75], whereas their spectral reflectance typically occur in 1.55–1.75 µm in the SWIR regions (Figure 3). These characteristics are matched with band 7 (2.11–2.29 µm) and band 6 (1.57–1.65 µm) of Landsat-8, as well as band 12 (2.100–2.280 µm) and band 11 (1.565–1.655 µm) of Sentinel-2, respectively (Figure 3). Therefore, the 6/7 band ratio of Landsat-8 and 11/12 band ratio of Sentinel-2 were used to map hydroxyl bearing alteration minerals and carbonates in this study at the regional scale.
The Al-OH absorption features at 2.17 to 2.20 µm are corresponded with bands 5 and 6 of ASTER, whereas Mg-Fe-OH and CO3 absorption features are situated in 2.30 to 2.35 µm equivalent with bands 7 and 8 of ASTER [73,74,76] (Figure 3). Additionally, dolomite absorption features are mostly concentrated at 2.20 to 2.30 µm, which are coincident with bands 6 and 7 of ASTER [77] (Figure 3). Hence, calcite and dolomite minerals can be discriminated by different absorption features between 2.33 and 2.45 μm [76,78] (Figure 3). Subsequently in this study, (i) to map Al/Fe-OH minerals (muscovite, kaolinite and jarosite) the RBD1: (5 + 7)/6 was implemented; (ii) to identify Mg-Fe-OH/CO3 minerals (chlorite and calcite) the RBD2: (7 + 9)/8 was used; and (iii) for detecting dolomite the RBD3: (6 + 8)/7) was executed to ASTER (VNIR+SWIR) bands [67,76,77].
The VNIR spectral bands of WV-3 have high potential to map Fe3+, gossan and dolomite/Fe2+. Ferric/ferrous iron oxides contain a set of absorption features about 0.40 to 1.2 µm, which are matched with WV-3 VNIR bands 2, 3, 4, 6 and 8 [79,80,81] (Figure 3). The absorption features related to Fe3+ is typically at 0.49, 0.70 and 0.87 µm, while Fe2+ shows absorption properties at 0.51, 0.55 and 1.20 µm [73,74,75,82]. Considering the laboratory reflectance spectra of dolomite (Figure 3) indicate that band 7 (0.770–0.895 µm) of WV-3 can be assumed as a reflectance band, whereas band 4 (0.585–0.625 µm) can be considered as absorption features related to Fe2+ for detecting dolomite. The Fe2+ absorption in the dolomite spectrum normally can occur about 0.60 µm (in addition to 1.20 µm) [82] that is coincident with band 4 (yellow band) of WV-3. Accordingly, the band ratio of 5/3, 5/2 and 7/4 were adopted and developed for mapping Fe3+ and iron-stained alteration and dolomite/Fe2+, respectively

3.3.2. Principal Components Analysis (PCA)

PCA is a mathematical technique that transforms a quantity of correlated variables into a number of uncorrelated linear variables called principal components (PCs) [83,84,85]. The PCA is usually implemented on a square symmetric matrix. It can be based on the covariance matrix (scaled sums of squares and cross products) or correlation matrix (sums of squares and cross products from standardized data) [83,86,87]. The PCA is broadly used to map hydrothermal alteration minerals and lithological units using spectral bands of remote sensing sensors [8,61,62,84,88,89,90,91,92]. The uncorrelated linear combinations (eigenvector loadings) contain indicative information allied to spectral characteristics of alteration minerals that can be expected from the specific spectral bands in the VNIR and SWIR regions [84,89]. Accordingly, a PC contains strong eigenvector loadings for indicative bands such as reflective and absorptive bands of an alteration mineral or mineral group with opposite signs enhances that mineral or mineral group as bright or dark pixels in the PC image. Positive loading in a reflective band enhances the alteration mineral as bright pixels, while negative loading is in a reflective band depicts the alteration mineral as dark pixels [84,89]. In this analysis, the PCA method was implemented based on covariance matrix to the selected bands of Landsat-8 (OLI bands), Sentinel-2 (bands 2, 3, 4, 8, 11 and 12) and ASTER (VNIR+SWIR bands) and WV-3 (VNIR bands) for identifying hydrothermal alteration mineral assemblages in the study area. Table 2, Table 3, Table 4 and Table 5 show the eigenvector matrix for the selected bands of the remote sensing datasets.

3.3.3. Fuzzy Logic Modeling

Fuzzy logic modeling is based on the fuzzy set theory, which was proposed by Zadeh [93]. It is a form of many-valued logic in which the true values of variables may be any real number between 0 and 1 both inclusive [94]. A fuzzy set of A is a set of ordered pairs:
A = {(x, µ_A (x) | x ϵ X},
where µ_A (x) is termed the membership function or membership grade of x in A. µ_A (x) maps x to membership space (M), when M contains only the two points 0 and 1. The range of µ_A (x) is [0, 1], where zero expresses non-membership and one expresses full membership [93]. Fuzzy logic modeling has been successfully applied for mineral prospectivity mapping in metallogenic provinces [29,95,96,97,98]. The application of fuzzy logic modeling for mineral prospectivity mapping normally includes three main feed-forward stages: (i) fuzzification of evidential data; (ii) logical integration of fuzzy evidential maps with the aid of an inference network and appropriate fuzzy set operations; and (iii) defuzzification of fuzzy mineral prospectivity output to aid its interpretation [96]. A set of fuzzy membership values is expressed in a continuous series from 0 to 1. This 0–1 scale, however, does not constitute a probability density function. Function-member values are established for each evidence map that will be integrated. In the fuzzy logic method, a total of sheet maps (fuzzy membership) based on the significance distance of features are weighted (for each pixel or spatial position, a particular weight between 0 and 1 is appointed) [96,99].
Five operators that are useful for combining mineral exploration datasets include the fuzzy AND, fuzzy OR, fuzzy algebraic product, fuzzy algebraic sum and fuzzy gamma [95,100,101,102]. In this analysis, the multiclass evidential image-maps were reclassified in 10 classes of equal interval and then were fuzzified using the linear membership function. The fuzzy gamma operator was used for mapping the prospective areas using Landsat-8, Sentinel-2, ASTER and WV-3 alteration thematic input layers. After testing several values for the γ parameter, it was adjusted 0.70 for ensuring a flexible compromise between the fuzzy algebraic sum and the fuzzy algebraic product [99]. Table 6 shows the fuzzification parameters for the input layers used in this analysis.

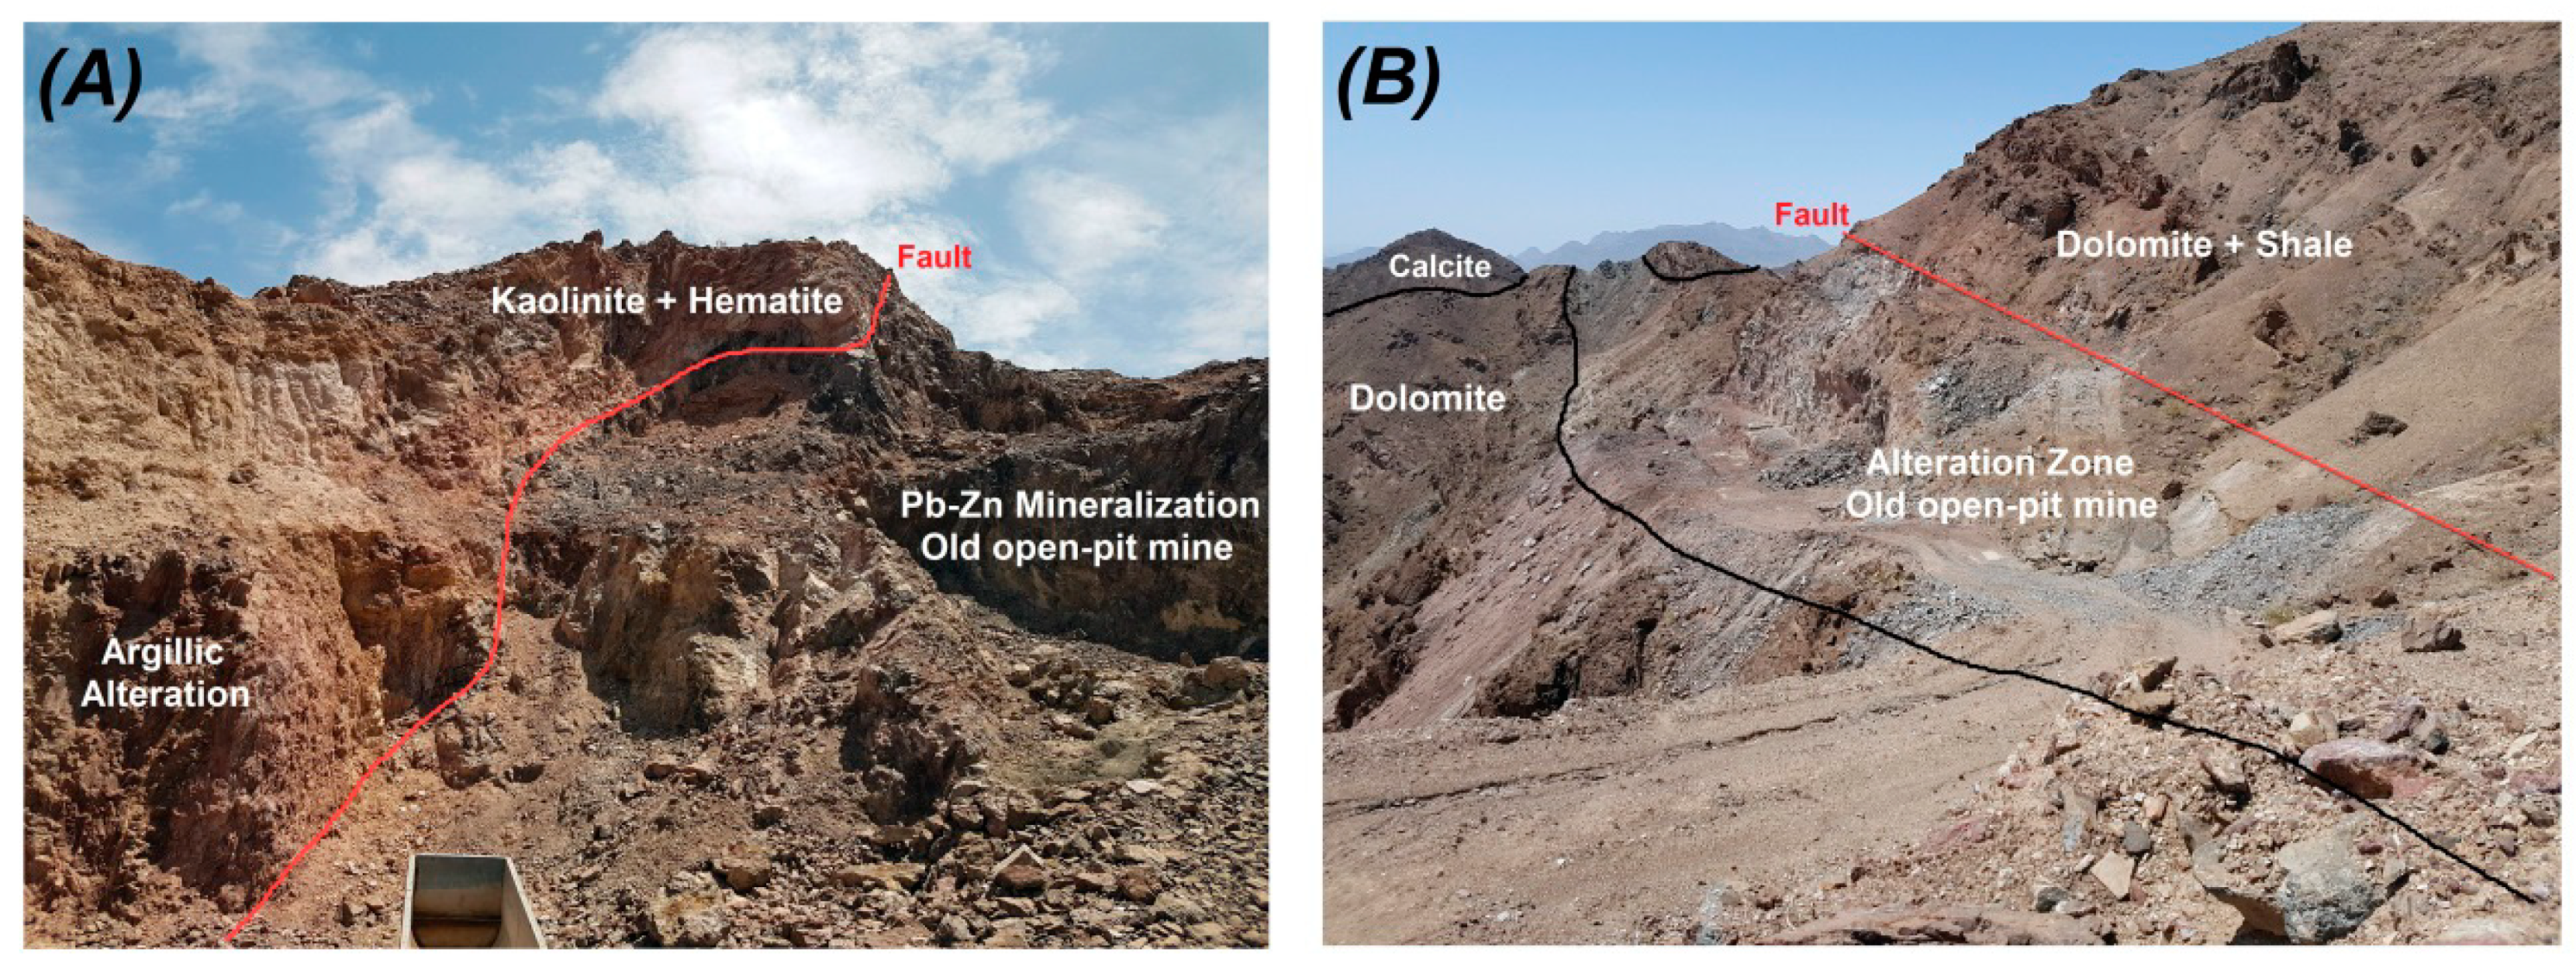
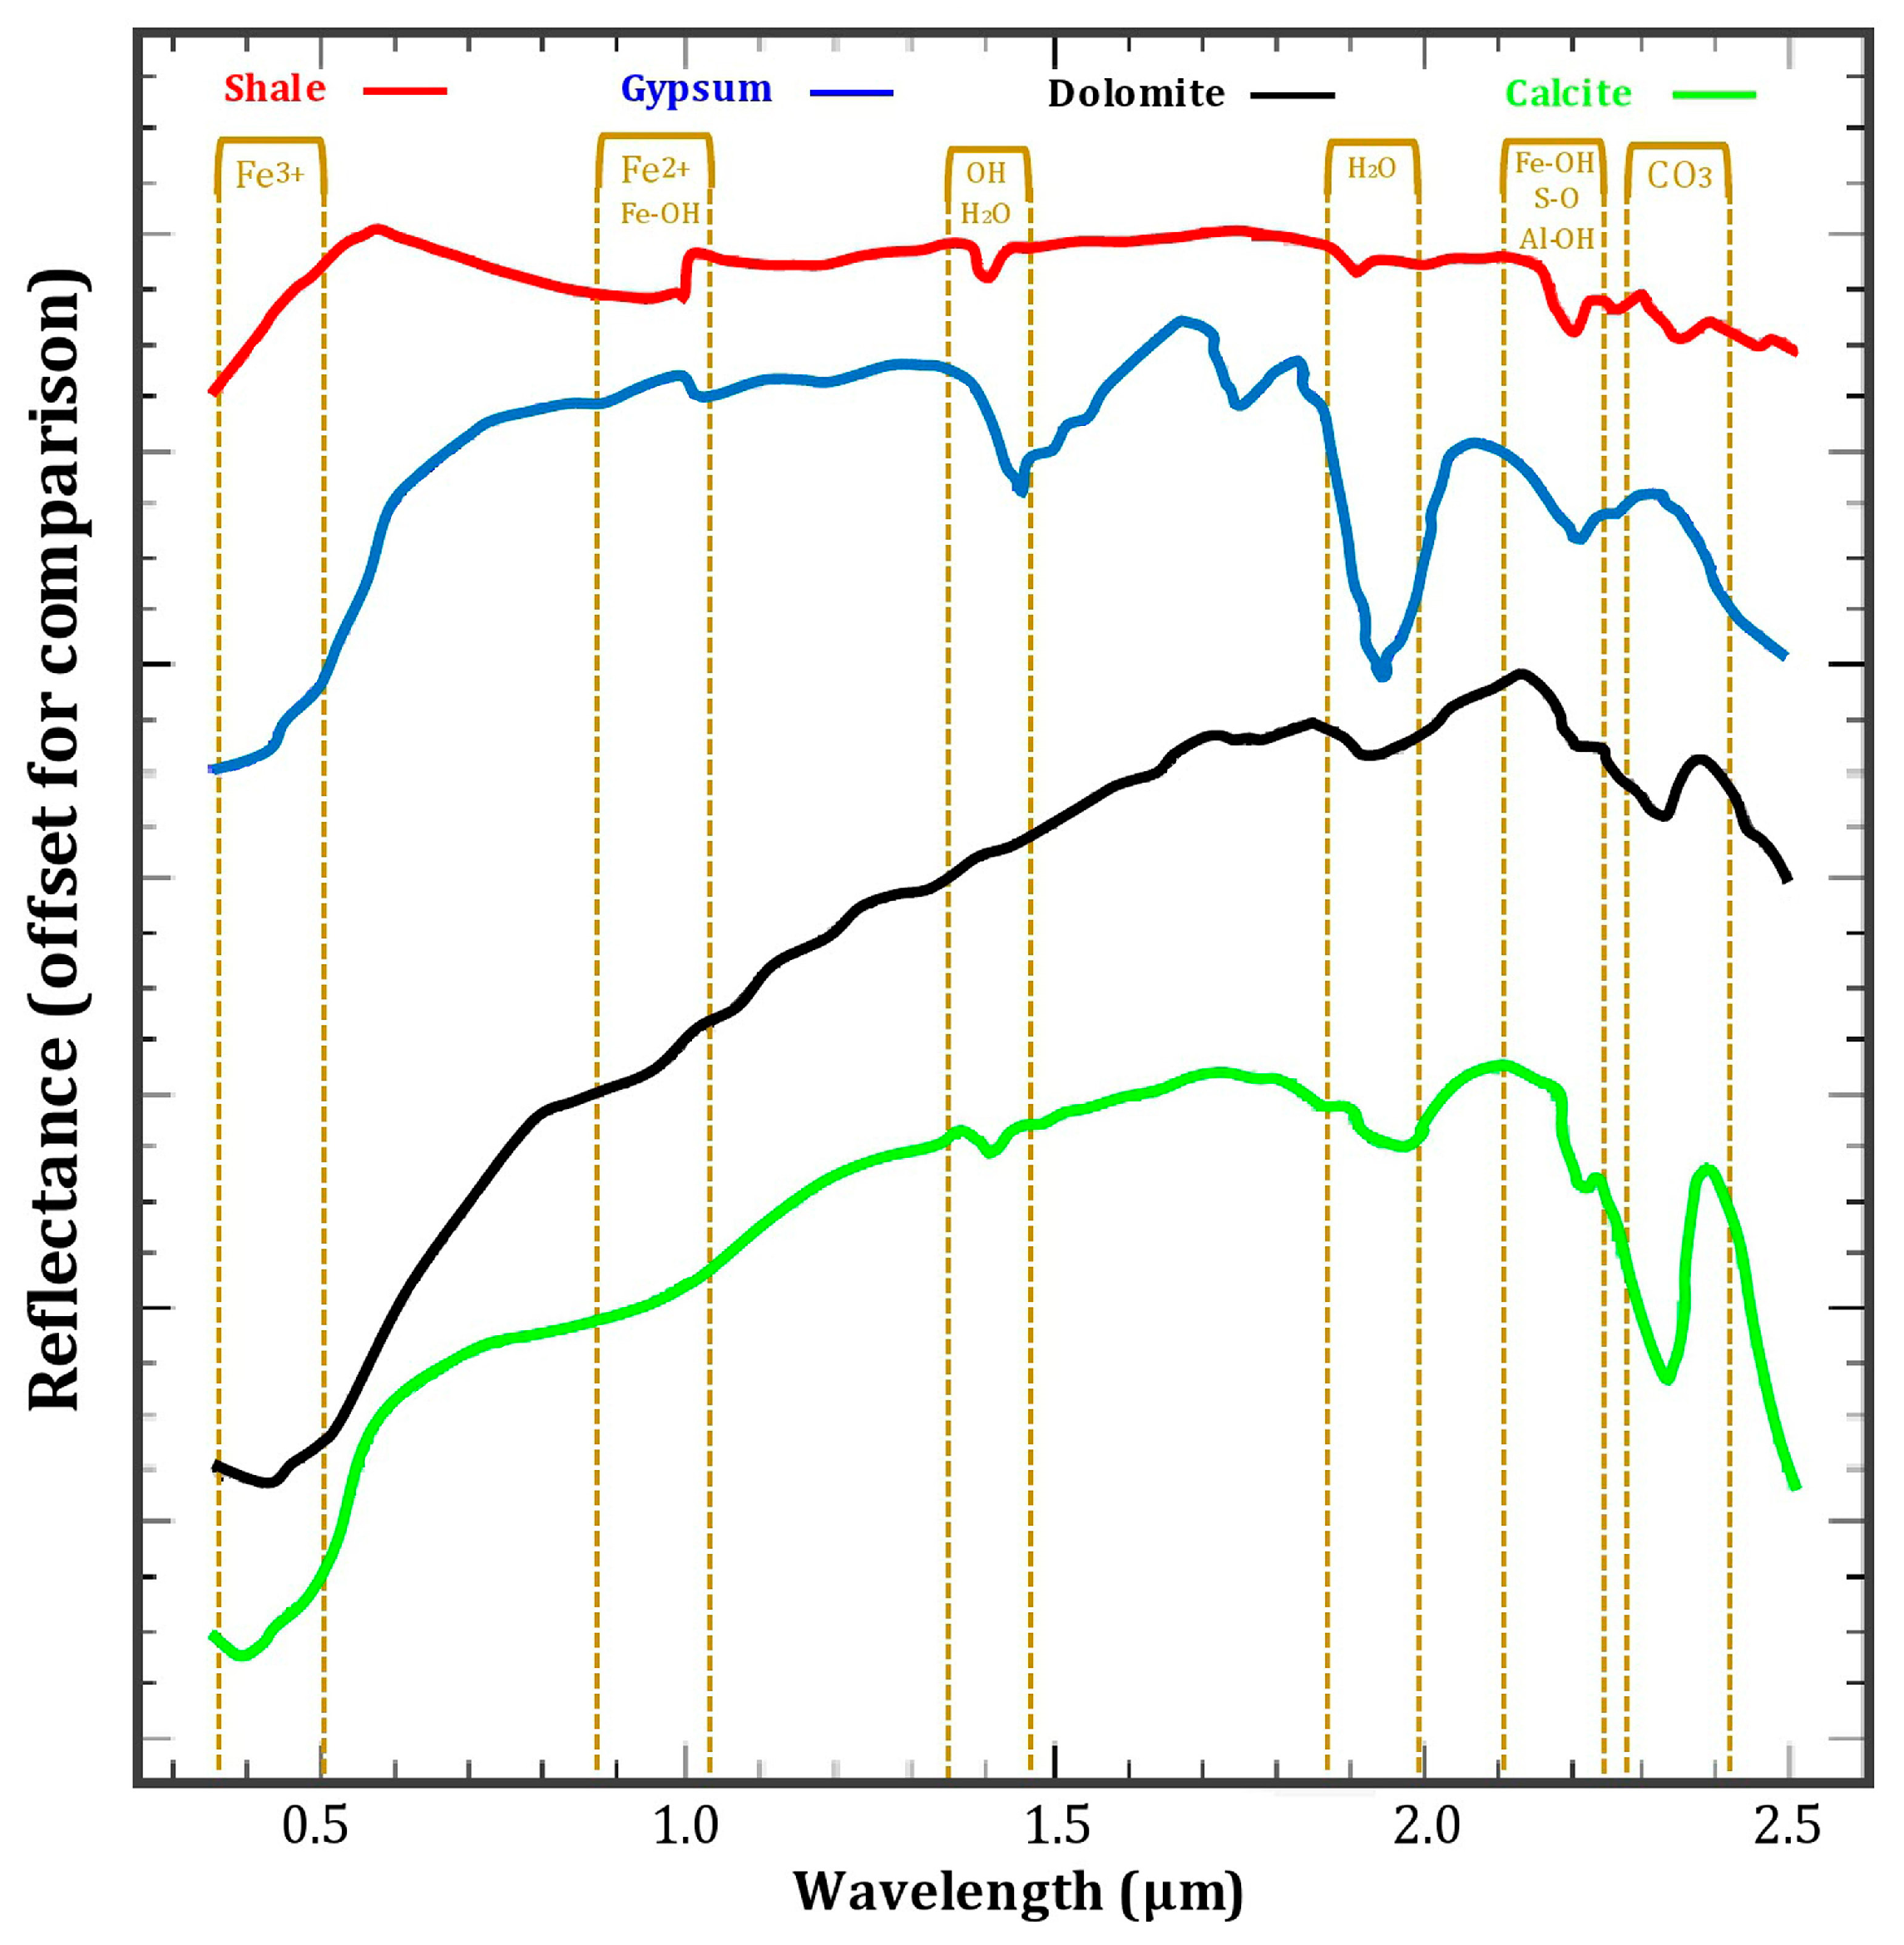
3.4. Fieldwork Data and Laboratory Analysis

Geological survey and laboratory analysis were carried out to confirm the image processing results and mineral prospectivity mapping for the central part of the KKTZ region. A global positioning system (GPS) survey was conducted in the study area for verifying the spatial distribution of alteration zones and lithological units using a handheld Monterra GPS (average accuracy of 3 m; Garmin, New Taipei City, Taiwan). Additionally, numerous photos were taken from alteration zones and lithological units during the field surveys. Thirty hand specimens were collected from alteration zones, ore mineralization and lithological units for laboratory analysis. Polish sections of ore mineralization and thin sections of alteration zones and lithological units were prepared. For a detailed mineralogical study of alteration zones, X-ray diffraction (XRD) analysis was implemented using an X’pert Pro XRD diffractometer (Philips, Amsterdam, The Netherlands) located at the Iran Mineral Processing Research Center (IMPRC, Tehran, Iran). Moreover, analytical spectral devices (ASD) spectroscopy was performed to the samples collected from the main lithological units exposed in the study area using a FieldSpec3® spectroradiometer (Malvern Panalytical Ltd., Malvern, UK, operating from 0.35 µm to 2.5 µm) located at the University of Kerman Institute of Science and High Technology (Kerman, Iran).

4. Results

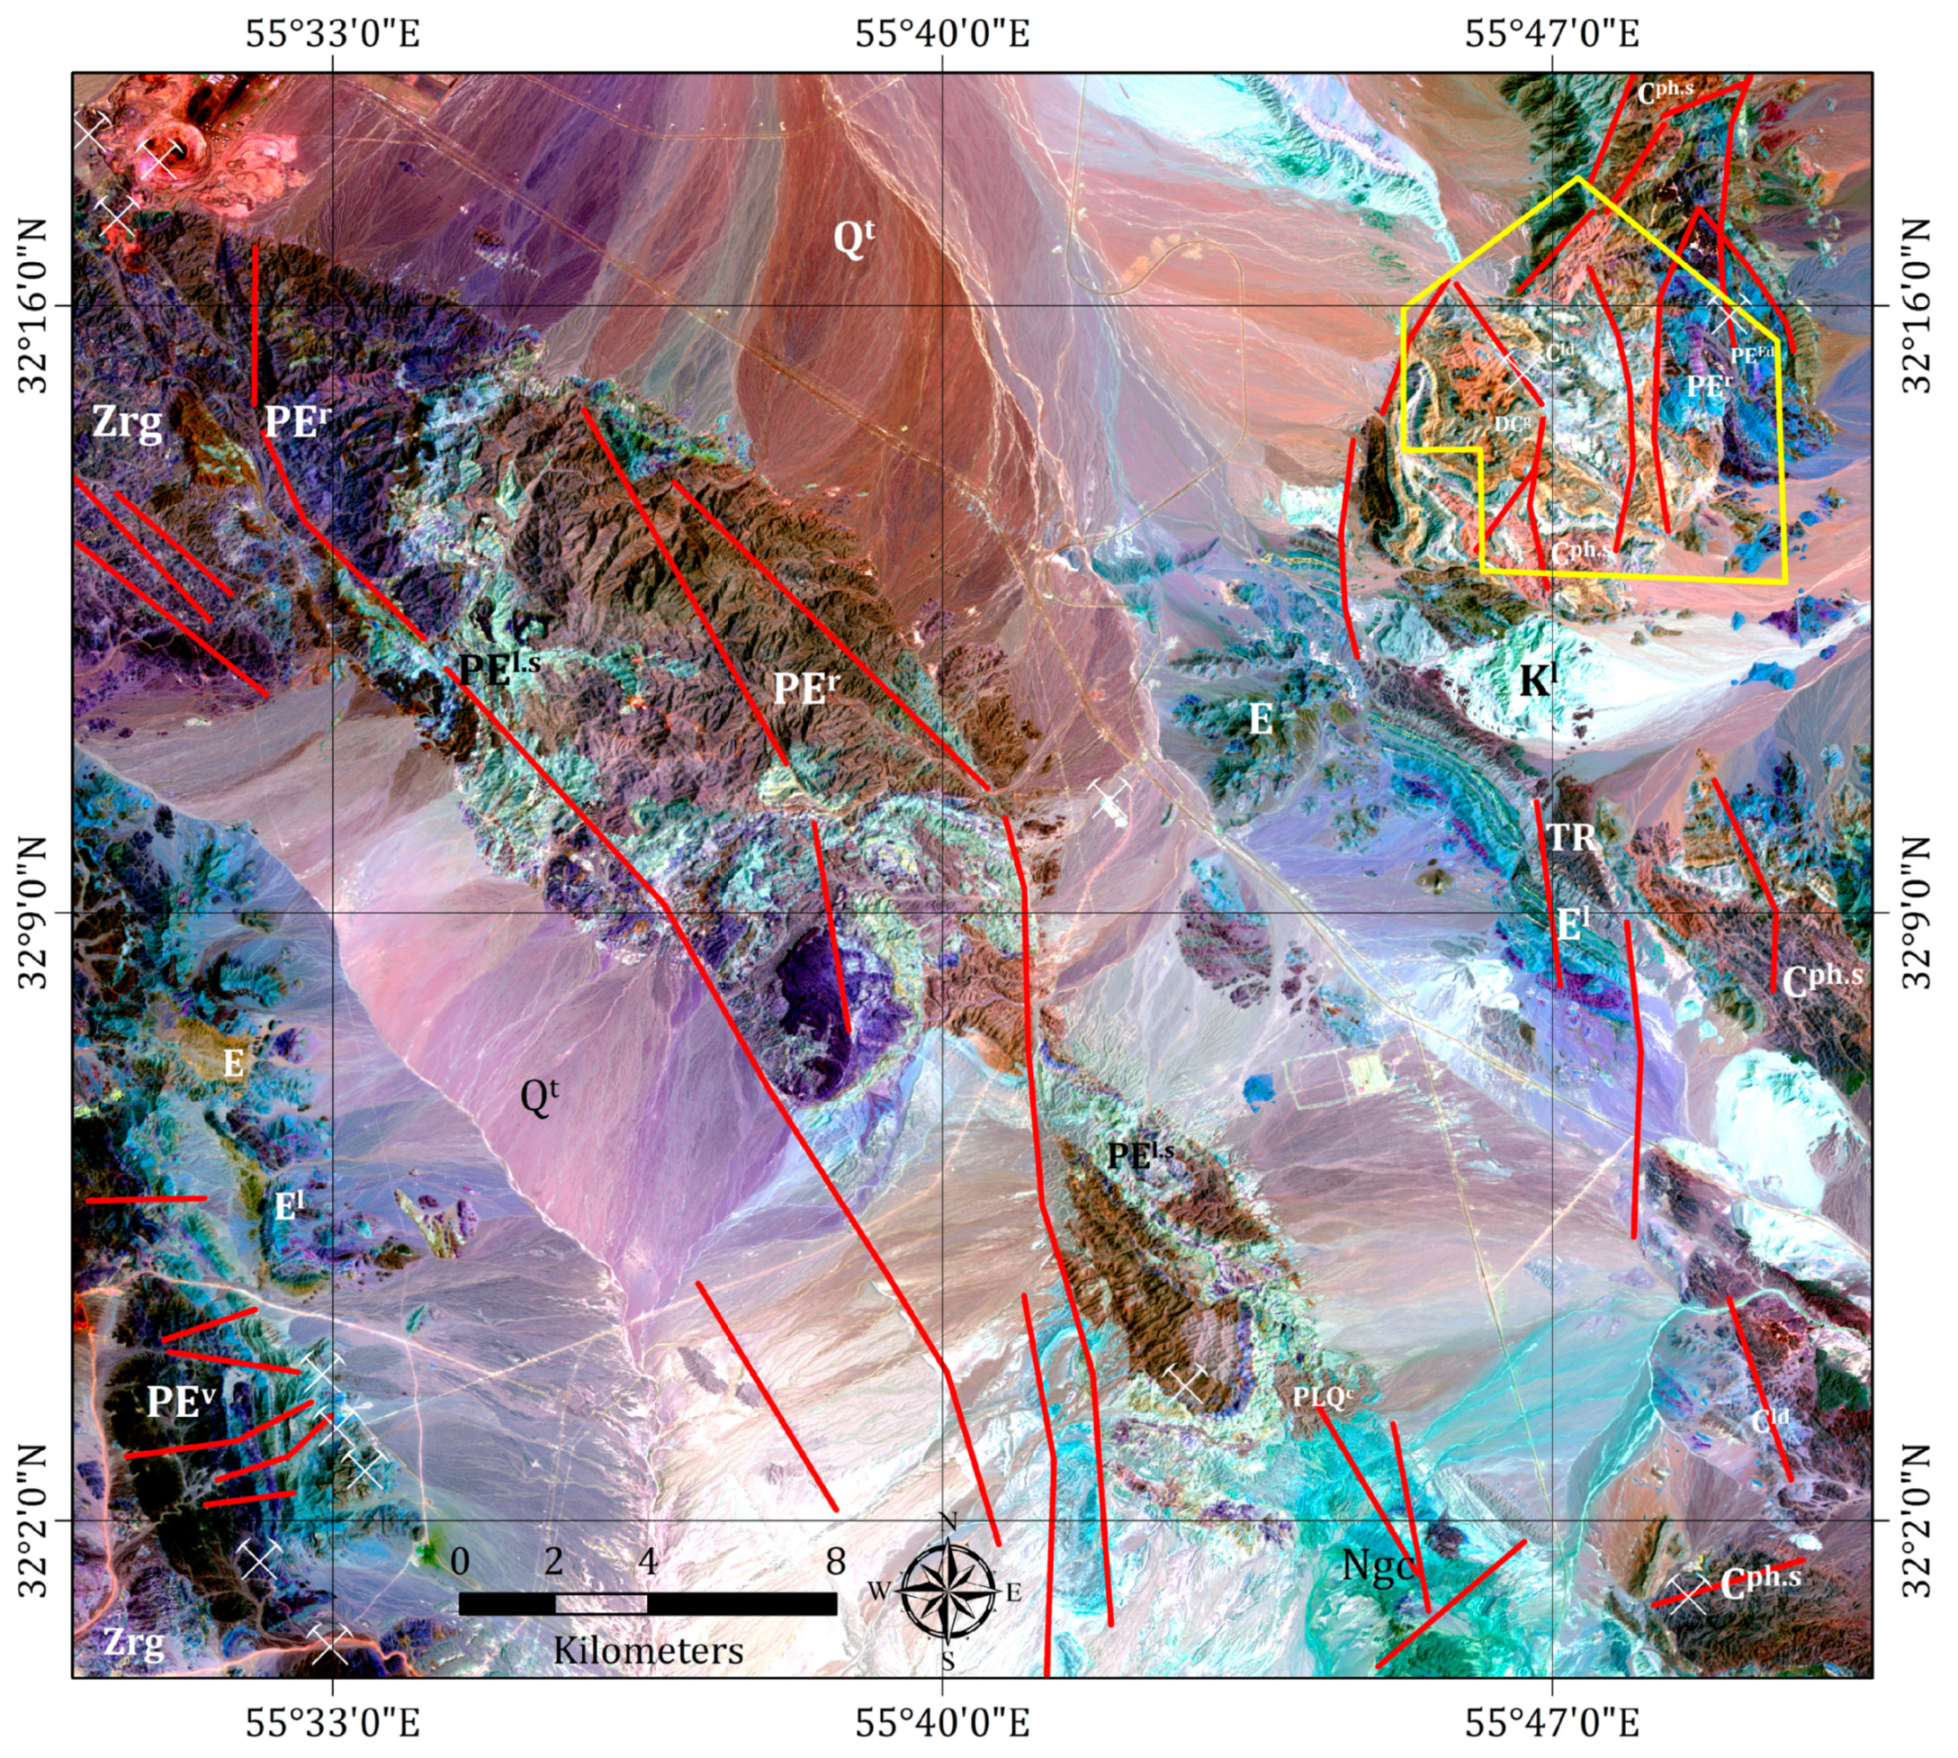
4.1. Lithological and Alteration Mapping Using Landsat-8, Sentinel-2 and ASTER

For generating a regional view of lithological units in the study region, the Red-Green-Blue (RGB) false color composite of bands 2, 5 and 7 for Landsat-8 and bands 2, 8 and 12 for Sentinel-2 were considered, respectively. The resultant images show most of the lithological units having spectral features related to Fe3+ and Fe3+/Fe2+ iron oxides and clay and carbonate minerals. Regarding the geological map of the study area (see Figure 1), the identification and lithological discrimination of the units in Landsat-8 and Sentinel-2 resultant images were almost similar. Therefore, the RGB false color composite image of the Sentinel-2 spectral bands was selected and presented herein (Figure 4). The lithological units such as the rhyolite and acidic tuff interbedded with crystalline limestone (PEr) unit, alternation of limestone, dolomite and shale (the Shemshak, Espahk and Surkh Formations) (TR), the alternation of light green sandstone, slate and phyllite (Cph.s) and the Zarigan granite (Zrg) show a mixture of Fe3+ iron oxides and clay and carbonates (brown, blue and purple shades). The marble, garnet schist, biotite schist and quartzite (PE1.s) unit, light brown thin bedded dolomite and limestone, red shale and siltstone and white to red quartzite (Kuhbanan Formation) (E1), marl interbedded with gypsum and conglomerate (Ngc) unit and the massive to thick bedded limestone (K1) unit mostly contain Fe3+/Fe2+ iron oxides mixed with clay and carbonates (light green and cyan hues). The sphilite, basalt, tuff and grey to light brown limestone (PEv) unit is characterized as dark brown color due to high content of Fe3+ iron oxides. The northeastern part of the scene (yellow polygon) shows a variety of colors related to absorption features of target alteration minerals including Fe3+ and Fe3+/Fe2+ iron oxides and clay and carbonate minerals. The massive to medium bedded limestone and dolomite (C1d) unit, gypsum interbedded with grey limestone (DCg), the Cph.s unit and the PEr unit are the main lithological units in this zone. A high level of Fe3+ iron oxides (orange, pink to rose blush shades), mixture of Fe3+ and Fe3+/Fe2+ iron oxides (yellow tone) and clay and carbonate minerals (light blue hue) in the zone is notable (Figure 4). Note that the occurrence of carbonate-hosted Pb-Zn mineralization is reported in this zone (yellow polygon) and detailed alteration mapping is presented by authors during this study.
The RGB false color composite of bands 6, 2 and 8 of ASTER discriminate most of the lithological units containing Al/Fe-OH, Fe+2/Fe3+ and Mg-Fe-OH/CO3 absorption properties (Figure 5). The PEr unit, the Zarigan granite (Zrg), thin bedded limestone and dolomite (PEEd) unit and some parts of the Kuhbanan Formation (E1) appear in purple due to Al/Fe-OH minerals that is slightly mixed with Mg-Fe-OH/CO3 minerals. The DCg unit is depicted as a green tone because of Fe+2/Fe3+ minerals. The Cph.s unit is characterized in cyan hue attributed to mixture of Fe+2/Fe3+ and Mg-Fe-OH/CO3 minerals. The Ngc unit and the K1 unit are represented as bright yellow shade probably because of combination between Mg-Fe-OH/CO3, Al/Fe-OH and Fe+2/Fe3+ minerals. The PEv unit is considered as dark shade due to high content of Fe3+ iron oxides. The TR unit having Al/Fe-OH and Mg-Fe-OH/CO3 minerals is presented in a dark purple tone. The C1d unit is manifested in brown-golden color due to Mg-Fe-OH/CO3 minerals mixed with Fe+2/Fe3+ minerals. The E unit, PEr and some parts of the Kuhbanan Formation (E1) appear as dark green hue because of Fe+2/Fe3+ minerals (Figure 5).
Figure 6A–D shows the results of band ratios for mapping iron oxide/hydroxides and clay and carbonate minerals derived from Landsat-8 and Sentinel-2 spectral bands. The 4/2 band ratio of Landsat-8 and Sentinel-2 shows the spatial distribution of iron oxide/hydroxide minerals (red pixels), which are mostly mapped in the PE1.s unit, the Ngc unit, the K1 unit, the PEr unit, the DCg unit and Quaternary deposits (Qt) (Figure 6A,B). The 6/7 band ratio of Landsat-8 and 11/12 band ratio of Sentinel-2 map the surface distribution of hydroxyl-bearing alteration minerals and carbonates (green pixels) (Figure 6C,D). Accordingly, the PE1.s unit, tuff and thick bedded of red silty shale (E) unit, the K1 unit, the PEr unit, the pink to white granite (Zarigan granite) (Zrg), the C1d unit and the Qt deposits are mapped due to high content of clay and carbonate minerals in their composition. Clay and carbonate minerals show higher surface abundance in the Landsat-8 ratio-image (Figure 6C) compared to the Sentinel-2 ratio-image (Figure 6D). The K1 unit is particularly mapped in the Landsat-8 ratio-image (Figure 6C), while it shows the smaller spatial distribution in the Sentinel-2 ratio-image (Figure 6D). It is because the band 12 (2.100–2.280 µm) of Sentinel-2 mostly covers the absorption features of hydroxyl-bearing minerals (2.10–2.20 µm), while the absorption features of carbonates typically concentrate around 2.350 to 2.450 µm [69,82]. Hence, carbonates could not be mapped using 11/12 band ratio of Sentinel-2, properly.
The 4/2 band ratio of ASTER shows the iron oxide/hydroxide minerals in red pixels, which are typically mapped in the PE1.s unit, the K1 unit, the PEr unit, the DCg unit, the PEEd unit, the Kuhbanan Formation (E1) and the C1d unit (Figure 7A). The Al/Fe-OH minerals are specifically mapped as mustard pixels in the RBD1 image of ASTER (Figure 7B). Comparison to the geology map of the study area, the high abundance of Al/Fe-OH minerals (mustard pixels) are associated with the lithological units of the Cph.s, the PEr, the Kuhbanan Formation (E1), the PEv unit, the PEEd unit, the TR and Quaternary deposits (Qt) (Figure 7B). The RBD2 image of ASTER shows the surface abundance of Mg-Fe-OH/CO3 minerals (green pixels; Figure 7C), which are typically associated with the K1 unit and the C1d unit. Although the Kuhbanan Formation (E1), the PE1.s unit, the Ngc unit and the PEr unit are also partially mapped in Figure 7C. Dolomitic units are specifically mapped in the RBD3 image of ASTER as yellow pixels (Figure 7D). The C1d lithological unit is strongly represented in yellow pixels. Additionally, some parts of the Kuhbanan Formation (E1), the TR unit, PEEd unit, the PE1.s unit and the PEr unit are mapped in Figure 7D due to the high content of dolomite in their lithological composition.
Analyzing the eigenvector loadings derived from the PCA method for Landsat-8 and Sentinel-2 indicates that the PC4 and PC5 contain key information related to the hydroxyl-bearing and carbonate and iron oxide/hydroxide minerals. Table 2 shows the eigenvector matrix for Landsat-8 selected bands. The PC4 has strong loadings of bands 6 (0.667216) and 7 (−0.48894) with opposite signs. Thus, the PC4 image identify hydroxyl-bearing minerals and carbonates as bright pixels due to a positive sign in the reflection band (band 6). Figure 8A) shows the PC4 image of Landsat-8. The spatial distribution of hydroxyl-bearing minerals and carbonates (green pixels) is mostly identified with the units of the PE1.s, the PEr, the K1, the Cph.s, the DCg, the C1d and Qt deposits. The Zarigan granite (Zrg) and Kuhbanan Formation (E1) also show some hydroxyl-bearing minerals in the PC4 image of Landsat-8 (Figure 8A). The PC5 of Landsat-8 has moderate positive contribution in band 2 (0.318038), negative strong loadings in band 4 (−0.579504) and strong positive contribution (0.516661) in band 5 (Table 2). Accordingly, iron oxide/hydroxide (Fe3+/Fe2+) minerals manifest as dark pixels in the PC5 image because of negative contribution of band 4 (reflection band). The dark pixels were inverted to bright pixels by negation (multiplication to −1). Figure 8B displays the spatial distribution of iron oxide/hydroxides (red pixels) in the study area. The units of the PE1.s, the Cph.s, the Ngc, the PEr, the Zarigan granite (Zrg), the TR and the DCg show a high abundance of oxide/hydroxides in the PC5 image of Landsat-8 (Figure 8B). Comparison of the Landsat-8 PCA results to the band ratio indicates that the spatial distribution of iron oxide/hydroxides minerals and hydroxyl-bearing minerals and carbonates in the PC images is generally less widespread. Moreover, the alteration zones mapped by the PCA method show better spatial relationship with the documented ore mineral occurrences in the study area.
Considering eigenvector loadings for selected bands of Sentinel-2 (see Table 3), the PCA4 includes a great contribution of band 11 (−0.641949) with a negative sign and band 12 (0.567634) with a positive sign. Hence, hydroxyl-bearing minerals represent in dark pixels of the PC4 image (Figure 8C). The dark pixels were converted to bright pixels by negation, subsequently. Results show that the spatial distribution of hydroxyl-bearing minerals is typically associated with the units of the PE1.s, the Cph.s, the Kuhbanan Formation (E1), the PEr, the K1, the Zarigan granite (Zrg), the Ngc, the C1d and Qt deposits (Figure 8C). Iron oxide/hydroxide (Fe3+/Fe2+) minerals appear as bright pixels in the PCA5 image of Sentinel-2 due to a strong positive loading in band 4 (0.698634) and negative loadings of band 2 (−0.454829) and band 8 (−0.523627), respectively (see Table 3). Iron oxide/hydroxide minerals are represented in bright pixels as a result of a positive loading in the reflection band (band 4) (Figure 8D). The high surface abundance of iron oxide/hydroxide (red pixels) is highlighted with the PE1.s unit, the Cph.s unit, the Ngc unit, the PEr unit, the DCg unit, the Zarigan granite (Zrg), the TR unit and Qt deposits (Figure 8D). The spatial distribution of iron oxide/hydroxides minerals in the PCA5 image of Sentinel-2 is less prevalent compared to the PCA5 of Landsat-8 (see Figure 8B,D). Nevertheless, the PC4 image of Landsat-8 and Sentinel-2 are almost identical in many parts (see Figure 8A,C).
The PCA technique was also implemented on ASTER VNIR+SWIR bands for mapping the target alteration minerals. The eigenvector matrix for ASTER data is shown in Table 4. The PC3 contains strong positive loading in band 4 (0.564435) and strong negative loading in band 8 (−0.896111). The Mg-Fe-OH/CO3 has high reflectance about 1.6 μm that is coincident with band 4 of ASTER. The Fe-Mg-OH and CO3 minerals exhibit diagnostic absorption features near 2.350 μm, which is matched with bands 8 of ASTER [60,75]. So, the PC3 image maps Mg-Fe-OH/CO3 minerals as bright pixels because of positive loading in band 4 (reflection band). Figure 9A shows the PC3 image-map of the study area that overlain by green color. The green pixels show a high concentration of Mg-Fe-OH/CO3 minerals. Referring to the local geology map of the study zone, the Mg-Fe-OH/CO3 minerals are typically identified in the K1 unit, the Ngc unit and the C1d. The Kuhbanan Formation (E1), the PEr unit, the Zarigan granite (Zrg) and the PE1.S unit are also weakly mapped in the PC3 image (Figure 9A). These lithological units contain a high abundance of carbonates and Mg-Fe-OH minerals, which can be detected by band 8 (2.295–2.365 μm) of ASTER. The detected pixels in the PC3 image-map are comparable to the RBD2 image-map (see Figure 7C).
The PC4 has strong positive loadings in band 2 (0.812776), while it shows strong negative loadings in band 4 (−0.429509) (see Table 4). Iron oxide/hydroxides minerals characterize by high absorption features about 0.40 to 1.10 μm and high reflection around 1.60 μm [75]. Considering the spectral location of bands 2 (0.63–0.69 μm) and 4 (1.60–1.70 μm) of ASTER and the eigenvector loadings in PC4, it is discernable that iron oxide/hydroxides minerals depict as dark pixels in the PC4 image, which consequently negated to bright pixels and overlain by red color (Figure 9B). The Ngc unit, the Kuhbanan Formation (E1) and the PEEd unit are strongly mapped in the image. However, some zones located in the K1 unit, the PE1.S unit, the PEr unit and Qt deposits are also distinguishable (Figure 9B). The PC5 shows a strong contribution in band 4 (-0.668838) and band 6 (0.425904) and band 9 (0.507113) with opposite signs (see Table 4). The OH/S-O/CO3-bearing minerals exhibit diagnostic absorption features at 2.20 to 2.50 μm, which are coincident with bands 6 to 9 of ASTER [74]. Therefore, OH/S-O/CO3-bearing minerals can be mapped as dark pixels in the PC5 image. Figure 9C shows the PC5 image that dark pixels are converted to bright and overlain by mustard color. Spatial distribution of OH/S-O/CO3-bearing minerals is clearly observable in the Cph.s unit, the DCg unit, the PEEd unit the TR unit the PEr unit and Qt deposits. Some small parts of the Kuhbanan Formation (E1) and the PE1.S unit are also appeared as mustard pixels (Figure 9C). The results of PC5 image is almost matched to the RBD1 image-map (see Figure 7).
Checking the PC6 and PC7 images indicate that they are mostly noisy and uninformative. Considering the laboratory reflectance spectra of dolomite resampled to response functions of VINR+SWIR bands of ASTER (see Figure 4) reveals that the PC8 image feasibly contains vital information related to the spatial distribution of dolomite. Bands 4 and 5 can be considered reflection bands, whereas band 7 can be deliberated absorption bands for detecting dolomite. The PCA8 has strong positive loadings in band 4 (0.404433) and band 5 (0.558407) and great contribution of band 7 (−0.623420) with a negative sign (see Table 4). The PC8 image-map of the study zone is shown in Figure 9D. Regarding the geology map of the study zone, the C1d unit clearly appears as bright pixels in the PC8 image. Moreover, the Kuhbanan Formation (E1), the TR, the PEr unit, the PE1.S unit and the PEEd unit are partially characterized in yellow pixels. The resultant image-map of the PC8 is similar to the RBD3.

4.2. Detailed Detection of Iron Oxide/Hydroxides and Dolomit Using WV-3

Figure 10 shows the WV-3 scene covering the selected subset of the study area contains Zn–Pb mineralization. The band ratio image-map of 5/3 for mapping Fe3+oxides (A), the band ratio image-map of 5/2 for identifying iron-stained alteration (B), the band ratio image-map of 7/4 for detecting dolomite/Fe2+ (C), and RGB false color composite image-map of 7/4, 5/3 and 5/2 for discriminating lithological units (D) are shown in Figure 10. The surface distribution of Fe3+oxides (bright pixels) is generally associated with the DCg unit, the PEr unit and PEEd unit (Figure 10A).
The band ratio image-map of 5/2 generates analogous results for mapping all iron oxides (iron-stained alteration) associated with the above-mentioned lithological units (Figure 10B). This similarity of iron oxide mapping results might be related to extensive iron-stained occurrences in the lithological units. The spatial distribution of dolomite/Fe2+ (bright pixels) is typically mapped in the eastern part of the selected subset (Figure 10C). The PEr unit, PEEd unit and the C1d unit are highlighted in the image-map of the 7/4 band ratio (Figure 10C). Figure 10D shows RGB false color composite of 7/4, 5/3 and 5/2 band ratio images for the selected subset. The discrimination of lithological units is characteristically discernable based on different composition of iron oxide/hydroxide minerals.
The lithological units with a high abundance of iron oxide/hydroxide minerals such as the DCg unit appear in cyan. The exposures of the PEr, PEEd and C1d units contain the high abundance of dolomite/Fe2+ represent as whitish-yellow, golden yellow and light brown. On the other hand, the Kuhbanan Formation (E1), Qt deposits and the Cph.s unit having a low abundance of iron oxides show recognizable colors (shades of gray) and boundaries with other lithologies (see Figure 10D).
Analyzing the PCA statistical results for the WV-3 selected subset shows the PC3, PC4 and PC6 contain essential information for mapping iron-stained alteration, dolomite/Fe2+ and Fe3+oxides, respectively. The PC3 shows high negative loading in band 2 (−0.598506) and strong positive loading in band 5 (0.661001) (see Table 5). Thus, iron-stained alteration can be mapped as bright pixels because of band 5 that is assumed as a reflection band. Figure 11A shows the DCg unit and some small parts of the PEr unit as bright pixels. The PC4 has moderate positive loading in band 2 (0.345377), strong positive loading in band 4 (0.631659) and high negative loading in band 7 (−0.509311) (see Table 5). Dolomite/Fe2+ can be mapped as dark pixels due to the negative sign in the reflection band (band 7). Figure 11B shows the negated image-map of the PC4. The PEr unit, the PEEd unit and the C1d unit are represented as bright pixels. The image-map of the PC4 is identical to the 7/4 band ratio resultant (see Figure 10C). The PC6 contains a strong contribution in band 2 (−0.427799) and band 3 (−0.515988) with a negative sign and strong loading in band 5 (0.646312) with a positive sign (see Table 5). Accordingly, Fe3+oxides manifest in bright pixels because of positive sign in band 5, which is assumed as a reflection band (Figure 11C). The DCg unit, the PEr unit and the PEEd unit are mapped in the PC6 image-map. Figure 11D shows RGB false color composite image-map of the PC4, PC6 and PC3, respectively. Lithological units are differentiated stronger than RGB false color composite of band ratios (see Figure 10D). The lithological boundaries of the PEr unit, the PEEd unit and the C1d unit (represented as golden to orange-yellow) with other lithological units such as the DCg, the Cph.s and the E1 units (depicted in shades of gray and purple) are distinguishable (Figure 11D).

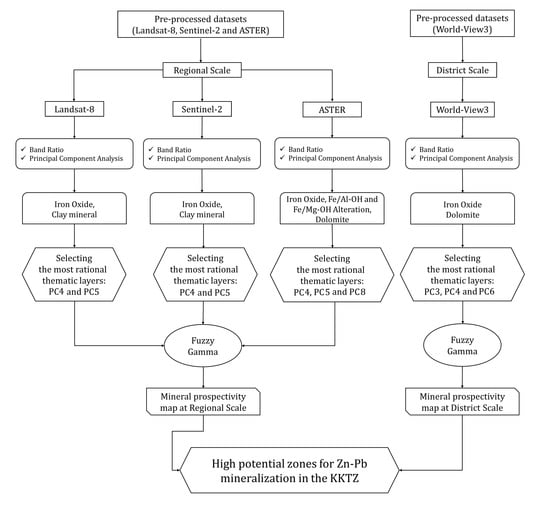
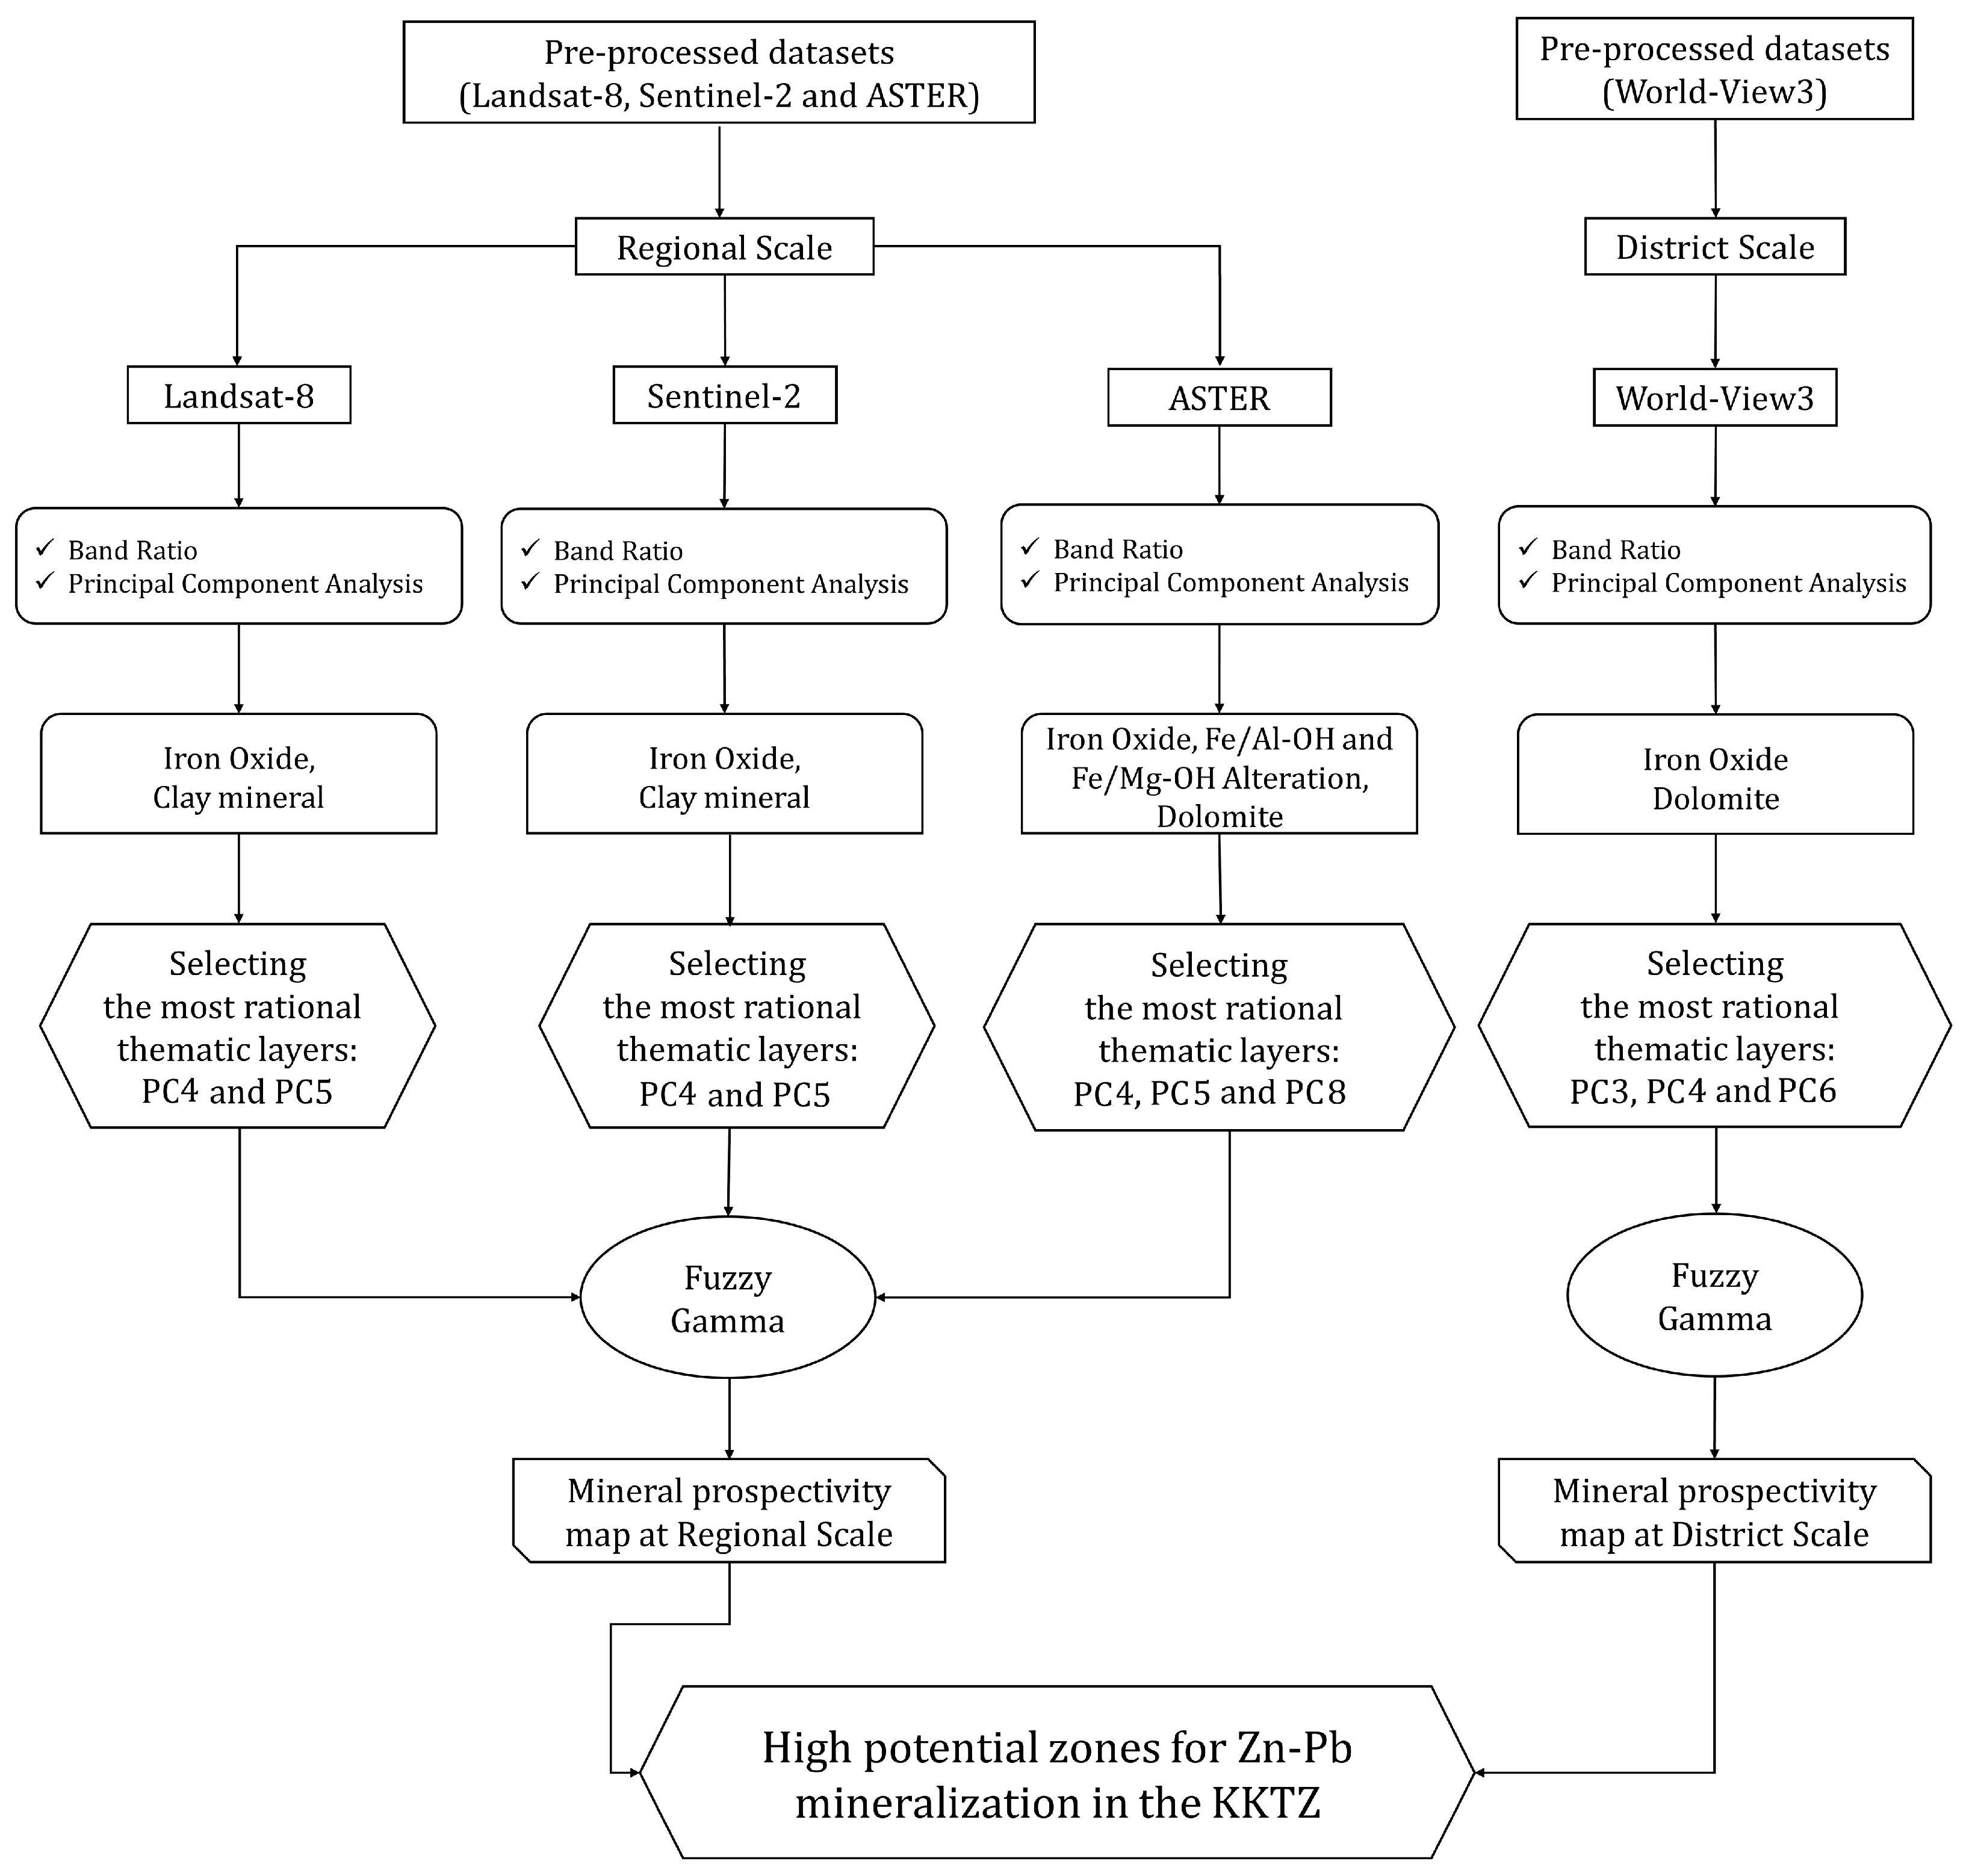
4.3. Generating Mineral Prospectivity Maps for the Study Area

The fuzzy-logic model was utilized to produce mineral prospectivity maps of the favorable areas for ore mineralizations in the study region using most rational alteration thematic layers derived from image processing techniques (see Table 6). In this analysis, the PCA output was considered more informative compared to band ratios output. It is due to the fact that the PCA is statistically based algorithm and uses uncorrelated linear combinations (eigenvector loadings) to map spectral characteristics of alteration minerals. Therefore, the PC4 and PC5 thematic layers of Landsat-8 and Sentinel-2 and PC4, PC5 and PC8 thematic layers of ASTER were selected to be integrated by application of the fuzzy gamma operator (γ = 0.7) for generating mineral prospectivity map at a regional scale. Figure 12 shows the regional mineral prospectivity map of the study area. Evaluating the fuzzy membership indicates that the high favorability index is associated with some of the lithological units in the study area. The PE1s unit, the PEr unit, the Kuhbanan Formation (E1), the TR unit, the Cph.s unit, the Ngc unit, the Zarigan granite (Zrg) and the DCg unit show high value (0.7 to 1.0) of the favorability index. Most of the mines and ore indications are located in the high value zones of the favorability index and associated with fault systems in the study area (Figure 12). Results demonstrate that the PE1s unit, the PEr unit and the Zarigan granite (Zrg) show the highest value (0.9 to 1.0) of the favorability index. The alteration zones associated with these lithological units are the most favorable/prospective areas for ore mineralizations at the regional scale. Some of the high prospective zone demarcated using dashed black ellipsoids and circles in Figure 12, which can be considered for future mineral exploration in the study region.
Figure 13 shows the local mineral prospectivity map of the study area derived from the PC3, PC4 and PC6 thematic layers (most rational alteration thematic layers) for WV-3 data. The fuzzy fuzzy gamma operator (γ = 0.7) was used to fuse the selected alteration thematic layers (see Table 3). The highest value of (0.8 to 1.0) the favorability index is obtained for the PEr unit, the PEED unit and the C1d unit. In addition, the DCg unit shows a high value (0.6 to 0.9) of the favorability index in some parts of the study area. The Pb-Zn mineralization zones have moderate to high favorability index value (0.6 to 1.0) and are also adjoining to fault systems (Figure 13). Accordingly, the most favorable/prospective zones for Pb-Zn mineralization in the study area are alterations (especially dolomitic zone) associated with the PEr unit, the PEED unit and the C1d unit, mainly in fault contact zones with impermeable lithological units. Black polygons, ellipsoids and circles show some of the high prospective zones for future mineral prospecting in the study region (Figure 13). These high prospective zones were selected to check during filed reconnaissance in this study. Locations of in situ observation are shown in Figure 13.

4.4. Verifying the Spatial Distribution of Alteration Zones and High Prospective Areas

Field reconnaissance was conducted to verify the occurrence of alteration zones and high prospective locations of Pb-Zn mineralization in the study area. The global positioning system (GPS) survey was undertaken for estimating the overall accuracy of the image processing techniques. Several field photos were taken to record the location, contact and characteristics of alteration zones and lithological units. Rock sample collection was carried out in several parts of the study regions and high prospective zones for laboratory analysis such as polish and thin sections and XRD analysis and the ASD spectroscopy. Surface manifestations of mineral assemblages such as iron oxide/hydroxides, dolomite, shale, calcite and gypsum are widespread in the study area. Some of the highly prospective zones, mineralogically interesting alteration zones and lithological units in the study area were particularly visited. The argillic alteration, sericitic zones, iron oxides and dolomitization were found in the PEr unit, the PEED unit, the E1 unit and the C1d unit, which showed some surface expression of hematite, malachite, pyrite, galena and sphalerite. Some old open-pit quarries were also found in the alteration zones of the lithological units. In many parts of the study area, surface expression of Pb-Zn mineralization was typically observed in the fault contact of dolomite with other lithological units (Figure 14A–F).
Polish section study shows the presence of chalcopyrite, pyrite, malachite, smithsonite, sphalerite, galena, hematite and limonite. Thin section study typically displays the association of iron oxide/hydroxides with dolomite that mostly concentrated in the fractures. The XRD analysis of the samples collected from alteration zones inside old open-pit quarries and surrounding areas shows the presence of quartz, dolomite, calcite, muscovite, chlorite, gypsum, albite, illite, jarosite and malachite. The ASD spectroscopy analysis for main lithological units such as shale, gypsum, dolomite and calcite were measured in this study (Figure 15). The laboratory reflectance spectra from the shale sample display three distinguishable absorption features about 1.40 μm attributed to OH/H2O stretches, 1.90 μm related to H2O stretches and 2.20 μm due to combination of the OH-stretching fundamental with Al-OH bending mode, respectively (Figure 15). These absorption features occur in shale because of the high content of clay minerals (Al-rich phyllosilicates) [103]. The reflectance spectra derived from gypsum exhibits three absorption features, which are identical to the shale sample (Figure 15). But, the absorption feature at 1.90 μm (due to H2O stretches) is stronger than the shale sample and the absorption feature near 2.20 μm is related to S-O bending mode [104]. The reflectance spectra of dolomite contain two main absorption features related to Fe2+ at 0.9 to 1.2 μm and CO3 in 2.35 μm (Figure 15). Calcite absorption properties typically concentrated about 2.35 μm (Figure 15), which is attributed to the vibrational processes of the CO3 bending mode [82]. Furthermore, the confusion matrix and Kappa Coefficient were calculated for alteration mapping results versus field GPS surveys (Table 7). The overall accuracy for Landsat-8 and Sentinel-2 datasets is 86.66% and 83.33%, respectively. The Kappa Coefficient of 0.83 for Landsat-8 and 0.81 for Sentinel-2 is also assessed. For the ASTER dataset, the overall accuracy and Kappa Coefficient are 70% and 0.68, respectively. The calculation of the confusion matrix for WV-3 shows the overall accuracy of 83.33% and Kappa Coefficient of 0.82 (Table 7).

5. Discussion

Remote sensing satellite imagery has been successfully utilized to detect the major hydrothermal alteration minerals associated with the carbonate-hosted Pb-Zn deposits in metallogenic provinces around the world [5,16,17,18,19]. In this investigation, multiple sources of spectral data derived from Landsat-8, Sentinel-2, ASTER and WV-3 sensors were utilized for detailed mapping a variety of hydrothermal alteration minerals in the central part of the KKTZ region, the CIT, Iran. Band ratios and PCA image processing techniques were used to produce thematic maps of hydrothermal alteration minerals for indicating the high prospective zones. Lithological units and alteration mineral zones were mapped based on spectral absorption characteristics of Fe3+/Fe2+ and Al-OH/CO3 minerals by implementing band ratios and PCA techniques to spectral bands of Landsat-8 and Sentinel-2. The spatial distribution of iron oxide/hydroxide minerals was mapped in the lithological units of the PE1s, the Ngc, the K1, the PEr, the DCg and Qt deposits using the 4/2 band ratio and PC5 of Landsat-8 and Sentinel-2. Analyzing confusion matrix for mapping iron oxide/hydroxide minerals using these sensors (see Table 7) indicates that the highest the user’s accuracy (71%) and producer’s accuracy (83%) were obtained for Sentinel-2 dataset. It shows that the higher spatial resolution of Sentinel-2 (10 m) clearly impacts on mapping minerals. The 6/7 band ratio of Landsat-8 and 11/12 band ratio of Sentinel-2 and the PC4 images were used to identify the surface distribution of hydroxyl-bearing alteration minerals and carbonates in the study region. The alteration zones associated with lithological units of the PE1s, the E, the K1, the PEr, the Zrg, the C1d and the Qt were highlighted. The Landsat-8 show user’s accuracy (91%) and producer’s accuracy (91%) for hydroxyl-bearing alteration minerals and carbonates, which are higher than user’s accuracy (90%) and producer’s accuracy (83%) of Sentinel-2 (see Table 7). It probably can be attributed to spectral coverage of band 12 (2.100–2.280 μm) of Sentinel-2, which is not able to map carbonates, properly. The overall accuracy of Landsat-8 for mapping target alteration minerals is 86.66% and higher than Sentinel-2 (83.33%) because of better spectral band placement in Landsat-8 for detection of hydroxyl-bearing alteration minerals and carbonates. Fuzzy logic modeling was used to fuse the most informative thematic alteration layers (the PC4 and PC5 images). Subsequently, mineral prospectivity map for the study area was generated. Several prospective zones were identified (see Figure 12), which are mostly associated with alteration zones in the PE1s unit, the PEr unit, the Zarigan granite (Zrg), the Ngc, the Cph.s and PEEd lithological units. Most of the prospective zones are located adjacent to the NW-SE and N-S fault systems, which likely acted as fluid pathways for hydrothermal ore mineralizations. Documented mineral occurrences show also close spatial relationship to the fault systems in the study area.
The ASTER dataset was used for detailed mapping iron oxide/hydroxides, Al/Fe-OH minerals, Mg-Fe-OH/CO3 minerals and dolomite associated with carbonate-hosted Pb-Zn deposits. The spatial distribution of these alteration minerals was comprehensively mapped. Results derived from the PCA for the study area show that calcite, gypsum, hematite and goethite are the main spectrally-spatially minerals. However, dolomite, jarosite, kaolinite and muscovite are minor spectrally-spatially minerals. The analysis of confusion matrix shows that calcite has the highest user’s accuracy (83%) and producer’s accuracy (83%). However, the lowest user’s accuracy (57%) was obtained for argillic alteration + Shale (kaolinite and muscovite) (see Table 7). It means that the spectral mixing and confusion of calcite with other alteration minerals is low, while for argillic alteration + Shale is high. Iron oxide/hydroxides shows the user’s accuracy of 80% and producer’s accuracy of 67%. Gypsum and dolomitization have similar user’s accuracy of 67% and producer’s accuracy of 67%. Thus, spectral mixing with other alteration minerals especially dolomite could be feasible for iron oxide/hydroxides. The spectral mixing and confusion between gypsum and argillic alteration + shale can be expected.
Moreover, dolomite has some spectral mixing with calcite. ASTER dataset shows the overall accuracy of 70% and Kappa Coefficient of 0.68. Accordingly, ASTER can map and discriminate different alteration minerals appropriately, but some spectral mixing and confusion are also associated with alteration mapping. ASTER PC image-maps show iron oxide/hydroxides, OH/S-O/CO3-bearing minerals and dolomite associated with the C1d unit, the PEr unit, the PEED unit, the Kuhbanan Formation (E1) and the Cph.s are high favorable/prospective zones for carbonate-hosted Pb-Zn mineralization (see Figure 12). The N-S faults are dominant structural features associated with the high potential zones; however, the NW-SE and NE-SW faults are also associated with few of the prospective zones.
More detailed surface distribution of Fe3+oxides, iron-stained alteration and dolomite in the highly prospective zones were identified using WV-3 dataset. Dolomite is mostly identified associated with the PEr unit, PEEd unit and the C1d unit. Calculation of user’s accuracy (83%) and producer’s accuracy (83%) for iron oxide/hydroxides and dolomite shows a low rate of spectral mixing and confusion. The overall accuracy of 83.33% and Kappa Coefficient of 0.82 show a very good rate of accuracy and agreement for WV-3 dataset (see Table 7). WV-3 mineral prospectivity map (see Figure 13) shows the zones of most favorable/prospective zones for the Pb-Zn mineralization in the study area. The dolomitic zones in the PEr unit, the PEED unit and the C1d unit are typically indicated as the highest potential zone. In the vicinity of N-S, NW-SE and NE-SW fault systems, several of the most prospective zones are identified in the study area (see Figure 13).
Fieldwork was conducted comprehensively in the highly prospective zones for observing surface expression of Pb-Zn mineralization and related alteration zones and lithological units. Iron oxide/hydroxides and dolomite as well as weak argillic/sericitic zones was found with surface expression of hematite, malachite, pyrite, galena and sphalerite in the PEr unit, the PEED unit, the E1 unit and the C1d unit. Surface manifestation of Pb-Zn mineralization was typically recorded in the fault contact of dolomite with impermeable lithological units. The presence of quartz, dolomite, calcite, muscovite, chlorite, gypsum, albite, illite, jarosite and malachite is verified by XRD analysis. These evidences emphasized that the fault systems provided fluid conduits for Pb-Zn mineralization that hydrothermally altered the host lithologies and afterwards oxidized during supergene processes. The ASD spectroscopy analysis of main lithological units showed distinct absorption features related to Fe2+, OH/H2O, H2O, Al-OH, S-O and CO3 for collected rock samples such as dolomite, shale, gypsum and calcite. Generally, confusion matrix and Kappa Coefficient calculated for alteration mapping results versus field GPS survey show reasonable overall accuracy (70% to 86.66%) and good rate of agreement (0.68 to 0.83). Landsat-8 and Sentinel-2 generally mapped iron oxide/hydroxides and hydroxyl-bearing and carbonate minerals and indicated favorable/prospective zones, while ASTER and WV-3 comprehensively detected and discriminated hematite, goethite, jarosite, gypsum, calcite, dolomite, kaolinite and muscovite and the highest prospective zones.

6. Conclusions

This investigation demonstrates the application of multi-source spectral data in the range of VNIR and SWIR wavelengths provided by Landsat-8, Sentinel-2, ASTER and WV-3 for indicating the highly prospective zones of carbonate-hosted Pb-Zn deposits in the KKTZ of the CIT region of Iran. Results show that significant information related to the iron oxide/hydroxide and hydroxyl-bearing and carbonate minerals can be easily obtained by implementing some specialized band ratio (e.g., 4/2, 6/7 and 11/12) and PCA technique to Landsat-8 and Sentinel-2 datasets. Fusing of the most informative alteration thematic layers by the fuzzy-logic model is a reliable approach for generating remote sensing-based mineral prospectivity map. Landsat-8/Sentinel-2/ASTER mineral prospectivity map for the KKTZ indicated the potential zones are mostly located in the altered zones of the PE1s unit, the PEr unit and the Zarigan granite (Zrg), which normally are near to the NW-SE and N-S fault systems. Detailed surface distribution of Al/Fe-OH minerals, Mg-Fe-OH/CO3 minerals and dolomite was detected using RBD and PCA methods to ASTER dataset. The alteration zones (especially gossan and dolomite) associated with C1d, the PEr, the PEED, the Kuhbanan Formation (E1) and the Cph.s lithological units and close to N-S, NW-SE and NE-SW faults are considered highly favorable/prospective zones for carbonate-hosted Pb-Zn mineralization in the study area. Detailed identification of Fe3+oxides, iron-stained alteration and dolomite in the highly prospective zones was obtained using WV-3 VNIR spectral bands processing (e.g., band ratios of 5/3, 5/2 and 7/4; PCA techniques). The most favorable/prospective zones for Pb-Zn mineralization in the study area are dolomite and gossan alteration zones located in the PEr, the PEED and the C1d lithological unit, which are exclusively placed in the fault contact zones of dolomitic occurrences with impermeable lithological units. The N-S, NW-SE and NE-SW trends fault systems provided fluid conduits for Pb-Zn mineralization and deposition and subsequent alteration zones in the study area. Therefore, it is recommended that detailed structural analysis of lineaments using Synthetic Aperture Radar (SAR) remote sensing data such as the Phased Array type L-band Synthetic Aperture Radar (PALSAR) is also required for future mineral prospection in the CIT. Additionally, SWIR bands of WV-3 can provide high spectral and spatial data for detailed alteration mapping. On the other hand, thermal infrared (TIR) data from Landsat-8 and ASTER are also valuable to map minerals like quartz, andradite, gypsum, calcite, dolomite, diopside and albite, comprehensively. In conclusion, the application of multi-sensor remote sensing satellite imagery and fusing the most informative alteration thematic layers using the fuzzy-logic model can provide a low-cost exploration approach for prospecting carbonate-hosted Pb-Zn mineralization in the KKTZ of CIT and other metllogenic provinces around the world. The results demonstrated in this investigation represent a significant contribution of space-borne multispectral systems to generate mineral prospectivity maps at various scales (regional, district and local scale). This approach could be very interesting for stakeholders and mining/exploration companies to use different types of space-borne multispectral data for distinct phases of mineral exploration.

Author Contributions

M.S. and I.M. writing—original draft preparation, software, analysis, validation; A.B.P. writing, reconstructing—review, editing and supervision; A.M.M. supervision; O.R. analysis; M.H. supervision; B.Z. supervision; B.P. supervision; A.M. and S.M.A. data processing. All authors have read and agreed to the published version of the manuscript.

Funding

Publication fees are not claim by Remote Sensing because A.B.P., M.H., B.Z., B.P. are guest editors for Special Issue of Multispectral and Hyperspectral Remote Sensing Data for Mineral Exploration and Environmental Monitoring of Mined Areas. They have right to publish feature papers free of charge due to serve for the Journal.

Acknowledgments

The Iran Minerals Production and Supply Company (IMPASCO) is acknowledged for providing and collecting the field and laboratory data for this investigation. Special thanks to Shahram Adibfard the exploration manager of IMPASCO. The Higher Institution Centre of Excellence (HICoE) Research Grant (Vote Number: 53209) awarded to the Institute of Oceanography and Environment (INOS), Universiti Malaysia Terengganu (UMT) is also acknowledged for providing required facilities for revising this manuscript.

Conflicts of Interest

The authors declare no conflict of interest.

References

  1. Ahmadirouhani, R.; Karimpour, M.H.; Rahimi, B.; Malekzadeh-Shafaroudi, A.; Pour, A.B.; Pradhan, B. Integration of SPOT-5 and ASTER satellite data for structural tracing and hydrothermal alteration mineral mapping: Implications for Cu–Au prospecting. Int. J. Image Data Fusion 2018, 9, 237–262. [Google Scholar] [CrossRef]
  2. Rajendran, S.; Sobhi, N. ASTER capability in mapping of mineral resources of arid region: A review on mapping of mineral resources of the Sultanate of Oman. Ore Geol. Rev. 2018, 88, 317–335. [Google Scholar] [CrossRef]
  3. Pour, A.B.; Park, Y.; Park, T.S.; Hong, J.K.; Hashim, M.; Woo, J.; Ayoobi, I. Regional geology mapping using satellite-based remote sensing approach in Northern Victoria Land, Antarctica. Polar Sci. 2018, 16, 23–46. [Google Scholar] [CrossRef]
  4. Pour, A.B.; Hashim, M.; Park, Y.; Hong, J.K. Mapping alteration mineral zones and lithological units in Antarctic regions using spectral bands of ASTER remote sensing data. Geocarto Int. 2018, 33, 1281–1306. [Google Scholar] [CrossRef]
  5. Pour, A.B.; Park, T.S.; Park, Y.; Hong, J.K.; Zoheir, B.; Pradhan, B.; Ayoobi, I.; Hashim, M. Application of multi-sensor satellite data for exploration of Zn-Pb sulfide mineralization in the Franklinian Basin, North Greenland. Remote Sens. 2018, 10, 1186. [Google Scholar] [CrossRef] [Green Version]
  6. Hu, B.; Xu, Y.; Wan, B.; Wu, X.; Yi, G. Hydrothermally altered mineral mapping using synthetic application of Sentinel-2A MSI, ASTER and Hyperion data in the Duolong area, Tibetan Plateau, China. Ore Geol. Rev. 2018, 101, 384–397. [Google Scholar] [CrossRef]
  7. Abubakar, A.J.A.; Hashim, M.; Pour, A.B. Remote sensing satellite imagery for prospecting geothermal systems in an aseismic geologic setting: Yankari Park, Nigeria. Int. J. Appl. Earth Obs. Geoinf. 2019, 80, 157–172. [Google Scholar] [CrossRef]
  8. Sheikhrahimi, A.; Pour, A.B.; Pradhan, B.; Zoheir, B. Mapping hydrothermal alteration zones and lineaments associated with orogenic gold mineralization using ASTER data: A case study from the Sanandaj-Sirjan Zone, Iran. Adv. Space Res. 2019, 63, 3315–3332. [Google Scholar] [CrossRef]
  9. Feng, Y.; Xiao, B.; Li, R.; Deng, C.; Han, J.; Wu, C.; Lai, C. Alteration mapping with short wavelength infrared (SWIR) spectroscopy on Xiaokelehe porphyry Cu-Mo deposit in the Great Xing’an Range, NE China: Metallogenic and exploration implications. Ore Geol. Rev. 2019, 112, 103062. [Google Scholar] [CrossRef]
  10. Xu, Y.; Meng, P.; Chen, J. Study on clues for gold prospecting in the Maizijing-Shulonggou area, Ningxia Hui autonomous region, China, using ALI, ASTER and WorldView-2 imagery. J. Vis. Commun. Image Represent. 2019, 60, 192–205. [Google Scholar] [CrossRef]
  11. Hosseini, S.; Lashkaripour, G.R.; Moghadas, N.H.; Ghafoori, M.; Pour, A.B. Lineament mapping and fractal analysis using SPOT-ASTER satellite imagery for evaluating the severity of slope weathering process. Adv. Space Res. 2019, 63, 871–885. [Google Scholar] [CrossRef]
  12. Pour, A.B.; Hashim, M.; Hong, J.K.; Park, Y. Lithological and alteration mineral mapping in poorly exposed lithologies using Landsat-8 and ASTER satellite data: North-eastern Graham Land, Antarctic Peninsula. Ore Geol. Rev. 2019, 108, 112–133. [Google Scholar] [CrossRef]
  13. Pour, A.B.; Park, Y.; Crispini, L.; Läufer, A.; Kuk Hong, J.; Park, T.-Y.S.; Zoheir, B.; Pradhan, B.; Muslim, A.M.; Hossain, M.S.; et al. Mapping Listvenite Occurrences in the Damage Zones of Northern Victoria Land, Antarctica Using ASTER Satellite Remote Sensing Data. Remote Sens. 2019, 11, 1408. [Google Scholar] [CrossRef] [Green Version]
  14. Pour, A.B.; Park, T.-Y.; Park, Y.; Hong, J.K.; Muslim, A.M.; Läufer, A.; Crispini, L.; Pradhan, B.; Zoheir, B.; Rahmani, O.; et al. Landsat-8, Advanced Spaceborne Thermal Emission and Reflection Radiometer, and WorldView-3 Multispectral Satellite Imagery for Prospecting Copper-Gold Mineralization in the Northeastern Inglefield Mobile Belt (IMB), Northwest Greenland. Remote Sens. 2019, 11, 2430. [Google Scholar] [CrossRef] [Green Version]
  15. Bolouki, S.M.; Ramazi, H.R.; Maghsoudi, A.; Beiranvand Pour, A.; Sohrabi, G. A Remote Sensing-Based Application of Bayesian Networks for Epithermal Gold Potential Mapping in Ahar-Arasbaran Area, NW Iran. Remote Sens. 2020, 12, 105. [Google Scholar] [CrossRef] [Green Version]
  16. Molan, Y.E.; Behnia, P. Prospectivity mapping of Pb–Zn SEDEX mineralization using remote-sensing data in the Behabad area, Central Iran. Int. J. Remote Sens. 2013, 34, 1164–1179. [Google Scholar] [CrossRef]
  17. Niyeh, M.M.; Jafarirad, A.; Karami, J.; Bokani, S.J. Copper, Zinc, and Lead Mineral Prospectivity Mapping in the North of Tafresh, Markazi Province, Central Iran, Using the AHP-OWA Method. Open J. Geol. 2017, 7, 533. [Google Scholar] [CrossRef] [Green Version]
  18. Govil, H.; Gill, N.; Rajendran, S.; Santosh, M.; Kumar, S. Identification of new base metal mineralization in Kumaon Himalaya, India, using hyperspectral remote sensing and hydrothermal alteration. Ore Geol. Rev. 2018, 92, 271–283. [Google Scholar] [CrossRef]
  19. Yang, M.; Ren, G.; Han, L.; Yi, H.; Gao, T. Detection of Pb–Zn mineralization zones in west Kunlun using Landsat 8 and ASTER remote sensing data. J. Appl. Remote Sens. 2018, 12, 026018. [Google Scholar] [CrossRef]
  20. World Bank Commodities Price Forecast (Nominal US Dollars). 2019. Available online: https://openknowledge.worldbank.org/bitstream/handle/10986/31549/CMO-April-19.pdf (accessed on 24 August 2019).
  21. Bhavan, I.; Lines, C. Indian Minerals Yearbook 2018 (Part-II: Metals and Alloys), 57th ed.; Lead & Zinc: Lisbon, Portugal, 2019; pp. 1–30. [Google Scholar]
  22. Leach, D.L.; Bradley, D.C.; Huston, D.; Pisarevsky, S.A.; Taylor, R.D.; Gardoll, S.J. Sediment-hosted lead-zinc deposits in Earth history. Econ. Geol. 2010, 105, 593–625. [Google Scholar] [CrossRef]
  23. Leach, D.L.; Taylor, R.D.; Fey, D.L.; Diehl, S.F.; Saltus, R.W. A deposit model for Mississippi Valley-Type lead-zinc ores. In Mineral Deposit Models for Resource Assessment; USGS Scientific Investigations Report 5070-A; U.S. Geological Survey: Reston, VA, USA, 2010; Chapter A; p. 52. [Google Scholar]
  24. Taylor, R.D.; Leach, D.L.; Bradley, D.C.; Pisarevsky, S.A. Compilation of Mineral Resource Data for Mississippi Valley-Type and Clastic-Dominated Sediment-Hosted Lead-Zinc Deposits; USGS Open-File Report; U.S. Geological Survey: Reston, VA, USA, 2009; p. 42.
  25. Parvaz, D.B. Oxidation Zones of Volcanogenic Massive Sulphide Deposits in the Troodos Ophiolite, Cyprus: Targeting Secondary Copper Deposits. Ph.D. Thesis, University of Exeter, Exeter, UK, 2014. [Google Scholar]
  26. Rajabi, A.; Rastad, E.; Canet, C. Metallogeny of Cretaceous carbonate-hosted Zn–Pb deposits of Iran: Geotectonic setting and data integration for future mineral exploration. Int. Geol. Rev. 2012, 54, 1649–1672. [Google Scholar] [CrossRef]
  27. Haghipour, A.; Pelissier, G. Geology of the Saghand Sector. In Explanatory Text of the Ardekan Quadrangle Map; Haghipour, A., Valeh, N., Pelissier, G., Davoudzadeh, M., Eds.; Geological Survey of Iran: Tehran, Iran, 1977; pp. 10–68. [Google Scholar]
  28. Masoodi, M.; Yassaghi, A.; Nogole Sadat, M.A.A.; Neubauer, F.; Bernroider, M.; Friedl, G.; Houshmandzadeh, A. Cimmerian evolution of the Central Iranian basement: Evidence from metamorphic units of the Kashmar–Kerman Tectonic Zone. Tectonophysics 2013, 588, 189–208. [Google Scholar] [CrossRef]
  29. Ghanbari, Y.; Hezarkhani, A.; Ataei, M.; Pazand, K. Mineral potential mapping with fuzzy models in the Kerman–Kashmar Tectonic Zone, Central Iran. Appl. Geomat. 2012, 4, 173–186. [Google Scholar] [CrossRef]
  30. Huckriede, R.; Kürsten, M.; Venzlaff, H. Zur geologie des gebietes zwischen Kerman und Sagand (Iran): Beihefte zum. Geol. Jahrb. 1962, 51, 1–97. [Google Scholar]
  31. Stöcklin, J. Structural history and tectonics of Iran: A review. Bull. Am. Assoc. Pet. Geol. 1968, 52, 1229–1258. [Google Scholar]
  32. Davoudzadeh, M.; Lensch, G.; Weber-Diefenbach, K. Contribution to the paleogeography, stratigraphy and tectonics of the Infracambrian and lower Paleozoic of Iran. Neues Jahrb. Geol. Paläontologie Abh. 1986, 172, 245–269. [Google Scholar]
  33. Ramezani, J.; Tucker, R.D. The Saghand region, central Iran: U-Pb geochronology, petrogenesis and implications for Gondwana tectonics. Am. J. Sci. 2003, 303, 622–665. [Google Scholar] [CrossRef]
  34. Aghanabati, A. Geology of Iran; Geological Survey of Iran: Tehran, Iran, 2004; p. 587.
  35. Berberian, M.; King, G.C.P. Towards a Paleogeography and tectonic evolution of Iran. Can. J. Earth Sci. 1981, 18, 210–265. [Google Scholar] [CrossRef]
  36. Haghipour, A. Geological Map of the Posht-e-Badam Area 1: 100 000; Geological Survey of Iran: Tehran, Iran, 1977.
  37. Haghipour, A.; Pelissier, G. Geology of the Posht-e-Badam-Saghand area (east central Iran). Iran Geol. Surv. Note 1968, 48, 144. [Google Scholar]
  38. Samani, B.A. Metallogeny of the Precambrian in Iran. Precambrian Res. 1988, 39, 85–106. [Google Scholar] [CrossRef]
  39. Husseini, M.I. Tectonic and deposition model of late Precambrian-Cambrian Arabian and adjoining plates. AAPG Bull. 1989, 73, 1117–1131. [Google Scholar]
  40. Foerster, H.; Jafarzadeh, A. The Bafq mining district in central Iran; a highly mineralized Infracambrian volcanic field. Econ. Geol. 1994, 89, 1697–1721. [Google Scholar] [CrossRef]
  41. Sennewald, S. Resurgent Cauldrons and Their mineralization between Narigan, Esfordi, Kushk, and Seh Chahoon, Central Iran. Int. J. Eng. 1988, 1, 149–161. [Google Scholar]
  42. Drusch, M.; Del Bello, U.; Carlier, S.; Colin, O.; Fernandez, V.; Gascon, F.; Meygret, A.; Spoto, F.; Sy, O.; Marchese, F.; et al. Sentinel-2: ESA’s optical high-resolution mission for GMES operational services. Remote Sens. Environ. 2012, 120, 25–36. [Google Scholar] [CrossRef]
  43. Irons, J.R.; Dwyer, J.L.; Barsi, J.A. The next Landsat satellite: The Landsat data continuity mission. Remote Sens. Environ. 2012, 122, 11–21. [Google Scholar] [CrossRef] [Green Version]
  44. Roy, D.P.; Wulder, M.A.; Loveland, T.A.; Woodcock, C.E.; Allen, R.G.; Anderson, M.C.; Scambos, T.A. Landsat-8: Science and product vision for terrestrial global change research. Remote Sens. Environ. 2014, 145, 154–172. [Google Scholar] [CrossRef] [Green Version]
  45. DigitalGlobe. WorldView-3 Datasheet. 2014. Available online: https://www.digitalglobe.com/sites/default/files/DG_WorldView3_DS_forWeb_0.pdf (accessed on 24 September 2019).
  46. Abrams, M.; Tsu, H.; Hulley, G.; Iwao, K.; Pieri, D.; Cudahy, T.; Kargel, J. The Advanced Spaceborne Thermal Emission and Reflection Radiometer (ASTER) after fifteen years: Review of global products. Int. J. Appl. Earth Obs. Geoinf. 2015, 38, 292–301. [Google Scholar] [CrossRef]
  47. Lima, T.A.; Beuchle, R.; Langner, A.; Grecchi, R.C.; Griess, V.C.; Achard, F. Comparing Sentinel-2 MSI and Landsat 8 OLI Imagery for Monitoring Selective Logging in the Brazilian Amazon. Remote Sens. 2019, 11, 961. [Google Scholar] [CrossRef] [Green Version]
  48. U.S. Geological Survey Earth Resources Observation and Science Center (EROS). Available online: https://earthexplorer.usgs.gov/ (accessed on 2 June 2019).
  49. Pieschke, R.L. US Geological Survey Distribution of European Space Agency’s Sentinel-2 Data; No. 2017-3026; US Geological Survey: Reston, VA, USA, 2017.
  50. USGS EROS Center. Available online: https://earthexplorer.usgs.gov/ (accessed on 28 March 2019).
  51. Kuester, M. Radiometric Use of WV-3 Imagery; Technical Note; DigitalGlobe: Westminster, CO, USA, 2016; p. 12. [Google Scholar]
  52. Kuester, M.A.; Ochoa, M.; Dayer, A.; Levin, J.; Aaron, D.; Helder, D.L.; Leigh, L.; Czapla-Meyers, J.; Anderson, N.; Bader, B.; et al. Absolute Radiometric Calibration of the DigitalGlobe Fleet and Updates on the New WV-3 Sensor Suite; Technical Note; DigitalGlobe: Westminster, CO, USA, 2015; p. 16. [Google Scholar]
  53. ENVI. Environment for Visualizing Images. Available online: http://www.exelisvis.com (accessed on 12 February 2019).
  54. Cooley, T.; Anderson, G.P.; Felde, G.W.; Hoke, M.L.; Ratkowski, A.J.; Chetwynd, J.H.; Gardner, J.A.; Adler-Golden, S.M.; Matthew, M.W.; Berk, A.; et al. FLAASH, a MODTRAN4-based atmospheric correction algorithm, its application and validation. In Proceedings of the IEEE International Geoscience and Remote Sensing Symposium, Toronto, ON, Canada, 24–28 June 2002; Volume 3, pp. 1414–1418. [Google Scholar]
  55. Research Systems, Inc. ENVI Tutorials; Research Systems, Inc.: Boulder, CO, USA, 2008. [Google Scholar]
  56. Rahaman, K.; Hassan, Q.; Ahmed, M. Pan-sharpening of Landsat-8 images and its application in calculating vegetation greenness and canopy water contents. ISPRS Int. J. Geo Inf. 2017, 6, 168. [Google Scholar] [CrossRef] [Green Version]
  57. Ben-Dor, E.; Kruse, F.A.; lefkoff, A.B.; Banin, A. Comparison of three calibration techniques for utilization of GER 63-channel aircraft scanner data of Makhtesh Ramon, Nega, Israel. Int. J. Rock Mech. Min. Sci. Geomech. Abstr. 1995, 32, 164A. [Google Scholar]
  58. Iwasaki, A.; Tonooka, H. Validation of a crosstalk correction algorithm for ASTER/SWIR. IEEE Trans. Geosci. Remote Sens. 2005, 43, 2747–2751. [Google Scholar] [CrossRef]
  59. Kalinowski, A.; Oliver, S. ASTER mineral index processing manual. Remote Sens. Appl. Geosci. Aust. 2004, 37, 36. [Google Scholar]
  60. Mars, J.C.; Rowan, L.C. Regional mapping of phyllic- and argillic-altered rocks in the Zagros magmatic arc, Iran, using Advanced Spaceborne Thermal Emission and Reflection Radiometer (ASTER) data and logical operator algorithms. Geosphere 2006, 7, 276–289. [Google Scholar] [CrossRef] [Green Version]
  61. Pour, B.A.; Hashim, M. Identification of hydrothermal alteration minerals for exploring of porphyry copper deposit using ASTER data, SE Iran. J. Asian Earth Sci. 2011, 42, 1309–1323. [Google Scholar] [CrossRef]
  62. Pour, B.A.; Hashim, M. The application of ASTER remote sensing data to porphyry copper and epithermal gold deposits. Ore Geol. Rev. 2012, 44, 1–9. [Google Scholar] [CrossRef] [Green Version]
  63. Eldosouky, A.M.; Sehsah, H.; Elkhateeb, S.O.; Pour, A.B. Integrating aeromagnetic data and Landsat-8 imagery for detection of post-accretionary shear zones controlling hydrothermal alterations: The Allaqi-Heiani Suture zone, South Eastern Desert, Egypt. Adv. Space Res. 2019. [Google Scholar] [CrossRef]
  64. Inzana, J.; Kusky, T.; Higgs, G.; Tucker, R. Supervised classifications of Landsat TM band ratio images and Landsat TM band ratio image with radar for geological interpretations of central Madagascar. J. Afr. Earth Sci. 2003, 37, 59–72. [Google Scholar] [CrossRef]
  65. Di Tommaso, I.; Rubinstein, N. Hydrothermal alteration mapping using ASTER data in the Infiernillo porphyry deposit, Argentina. Ore Geol. Rev. 2007, 32, 275–290. [Google Scholar] [CrossRef]
  66. Rockwell, B.W.; Hofstra, A.H. Identification of quartz and carbonate minerals across Northern Nevada using ASTER thermal infrared emissivity data, implications for geologic mapping and mineral resource investigations in well-studied and frontier areas. Geosphere 2008, 4, 218–246. [Google Scholar] [CrossRef] [Green Version]
  67. Mars, J.C.; Rowan, L.C. ASTER spectral analysis and lithologic mapping of the Khanneshin carbonate volcano, Afghanistan. Geosphere 2011, 7, 276–289. [Google Scholar] [CrossRef] [Green Version]
  68. Colby, J.D. Topographic normalization in rugged terrain. Photogramm. Eng. Remote Sens. 1991, 57, 531–537. [Google Scholar]
  69. Crowley, J.K.; Brickey, D.W.; Rowan, L.C. Airborne imaging spectrometer data of the Ruby Mountains, Montana: Mineral discrimination using relative absorption band-depth images. Remote Sens. Environ. 1989, 29, 121–134. [Google Scholar] [CrossRef]
  70. Ninomiya, Y.; Fu, B.; Cudahy, T.J. Detecting lithology with Advanced Spaceborne Thermal Emission and Reflection Radiometer (ASTER) multispectral thermal infrared radiance-at-sensor data. Remote Sens. Environ. 2005, 99, 127–139. [Google Scholar] [CrossRef]
  71. Ninomiya, Y.; Fu, B. Regional lithological mapping using ASTER-TIR data: Case study for the Tibetan Plateau and the surrounding area. Geosciences 2016, 6, 39. [Google Scholar] [CrossRef] [Green Version]
  72. Ninomiya, Y.; Fu, B. Thermal infrared multispectral remote sensing of lithology and mineralogy based on spectral properties of materials. Ore Geol. Rev. 2018. [Google Scholar] [CrossRef]
  73. Hunt, G.R. Spectral signatures of particulate minerals in the visible and near infrared. Geophysics 1977, 42, 501–513. [Google Scholar] [CrossRef] [Green Version]
  74. Clark, R.N. Spectroscopy of rock and minerals and principles of spectroscopy. In Remote Sensing for the Earth Sciences: Manual of Remote Sensing 3; Rencz, A.N., Ed.; John Wiley Sons: New York, NY, USA, 1999; pp. 3–58. [Google Scholar]
  75. Hunt, G.R.; Ashley, R.P. Spectra of altered rocks in the visible and near-infrared. Econ. Geol. 1979, 74, 1613–1629. [Google Scholar] [CrossRef]
  76. Mars, J.C.; Rowan, L.C. Spectral assessment of new ASTER SWIR surface reflectance data products for spectroscopic mapping of rocks and minerals. Remote Sens. Environ. 2010, 114, 2011–2025. [Google Scholar] [CrossRef]
  77. Rowan, L.C.; Mars, J.C. Lithologic mapping in the Mountain Pass area, California using Advanced Spaceborne Thermal Emission and Reflection Radiometer (ASTER) data. Remote Sens. Environ. 2003, 84, 350–366. [Google Scholar] [CrossRef]
  78. Kuosmanen, V.; Laitinen, J.; Arkimaa, H.; Kuosmanen, E. Hyperspectral Characterization of Selected Remote Detection Targets in the Mines of HYDO Partners; Archive Report, RS/2000/02; Geological Survey of Finland: Espoo, Finland, 2000.
  79. Sun, Y.; Tian, S.; Di, B. Extracting mineral alteration information using Worldview-3 data. Geosci. Front. 2017, 8, 1051–1062. [Google Scholar] [CrossRef]
  80. Mars, J.C. Mineral and Lithologic Mapping Capability of WorldView 3 Data at Mountain Pass, California, Using True-and False-Color Composite Images, Band Ratios, and Logical Operator Algorithms. Econ. Geol. 2018, 113, 1587–1601. [Google Scholar] [CrossRef] [Green Version]
  81. Bedini, E. Application of WorldView-3 imagery and ASTER TIR data to map alteration minerals associated with the Rodalquilar gold deposits, southeast Spain. Adv. Space Res. 2019, 63, 3346–3357. [Google Scholar] [CrossRef]
  82. Gaffey, S.J. Spectral reflectance of carbonate minerals in the visible and near-infrared (0.35–2.55 microns): Calcite, aragonite, and dolomite. Am. Mineral. 1986, 71, 151–162. [Google Scholar]
  83. Singh, A.; Harrison, A. Standardized principal components. Int. J. Remote Sens. 1985, 6, 883–896. [Google Scholar] [CrossRef]
  84. Crosta, A.P.; Souza Filho, C.R.; Azevedo, F.; Brodie, C. Targeting key alteration minerals in epithermal deposits in Patagonia, Argentina, Using ASTER imagery and principal component analysis. Int. J. Remote Sens. 2003, 24, 4233–4240. [Google Scholar] [CrossRef]
  85. Gupta, R.P.; Tiwari, R.K.; Saini, V.; Srivastava, N. A simplified approach for interpreting principal component images. Adv. Remote Sens. 2013, 2, 111–119. [Google Scholar] [CrossRef] [Green Version]
  86. Eklundh, L.; Singh, A. A comparative analysis of standardized and unstandardized principal component analysis in remote sensing. Int. J. Remote Sens. 1993, 14, 1359–1370. [Google Scholar] [CrossRef]
  87. Chang, Q.; Jing, L.; Panahi, A. Principal component analysis with optimum order sample correlation coefficient for image enhancement. Int. J. Remote Sens. 2006, 27, 3387–3401. [Google Scholar]
  88. Crosta, A.; Moore, J. Enhancement of Landsat Thematic Mapper imagery for residual soil mapping in SW Minais Gerais State, Brazil: A prospecting case history in Greenstone belt terrain. In Proceedings of the 7th ERIM Thematic Conference: Remote Sensing for Exploration Geology, Calgary, AB, Canada, 2–6 October 1989; pp. 1173–1187. [Google Scholar]
  89. Loughlin, W.P. Principal components analysis for alteration mapping. Photogramm. Eng. Remote Sens. 1991, 57, 1163–1169. [Google Scholar]
  90. Pour, B.A.; Hashim, M.; Marghany, M. Exploration of gold mineralization in a tropical region using Earth Observing-1 (EO1) and JERS-1 SAR data: A case study from Bau gold field, Sarawak, Malaysia. Arab. J. Geosci. 2014, 7, 2393–2406. [Google Scholar] [CrossRef]
  91. Noori, L.; Pour, B.A.; Askari, G.; Taghipour, N.; Pradhan, B.; Lee, C.-W.; Honarmand, M. Comparison of Different Algorithms to Map Hydrothermal Alteration Zones Using ASTER Remote Sensing Data for Polymetallic Vein-Type Ore Exploration: Toroud–Chahshirin Magmatic Belt (TCMB), North Iran. Remote Sens. 2019, 11, 495. [Google Scholar] [CrossRef] [Green Version]
  92. Zoheir, B.; El-Wahed, M.A.; Pour, A.B.; Abdelnasser, A. Orogenic Gold in Transpression and Transtension Zones: Field and Remote Sensing Studies of the Barramiya–Mueilha Sector, Egypt. Remote Sens. 2019, 11, 2122. [Google Scholar] [CrossRef] [Green Version]
  93. Zadeh, L.A. Fuzzy sets. Inf. Control 1965, 8, 338–353. [Google Scholar] [CrossRef] [Green Version]
  94. Novák, V.; Perfilieva, I.; Močkoř, J. Mathematical Principles of Fuzzy Logic; Kluwer Academic: Dordrecht, The Netherlands, 1999; ISBN 978-0-7923-8595-0. [Google Scholar]
  95. Nykänen, V.; Groves, D.I.; Ojala, V.J.; Eilu, P.; Gardoll, S.J. Reconnaissance-scale conceptual fuzzy-logic prospectivity modelling for iron oxide copper—Gold deposits in the northern Fennoscandian Shield, Finland. Aust. J. Earth Sci. 2008, 55, 25–38. [Google Scholar] [CrossRef]
  96. Carranza, E.J.M. Geochemical Anomaly and Mineral Prospectivity Mapping in GIS; Elsevier: Amsterdam, The Netherlands, 2008; Volume 11. [Google Scholar]
  97. Zhang, N.; Zhou, K.; Du, X. Application of fuzzy logic and fuzzy AHP to mineral prospectivity mapping of porphyry and hydrothermal vein copper deposits in the Dananhu-Tousuquan island arc, Xinjiang, NW China. J. Afr. Earth Sci. 2017, 128, 84–96. [Google Scholar] [CrossRef]
  98. Kim, Y.H.; Choe, K.U.; Ri, R.K. Application of fuzzy logic and geometric average: A Cu sulfide deposits potential mapping case study from Kapsan Basin, DPR Korea. Ore Geol. Rev. 2019, 107, 239–247. [Google Scholar] [CrossRef]
  99. Zimmermann, H.J.; Zysno, P. Latent connectives in human decision making. Fuzzy Sets Syst. 1980, 4, 37–51. [Google Scholar] [CrossRef]
  100. An, P.; Moon, W.M.; Rencz, A. Application of fuzzy set theory to integrated mineral exploration. Can. J. Explor. Geophys. 1991, 27, 1–11. [Google Scholar]
  101. Bonham-Carter, G.F. Geographic information systems for geoscientists-modeling with GIS. Comput. Methods Geosci. 1994, 13, 398. [Google Scholar]
  102. Carranza, E.J.M.; Hale, M. Geologically constrained fuzzy mapping of gold mineralization potential, Bauio District, Philippines. Nat. Resour. Res. 2001, 10, 125–136. [Google Scholar] [CrossRef]
  103. Bishop, J.L.; Lane, M.D.; Dyar, M.D.; Brwon, A.J. Reflectance and emission spectroscopy study of four groups of phyllosilicates: Smectites, kaolinite-serpentines, chlorites and micas. Clay Miner. 2008, 43, 35–54. [Google Scholar] [CrossRef]
  104. Cloutis, E.A.; Hawthorne, F.C.; Mertzman, S.A.; Krenn, K.; Craig, M.A.; Marcino, D.; Methot, M.; Strong, J.; Mustard, J.F.; Blaney, D.L.; et al. Detection and discrimination of sulfate minerals using reflectance spectroscopy. Icarus 2006, 184, 121–157. [Google Scholar] [CrossRef]
Figure 1. Geology map of the study area (modified from [36]).
Remotesensing 12 01239 g001
Figure 2. An overview of the methodological flowchart used in this study.
Remotesensing 12 01239 g002
Figure 3. The laboratory reflectance spectra of hematite, jarosite, goethite, muscovite, kaolinite, calcite, dolomite, gypsum and chlorite resampled to response functions of VINR+SWIR bands of Landsat-8, Sentinel-2, ASTER and WV-3. Cubes indicate the position of the VINR+SWIR bands of Landsat-8, Sentinel-2, ASTER and WV-3 in the range of 0.4 µm to 2.5 µm. The main absorption feature spectra attributed to Fe+2, Fe+3, OH, H2O, Fe-OH, S-O, Al-OH, Fe, Mg-OH, and CO3 are delimited by dashed rectangles.
Remotesensing 12 01239 g003
Figure 4. Regional view of lithological units and alteration zones in the study region. RGB false color composite of bands 2, 8 and 12 for Sentinel-2. Yellow polygon demarcates WV-3 imagery.
Remotesensing 12 01239 g004
Figure 5. Regional view of lithological units and alteration zones in the study region. RGB false color composite of bands 6, 2 and 8 for ASTER. Yellow polygon demarcates WV-3 imagery.
Remotesensing 12 01239 g005
Figure 6. Band ratio image-maps showing spatial distribution of iron oxide/hydroxides and clay and carbonate minerals. (A) The 4/2 band ratio image-map of Landsat-8 showing iron oxide/hydroxides minerals as red pixels; (B) the 4/2 band ratio image-map of Sentinel-2 showing iron oxide/hydroxides minerals as red pixels; (C) the 6/7 band ratio image-map of Landsat-8 showing clay minerals and carbonates as green pixels; (D) the 11/12 band ratio image-map of Sentinel-2 showing hydroxyl-bearing minerals as green pixels. Yellow polygon demarcates WV-3 imagery.
Remotesensing 12 01239 g006
Figure 7. Band ratio image-maps showing spatial distribution of iron oxide/hydroxides Al/Fe-OH and Mg-Fe-OH/CO3 minerals and dolomite. (A) The 4/2 band ratio image-map of ASTER showing iron oxide/hydroxides minerals as red pixels; (B) the RBD1 image-map of ASTER showing Al/Fe-OH minerals as mustard pixels; (C) the RBD2 image-map of ASTER showing Mg-Fe-OH/CO3 minerals as green pixels; (D) the RBD3 image-map of ASTER showing dolomite as yellow pixels. Yellow polygon delineates WV-3 imagery.
Remotesensing 12 01239 g007
Figure 8. PC image-maps showing spatial distribution of iron oxide/hydroxides minerals and clay minerals and carbonates. (A) The PC4 image-map of Landsat-8 showing OH-bearing minerals and carbonates as green pixels; (B) the PC5 image-map of Landsat-8 showing iron oxide/hydroxides minerals as red pixels; (C) the PC4 image-map of Sentinel-2 showing OH-bearing minerals as green pixels; (D) the PC5 image-map of Sentinel-2 showing iron oxide/hydroxides minerals as red pixels. Yellow polygon demarcates WV-3 imagery.
Remotesensing 12 01239 g008
Figure 9. The PC image-maps of ASTER. (A) The PCA3 image-map showing Mg-Fe-OH/CO3 minerals as green pixels; (B) the PC4 image-map showing iron oxide/hydroxides minerals as red pixels; (C) the PC5 image-map showing OH/S-O/CO3-bearing minerals as mustard pixels; (D) the PC8 image-map showing dolomite as yellow pixels. Yellow polygon delineates WV-3 imagery.
Remotesensing 12 01239 g009
Figure 10. WV-3 scene covering the selected subset of the study area containing Zn–Pb mineralization. (A) The band ratio image-map of 5/3 for mapping Fe3+oxides; (B) the band ratio image-map of 5/2 for identifying all iron oxides (iron-stained alteration); (C) the band ratio image-map of 7/4 for detecting dolomite/Fe2+; (D) RGB false color composite image-map of 7/4, 5/3 and 5/2 for discriminating lithological units.
Remotesensing 12 01239 g010
Figure 11. WV-3 scene covering the selected subset of the study area containing Zn–Pb mineralization. (A) The PC3 image-map showing iron-stained alteration as bright pixels; (B) the PC4 image-map showing dolomite/Fe2+ as bright pixels; (C) the PC6 image-map showing Fe3+oxides as bright pixels; (D) RGB false color composite image-map of the PC4, PC6 and PC3 discriminates lithological units.
Remotesensing 12 01239 g011
Figure 12. Mineral prospectivity map of the study area at regional scale derived from Landsat-8, Sentinal-2 and ASTER selected alteration thematic layers. Magenta polygon delineates WV-3 imagery.
Remotesensing 12 01239 g012
Figure 13. Mineral prospectivity map of the study area at local scale derived from WV-3 selected alteration thematic layers.
Remotesensing 12 01239 g013
Figure 14. Field photographs of the alteration zones associated with Pb-Zn mineralization in the study area. (A) View old open-pit quarry located in the PEr and E1 lithological units; (B) view of old open-pit quarry located in the PEr, PEED and E1 lithological units; (C) view of ore mineralization associated with fault contact in the PEr unit; (D) view of the hematite mineralization filling fault contact in the C1d unit; (E) view of surface occurrence of malachite and zinc oxide/hydroxides in the PEr unit; (F) view of galena mineralization in the dolomitic background in the C1d unit.
Remotesensing 12 01239 g014aRemotesensing 12 01239 g014b
Figure 15. ASD spectroscopy results (0.35 to 2.5 µm spectral range) for rock samples collected from shale, gypsum, dolomite and calcite lithological units in the study area.
Remotesensing 12 01239 g015
Table 1. Technical performance and attributes of the Landsat-8, Sentinel-2, ASTER, and WV-3 sensors [42,43,44,45,46,47].
SensorSubsystemBand NumberSpectral Range
(µm)
Ground
Resolution (m)
Swath
Width (km)
Year of Launch
Landsat-8VNIRPAN (8)0.500–0.680151852013
Coastal aerosol (1)0.433–0.45330
Blue (2)0.450–0.515
Green (3)0.525–0.600
Red (4)0.630–0.680
NIR (5)0.845–0.885
SWIRSWIR1 (6)1.560–1.660
SWIR2 (7)2.100–2.300
Cirrus (9)1.360–1.390
TIRTIRS1 (10)10.60–11.19100
TIRS2 (11)11.50–12.51
Sentinel-2VNIRCoastal aerosol (1)0.433–0.45360290
Blue (2)0.458–0.52310
Green (3)0.543–0.578
Red (4)0.650–0.680
Vegetation Red Edge (5)0.698–0.71320
Vegetation Red Edge (6)0.733–0.7482015–2017
Vegetation Red Edge (7)0.773–0.793
NIR (8)0.785–0.90010
Water-vapour (9)0.935–0.95560
SWIRSWIR–Cirrus (10)1.360–1.390
SWIR1 (11)1.565–1.65520
SWIR2 (12)2.100–2.280
ASTERVNIR10.52–0.6015601999
20.63–0.69
3N0.76–0.86
3B0.76–0.86
SWIR41.600–1.70030
52.145–2.185
62.185–2.225
72.235–2.285
82.295–2.365
92.360–2.430
TIR108.125–8.47590
118.475–8.825
128.925–9.275
1310.25–10.95
1410.95–11.65
WV3VNIRCoastal blue (1)0.400–0.4501.2413.12014
Blue (2)0.450–0.510
Green (3)0.510–0.580
Yellow (4)0.585–0.625
Red (5)0.630–0.690
Red-edge (6)0.705–0.745
NIR1 (7)0.770–0.895
NIR2 (8)0.860–1.040
SWIRSWIR-1 (9)1.195–1.2253.70
SWIR-1 (10)1.550–1.590
SWIR-1 (11)1.640–1.680
SWIR-1 (12)1.710–1.750
SWIR-1 (13)2.145–2.185
SWIR-1 (14)2.185–2.225
SWIR-1 (15)2.235–2.285
SWIR-1 (16)2.295–2.365
Table 2. Eigenvector matrix derived from PCA for the selected bands of Landsat-8 bands (1 to 7) used in this study.
EigenvectorBand 1Band 2Band 3Band 4Band 5Band 6Band 7
PC 10.0988880.1275880.2226420.3521340.4706220.5801540.49225
PC 20.3222230.3724440.4330080.4266270.230446−0.374857−0.440827
PC 3−0.312408−0.354582−0.2799990.0846370.599510.168321−0.550787
PC 40.2477240.2693610.117557−0.327086−0.2470480.667216−0.48894
PC 50.3807730.318038−0.297366−0.5795040.516661−0.2072540.140427
PC 6−0.42878−0.076070.726821−0.4868220.193733−0.0799130.034331
PC 70.631338−0.7347030.232424−0.0837940.022232−0.0073360.00581
Table 3. Eigenvector matrix derived from PCA for the selected bands of Sentinel-2 bands (2, 3, 4, 8, 11, 12) used in this study.
EigenvectorBand 2Band 3Band 4Band 8Band 11Band 12
PC 1−0.15188−0.235458−0.383398−0.466736−0.570938−0.480298
PC 20.3558220.4052780.4388720.333419−0.451093−0.44931
PC 3−0.486574−0.4097130.0648940.5578000.208124−0.486532
PC 4−0.310768−0.2460020.2035410.259173−0.6419490.567634
PC 5−0.4548290.1008820.698634−0.5236270.113057−0.088865
PC 6−0.5568870.736037−0.3559040.135992−0.0484610.024823
Table 4. Eigenvector matrix derived from PCA for the selected bands of ASTER bands (VNIR+SWIR) used in this study.
EigenvectorBand 1Band 2Band 3Band 4Band 5Band 6Band 7Band 8Band 9
PC 1−0.9964990.082351−0.0084420.0089050.0007800.0058200.004598−0.000774−0.000742
PC 20.0750830.9542420.247544−0.134085−0.022691−0.054521−0.0305630.009170−0.004727
PC 3−0.020004−0.185786−0.0222260.564435−0.157899−0.0548980.020914−0.896111−0.019443
PC 40.0001390.8127760.124735−0.429509−0.228138−0.0251620.314993−0.251698−0.002611
PC 5−0.021063−0.1574280.221774−0.6688380.0953600.425904−0.0148380.1742770.507113
PC 60.0130320.083318−0.0136200.3191480.3885300.0092490.277101−0.329300−0.069032
PC 7−0.006760−0.037927−0.034844−0.164716−0.322506−0.352677−0.157608−0.0424990.084469
PC 8−0.016975−0.1193260.2564100.4044330.5584070.158777−0.623420−0.103705−0.140444
PC 90.0020320.009398−0.0612130.025598−0.153333−0.0479900.033235−0.028976−0.983741
Table 5. Eigenvector matrix derived from PCA for the selected bands of WV3 band (1 to 8 VNIR) used in this study.
EigenvectorBand 1Band 2Band 3Band 4Band 5Band 6Band 7Band 8
PC 1−0.314986−0.330951−0.348156−0.359256−0.364601−0.367182−0.369097−0.370119
PC 20.6559260.4545100.183457−0.046042−0.154854−0.251952−0.320189−0.370709
PC 3−0.331273−0.5985060.354295−0.1296460.661001−0.2207960.3414200.108973
PC 4−0.2449610.3453770.1455610.6316590.0122670.368220−0.509311−0.142316
PC 5−0.3846330.2791510.433976−0.0928080.081588−0.370014−0.1425440.187618
PC 60.236442−0.427799−0.515988−0.0656700.6463120.2487150.0432570.095274
PC 70.257771−0.301701−0.070317−0.3890550.4716940.225588−0.4276910.035215
PC 80.174655−0.5609470.307690−0.163685−0.3327550.1088190.068151−0.001993
Table 6. Fuzzification parameters for the input layers used in this analysis.
Data OriginInput LayerDetectionMembership TypeFuzzy Operator
Landsat-8 DatasetPC4OH-minerals and CarbonatesLinearGamma (γ = 0.7)
PC5Iron Oxide
Sentinel-2 DatasetPC4OH-minerals and Carbonates
PC5Iron Oxide
ASTER DatasetPC4Iron oxide/hydroxides mineralsLinearGamma (γ = 0.7)
PC5OH/S-O/CO3-bearing minerals
PC8Dolomite
WV-3 DatasetPC3Iron-stained alterationLinearGamma (γ = 0.7)
PC4Dolomite/Fe2+ oxides
PC6Fe3+ oxides
Table 7. Confusion matrix for alteration mapping derived from remote sensing datasets versus field GPS survey. (A) Landsat-8 data; (B) Sentinel-2 data; (C) ASTER data; (D) WV-3 data.
(A) Alteration Map Landsat-8GPS Survey
Iron Oxide/HydroxidesOH-Bearing and Carbonate MineralsTotalsUser’s Accuracy
Iron oxide/hydroxides42667%
OH-bearing and carbonate minerals2222491%
Totals62430
Producer’s accuracy67%91%
Overall accuracy = 86.66%Kappa Coefficient = 0.83
(B) Alteration Map Sentinel-2GPS Survey
Iron Oxide/HydroxidesOH-Bearing MineralsTotalsUser’s
Accuracy
Iron oxide/hydroxides52 771%
OH-bearing minerals110 1190%
Totals612 18
Producer’s accuracy83%83%
Overall accuracy = 83.33%Kappa Coefficient = 0.81
(C) Alteration Map ASTERGPS Survey
Iron Oxide/
Hydroxides
Argillic Alteration+ ShaleGypsumCalciteDolomiteTotalsUser’s Accuracy
Iron oxide/hydroxides40001580%
Argillic alteration + Shale04210757%
Gypsum024006 67%
Calcite00051683%
Dolomite20004667%
Totals6666630
Producer’s accuracy67%67%67%83%67%
Overall accuracy = 70%Kappa Coefficient = 0.68
(D) Alteration Map WV-3GPS Survey
Iron Oxide/HydroxidesDolomiteTotalsUser’s Accuracy
Iron oxide/hydroxides51683%
Dolomite15683%
Totals66 12
Producer’s accuracy83%83%
Overall accuracy = 83.33%Kappa Coefficient = 0.82

