Article

Influence of Mg Doping Levels on the Sensing Properties of SnO2 Films

1
Electronic Materials Study for Medical Applications (LEMEAMED) Laboratory, Electronic Department, Science and Technology Faculty, Frères Mentouri University, 25000 Constantine, Algeria
2
Instituto de Microelectrónica de Barcelona (IMB-CNM, CSIC), Campus UAB, 08193 Bellaterra, Spain
3
CEITEC-Central European Institute of Technology, Brno University of Technology, 61200 Brno, Czech Republic
*
Authors to whom correspondence should be addressed.
Sensors 2020, 20(7), 2158; https://doi.org/10.3390/s20072158
Submission received: 11 March 2020 / Revised: 3 April 2020 / Accepted: 9 April 2020 / Published: 10 April 2020
(This article belongs to the Special Issue Application of Thin Film Materials in Sensors)

Abstract

:
This work presents the effect of magnesium (Mg) doping on the sensing properties of tin dioxide (SnO2) thin films. Mg-doped SnO2 films were prepared via a spray pyrolysis method using three doping concentrations (0.8 at.%, 1.2 at.%, and 1.6 at.%) and the sensing responses were obtained at a comparatively low operating temperature (160 °C) compared to other gas sensitive materials in the literature. The morphological, structural and chemical composition analysis of the doped films show local lattice disorders and a proportional decrease in the average crystallite size as the Mg-doping level increases. These results also indicate an excess of Mg (in the samples prepared with 1.6 at.% of magnesium) which causes the formation of a secondary magnesium oxide phase. The films are tested towards three volatile organic compounds (VOCs), including ethanol, acetone, and toluene. The gas sensing tests show an enhancement of the sensing properties to these vapors as the Mg-doping level rises. This improvement is particularly observed for ethanol and, thus, the gas sensing analysis is focused on this analyte. Results to 80 ppm of ethanol, for instance, show that the response of the 1.6 at.% Mg-doped SnO2 film is four times higher and 90 s faster than that of the 0.8 at.% Mg-doped SnO2 film. This enhancement is attributed to the Mg-incorporation into the SnO2 cell and to the formation of MgO within the film. These two factors maximize the electrical resistance change in the gas adsorption stage, and thus, raise ethanol sensitivity.

1. Introduction

The monitoring of volatile organic compounds (VOCs), including ethanol (C2H6O), acetone (C3H6O), and toluene (C7H8), is routinely needed for evaluating environmental quality and industrial safety [1]. Recently, the monitoring of VOCs has also gained importance in clinical applications as a promising tool to identify pathological conditions at early stages (via breath analysis of anomalous concentrations of certain VOCs) [2]. In this context, metal oxides (MOXs)-based gas sensors (chemoresistive sensors) are attractive devices that can be miniaturized and integrated as array systems into compact VOC monitoring equipment at reduced fabrication costs as compared to other technologies (e.g., spectrometers) [1,2]. Previously, MOXs such as ZnO, SnO2, WO3, and TiO2 at the nanoscale have proved promising properties to sense VOCs due to their high surface-to-volume ratio, which provides better sensitivity and stability compared to bulk MOXs [3,4,5,6,7]. Currently, however, these materials require yet the enhancement of sensitivity to low concentrations of VOCs and, generally, the improvement of selectivity and the minimization of drift effect over time. Thus, various efforts have been focused on this line, pointing out the importance of enhancing both chemical and electronic sensitization by incorporating intentional impurities (e.g., doping) or modifying the surface of traditional gas-sensitive MOXs [6,8].
Tin dioxide (SnO2) is considered as one of the leading n-type MOXs used in commercial chemoresistive gas sensors, however, the enhancement of its sensing performance remains active to date [9,10]. As mentioned above for other MOXs, a large series of reports has also emphasized the remarkable improvement of SnO2 sensing characteristics, whether by adding catalysts, introducing functional activators, or doping with impurities [5,10,11]. The latter has proved to be an efficient way to create more oxygen vacancies and to amplify the electrochemical reaction of analytes on the layer’s surface [7,12].
In the literature, there are several examples of noble metals (Pd, Pt), rare earth metals (Ce, Pr), and metals (Zn, Al) improving the sensitivity and selectivity of various MOXs including SnO2 [10,12,13,14,15,16]. Among these materials, magnesium (Mg) is attractive, as it has proved to improve sensitivity to ethanol, H2, CO, and ammonia when incorporated into ZnO to form Mg-doped ZnO [17,18,19,20,21]. Similarly, Mg-doped TiO2 and Mg-doped In2O3 have shown to improve sensitivity to CO and ethanol, respectively [3,22]. Mg is also considered a promising candidate to enhance SnO2 sensing properties, particularly as it presents a close ionic radius (0.67 nm) to that of Sn (0.71 nm), which facilitates Mg2+ diffusion into the SnO2 cell to substitute Sn4+ [23]. Despite this, the use of Mg-doped SnO2 in gas sensing, particularly VOC sensing, is not that common in the state-of-the-art.
In the midst of various techniques used to synthesize doped MOX films, spray pyrolysis proved to be simple, cost effective and allowed a wide variety of substrate coatings [24]. Despite the fact that controlling the size and rate of sprayed droplets remains a challenging factor for films’ quality, spray pyrolysis is considered a useful method for the design and development of chemoresistive gas sensors [24,25].
Previously, we proved the spray pyrolysis deposition of SnO2 films and their potential to detect vapors such as ethanol, methanol and acetone [26]. Herein, we go further into this line and investigate the influence of Mg doping levels on the VOC sensing properties of SnO2 thin films synthesized via the spray pyrolysis process. This work explores the structural, morphological, and chemical composition properties of the films and their gas sensing properties towards ethanol, acetone and toluene.

2. Materials and Methods

2.1. Thin Film Synthesis and Processing

Magnesium-doped tin dioxide thin films with three doping concentrations (0.8, 1.2, and 1.6 at.%) were synthesized by spray pyrolysis method on cleaned amorphous glass substrate (70 × 30 × 1 mm) at 400 °C. To obtain a 0.8 at.% Mg-doped SnO2 film, a mixture of 1088 mg of tin (II) chloride dihydrate (SnCl2·2H2O, Sigma-Aldrich, 98%), 40 mg of magnesium chloride hexahydrate (MgCl2-6H2O, Sigma-Aldrich, 99%), and 100 mL of ethanol (Sigma-Aldrich, 96%) was stirred under heat for 30 min. Afterwards, this solution was sprayed by a nozzle to the heated substrate using airflow (0.5 mL/min) for 30 min. The same process was used to prepare all films, varying the weight ratio of the precursors according to the doping concentrations. The as-prepared Mg-doped SnO2 thin films were subsequently annealed at 450 °C in dry air for 60 min in order to ensure the stability of the materials during the gas sensing test. The influence of the annealing temperatures on the SnO2 thin films’ properties was reported in our previous work [27]. Finally, the coated samples were cut into parts (10 × 15 × 1 mm) to be used for characterization and gas tests.

2.2. Characterization Methods

Structural characterization was performed using an X-ray Diffractometer (XRD—Bruker-AXS, LinxEye XE-T detector, KFL Cu 2K (λ (CuKα) = 1.541840 Å) operated at 40 KV and 40 mA) in the 2θ angle from 20° to 80°. XPowder software was employed to refine (peak position, lattice parameters, and crystallites size) the data. The surface morphology was examined by Scanning Electron Microscopy (SEM- Carl Zeiss, Auriga Series) equipped with an EDX spectrometer (Energy Dispersive X-ray Spectroscopy) for elemental composition analysis. The surface properties of the films were analyzed using X-ray Photoelectron Spectroscopy (XPS—Kratos Axis Supra with monochromatic Al Kα X-ray radiation, emission current of 15 mA and hybrid lens mode, Manchester, UK) varying the binding energy (BE) range between 0−1350 eV and using CasaXPS for peaks fitting.

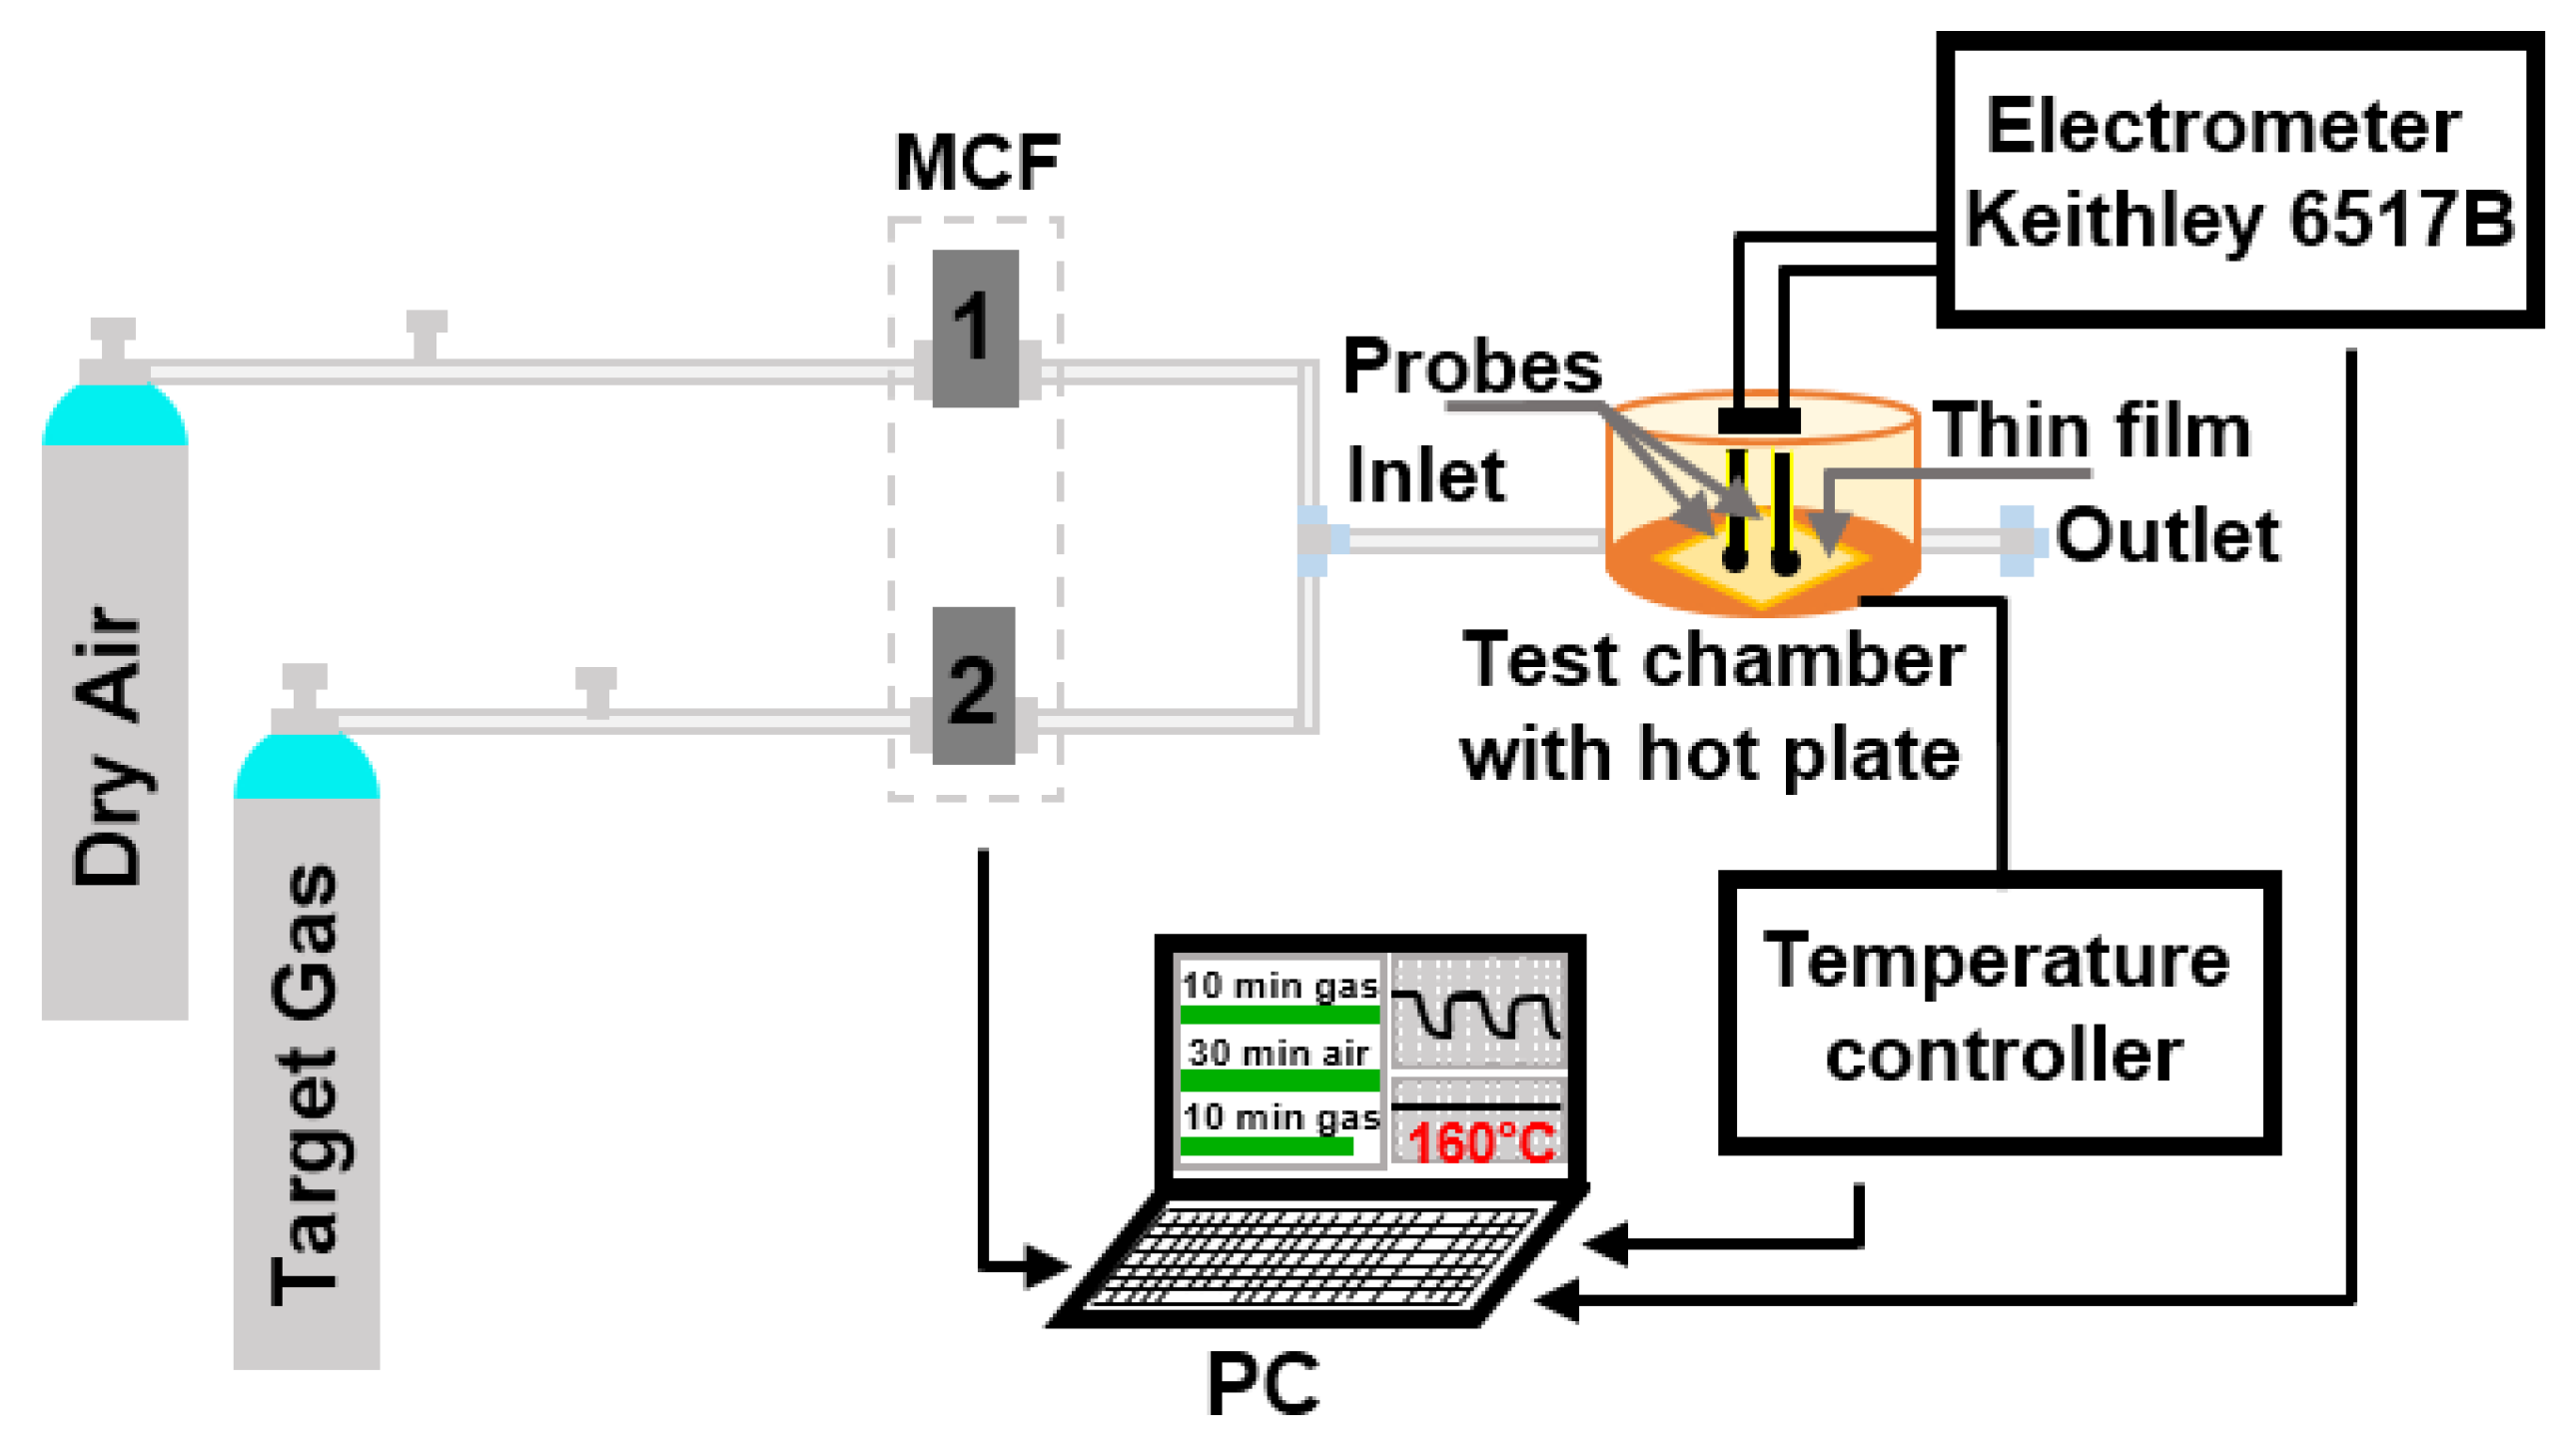
2.3. Gas Sensing Measurements

To evaluate the gas sensing properties of Mg-doped SnO2 thin films towards various gaseous analytes (ethanol, acetone, and toluene), we used the system represented in Figure 1 and reported previously [28]. Briefly, the system consists of a continuous gas supply (dry synthetic air and different calibrated gas analytes) controlled by mass flow controllers (MFC), a test chamber equipped with two probes as the electrical signal collectors, a heating plate with a temperature controller, and a data acquisition system (electronic measurement system, electrometer, and PC). The films were exposed to each analyte for 10 min, and after that, the chamber was purged with synthetic air for 30 min to recover the initial base line resistance. Gas test measurements were recorded fixing the operating temperature (Top) to 160 °C and varying the analyte concentration from 10 to 80 ppm. The gas response is defined as Ra/Rg (reducing gases), where Ra and Rg are the resistances of the film in dry air and after exposure to analyte, respectively, while sensitivity (S), is the report between response and gas concentration (∆R/∆C) [7]. The response and recovery times are defined as the time required for the sensor to reach 90% of the response upon exposure to the target gas, and the time required for a sensor to return to 90% of the original baseline signal upon removal of the target gas, respectively. All samples were alternatively tested towards the target analytes in dry air accumulating a total operating period of 120 h distributed over 30 days. Among these hours, on average, each sample operated for about 20 h. Hereafter, the tested films are labeled as MTO1 (0.8 at.% magnesium-doped tin dioxide), MTO2 (1.2 at.% magnesium-doped tin dioxide), and MTO3 (1.6 at.% magnesium-doped tin dioxide).

3. Results and Discussion

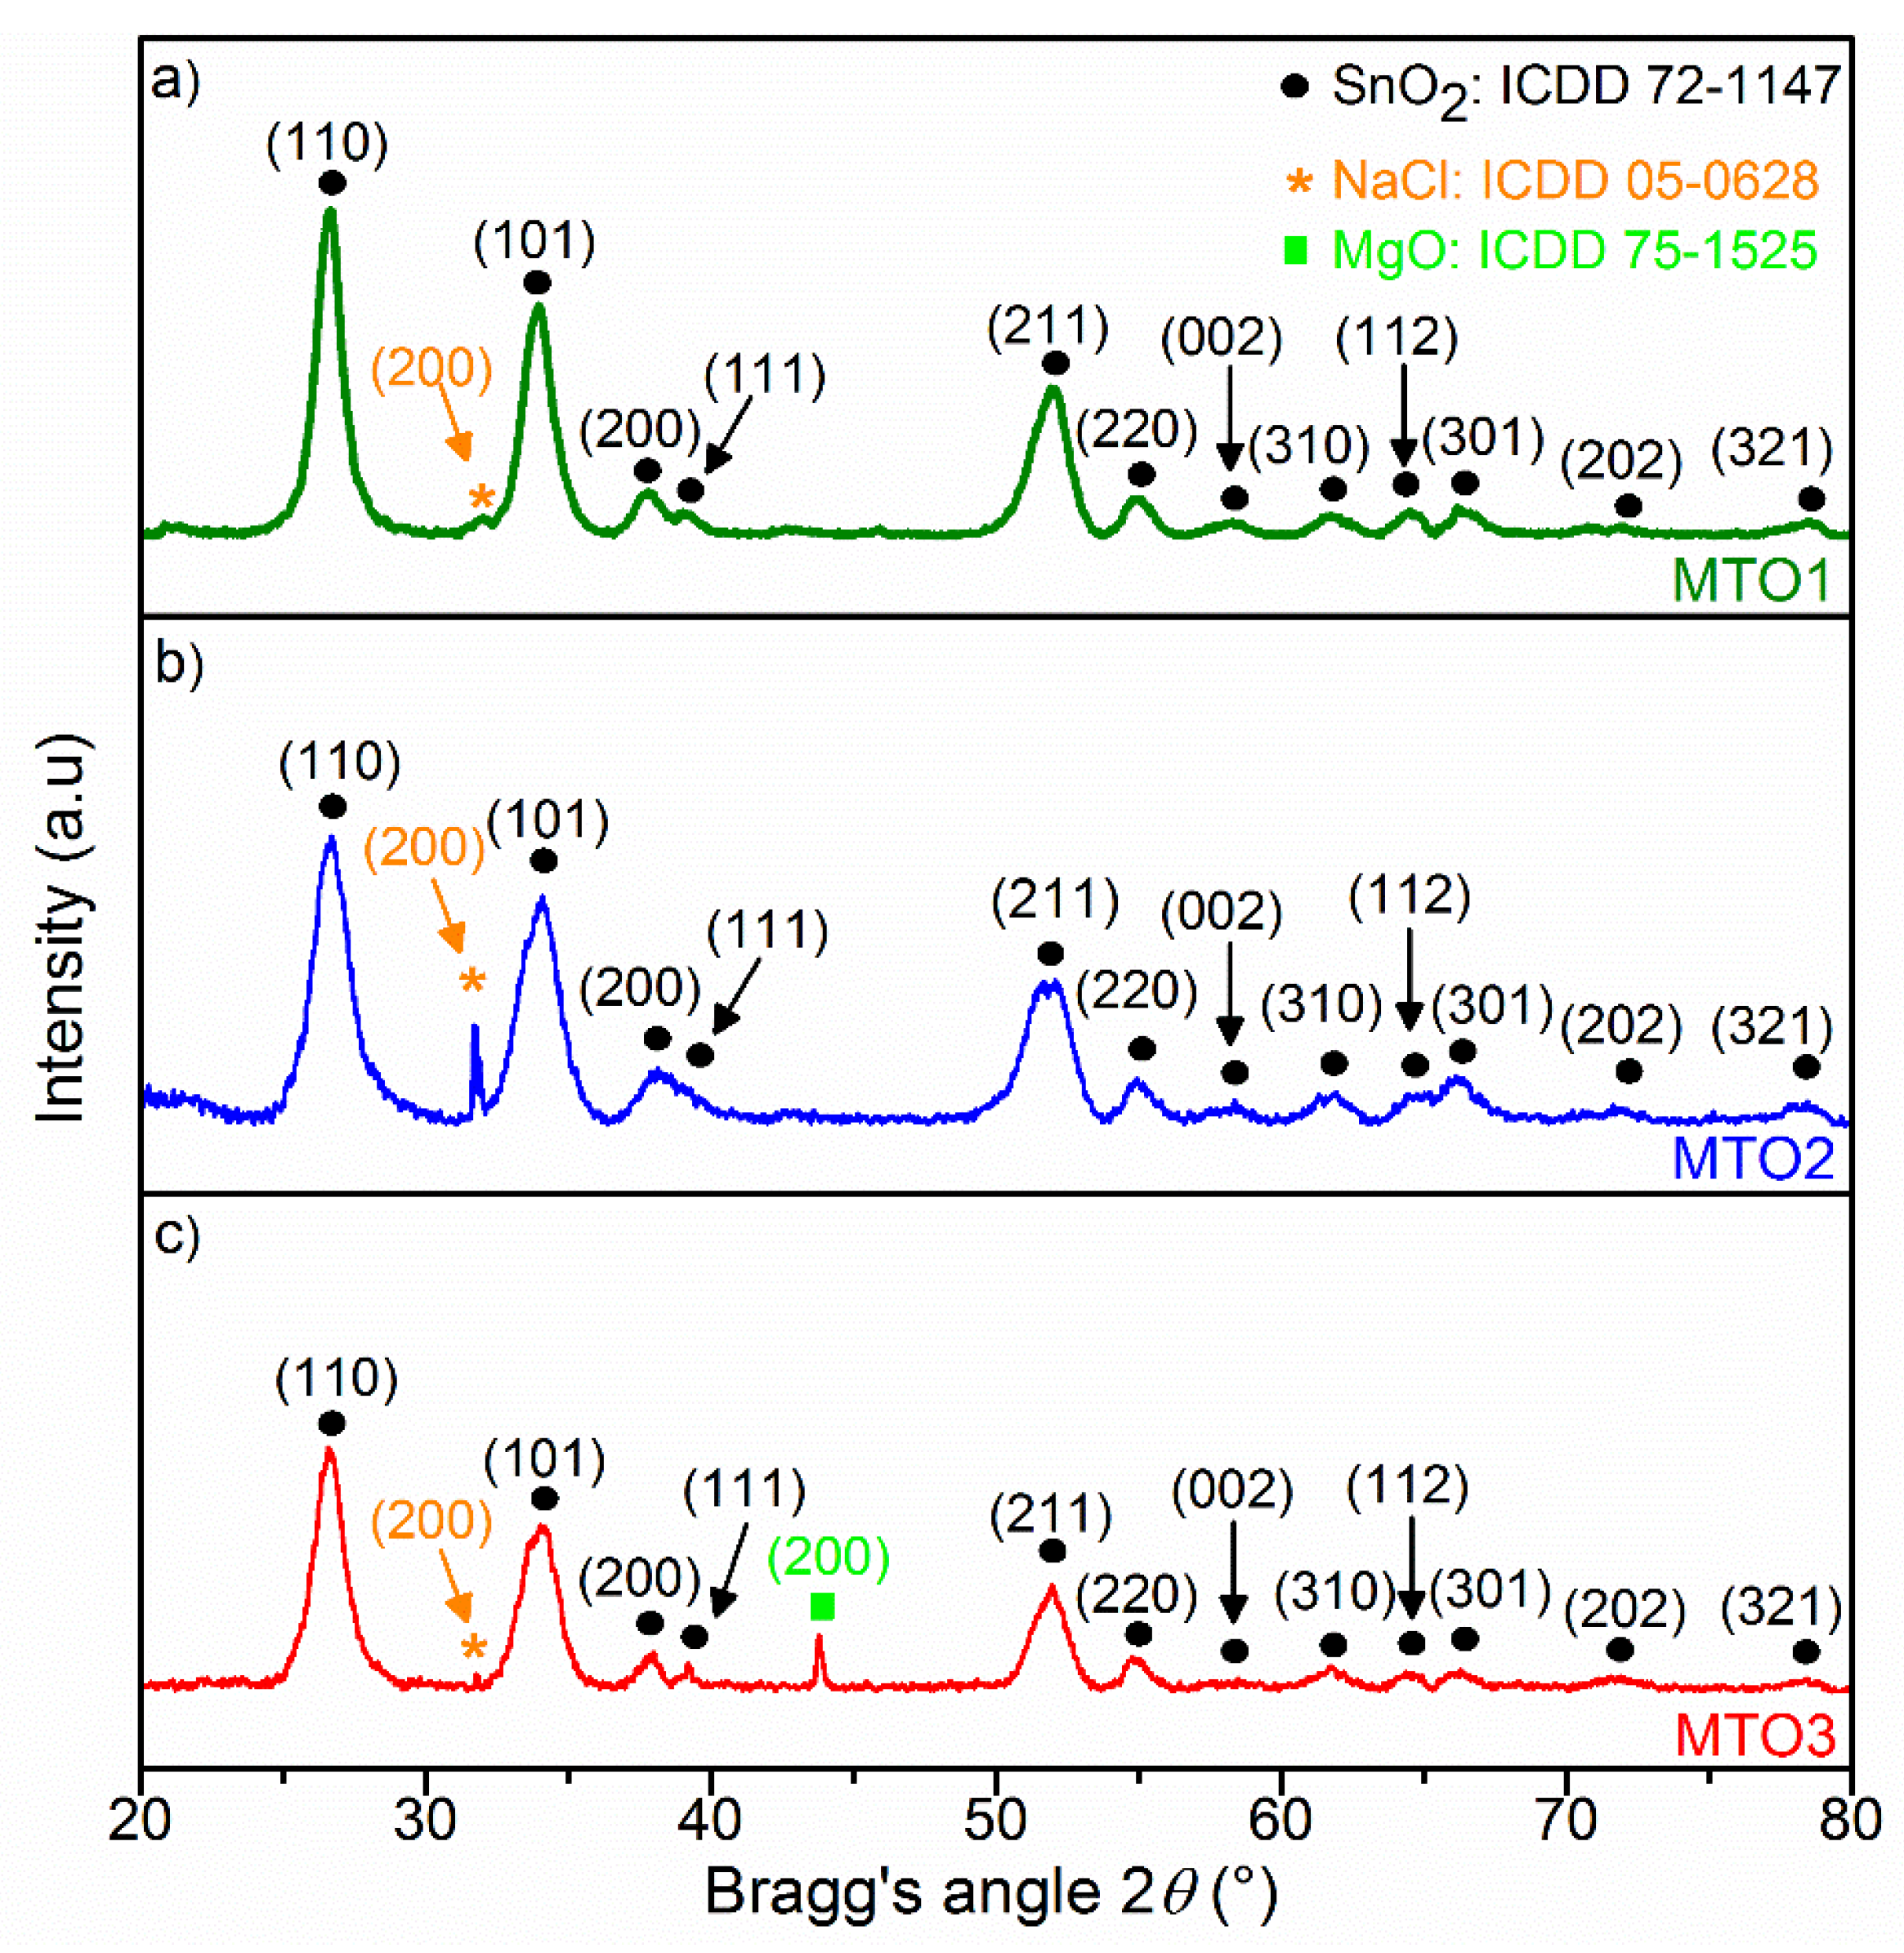
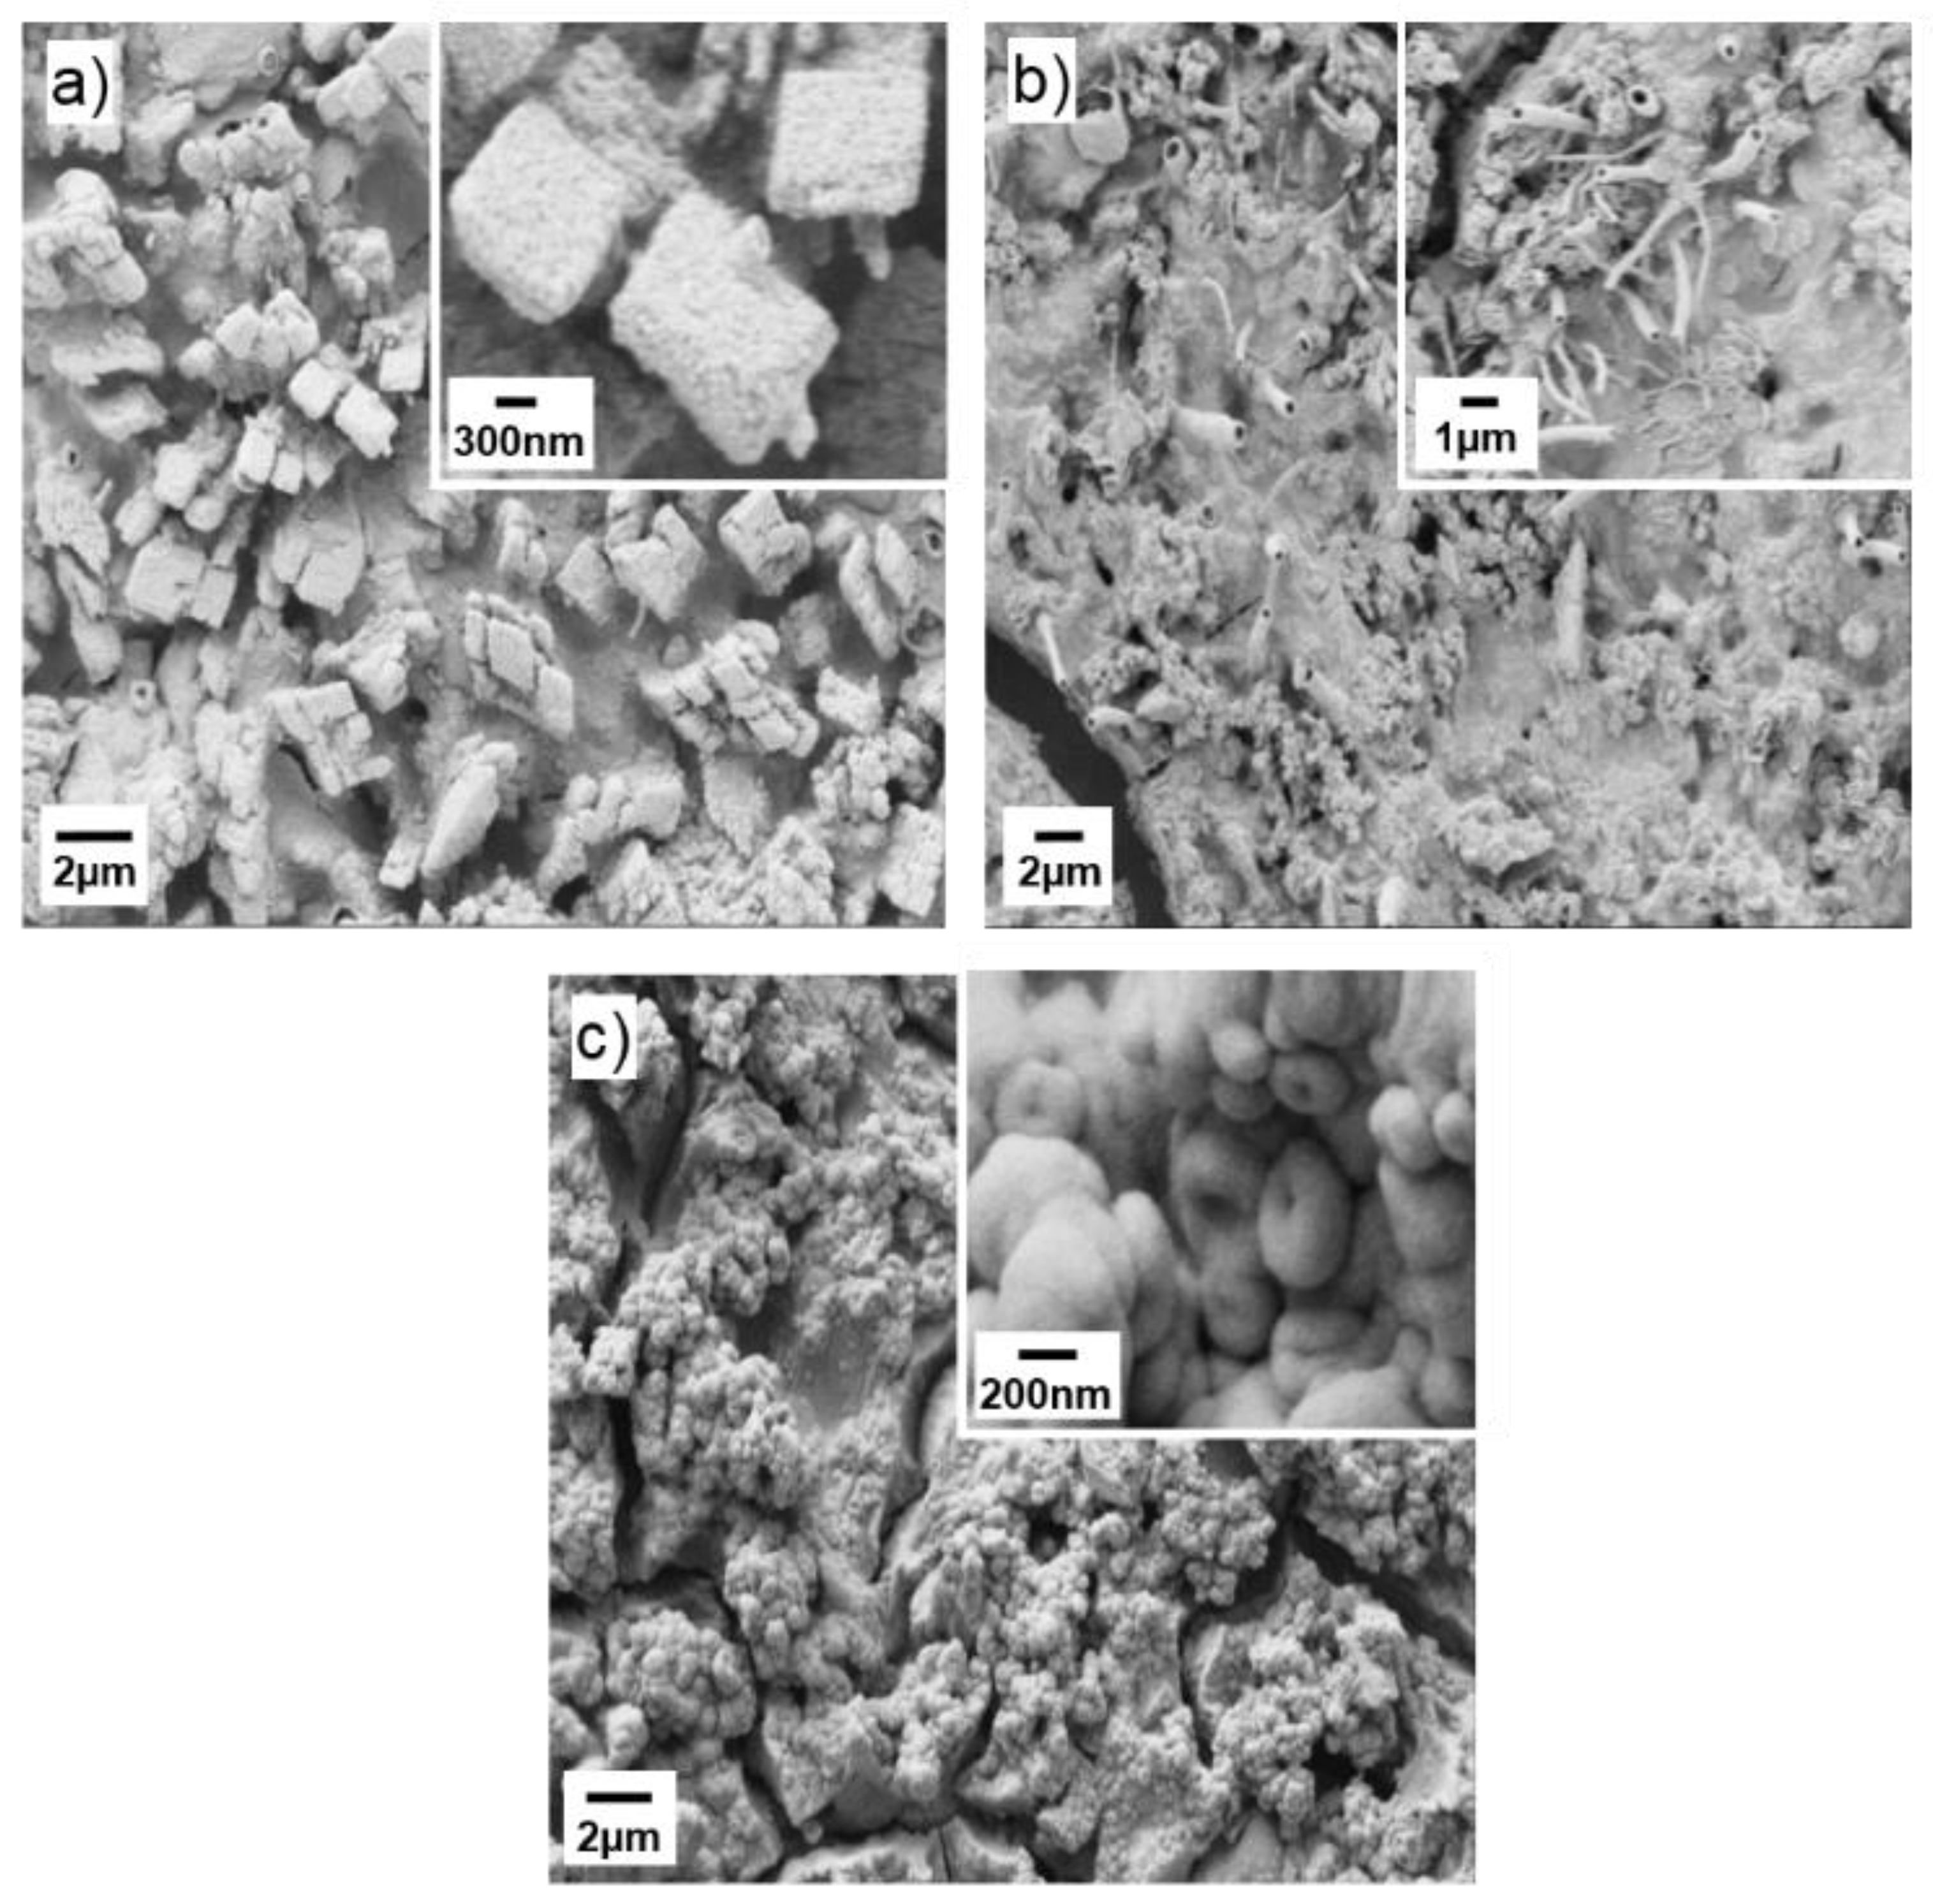
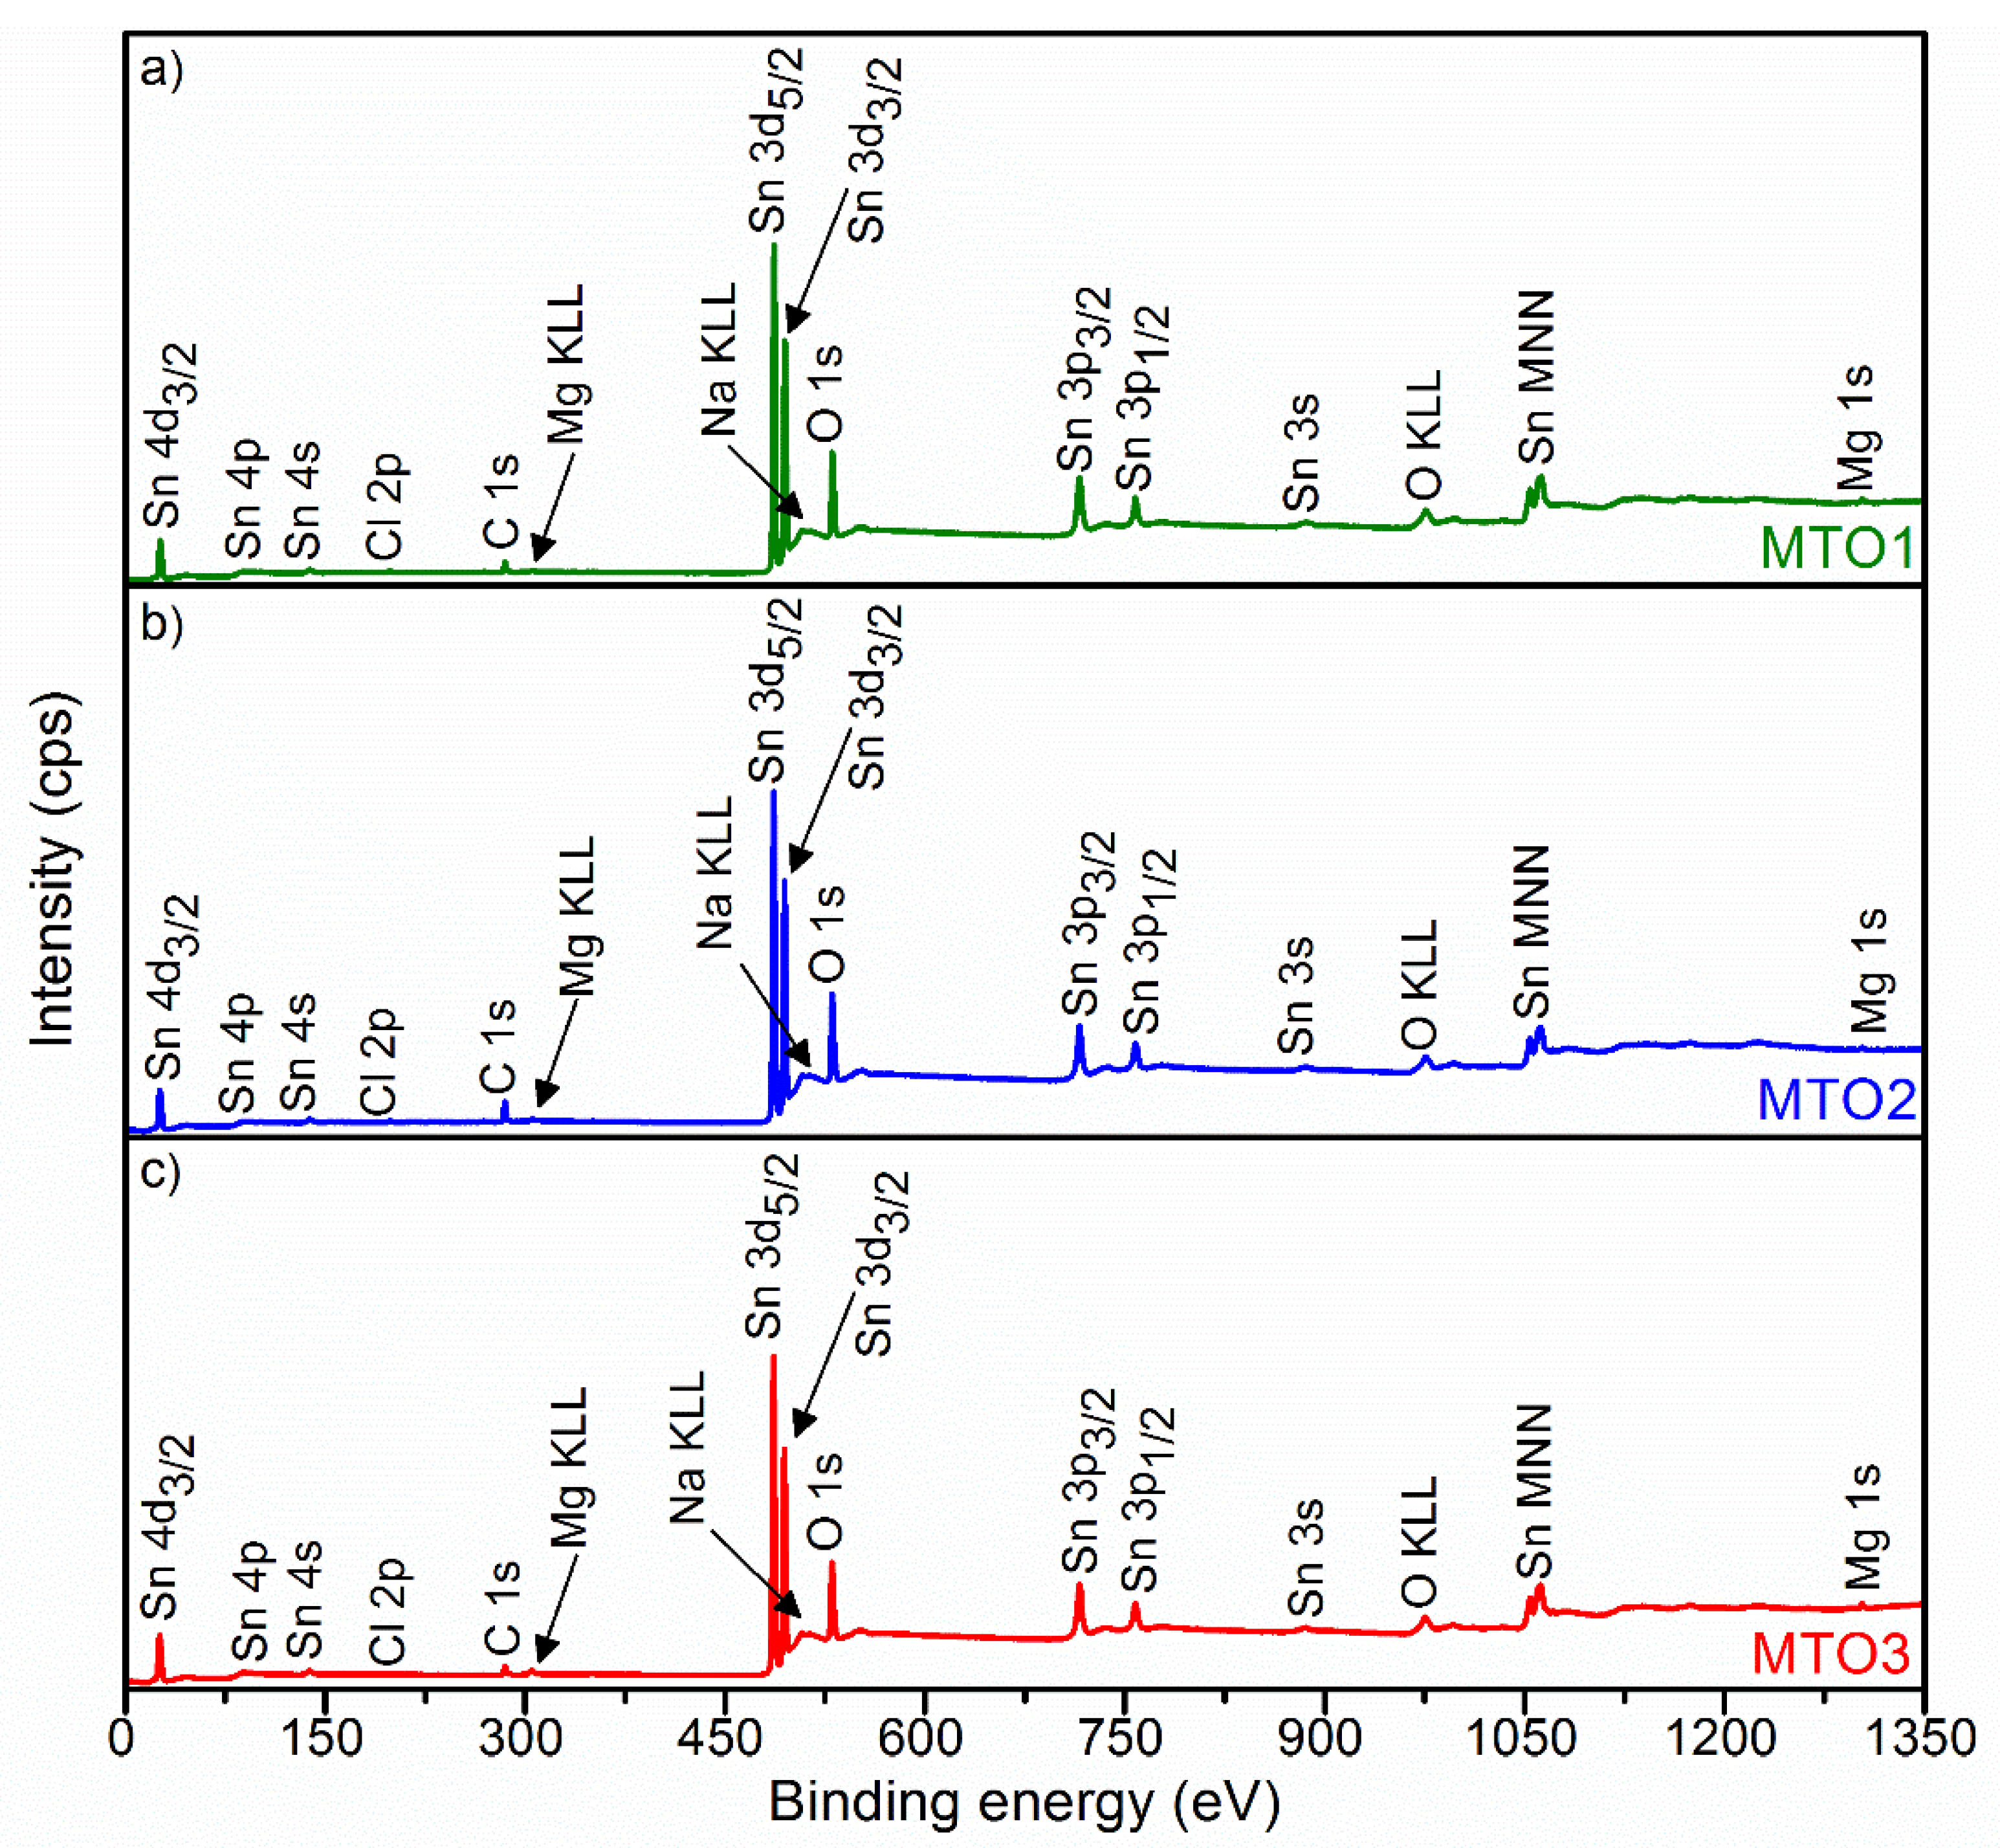
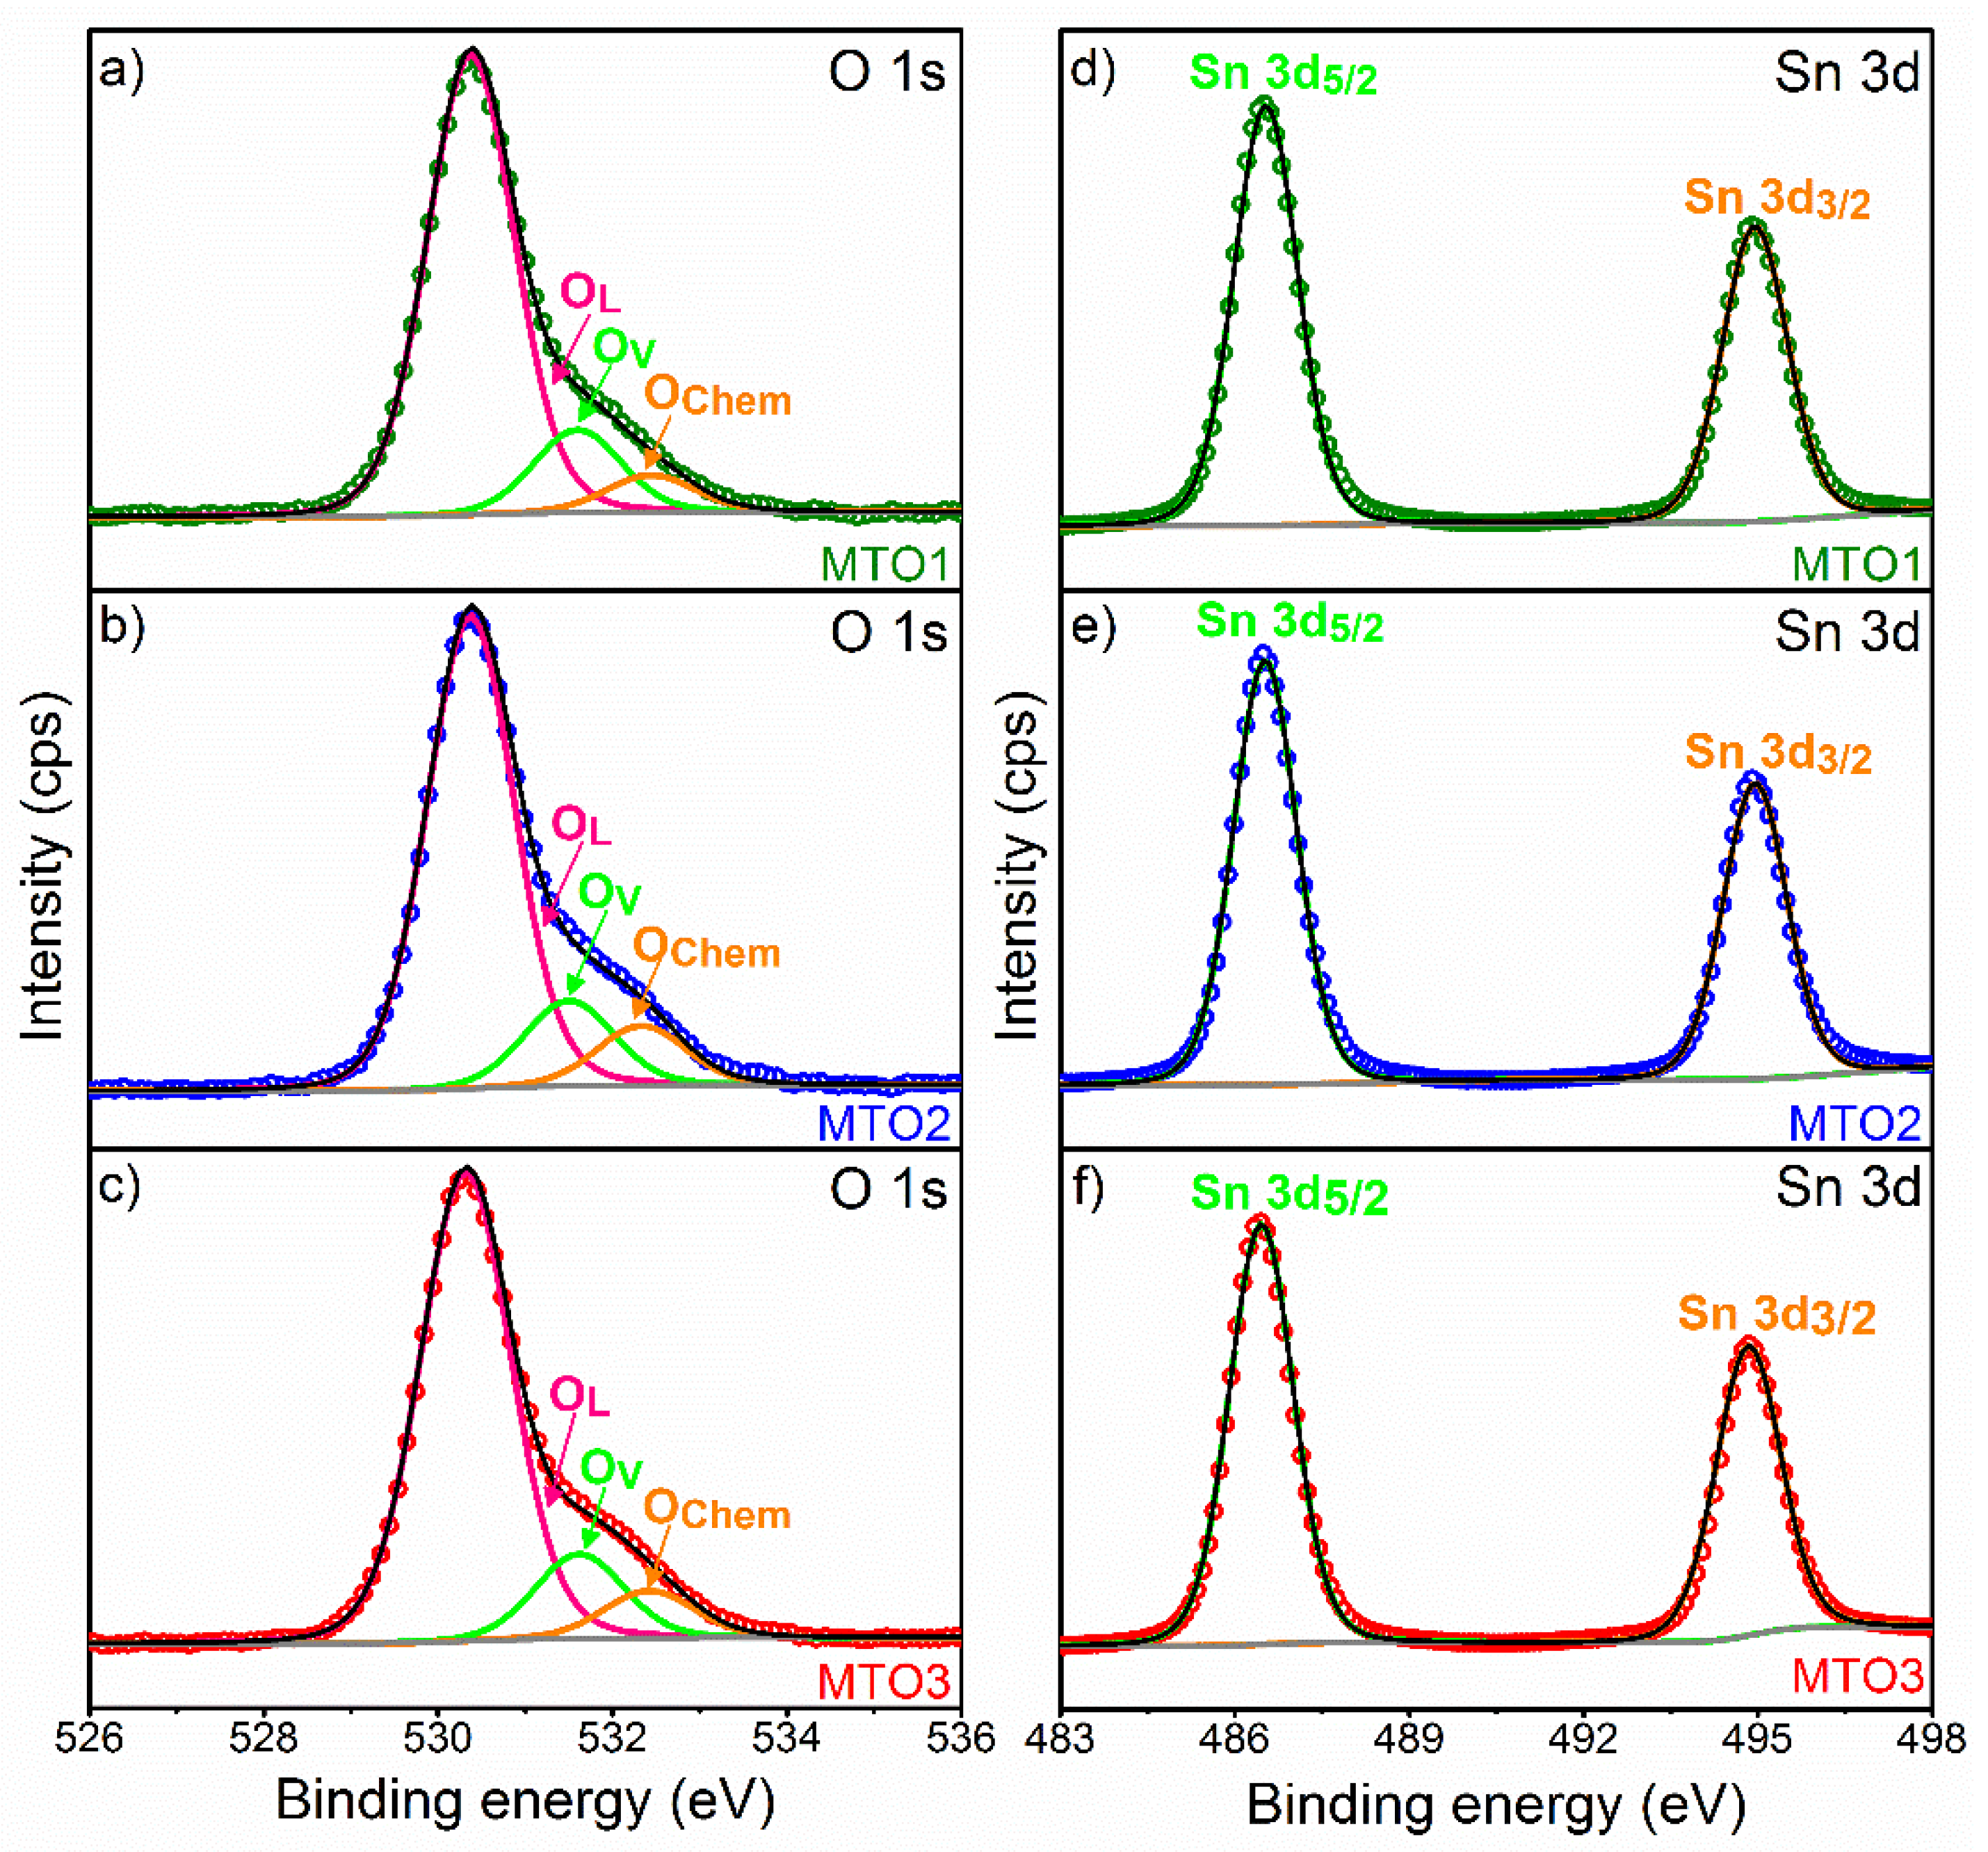
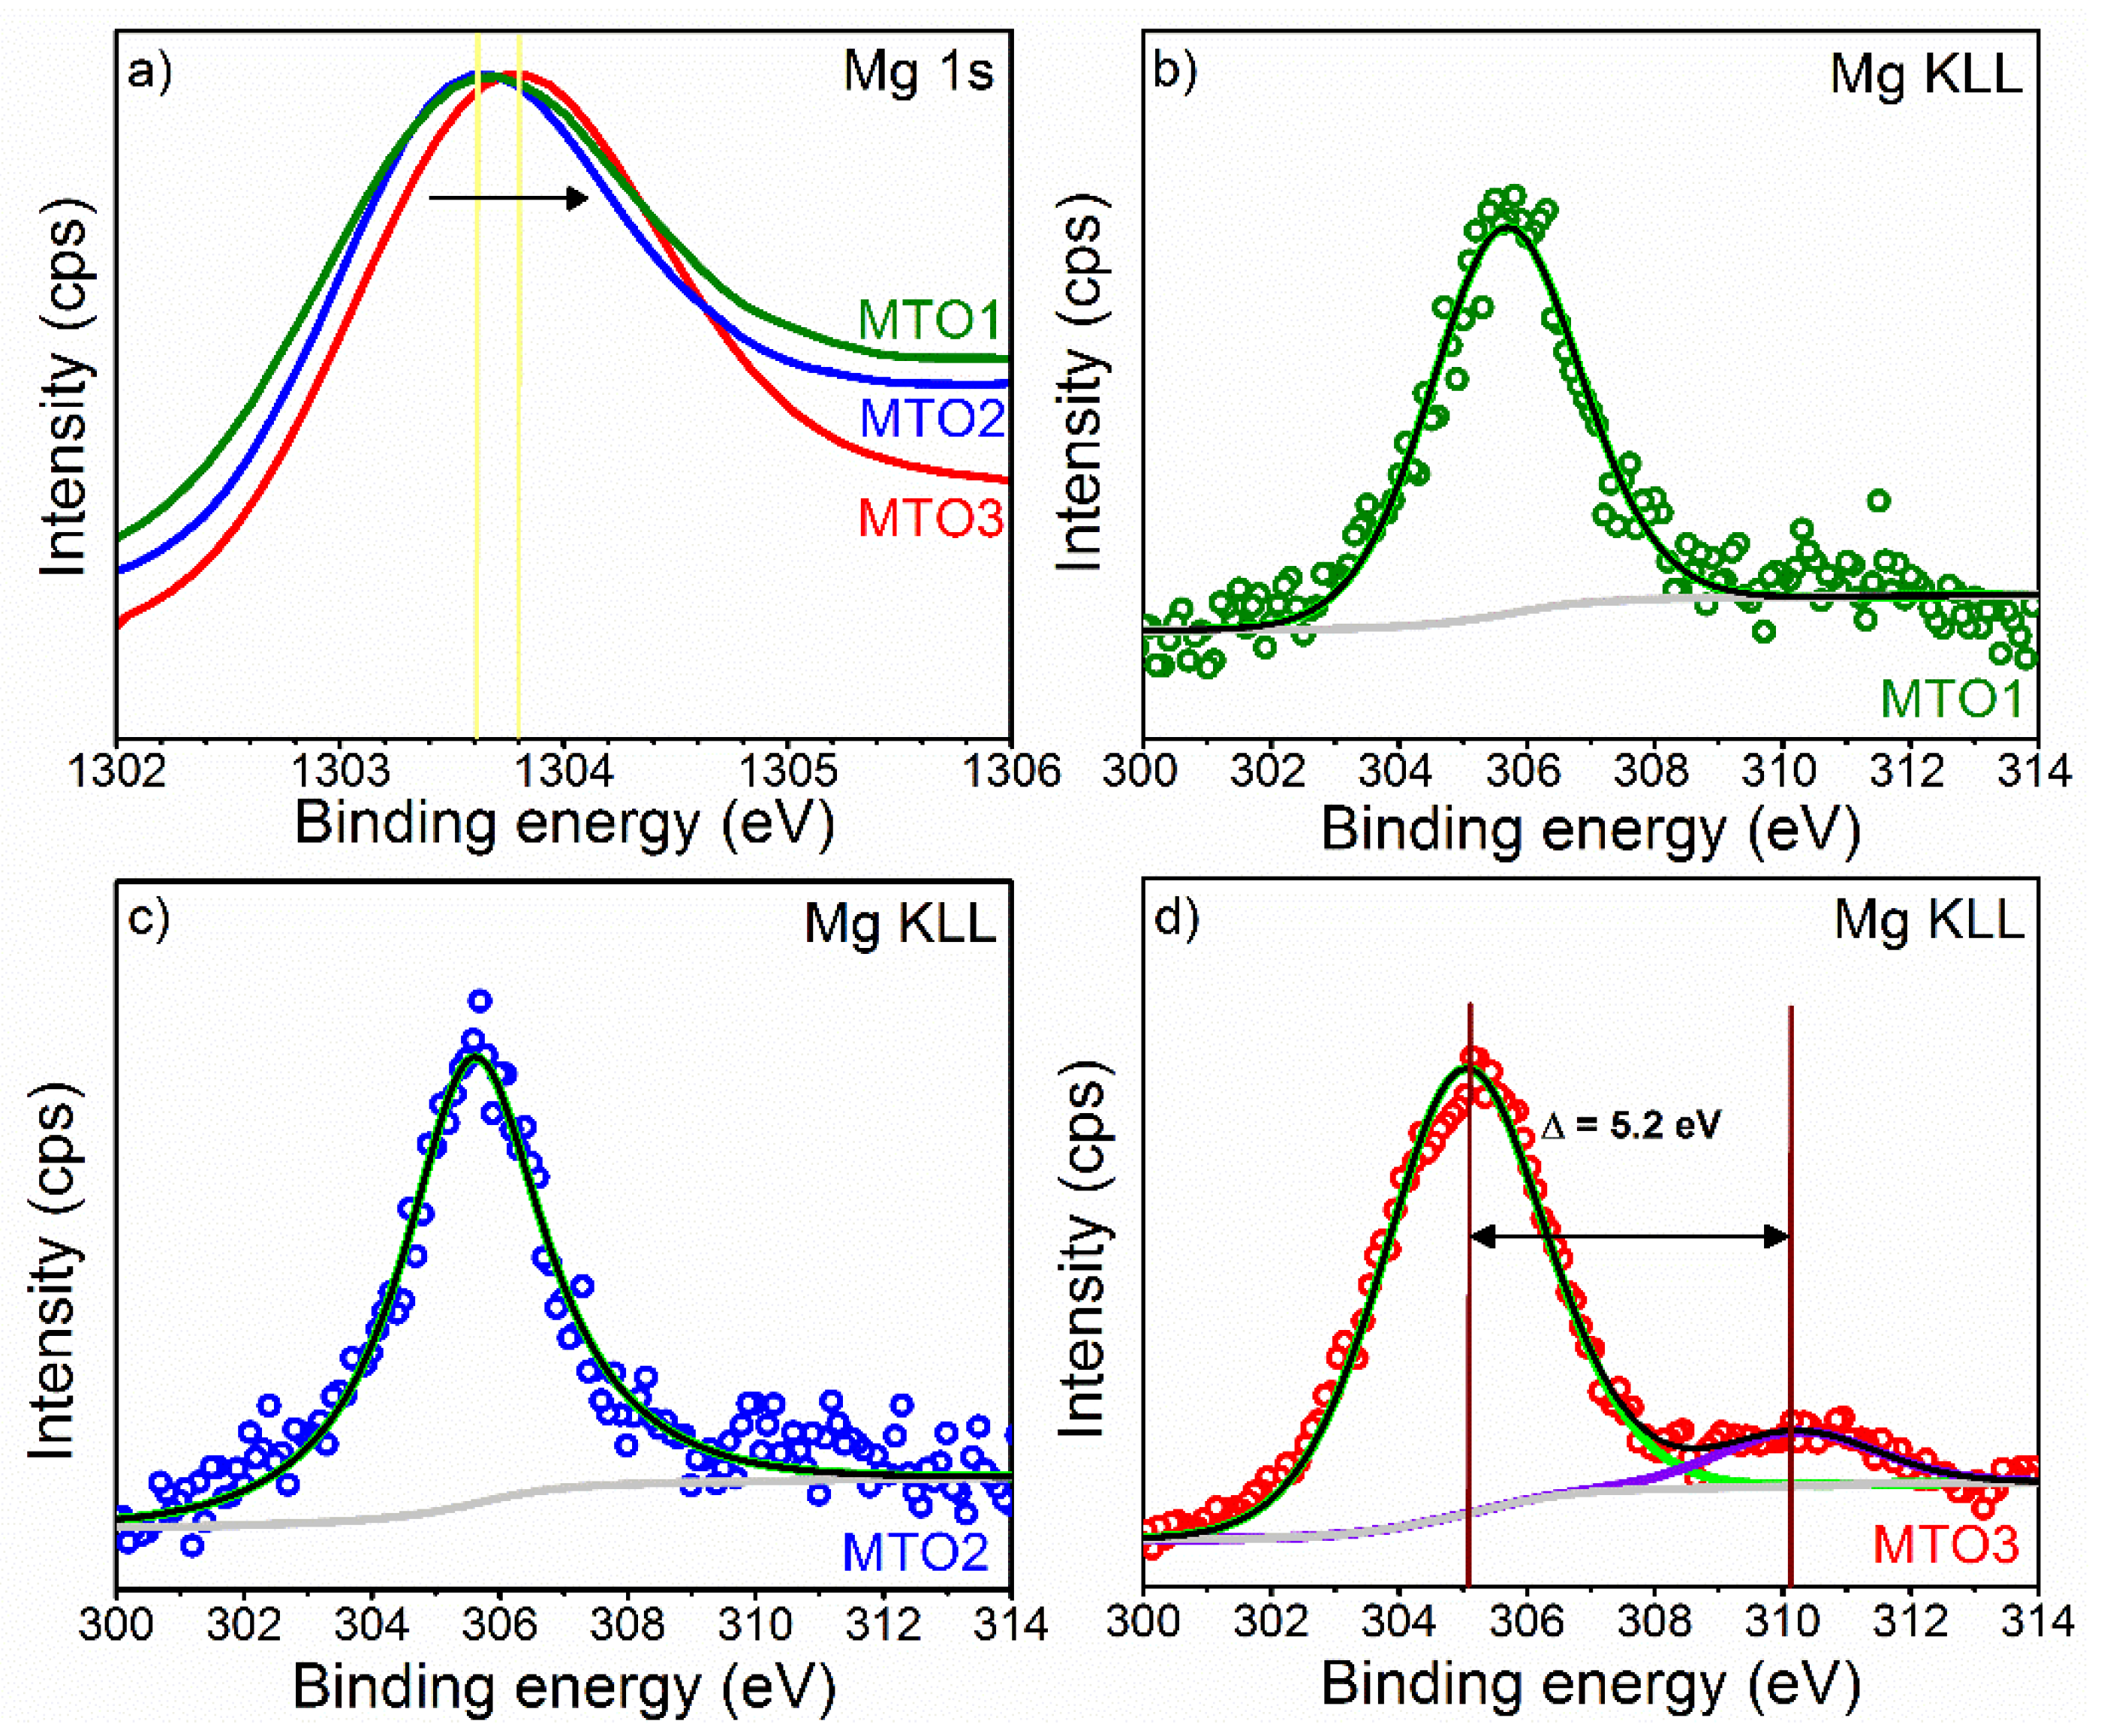
3.1. Films Analysis and Characterization

X-ray diffraction patterns were evaluated to gain insight into the crystal structure of the Mg-doped SnO2 thin films. As exhibited in Figure 2, all films are polycrystalline in nature and crystallize in rutile tetragonal tin dioxide (SnO2) structure (P42/mnm space group, ICDD card 72−1147) with a dominant (110) diffraction at 26.53° 2θ approximately. In general, the results show a steady decrease of all SnO2 diffraction peaks accompanied by a diffraction pattern shift to lower angle values (>0.06° 2θ) as the Mg amount increases in the films. This could be caused in part by the diffusion of Mg2+ ions into the SnO2 lattice and the smaller ionic radii of the guest atom (Mg2+: 0.67 Å) compared to the host atom (Sn4+: 0.71 Å), and also by the lower electronic density of Mg atoms (1.738 g/cm3) compared to Sn atoms (β−Sn = 7.265 g/cm3). The results also indicate a change in the lattice parameters of the Mg-doped SnO2 thin films (Table 1), which reveal a slight increase in “a” and decrease in “c”, compared to the non-doped SnO2 film reported in our previous work [27]. In addition, a proportional decrease of the average crystallite size (D) with the increase of the Mg-doping levels can also be observed in Table 1. Overall, these properties suggest the presence of local lattice disorders in the films and, in turn, an increment of surface defects in the Mg-doped samples with respect to the non-doped samples, as noticed earlier in the literature [29].
The ‘extra’ diffraction peak at 43.8° 2θ in the MTO3 pattern is associated with the (200) reflection of MgO in halite structure (ICDD 75−1525). The presence of this diffraction suggests an excess of Mg (over-doping) in MTO3 and the formation of a secondary phase. This is consistent with the unit cell parameters found for MTO3 (Table 1), which show no further change with respect to MTO2, and endorse the fact that the substitution process goes to its saturation. These observations are in agreement with previous reports on Mg-doped SnO2 by the sol-gel process [30]. Moreover, the Mg-doped SnO2 patterns also revealed additional diffraction peaks referring to the formation of NaCl crystals (ICDD 05−0628) on the matrix of the films. This could be attributed to the combination of sodium ions (diffused from the glass substrate) and chloride ions (from the metal chloride precursor) to form NaCl crystals [31].
SEM micrographs of the Mg-doped SnO2 thin films (Figure 3) display different morphologies with relatively rough topography and irregular particle distribution in all samples. Low magnification SEM images of the films also reveal cracked patterned surfaces after the annealing treatment. Specifically, the SEM images for the MTO1 films (Figure 3a) display the agglomeration of the nanoparticles in cubic shape, whereas the MTO2 films (Figure 3b) show the presence of several hollow microtubes distributed randomly on the surface, and the MTO3 films (Figure 3c) exhibit agglomeration of nanospheres.
EDS analysis corroborated the presence of the three main elements in the films Sn, O, and Mg, with proportional increase of Mg atomic percentage according to the doping level. The presence of other elements, such as Si and Na (associated with the use of glass substrate), and Cl (related to the chloride-based precursors), are also registered and in line with the XRD results. Further properties of the elements at the surface of the films were investigated by XPS.
Figure 4 displays the survey XPS spectrum for each film (i.e., MTO1, MTO2 and MTO3). These spectra show a sharp and intense XPS core level Sn 3d and O 1s peaks around 486.5 eV and 530.3 eV, respectively. The spectra also show minor peaks for Sn 4d3/2, Sn 4p, Sn 4s, C 1s, Mg KLL, Sn 3p3/2, Sn 3p1/2, Sn 3s, O KLL, Sn MNN, and Mg 1s. Na KLL and Cl 2p peaks are also identified in the spectra in concordance with the XRD and EDS results.
Figure 5 shows the deconvolution of O 1s and Sn 3d XPS core level spectra recorded on the films. The O 1s core level peak exhibits slight asymmetry with a distinct shoulder in all the investigated samples suggesting the presence of three components (Figure 5). The main component centered at ~530.3 eV is assigned to lattice oxygen (OL) (oxygen directly bounded to a metal atom) [32]. The two other components, found at higher binding energy ~531.6 and ~532.4 eV, are connected with the oxygen vacancies (OV) mandatory for charge compensation after doping and the chemosorbed oxygen (OChem), respectively, as in the previous literature [33].
The Sn 3d region of the three samples (Figure 5) presents doublets at 486.5 and 494.9 eV for Sn 3d5/2 and Sn 3d3/2, respectively. According to the literature [32], the three oxidation states of Sn atoms are defined by three binding energy values as the following Sn0 (485.0 eV), Sn2+ (485.9 eV), and Sn4+ (486.6 eV). Our results indicate the absence of Sn0 and Sn2+ within the films and therefore confirm the Sn4+ oxidation state and the formation of SnO2 by spray pyrolysis.
XPS results also show the Mg 1s core level peak and the Mg KLL Auger emission peak. Estimation of the content of Mg at the samples indicate lower contents for MOT1 and MTO2 (~0.7 at.%) respect to MTO3 (~1 at.%). The results in Figure 6a show the Mg 1s spectrum for the MTO1 and MTO2 films at a lower energy (~1303.6 eV) than that recorded for the MTO3 films, which display a shift to a higher energy (~1303.8 eV) most likely due to the oxidation of Mg [30,34]. The Mg KLL Auger spectrum (Figure 6b–d) supports this fact by showing a component associated to Mg metal in the three samples and a second component (only present in the MTO3 films and shifted 5.2 eV to higher energy) assigned to Mg oxide [35,36]. These results are in line with the MgO diffractions identified by XRD (Figure 2).
Overall, the analysis of the material demonstrates the formation of Mg-doped SnO2. These results indicate that the morphological differences in the films (i.e., MTO1, MTO2, and MTO3) are attributed to the variation of Mg doping level in the SnO2 films. The incorporation of the Mg precursor in the spray solution affects the nucleation process and growth conditions of the films. This also slightly deviates the crystalline structure of the doped films (with respect to pristine SnO2) and, therefore, the film morphology. As the doping reaches a saturation point, the alloy system tends to dissociate and a second phase material emerges (i.e., MgO) causing further change in the growth mechanism and the film morphology. Previously, other authors also observed morphological changes in SnO2 and ZnO films due to Eu (europium) [37] and Mg doping [38], respectively, and the formation of a MgO second phase material.

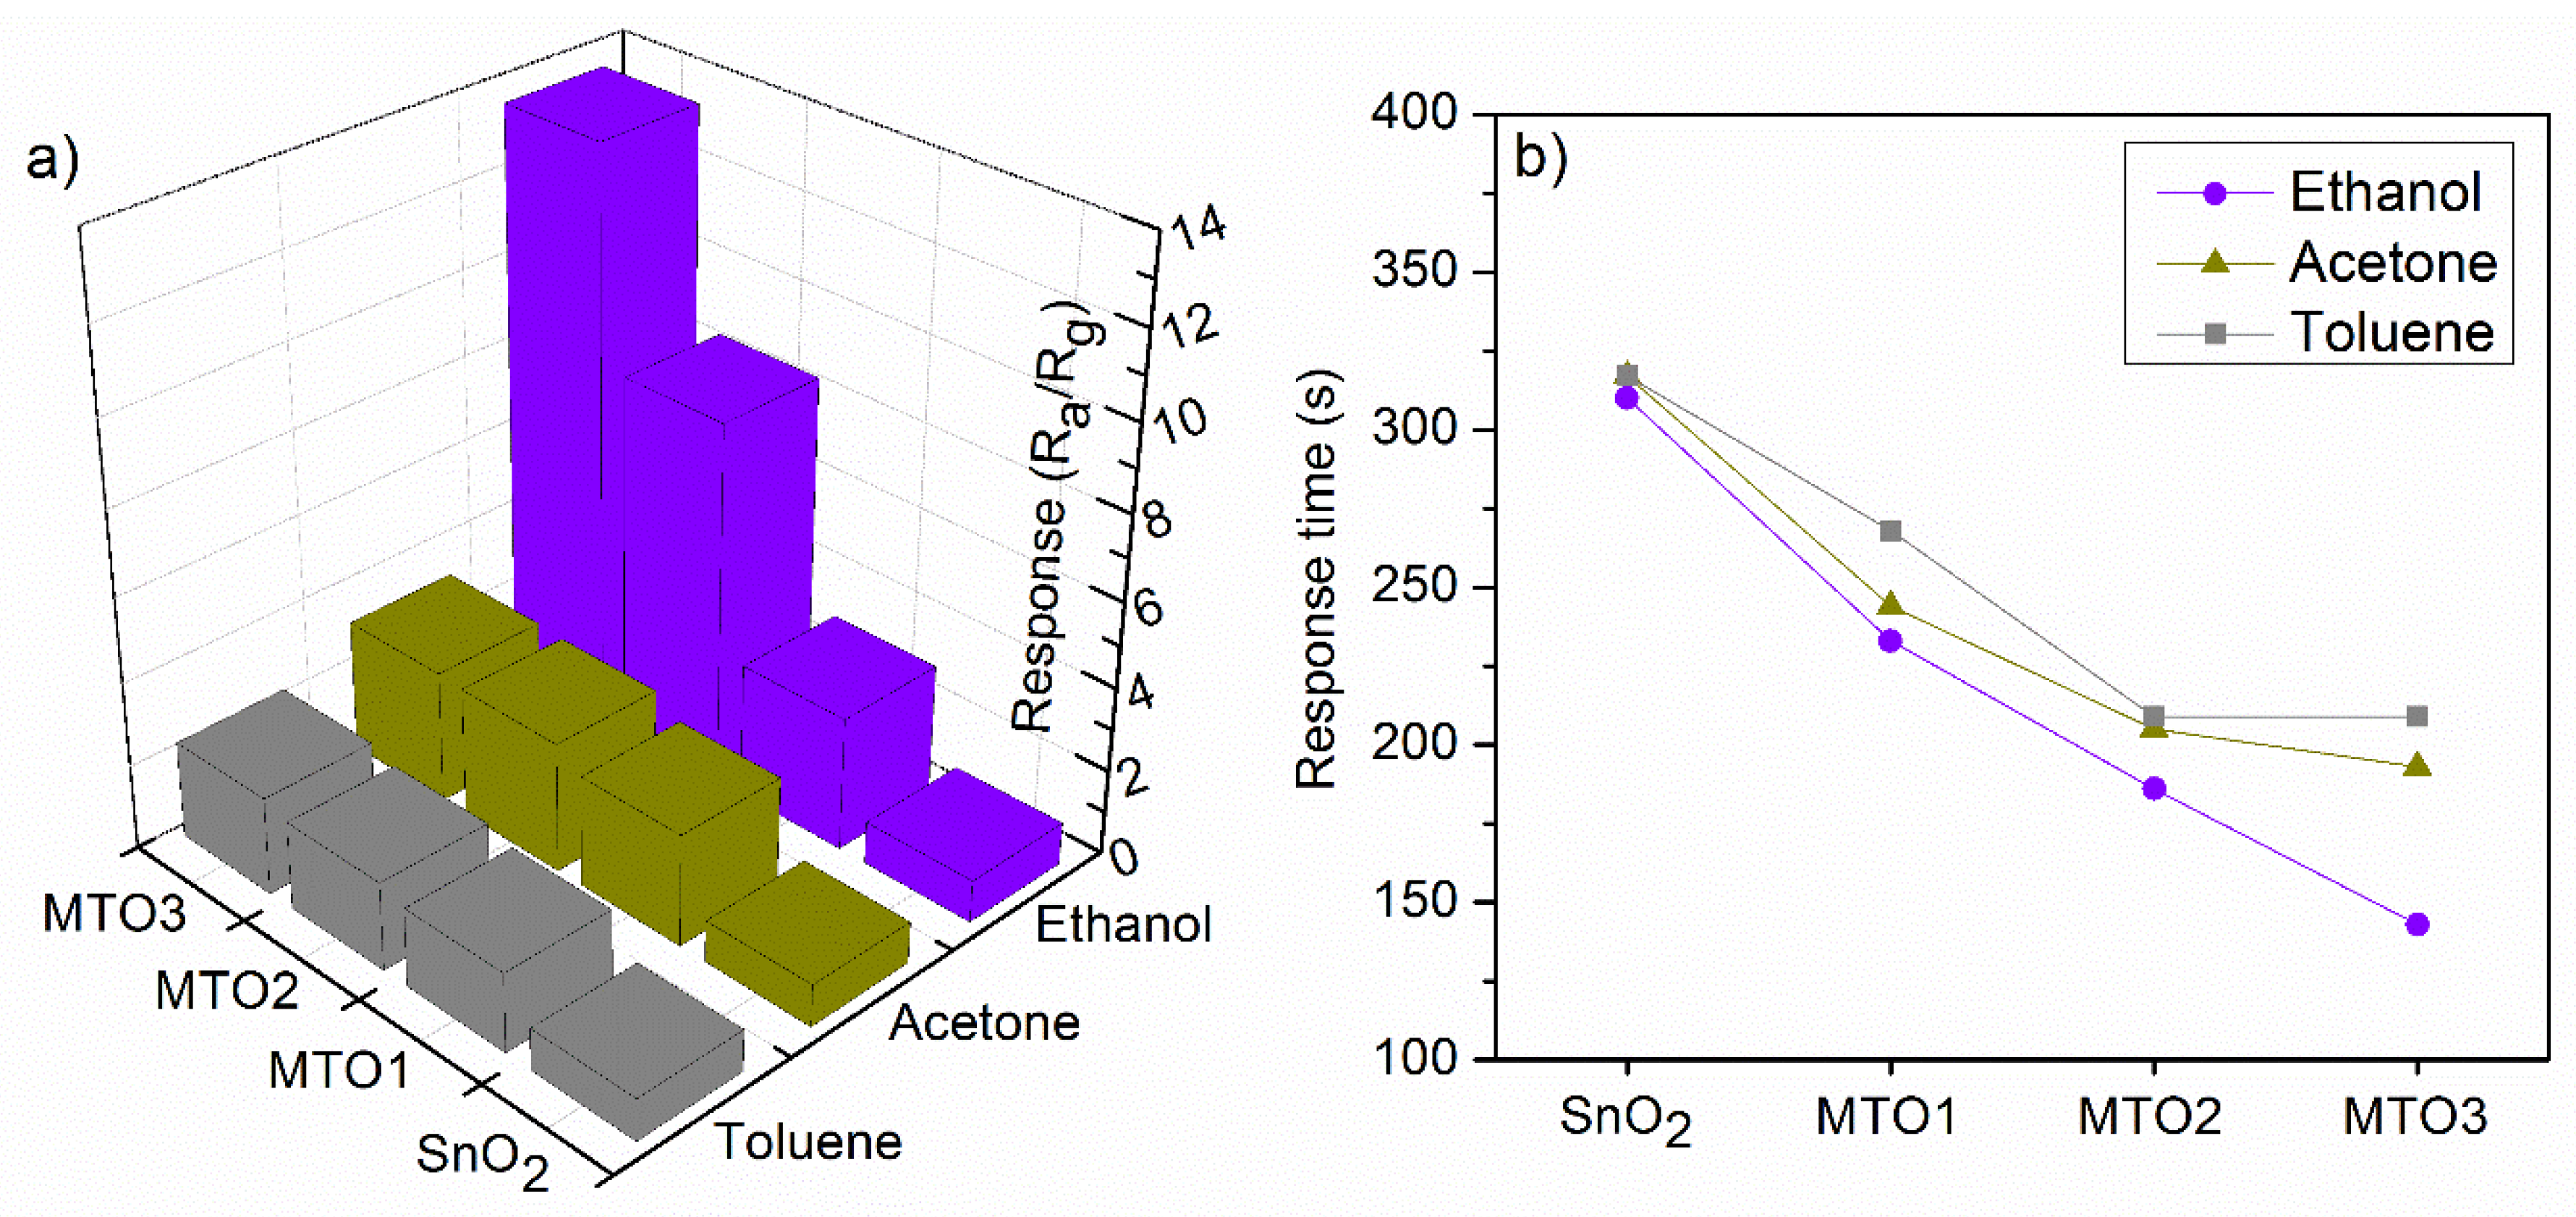
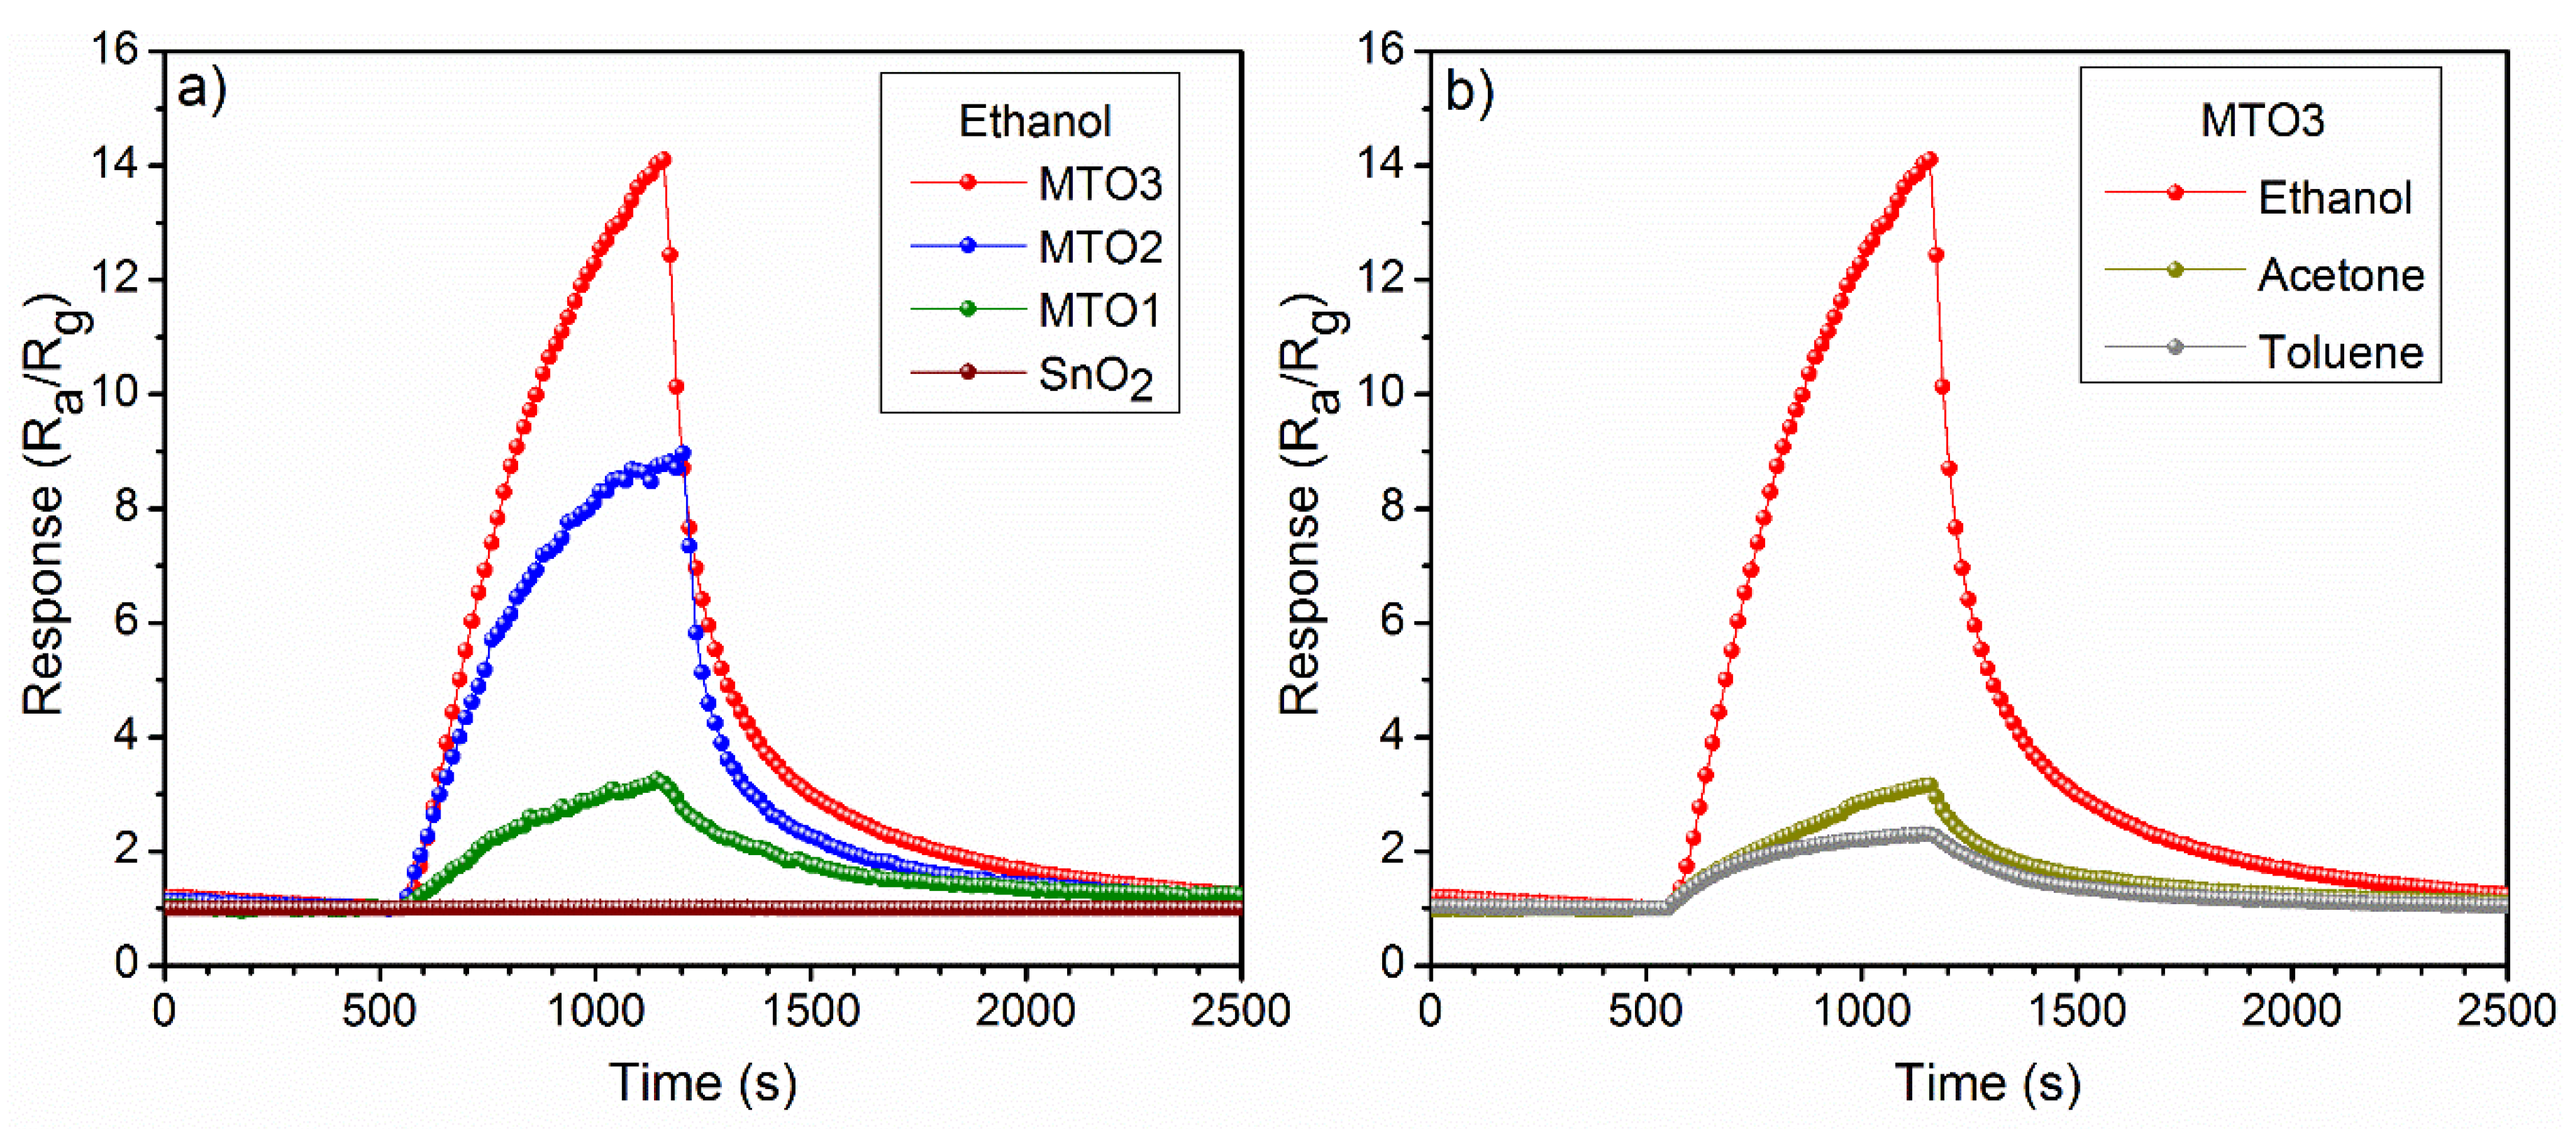
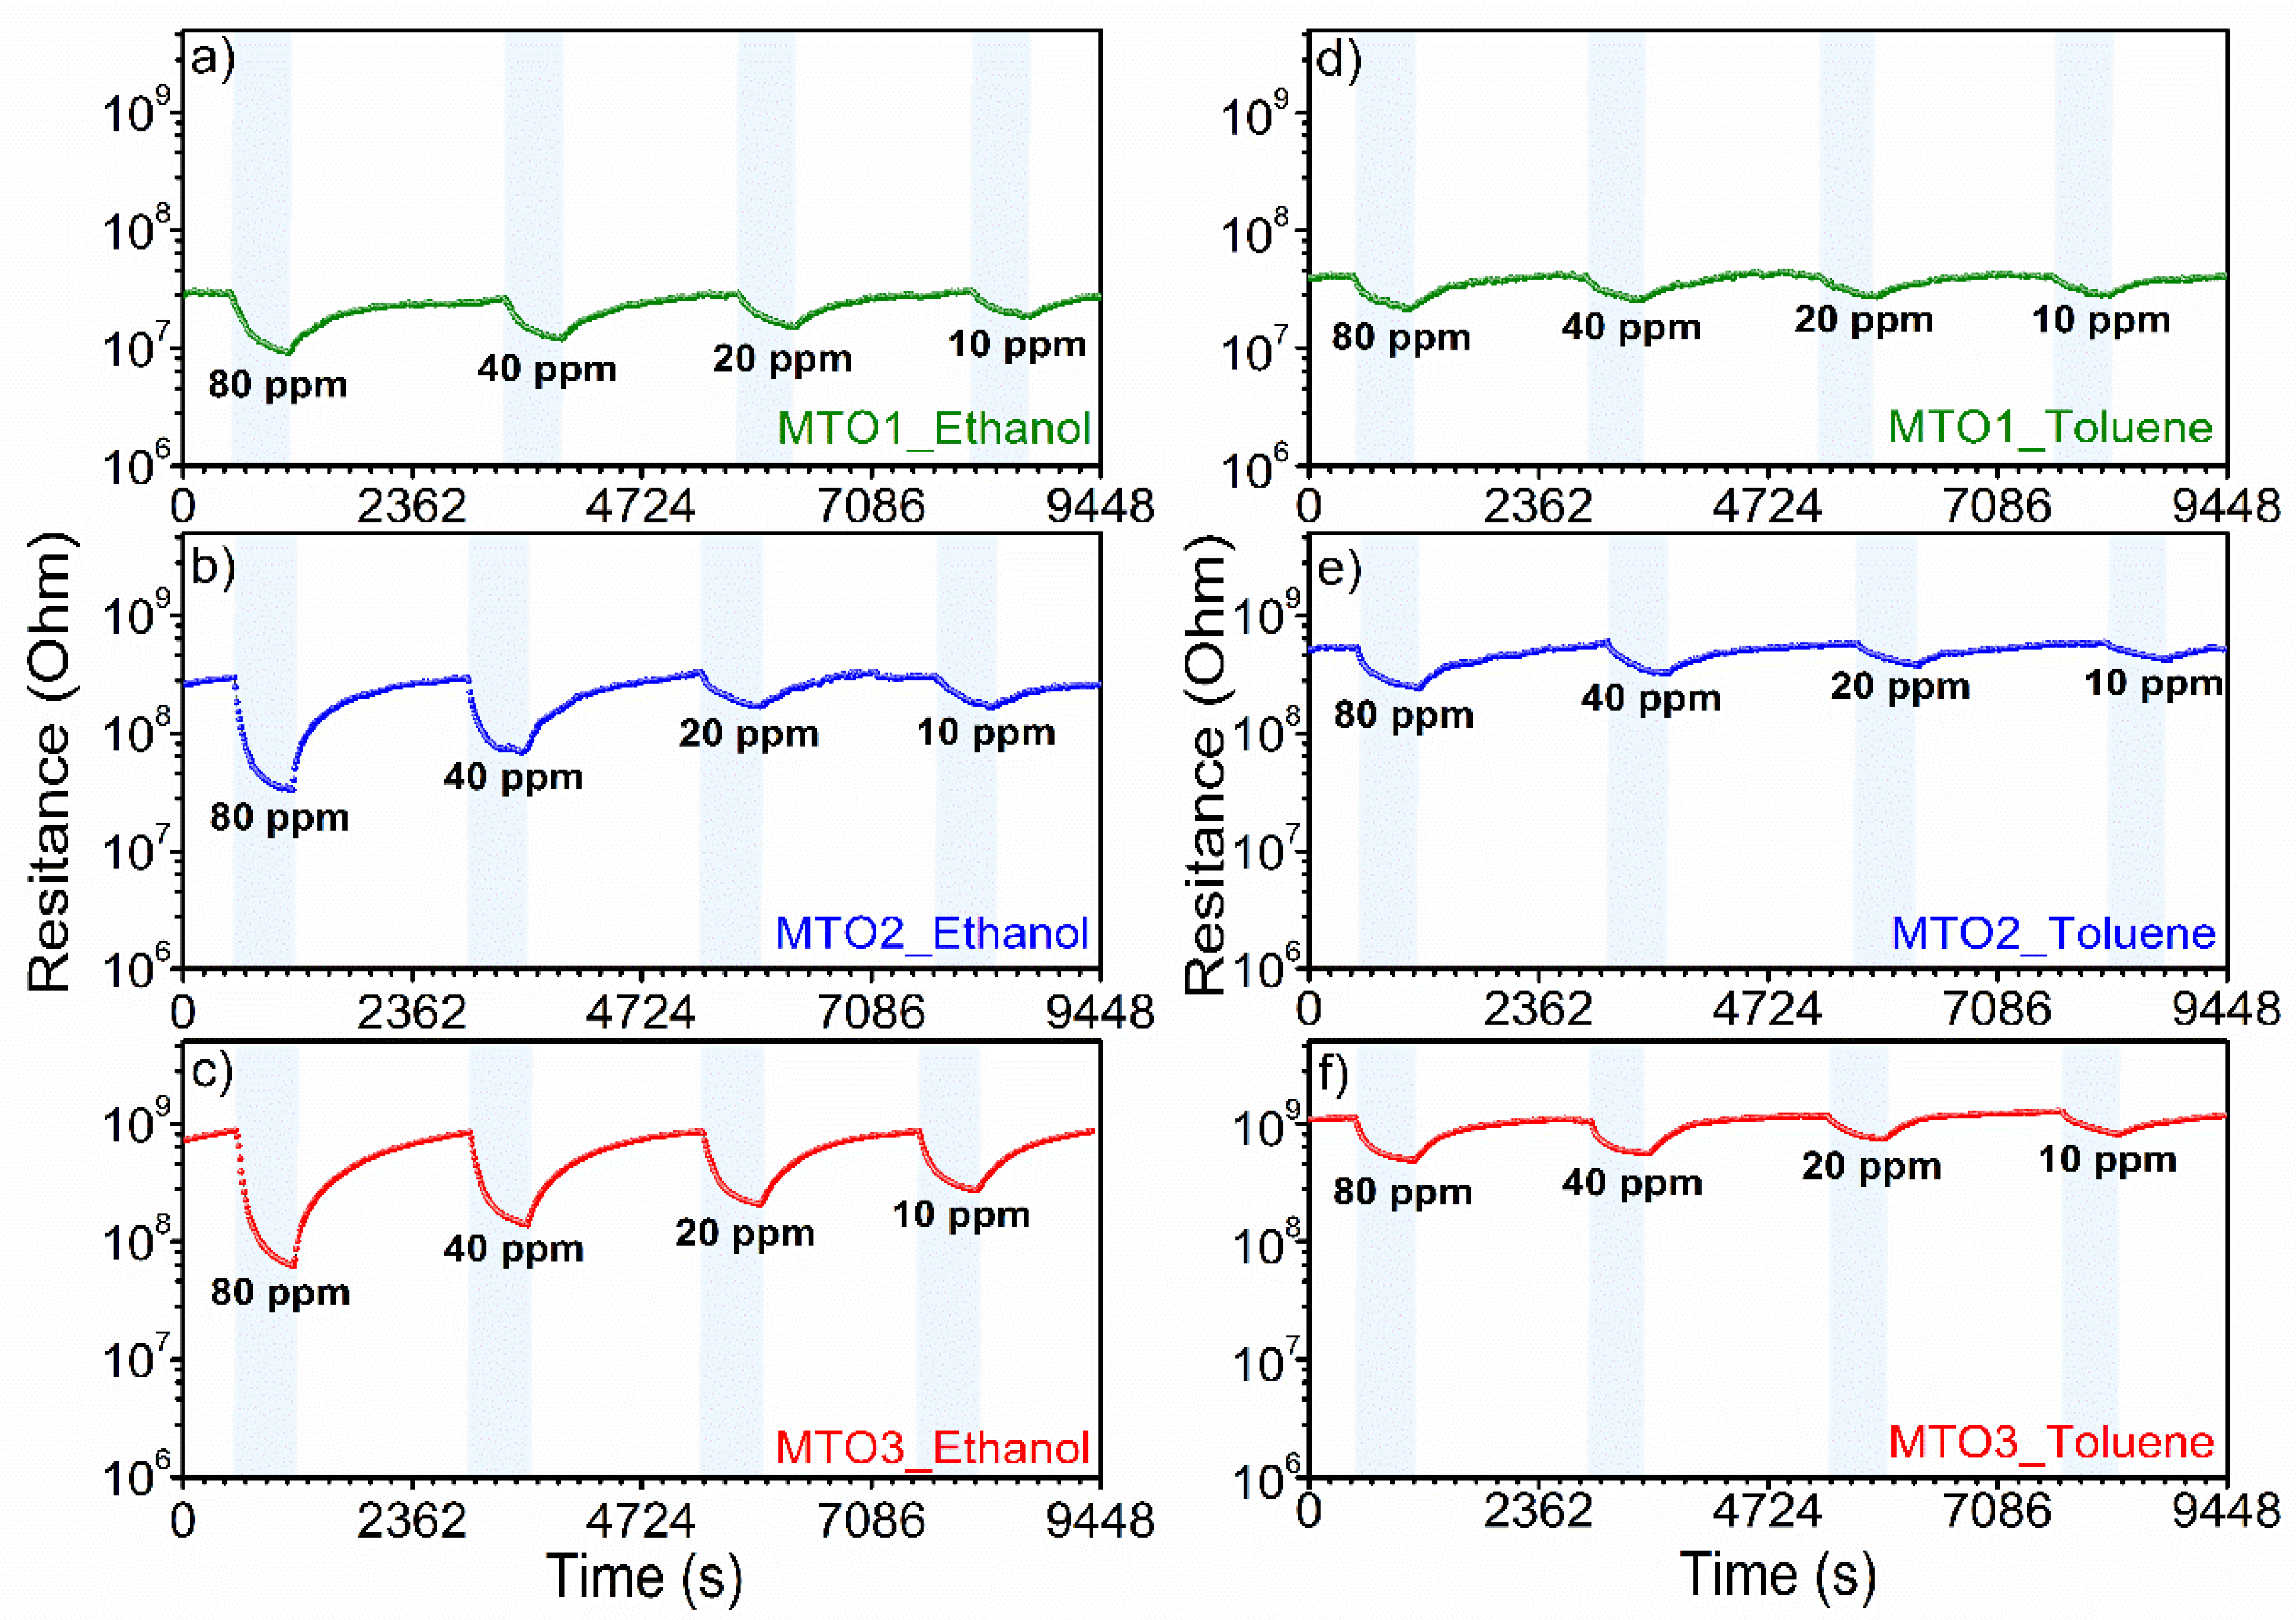
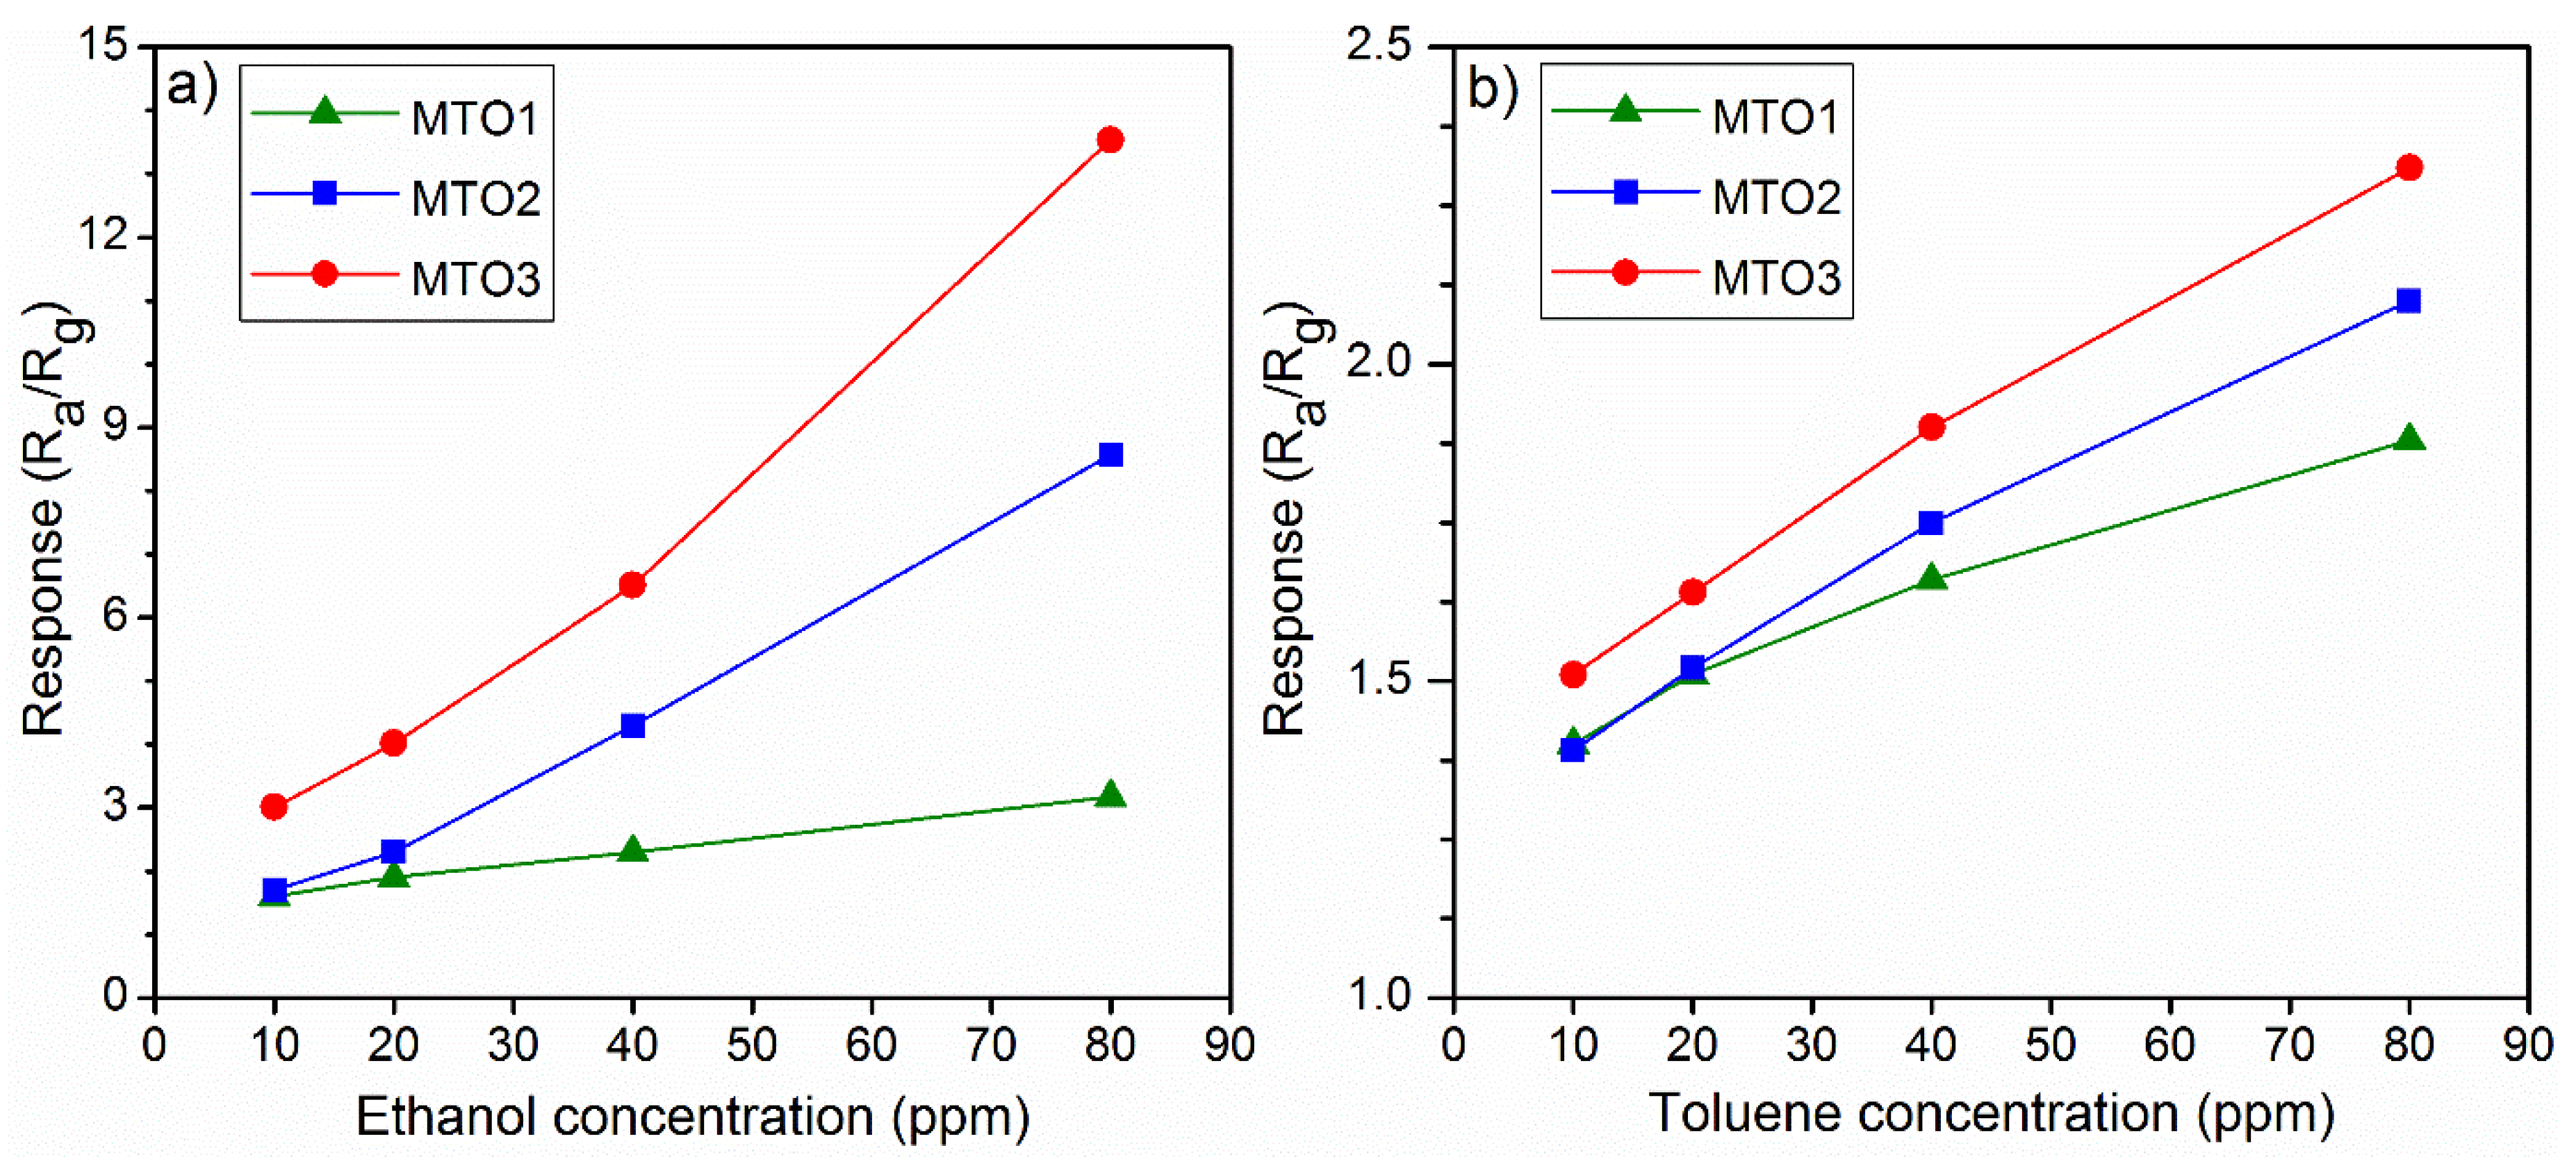
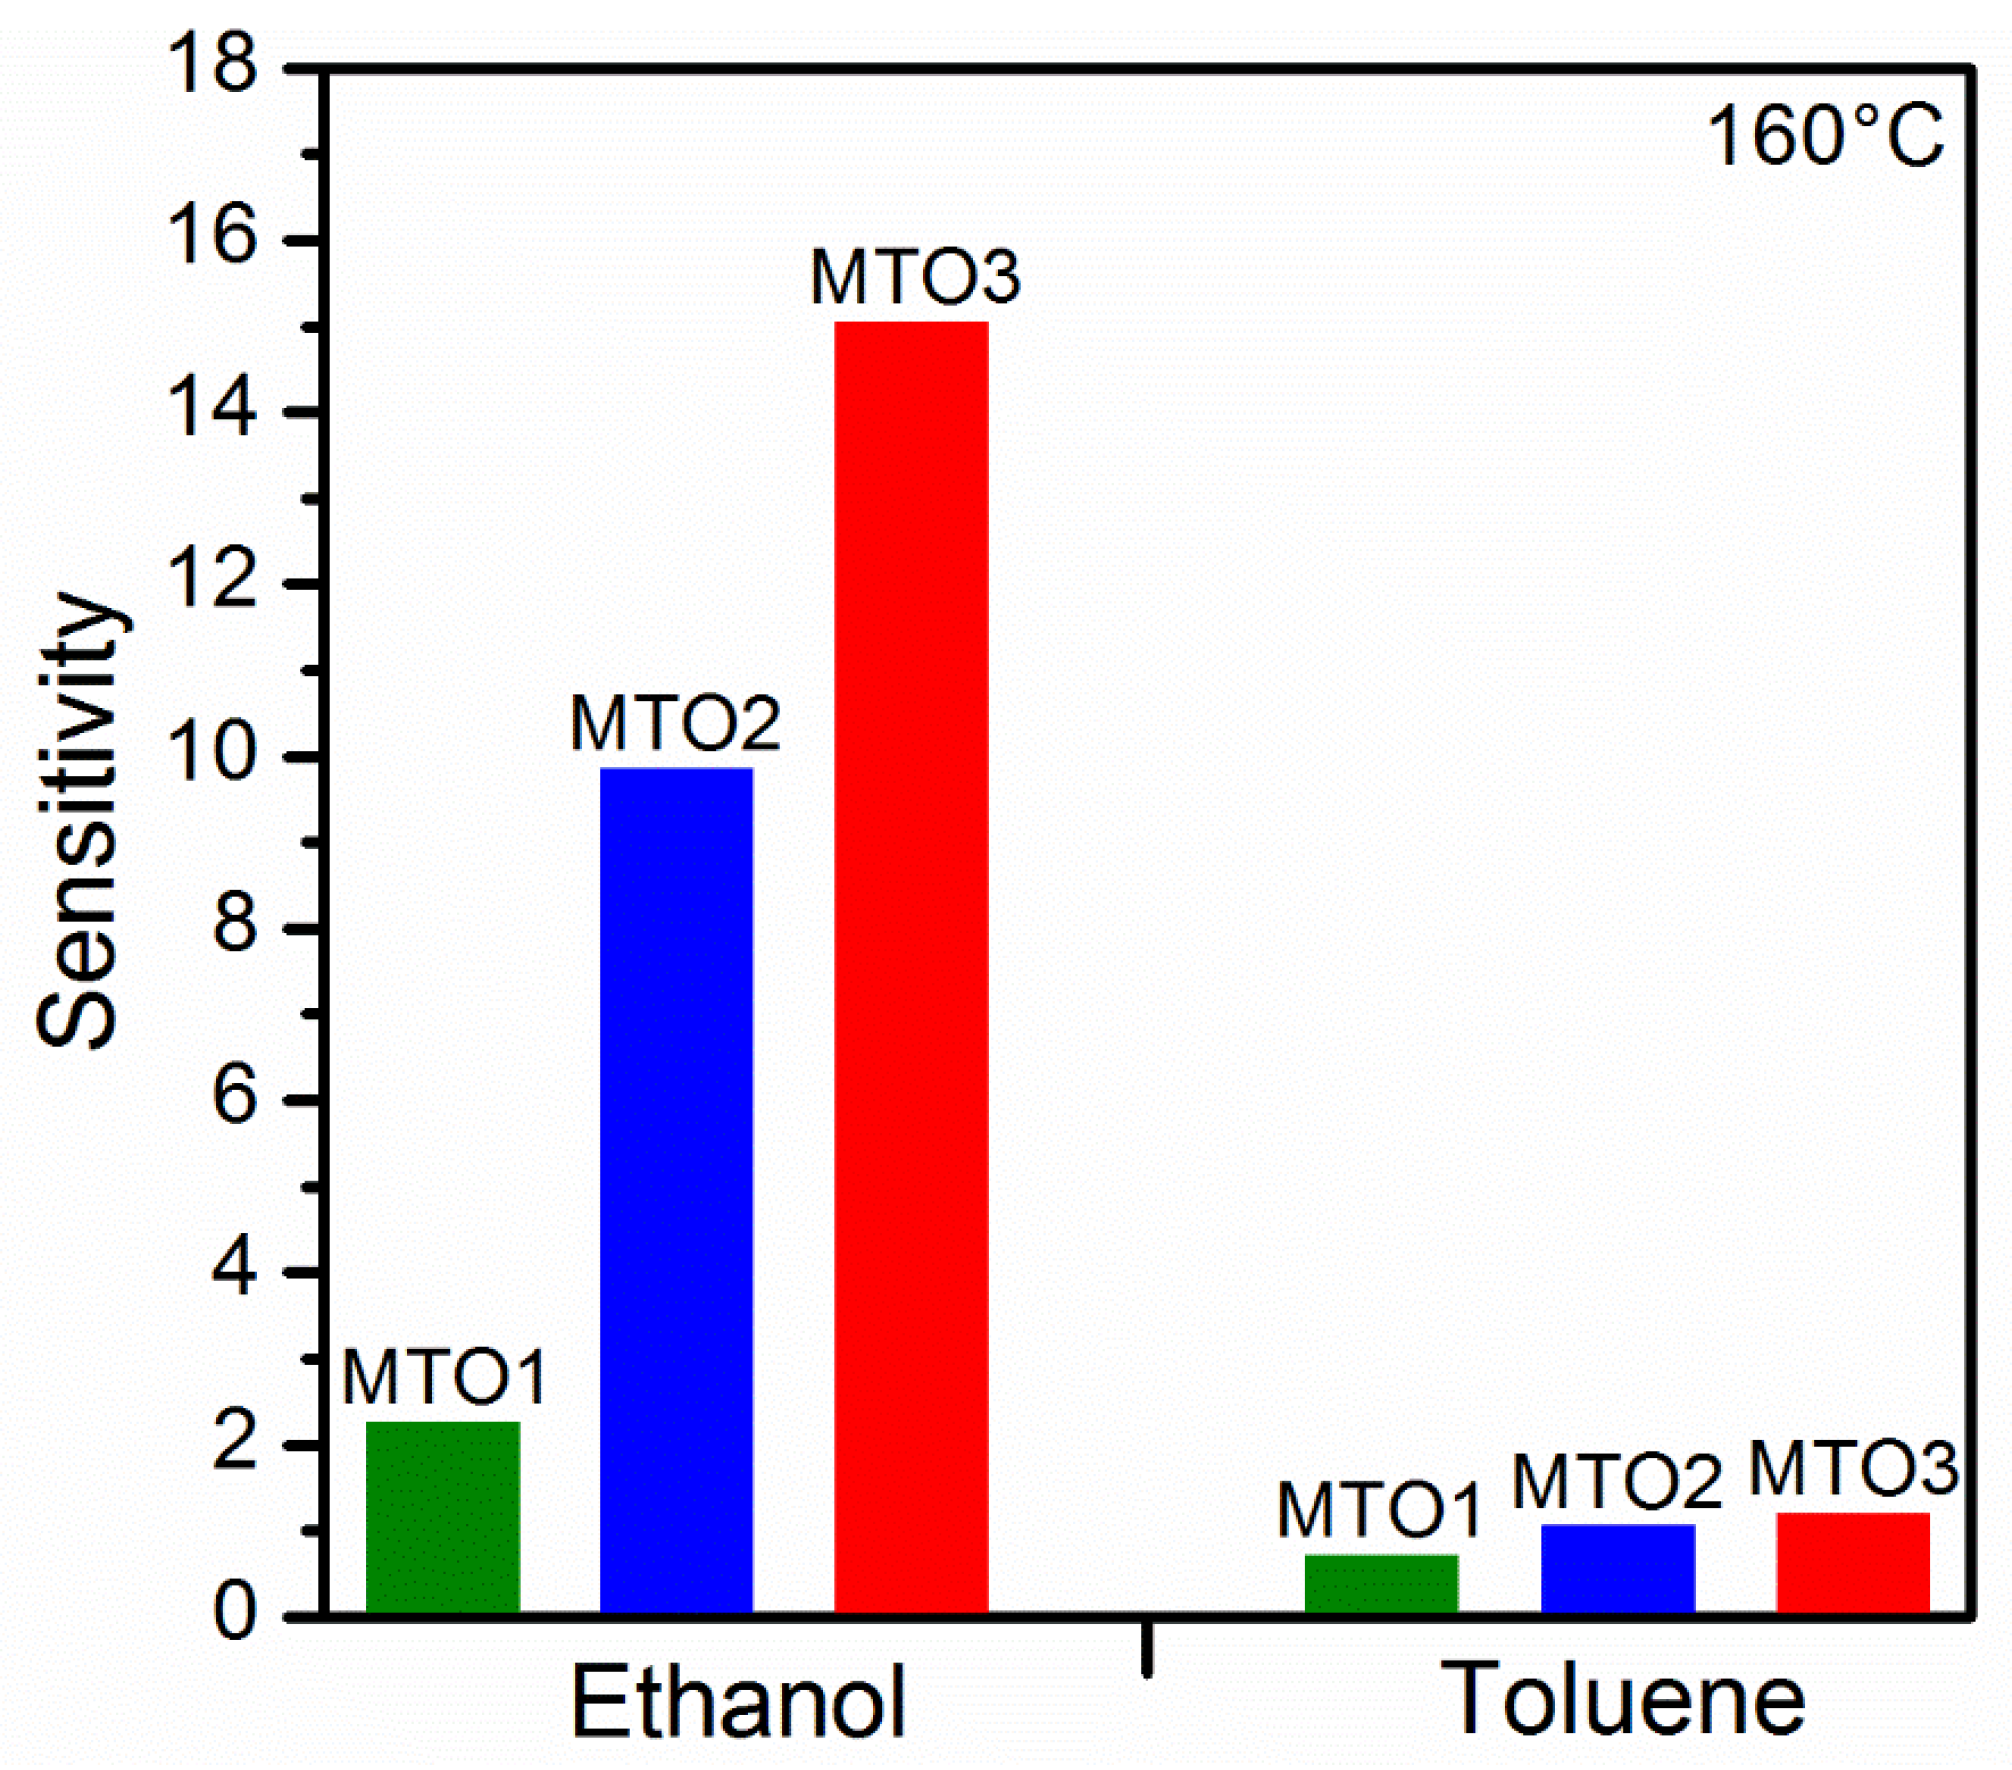
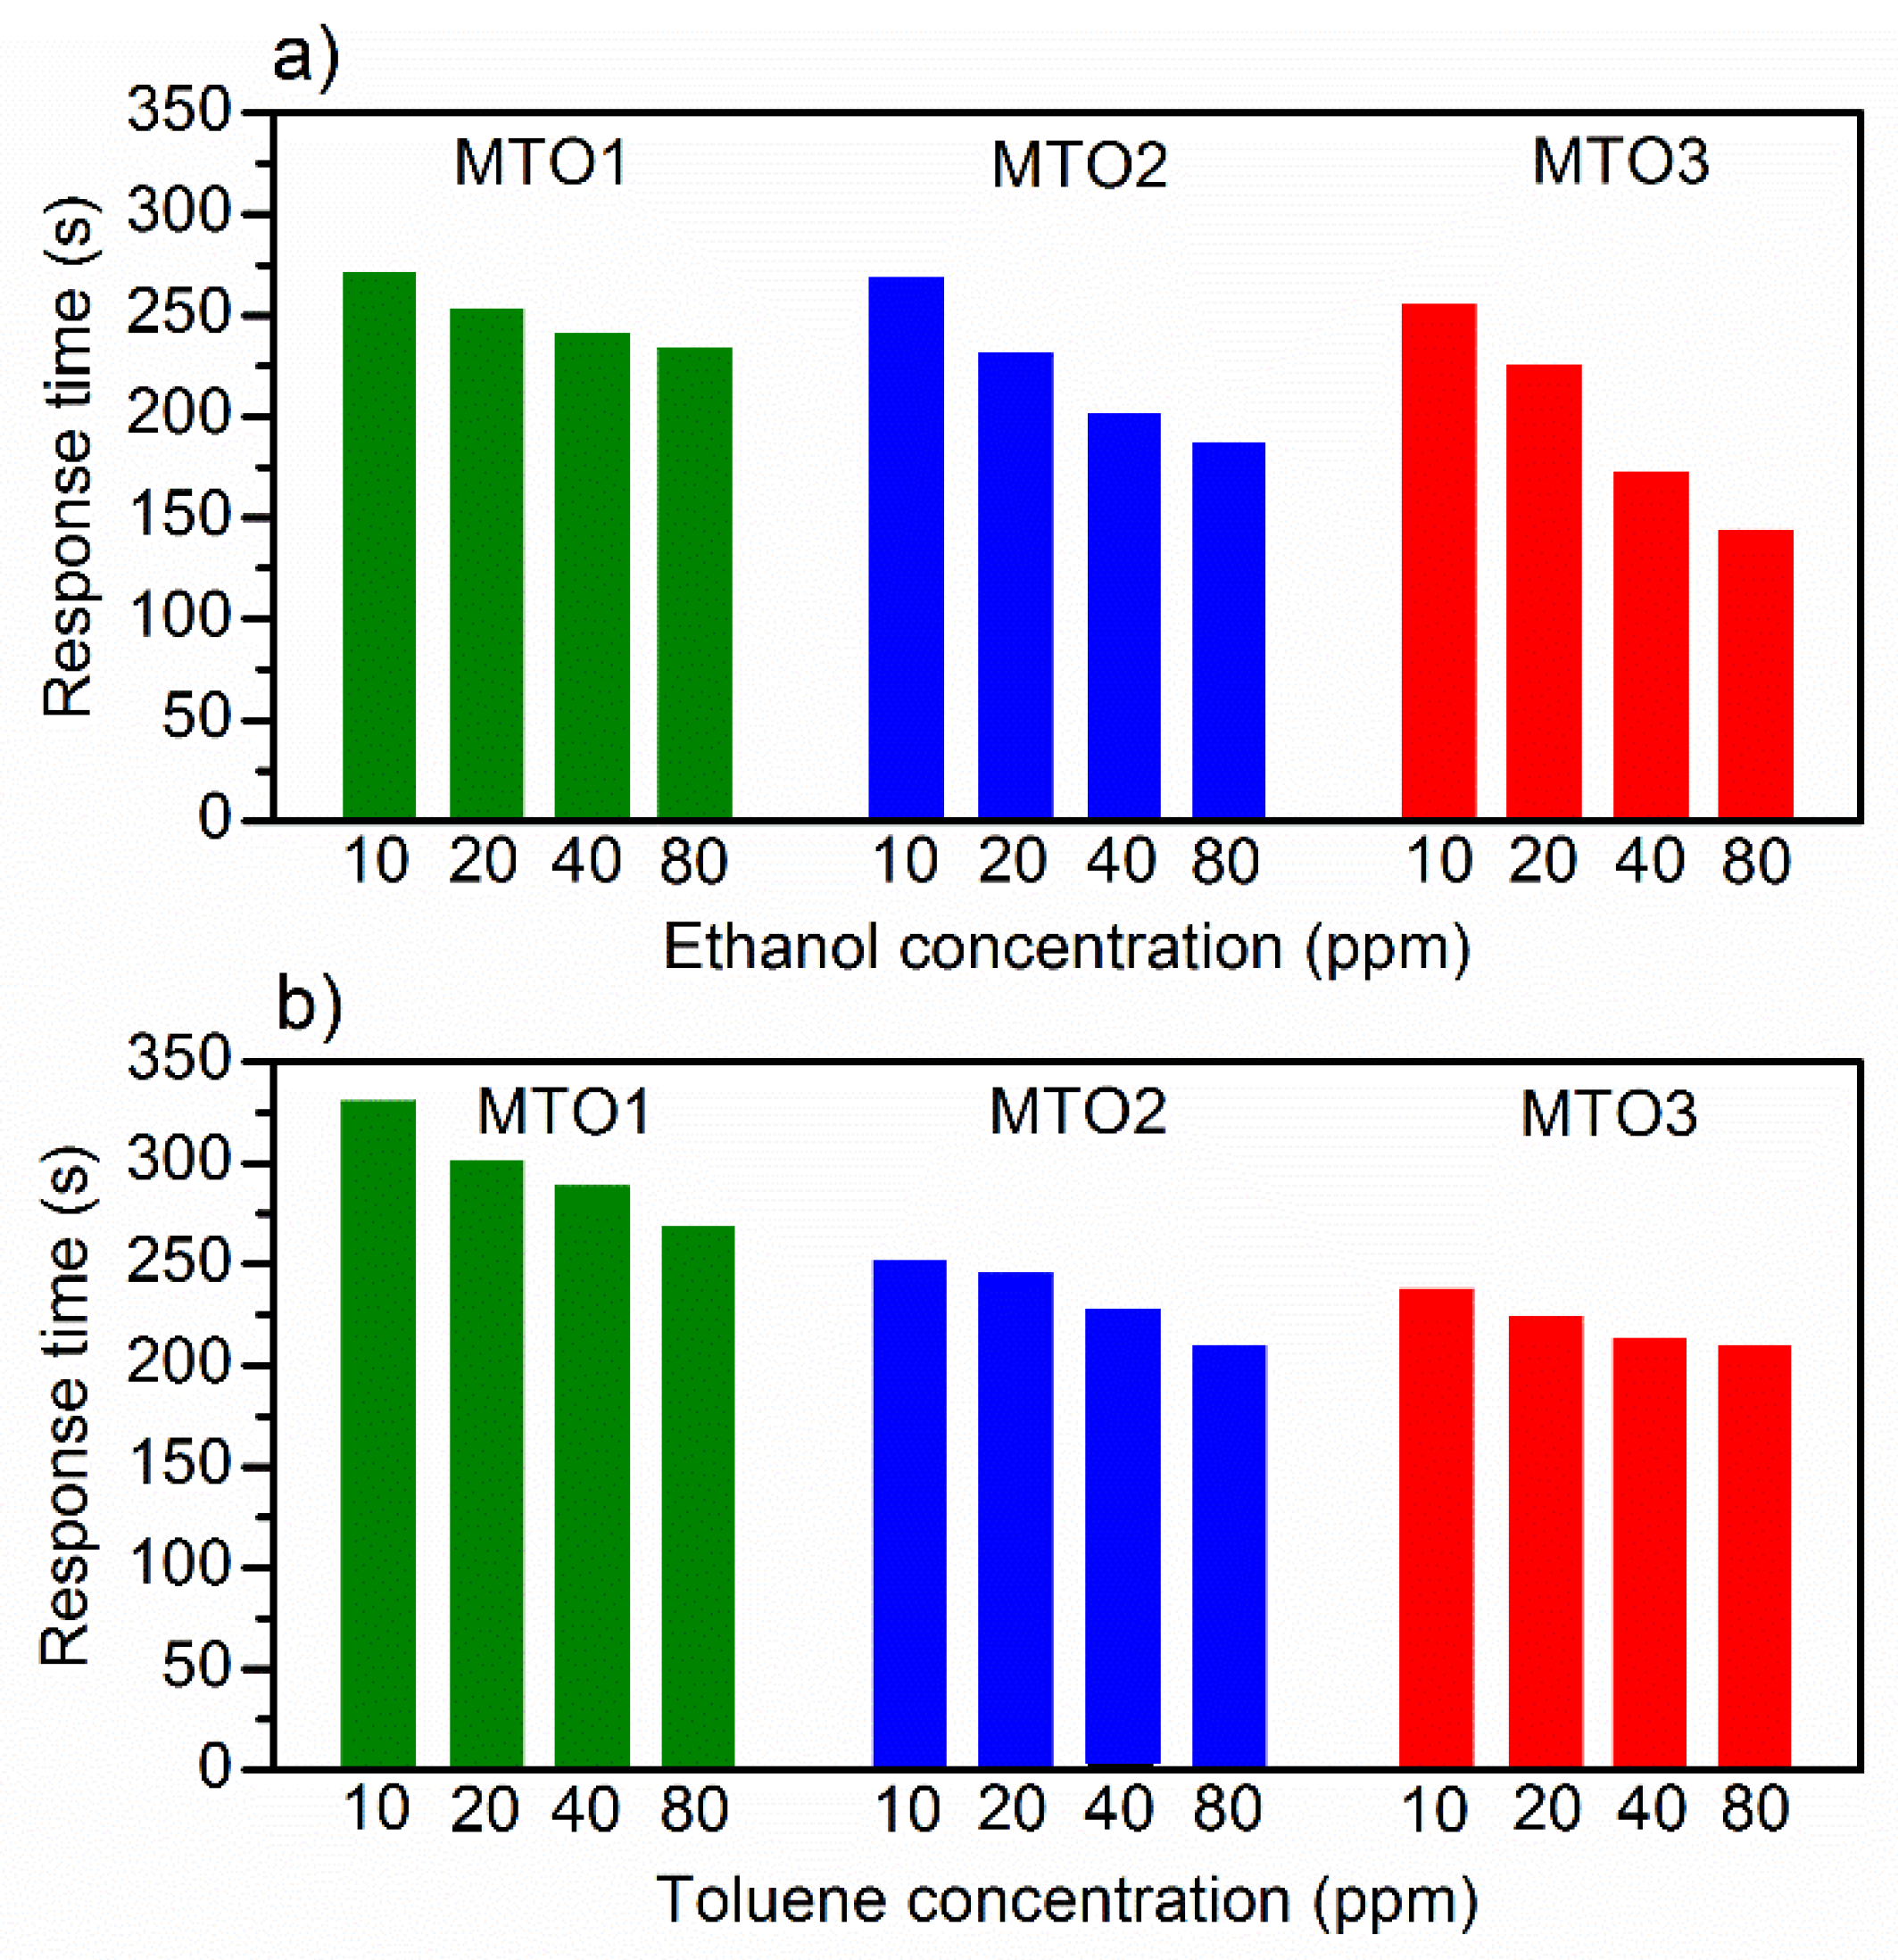
3.2. Gas Sensing Properties

Non-doped and Mg-doped SnO2 films were exposed consecutively to various reductive gases (ethanol, acetone, and toluene) in a concentration of 80 ppm at an operating temperature (Top) of 160 °C. A summary of the response to each analyte and each sample is presented in Figure 7a. These results reveal low responses for the non-doped SnO2 film compared to the Mg-doped SnO2, which show higher responses to the target analytes as the Mg percentage increases in the films (e.g., MTO3 film response to ethanol is almost fourteen times higher than SnO2 film). In contrast, the response time (Figure 7b) shows a decreasing trend as the Mg percentage increases in the films. Generally, the electrical measurements also revealed an increase of the film electrical resistance by more than five orders of magnitude as the Mg percentage increases from 0 at.% to 1.6 at.%. In addition, the dynamic response to ethanol (Figure 8a) displayed a more reproducible and stable signal for the Mg-doped films compared to the non-doped film, particularly for those doped with a higher Mg concentration (MTO3). Similarly, the dynamic response to acetone and toluene showed reproducible and stable signals as shown in (Figure 8b) for the MTO3 samples. The results in Figure 7 and Figure 8b also show better responses towards ethanol than to acetone and toluene, in proportion to the increase of Mg doping. For instance, the MTO3 film responses were 13.5, 3.1, and 2.3 for a concentration of 80 ppm of ethanol, acetone, and toluene, respectively.
Further testing of the Mg-doped SnO2 films to various concentrations of ethanol (highest response) and toluene (lowest response) from 10 ppm to 80 ppm displayed a proportional increase of the response with the gas concentration (Figure 9 and Figure 10). We also observe that by increasing the Mg percentage from 0.8 at.% (MTO1) to 1.6 at.% (MTO3), the response to ethanol increases by two times (from 1.6 to 3) for 10 ppm and by four times (from 3.2 to 13.5) for 80 ppm. Coincidently, we note that the response to ethanol obtained from the MTO1 film to 80 ppm is almost equal to the response obtained from the MTO3 film to 10 ppm. The same behavior, although with lower enhancement than that observed for ethanol, was observed for toluene. Hence, these results demonstrate a major enhancement of the response with the increase of Mg doping in SnO2 film, especially towards ethanol.
Similarly, the film doping level also influences the sensitivity of the films (Figure 11), which could be favorable for tuning of the cross-sensitivity (ΔS). Thus, we observed lower cross-sensitivity and in turn, better selectivity between ethanol and toluene for the samples with higher doping levels (ΔS = 8.8 for MTO2 and ΔS = 13.9 for MTO3) as compared to the sample with low doping concentration (ΔS = 1.6 for MTO1). Thus, the results suggest partial selectivity to ethanol, particularly for the MTO3 films.
Further analysis of the dynamic response of the films (Figure 9) shows that the response time (Figure 12) for ethanol and toluene is inversely related to the gas concentration in both cases. For instance, for ethanol at 80 ppm, the response time decreases from 233 s (MTO1) to 143 s (MTO3), which is 90 s faster, by doubling the Mg percentage in the SnO2 film (from 0.8 at.% to 1.6 at.%). Similar behavior is observed for toluene with a response time decrease of 59 s for MTO3 with respect to MTO1. The results also show a complete recovery of the base line in the three systems, which is accelerated by increasing the Mg percentage in the films (Figure 9).
Overall, the films displayed a low drift of the baseline resistance during each test, most likely connected with the low operating temperature. Despite this, the response magnitudes did not show significant changes. Generally, the MTO3 films showed better medium-term stability displaying 8% and 6% less deviation in the base line resistance during the whole testing period (see experimental section) compared to the MTO1 and MTO2 films, respectively. Further analysis after the testing period and after having exposed the films to all target analytes showed no significant changes in the main core levels XPS spectrum of tin, magnesium, and oxygen, supporting the stability of the film.
Table 2 presents a comparison of our results and those for other materials in the literature. The table summarizes the material synthesis method, testing conditions (concentration, operating temperature), and response reported to ethanol and toluene. In this summary, one can notice the use of various materials for sensing both gases, including intrinsic oxides (e.g., SnO2, WO3, Fe2O3) and modified (e.g., SnO2/ZnO, SnO2/MgAl2O4) or doped (Mg-doped ZnO, Pr-doped SnO2) oxides. Despite the comparison of the data being complex, as gas sensing results depend on not only the sensing material but also the test conditions, we consider these data still meaningful to offer a general idea of the properties of our samples. Overall, we observe that our results are in agreement with the literature and that the responses recorded to ethanol and toluene with our samples are higher or in the same order at a comparatively lower operating temperature (160 °C) and lower concentration (80 ppm) than other works (which show operating temperatures above 200 °C and typically concentrations of 100 ppm). The response time recorded for the works in the literature is in general in the same order of magnitude (hundreds of seconds) as for our films. Table 2 also includes an example of a similar system (i.e., Mg-doped SnO2 via spray pyrolysis) although tested towards a different analyte (LPG—liquid petroleum gas). The response (1.4) of this system to 1000 ppm of LPG was registered at 285 °C.

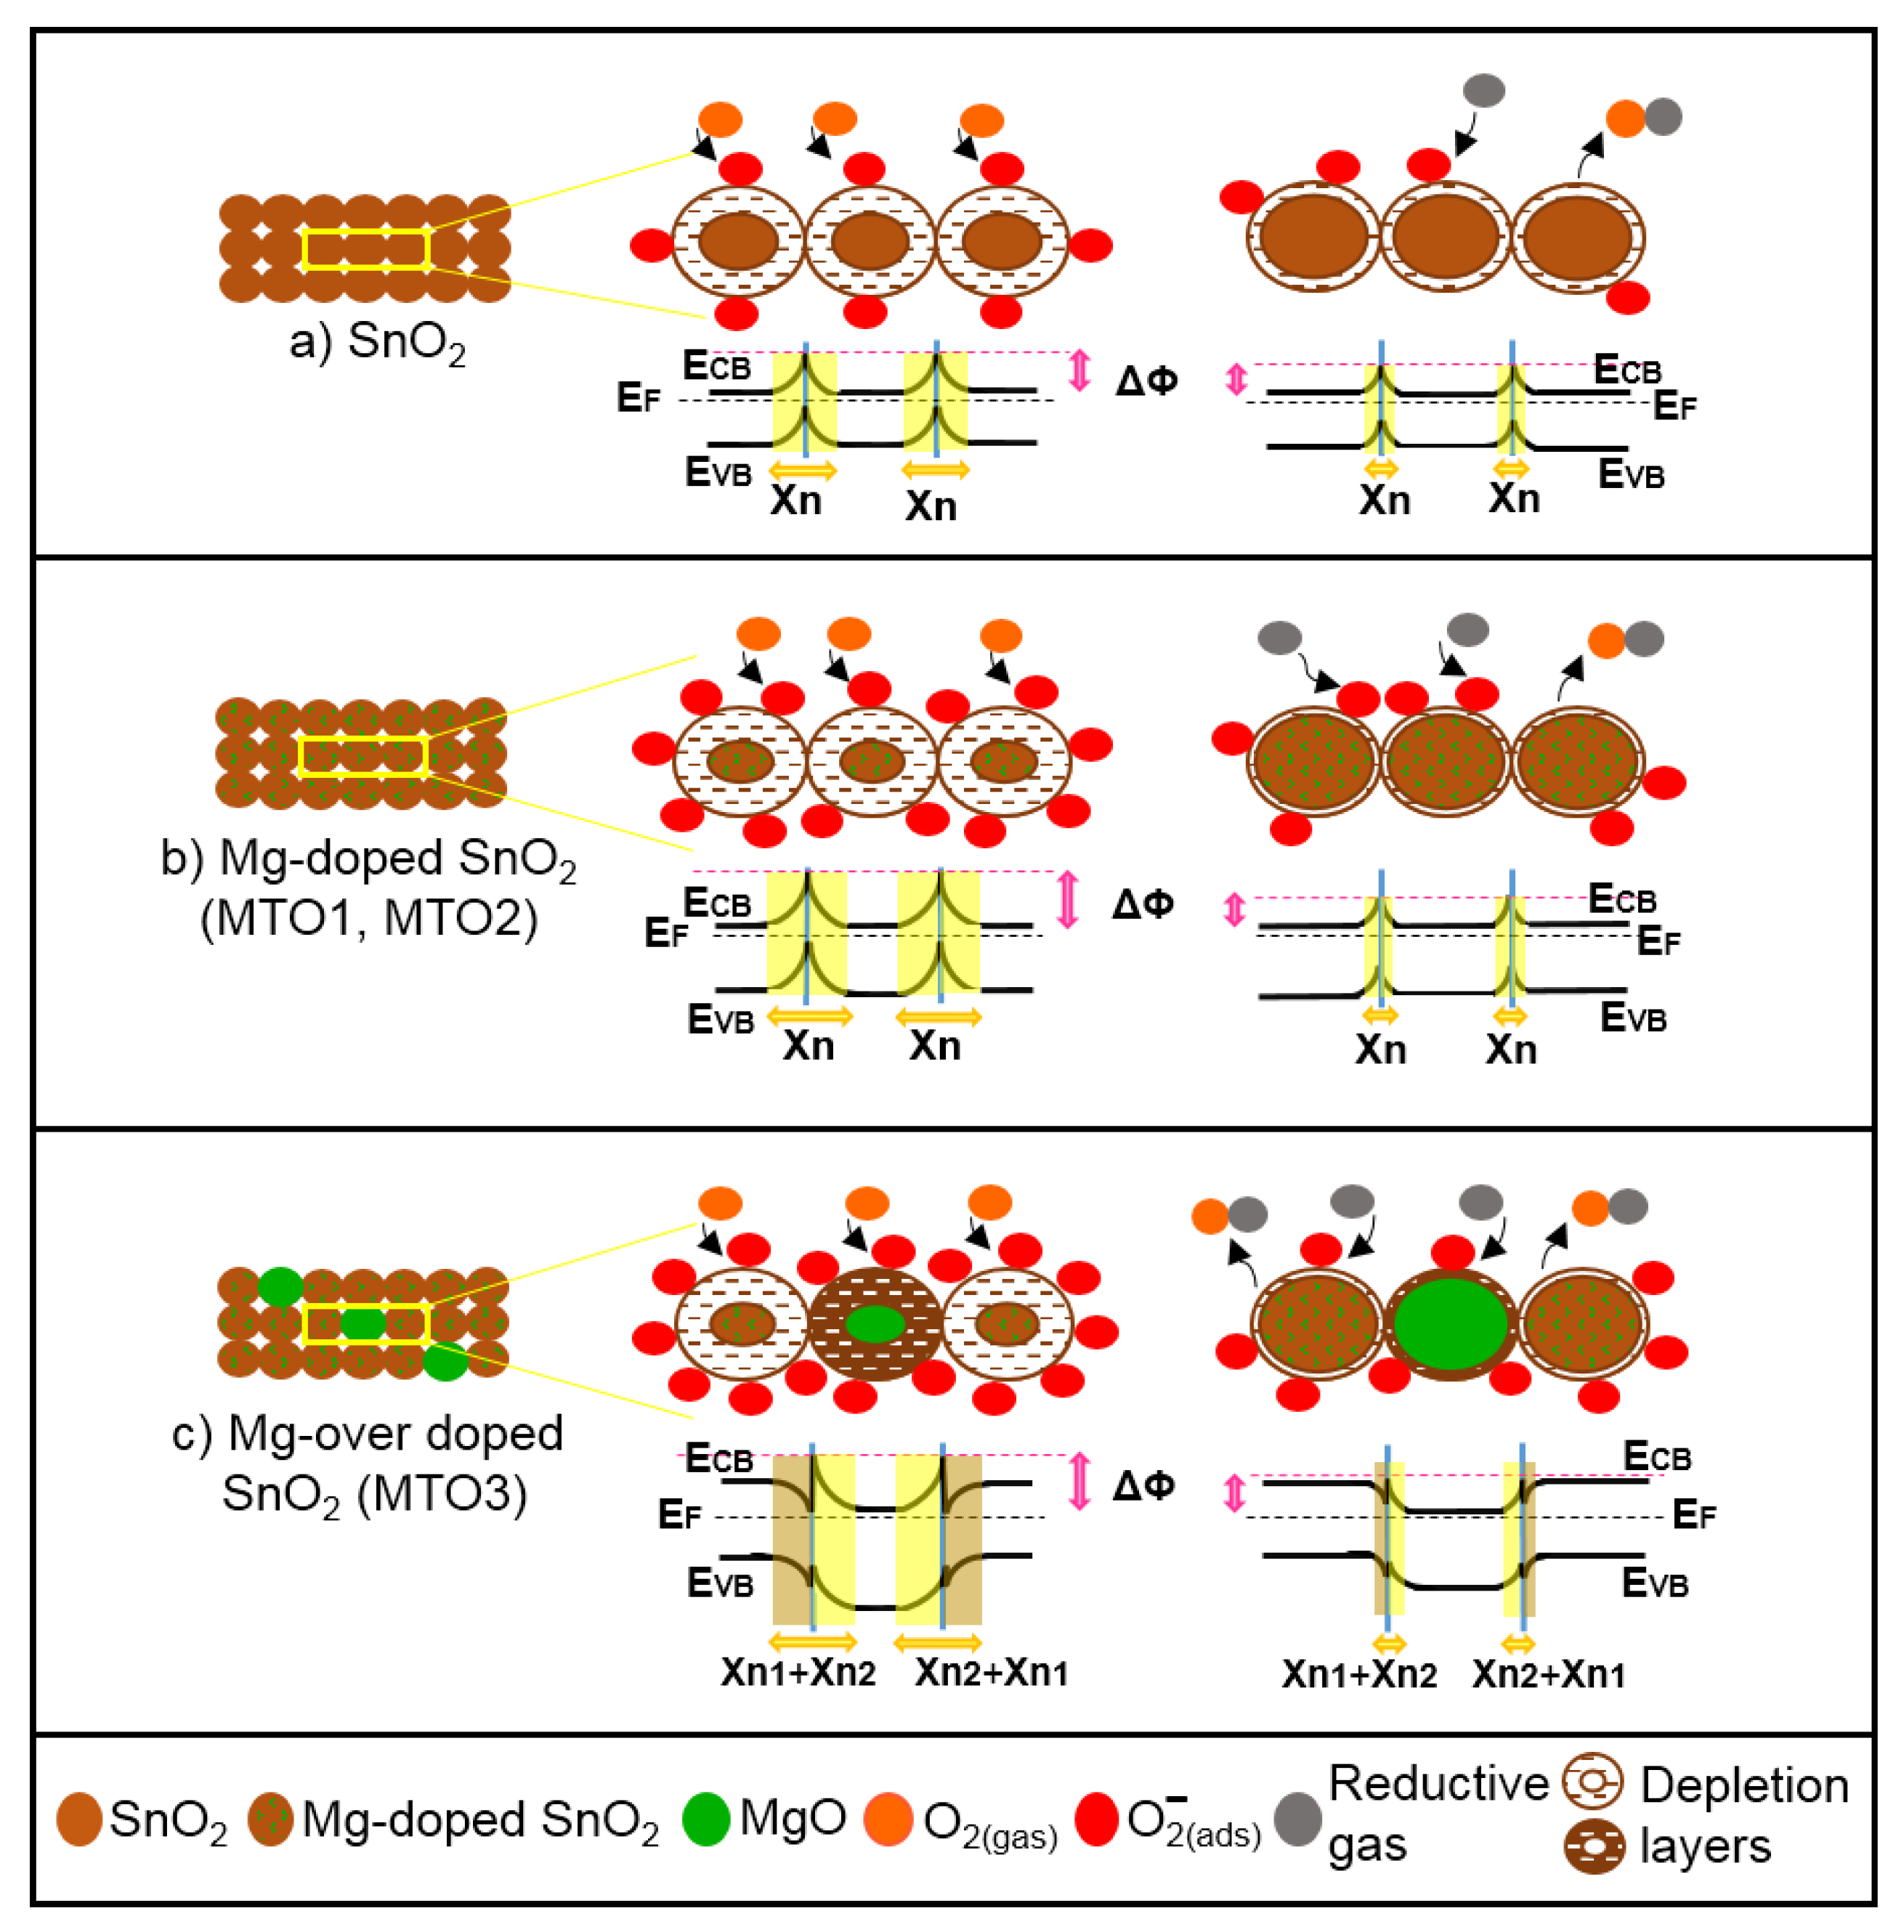
3.3. Gas Sensing Mechanism

Generally, the gas sensing results showed that all films behave as typical n-type semiconductors when exposed to gases, i.e., decreasing the overall electrical resistance in the presence of reducing gases such as ethanol, acetone, and toluene. This is consistence with the most accepted sensing mechanism model proposed in the literature for pristine metal oxides including SnO2 [46]. According to this model (Figure 13a), when SnO2 film is exposed to air, oxygen molecules are adsorbed at the surface and form oxygen ions [47,48] (in our case O2 is formed because the operating temperature is 160 °C [11]), thus extracting electrons from the conduction band. As a result of this electron transfer, a depletion layer is formed and the film electrical resistance is increased. As soon as SnO2 film is exposed to a desired concentration of a reducing gas, such as ethanol, acetone or toluene, the reductive gas molecules will interact with oxygen negative ions and transfer the electrons back to the SnO2 conductive band. Therefore, the depletion layer narrows and the film electrical resistance decreases [46].
This mechanism is similar for the Mg-doped films (Figure 13b). However, in this system the incorporation of Mg into the SnO2 structure enhances the sensing mechanism due to the lattice disorder introduced by the substitution of Sn4+ ions by Mg2+ ions and the subsequent diminution of the crystallite size by nearly three times with respect to the pristine SnO2 films (Table 1). Then, more reactive oxygen molecules are adsorbed in the pre-adsorption cycle and available to interact with the reductive gases [16,49].
The mechanism for the over-doped films (Figure 13c), however, includes a new component, introduced by the second phase particles (i.e., MgO) rather than by the change in crystalline size (notice the crystallite size of MTO1, MTO2, and MTO3 is similar). The presence of second phase particles with low loadings enhances further the sensing mechanism via a ‘spillover effect’ [50], which can be connected with the faster response and recovery time of MTO3 with respect to MTO2 and MTO1. The second phase particles also introduce an extra potential barrier formed between the MgO and Mg-doped SnO2 (heterojunction). This extra potential barrier may accumulate or deplete extra-pre-adsorbed oxygen in the boundary grain to grain, thus maximizing the electrical resistance change in the gas (analyte) adsorption stage, as noticed earlier for other gas sensitive materials with nanoscaled heterojunctions [6,51].
On the other hand, the visibly different morphologies in the films, as result of the Mg doping, could also play a role in the sensing performance by providing a different electrical percolation and possible fluctuations (noise) in the grain boundaries. Although the current dc measurements do not give evidence of the level of these fluctuations, we cannot rule out the presence of a parallel mechanism dependent on the grain boundaries, as noticed previously for ethanol and hydrogen by low-frequency noise measurements [52].

4. Conclusions

Mg-doped SnO2 thin films synthesized via a spray pyrolysis method were investigated for ethanol, acetone, and toluene sensing. Overall, the Mg-doped SnO2 films proved a more reproducible sensing behavior with complete recovery of the base line resistance compared to the non-doped SnO2 films. This paper proposes that increasing the Mg-doping level (from 0.8 at.% to 1.6 at.%) is responsible for the improvement of the sensing properties due to the decrease in the crystallites’ size and to the increase in defects in the SnO2 films. The results indicate that this remarkable improvement is also connected with the formation of MgO, which favors the spillover effects at the film and incorporates extra potential barriers formed between the MgO and the Mg-doped SnO2 grains. Both components (i.e., size reduction and the incorporation of MgO) play an important role in enhancing the ethanol sensing behavior of SnO2, and thus, the response of the 1.6 at.% Mg-doped SnO2 films is four times higher and 90 s faster than the response of the 0.8 at.% Mg-doped SnO2 films.

Author Contributions

All authors (B.B., M.T., N.E.H.T., I.G., S.V. and F.M.) have read and agreed to the published version of the manuscript. B.B. and S.V. wrote the main manuscript text. B.B., N.E.H.T., and F.M. were involved in the synthesis and analysis of the material and B.B., M.T., I.G., and S.V. were involved in the experimental work and/or results analysis of the gas sensing tests. All authors have read and agreed to the published version of the manuscript.

Funding

This work was supported by the Spanish Ministry of Economy and Competitiveness via project TEC2016-79898-C6-1-R (AEI/FEDER, EU) and the ‘Ramón y Cajal’ Programme. Part of this research used the Czech CEITEC Nano Research Infrastructure, supported by MEYS (2016–2019).

Acknowledgments

We acknowledge the support of MINECO (Spain) via project TEC2016-79898-C6-1-R (AEI/FEDER, EU), and MEYS (Czech Republic) via the Czech CEITEC Nano Research Infrastructure. B.B. thanks the Electronic department of Frères Mentouri University, Constantine, Algeria for granting the excellent doctoral student scholarship. S.V. thanks the support of the ‘Ramón y Cajal’ Programme. We are grateful to Milena Šetka for acquiring the XPS spectra.

Conflicts of Interest

The authors declare no conflict of interest.

References

  1. Schütze, A.; Baur, T.; Leidinger, M.; Reimringer, W.; Jung, R.; Conrad, T.; Sauerwald, T. Highly Sensitive and Selective VOC Sensor Systems Based on Semiconductor Gas Sensors: How to? Environment 2017, 4, 20. [Google Scholar] [CrossRef] [Green Version]
  2. Yoon, J.-W.; Lee, J.-H. Toward breath analysis on a chip for disease diagnosis using semiconductor-based chemiresistors: Recent progress and future perspectives. LAB CHIP 2017, 17, 3537–3557. [Google Scholar] [CrossRef] [PubMed]
  3. Kumar, M.; Gupta, A.K.; Kumar, D. Mg-doped TiO2 thin films deposited by low cost technique for CO gas monitoring. Ceram. Int. 2016, 42, 405–410. [Google Scholar] [CrossRef]
  4. Vallejos, S.; Gràcia, I.; Lednický, T.; Vojkuvka, L.; Figueras, E.; Hubálek, J.; Cané, C. Highly hydrogen sensitive micromachined sensors based on aerosol-assisted chemical vapor deposited ZnO rods. Sens. Actuators B Chem. 2018, 268, 15–21. [Google Scholar] [CrossRef]
  5. Vallejos, S.; Selina, S.; Annanouch, F.E.; Gràcia, I.; Llobet, E.; Blackman, C. Aerosol assisted chemical vapour deposition of gas sensitive SnO2 and Au-functionalised SnO2 nanorods via a non-catalysed vapour solid (VS) mechanism. Sci. Rep. 2016, 6, 28464. [Google Scholar] [CrossRef] [PubMed] [Green Version]
  6. Vallejos, S.; Gràcia, I.; Figueras, E.; Cané, C. Nanoscale heterostructures based on Fe2O3@ WO3-x nanoneedles and their direct integration into flexible transducing platforms for toluene sensing. ACS Appl. Mater. Interfaces 2015, 7, 18638–18649. [Google Scholar] [CrossRef]
  7. Lou, Z.; Deng, J.; Wang, L.; Wang, L.; Fei, T.; Zhang, T. Toluene and ethanol sensing performances of pristine and PdO-decorated flower-like ZnO structures. Sens. Actuators B Chem. 2013, 176, 323–329. [Google Scholar] [CrossRef]
  8. Fu, J.; Zhao, C.; Zhang, J.; Peng, Y.; Xie, E. Enhanced gas sensing performance of electrospun Pt-functionalized NiO nanotubes with chemical and electronic sensitization. ACS Appl. Mater. Interfaces 2013, 5, 7410–7416. [Google Scholar] [CrossRef]
  9. Tomić, M.; Šetka, M.; Chmela, O.; Gràcia, I.; Figueras, E.; Cané, C.; Vallejos, S. Cerium Oxide-Tungsten Oxide Core-Shell Nanowire-Based Microsensors Sensitive to Acetone. Biosensors 2018, 8, 116. [Google Scholar] [CrossRef] [Green Version]
  10. Zhang, Q.; Zhou, Q.; Lu, Z.; Wei, Z.; Xu, L.; Gui, Y. Recent advances of SnO2-based sensors for detecting fault characteristic gases extracted from power transformer oil. Front. Chem. 2018, 6, 364. [Google Scholar] [CrossRef] [Green Version]
  11. Belmonte, J.C.; Manzano, J.; Arbiol, J.; Cirera, A.; Puigcorbe, J.; Vila, A.; Sabate, N.; Gracia, I.; Cane, C.; Morante, J. Micromachined twin gas sensor for CO and O2 quantification based on catalytically modified nano-SnO2. Sens. Actuators B Chem. 2006, 114, 881–892. [Google Scholar] [CrossRef]
  12. Liu, S.; Sun, Q.; Wang, J.; Hou, H. Charge imbalance induced oxygen-adsorption enhances the gas-sensing properties of Al-doped SnO2 powders. J. Phys. Chem. Solids 2019, 124, 163–168. [Google Scholar] [CrossRef]
  13. Kang, J.-g.; Park, J.-S.; Lee, H.-J. Pt-doped SnO2 thin film based micro gas sensors with high selectivity to toluene and HCHO. Sens. Actuators B Chem. 2017, 248, 1011–1016. [Google Scholar] [CrossRef]
  14. Liang, Y.-C.; Lee, C.-M.; Lo, Y.-J. Reducing gas-sensing performance of Ce-doped SnO2 thin films through a cosputtering method. RSC Adv. 2017, 7, 4724–4734. [Google Scholar] [CrossRef] [Green Version]
  15. Li, W.; Ma, S.; Li, Y.; Li, X.; Wang, C.; Yang, X.; Cheng, L.; Mao, Y.; Luo, J.; Gengzang, D. Preparation of Pr-doped SnO2 hollow nanofibers by electrospinning method and their gas sensing properties. J. Alloy. Compd. 2014, 605, 80–88. [Google Scholar] [CrossRef]
  16. Guan, Y.; Wang, D.; Zhou, X.; Sun, P.; Wang, H.; Ma, J.; Lu, G. Hydrothermal preparation and gas sensing properties of Zn-doped SnO2 hierarchical architectures. Sens. Actuators B Chem. 2014, 191, 45–52. [Google Scholar] [CrossRef]
  17. Amin, M.; Shah, N.A.; Bhatti, A.S.; Malik, M.A. Effects of Mg doping on optical and CO gas sensing properties of sensitive ZnO nanobelts. CrystEngComm 2014, 16, 6080–6088. [Google Scholar] [CrossRef]
  18. Goudarzi, S.; Khojier, K. Role of substrate temperature on the ammonia gas sensing performance of Mg-doped ZnO thin films deposited by spray pyrolysis technique: Application in breath analysis devices. Appl. Phys. A 2018, 124, 601. [Google Scholar] [CrossRef]
  19. Vinoth, E.; Gowrishankar, S.; Gopalakrishnan, N. Effect of Mg doping in the gas-sensing performance of RF-sputtered ZnO thin films. Appl. Phys. A 2018, 124, 433. [Google Scholar] [CrossRef]
  20. Karthick, K.; Srinivasan, D.; Christopher, J.B. Fabrication of highly c-axis Mg doped ZnO on c-cut sapphire substrate by rf sputtering for hydrogen sensing. J. Mater. Sci-Mater. Elec. 2017, 28, 11979–11986. [Google Scholar] [CrossRef]
  21. Kwak, C.-H.; Woo, H.-S.; Abdel-Hady, F.; Wazzan, A.; Lee, J.-H. Vapor-phase growth of urchin-like Mg-doped ZnO nanowire networks and their application to highly sensitive and selective detection of ethanol. Sens. Actuators B Chem. 2016, 223, 527–534. [Google Scholar] [CrossRef]
  22. Jo, Y.-M.; Lee, C.-S.; Wang, R.; Park, J.-S.; Lee, J.-H. Highly sensitive and selective ethanol sensors using magnesium doped indium oxide hollow spheres. J. Korean Ceram. Soc. 2017, 54, 303–307. [Google Scholar] [CrossRef] [Green Version]
  23. He, H.; Xie, Z.; Li, Q.; Niu, H. On the possibility of p-type doping of SnO2 with Mg: A first-principles study. J. Comput. Mater. Sci. 2015, 101, 62–65. [Google Scholar] [CrossRef]
  24. Khatami, S.M.N. Modeling and Spray Pyrolysis Processing of Mixed Metal Oxide Nano-Composite Gas Sensor Films. Ph.D. Thesis, University of Central Florida, Orlando, FL, USA, 2014. Available online: http://purl.fcla.edu/fcla/etd/CFE0005817 (accessed on 11 March 2020).
  25. Falcony, C.; Aguilar-Frutis, M.A.; García-Hipólito, M. Spray pyrolysis technique; high-K dielectric films and luminescent materials: A review. Micromachines 2018, 9, 414. [Google Scholar] [CrossRef] [PubMed] [Green Version]
  26. Touidjen, N.H.; Bendahmane, B.; Lamri Zeggar, M.; Mansour, F.; Aida, M. SnO2 thin film synthesis for organic vapors sensing at ambient temperature. Sens. Biosensing Res. 2016, 11, 52. [Google Scholar] [CrossRef] [Green Version]
  27. Bendahmane, B.; Touidjen, N.H.; Mansour, F. Characterization of SnO2 Thin Films Fabricated by Chemical Spray Pyrolysis. In Proceedings of the International Conference on Advanced Electrical Engineering (ICAEE), Algiers, Algeria, 19–21 November 2019; IEEE, 2020; pp. 1–6. [Google Scholar] [CrossRef]
  28. Vallejos, S.; Grácia, I.; Chmela, O.; Figueras, E.; Hubálek, J.; Cané, C. Chemoresistive micromachined gas sensors based on functionalized metal oxide nanowires: Performance and reliability. Sens. Actuators B Chem. 2016, 235, 525–534. [Google Scholar] [CrossRef] [Green Version]
  29. Shajira, P.; Bushiri, M.J.; Nair, B.B.; Prabhu, V.G. Energy band structure investigation of blue and green light emitting Mg doped SnO2 nanostructures synthesized by combustion method. J. Lumin. 2014, 145, 425–429. [Google Scholar] [CrossRef]
  30. Mazumder, N.; Bharati, A.; Saha, S.; Sen, D.; Chattopadhyay, K. Effect of Mg doping on the electrical properties of SnO2 nanoparticles. Curr. Appl. Phys. 2012, 12, 975–982. [Google Scholar] [CrossRef]
  31. Papadopoulos, N.; Tsakiridis, P.; Hristoforou, E. Structural and electrical properties of undoped SnO2 films developed by a low cost CVD technique with two different methods: Comparative study. J. Opt. Adv. Mat. 2005, 7, 2693–2706. Available online: https://dspace.lib.ntua.gr/xmlui/handle/123456789/16827 (accessed on 11 March 2020).
  32. Kwoka, M.; Ottaviano, L.; Passacantando, M.; Santucci, S.; Czempik, G.; Szuber, J. XPS study of the surface chemistry of L-CVD SnO2 thin films after oxidation. Thin Solid Films 2005, 490, 36–42. [Google Scholar] [CrossRef]
  33. Aragón, F.H.; Gonzalez, I.; Coaquira, J.A.; Hidalgo, P.; Brito, H.F.; Ardisson, J.D.; Macedo, W.A.; Morais, P.C. Structural and surface study of praseodymium-doped SnO2 nanoparticles prepared by the polymeric precursor method. J. Phys. Chem. C 2015, 119, 8711–8717. [Google Scholar] [CrossRef]
  34. Huang, Q.; Li, X.; Liu, T.; Wu, H.; Liu, X.; Feng, Q.; Liu, Y. Enhanced SaOS-2 cell adhesion, proliferation and differentiation on Mg-incorporated micro/nano-topographical TiO2 coatings. Appl. Surf. Sci. 2018, 447, 767–776. [Google Scholar] [CrossRef]
  35. Zhou, Y.; Peng, J.; Wang, M.; Mo, J.; Deng, C.; Zhu, M. Tribochemical Behavior of Pure Magnesium During Sliding Friction. Metals 2019, 9, 311. [Google Scholar] [CrossRef] [Green Version]
  36. Dubecký, F.; Kindl, D.; Hubík, P.; Mičušík, M.; Dubecký, M.; Boháček, P.; Vanko, G.; Gombia, E.; Nečas, V.; Mudroň, J. A comparative study of Mg and Pt contacts on semi-insulating GaAs: Electrical and XPS characterization. Appl. Surf. Sci. 2017, 395, 131–135. [Google Scholar] [CrossRef]
  37. Kaur, H.; Bhatti, H.S.; Singh, K. Europium doping effect on 3D flower-like SnO2 nanostructures: Morphological changes, photocatalytic performance and fluorescence detection of heavy metal ion contamination in drinking water. RSC Adv. 2019, 9, 37450–37466. [Google Scholar] [CrossRef] [Green Version]
  38. Jayanthi, K.; Chawla, S.; Sood, K.; Chhibara, M.; Singh, S. Dopant induced morphology changes in ZnO nanocrystals. Appl. Surf. Sci. 2009, 255, 5869–5875. [Google Scholar] [CrossRef]
  39. Nithyavathy, N.; Arunmetha, S.; Vinoth, M.; Sriram, G.; Rajendran, V. Fabrication of Nanocomposites of SnO2 and MgAl2O4 for Gas Sensing Applications. J. Electron. Mater. 2016, 45, 2193–2205. [Google Scholar] [CrossRef]
  40. Xu, H.; Ju, D.; Chen, Z.; Han, R.; Zhai, T.; Yu, H.; Liu, C.; Wu, X.; Wang, J.; Cao, B. A novel hetero-structure sensor based on Au/Mg-doped TiO2/SnO2 nanosheets directly grown on Al2O3 ceramic tubes. Sens. Actuators B Chem. 2018, 273, 328–335. [Google Scholar] [CrossRef]
  41. Khoang, N.D.; Van Duy, N.; Hoa, N.D.; Van Hieu, N. Design of SnO2/ZnO hierarchical nanostructures for enhanced ethanol gas-sensing performance. Sens. Actuators B Chem. 2012, 174, 594–601. [Google Scholar] [CrossRef]
  42. Tian, J.; Wang, J.; Hao, Y.; Du, H.; Li, X. Toluene sensing properties of porous Pd-loaded flower-like SnO2 microspheres. Sens. Actuators B Chem. 2014, 202, 795–802. [Google Scholar] [CrossRef]
  43. Wang, S.; Wang, Y.; Zhang, H.; Gao, X.; Yang, J.; Wang, Y. Fabrication of porous α-Fe2O3 nanoshuttles and their application for toluene sensors. RSC Adv. 2014, 4, 30840–30849. [Google Scholar] [CrossRef]
  44. Wang, L.; Deng, J.; Lou, Z.; Zhang, T. Nanoparticles-assembled Co3O4 nanorods p-type nanomaterials: One-pot synthesis and toluene-sensing properties. Sens. Actuators B Chem. 2014, 201, 1–6. [Google Scholar] [CrossRef]
  45. Thomas, B.; Skariah, B. Spray deposited Mg-doped SnO2 thin film LPG sensor: XPS and EDX analysis in relation to deposition temperature and doping. J. Alloy. Compd. 2015, 625, 231–240. [Google Scholar] [CrossRef]
  46. Barsan, N.; Weimar, U. Conduction model of metal oxide gas sensors. J. Electroceram. 2001, 7, 143–167. [Google Scholar] [CrossRef]
  47. Lenaerts, S.; Roggen, J.; Maes, G. FT-IR characterization of tin dioxide gas sensor materials under working conditions. Spectrochim. Acta A 1995, 51, 883–894. [Google Scholar] [CrossRef]
  48. Sinha, M.; Mahapatra, R.; Mondal, B.; Maruyama, T.; Ghosh, R. Ultrafast and reversible gas-sensing properties of ZnO nanowire arrays grown by hydrothermal technique. J. Phys. Chem. C 2016, 120, 3019–3025. [Google Scholar] [CrossRef]
  49. Xu, C.; Tamaki, J.; Miura, N.; Yamazoe, N. Grain size effects on gas sensitivity of porous SnO2-based elements. Sens. Actuators B Chem. 1991, 3, 147–155. [Google Scholar] [CrossRef]
  50. Kohl, D. The role of noble metals in the chemistry of solid-state gas sensors. Sens. Actuators B Chem. 1990, 1, 158–165. [Google Scholar] [CrossRef]
  51. Miller, D.R.; Akbar, S.A.; Morris, P.A. Nanoscale metal oxide-based heterojunctions for gas sensing: A review. Sens. Actuators B Chem. 2014, 204, 250–272. [Google Scholar] [CrossRef]
  52. Ederth, J.; Smulko, J.; Kish, L.B.; Heszler, P.; Granqvist, C.G. Comparison of classical and fluctuation-enhanced gas sensing with PdxWO3 nanoparticle films. Sens. Actuators B Chem. 2006, 113, 310–315. [Google Scholar] [CrossRef]
Figure 1. Schematic view of the gas sensing measurement system.
Sensors 20 02158 g001
Figure 2. XRD patterns of the Mg-doped SnO2 thin films, (a) 0.8 at.% magnesium-doped tin dioxide (MTO1); (b) 1.2 at.% magnesium-doped tin dioxide (MTO2); (c) 1.6 at.% magnesium-doped tin dioxide (MTO3).
Sensors 20 02158 g002
Figure 3. SEM micrographs of the Mg-doped SnO2 thin films, (a) MTO1; (b) MTO2; (c) MTO3.
Sensors 20 02158 g003
Figure 4. XPS survey spectra of the Mg-doped SnO2 thin films, (a) MTO1; (b) MTO2; (c) MTO3.
Sensors 20 02158 g004
Figure 5. Deconvolution of O 1s (left figure) and Sn 3d (right figure) XPS core level spectra, ((a) and (d)) MTO1; ((b) and (e)) MTO2; ((c) and (f)) MTO3. The circles denote experimental data, colored lines demonstrate the deconvolution of peaks, and the black line corresponds to the sum of peaks fits (envelope).
Sensors 20 02158 g005
Figure 6. XPS of (a) Mg 1s core level spectra and ((b)−(d)) Mg KLL Auger spectra at MTO1, MTO2, and MTO3. The circles denote experimental data, colored lines demonstrate the deconvolution of peaks, and the black line corresponds to the sum of peaks fits (envelope).
Sensors 20 02158 g006
Figure 7. Response (a) and response time (b) towards 80 ppm of ethanol, acetone, and toluene for the non-doped and Mg-doped SnO2 films.
Sensors 20 02158 g007
Figure 8. Response of the (a) non-doped and Mg-doped SnO2 films to 80 ppm of ethanol and (b) MTO3 response to 80 ppm of toluene, acetone, and ethanol recorded at 160 °C.
Sensors 20 02158 g008
Figure 9. Dynamic response curves of Mg-doped SnO2 films at different concentrations of ethanol (left figure) and toluene (right figure).
Sensors 20 02158 g009
Figure 10. Response of Mg-doped SnO2 films vs. (a) ethanol and (b) toluene concentration at 160 °C.
Sensors 20 02158 g010
Figure 11. Sensitivity of the Mg-doped SnO2 films to ethanol and toluene.
Sensors 20 02158 g011
Figure 12. Response time to various concentrations of (a) ethanol, and (b) toluene.
Sensors 20 02158 g012
Figure 13. Schematic representation of the gas sensing mechanisms of (a) non-doped and (b and c) Mg-doped SnO2 films in air (left) and reductive gas (right). ECB is the bottom of conduction band; EF is the bulk Fermi level; EVB is the top of valence band; ΔΦ is the built-in potential barrier; Χn, and Χn2 are depth of the depletion layer from the surface; Χn1 is the depth of the accumulation layer from the surface (not to scale).
Sensors 20 02158 g013
Table 1. Lattice parameters and average crystalline size of the Mg-doped SnO2 thin films.
SampleUnit Cell ParametersUnit Cell Volume Average Crystallite Size
a=b (Å)c (Å)α = β = γV = a2c3)D (nm)
SnO24.7323.18790°71.3926 *
MTO14.7393.18790°71.589.8
MTO24.7423.18190°71.519.6
MTO34.7423.18190°71.519.5
* SnO2 average crystallite size was estimated in our previous work [27].
Table 2. Summary of the materials, testing conditions and responses to ethanol and toluene reported in the literature and in our work for MTO3.
MaterialMethodMorphologyConcentration (ppm)Top (°C)Ra/Rgtres (s)Ref
Mg-doped SnO2Spray pyrolysisNanospheresEthanol
80
16013.5143This work
SnO2/
MgAl2O4
solid-state and sol-gelNanocompositesEthanol
100
2273.33 *--[39]
Au/Mg-TiO2/SnO2HydrothermalHeterostructure nanosheetsEthanol
50
2607--[40]
Mg-doped ZnORF magnetron sputteringRod-likeEthanol
50
1002.32 *--[19]
Ce-doped SnO2CosputteringNanostructuresEthanol
100
22554[14]
Zn-doped SnO2HydrothermalHierarchical architecturesEthanol
100
21313.8--[16]
SnO2/ZnOHydrothermalNanostructuresEthanol
100
4006.2--[41]
Al-doped SnO2Chemical synthesispowdersEthanol
100
28035.25--[12]
Pr-doped SnO2Electro-spinningHollow nanofibersEthanol
100
30028.62168[15]
Mg-doped SnO2Spray pyrolysisNanospheresToluene
80
1602.3209This work
SnO2HydrothermalFlower microstructuresToluene
10
2501--[42]
Pt-doped SnO2LPCVDIsland-like structuresToluene
25
4406--[13]
PdO-decorated ZnOHydrothermalFlower nanostructuresToluene
100
1601.9--[7]
Fe2O3HydrothermalNanoshuttlesToluene
100
4402.35[43]
Co3O4SolvothermalNanorodsToluene
200
1203--[44]
WO3Vapor phase synthesisNanoneedlesToluene
100
2502.2398[6]
Pt@WO3Vapor phase synthesisNPs@NNsToluene
100
2507100[6]
Fe2O3@WO3Vapor phase synthesisNPs@NNsToluene
100
2508150[6]
Mg-doped SnO2Spray pyrolysisLeaf-like grainsLPG
1000
2851.4 *--[45]
Top: temperature of operation, tres: response time, * Ra/Rg calculated from [19,39,45]

