Abstract
Adsorption processes are characterized by their kinetics and equilibrium isotherms described by mathematical models. Nowadays, adsorption with molecular sieves is a method used to separate certain elements or molecules from a mixture and produce hydrogen, nitrogen, oxygen, ethanol, or water treatment. This study had two main objectives. The first one was focused on the use of different natural (Clinoptilolite-S.L. Potosi, Clinoptilolite-Puebla, and Heulandite-Sonora) and synthetic (Zeolite Type 3A) adsorbents to separate the mixtures and . It was determined that both Zeolite Type-3A and Heulandite-Sonora have greater adsorption capacity in a shorter time compared with the Clinoptilolites at different temperatures. The second objective was the simulation of a pressure swing adsorption process to dehydrate ethanol using the parameters obtained from Zeolite Type 3A (with maximum adsorption capacity). Several configurations were considered to calculate the appropriate nominal values for the optimal process. The results illustrate that the purity of ethanol is increased when the following parameters are considered in the adsorption process: a high pressure, a constant temperature between 100 and 120 C, a feed composition near the azeotropic point with lower water content, and a purge pressure near the vacuum. Finally, the results show that it is possible to take advantage of the length of the absorber bed in order to reduce the energy costs by increasing the ethanol production as well as complying with the international purity standards.
1. Introduction
Zeolites (natural and synthetic) can be used as separating agents for a mixture of two or more elements. Some of their main characteristics for use as adsorbents are: selectivity on the element (molecule) that it is desired to adsorb or retain on its surface, great adsorption capacity (many pores), and the ability to withstand high temperatures for regeneration. There are many works found on the used of zeolites to adsorb water molecules [1,2,3,4,5,6,7,8,9,10,11]. In particular, García-Soto et al. [12] presented an experimental study of a Na-A synthetic zeolite used for separation of the mixture, at temperatures of 120 and 140 C, and at each of them different compositions by weight of ethanol: 50%, 60%, 70%, 80%, 85%, 90%, 95%, 97%, and 99%. Nowadays, bioethanol (dehydrated ethanol) with a purity of 99% wt is used as fuel or oxygenator additive. The product obtained is not corrosive, pollutes on a smaller scale and is renewable because it comes from fermentation of biomass (bagasse from sugarcane and other natural plants).
A comparison between two types of natural zeolite: ZSA (zeolites of San Andres) and ZC (zeolites of Canada) was presented by Hervé et al. [13]. They used the Bells Method to assess the adsorption capacity of water for different relative humidity values generated by solutions at different concentrations. Obtaining and separating the from other elements is important, since it is used in different industrial fields: pharmaceutical industry, fertilizers, sugar cane, etc. [14,15,16,17,18,19].
Among the alternative techniques to separate the elements or blends of different elements (i.e., hydrogen, oxygen, nitrogen, and ethanol), adsorption processes appear particularly interesting. These processes use the pressure swing method to adsorb and regenerate the adsorbent or bed [4,5,20,21,22,23,24]. It is possible to identify which adsorbents are appropriate as they have high selectivities on the water molecule and achieve high separation factors. The adsorption process is based on choosing adsorbents that can adsorb the desired molecule, support high temperatures, and have a large cavity in the pores.
Biofuel production is increasing globally; however, the processes used for its production still require further optimization to obtain the desired purity in compliance with international standards. One of these processes is the adsorption with molecular sieves, which uses the pressure swing to adsorb and desorb the gas molecule to produce 99% wt bioethanol [25]. Pressure Swing Adsorption (PSA) uses two or more columns filled with a molecular sieve (natural or synthetic adsorbent). These columns operate synchronously: when one column is adsorbing, the other is desorbing (releasing all active sites of the adsorbent and regenerating the column). These two stages (adsorption and regeneration) are composed of four steps: adsorption, depressurization, purge, and repressurization. The process operates cyclically; when one column adsorbs, the other is regenerated, and then the stages are reversed [12,14,20,21,25,26,27,28]. The mathematical model of the PSA process is described by Partial Differential Equations (PDE), and, to solve these equations, initial and boundary conditions are necessary. The process is highly nonlinear and its complexity is derived from its cyclic operation (oscillatory).
There is a little information related to the optimization and modeling applied to the PSA process; however, previous works address models with certain restrictions. The main aim is to perform an analysis of the PSA process and to find process improvements with the aid of mathematical modeling [16]. The parameters for the model are based on the data from an operating plant as well as data from the literature. Another work related to the PSA process was done by Latifi et al. [17], who used an optimization-based approach for the determination of the Cyclic Steady State (CSS) of a PAS process. The optimization problem is solved using a gradient-based nonlinear programming (NLP) method and the gradients are computed by means of four different methods: finite differences, numerical sensitivities, analytical sensitivities, and adjoint system methods.
Due to the increase in the use of separation processes of mixtures composed mainly of , our work focused on the study and characterization of natural (Clinoptilolite of Tehuacán and San Luis Potosi and Heulandite of Sonora) and synthetic (Type 3A) zeolites to adsorb the water molecules and finding the maximum absorption capacities of each zeolite. To find the thermodynamic and kinetic equilibrium of the different zeolites, tests were carried out experimentally to determine the absorption capacity and the rate at which they adsorb different concentrations of the mixtures of and at a constant temperature.
Finally, it was determined that zeolite Type 3A adsorbed a greater number of water molecules and the parameters obtained were used in the simulation of the PSA process. Another contribution in this work is the parametric study and the PSA process modeling to find the appropriate starting values and obtain an optimal process. Different scenarios with different nominal values were established at the start of the process and the optimal values of the process were determined through a parametric analysis. Similarly, the recovery of the process with the different nominal values was determined.
This work is organized as follows. Section 2 presents the equipment, materials, and methods to adsorb the mixtures using four different (natural and synthetic) zeolites. Section 3 describes the experimental adsorption process using the Langmuir and GAB model to validate the results obtained, and the kinetic adsorption times of the four zeolites are defined. In Section 4, the isotherms at different temperatures are calculated to know the maximum adsorption capacity of the different zeolites. Section 5 shows the simulation of the PSA process, which describes the adsorption using four steps to adsorb and regenerate the packed columns with Type 3A zeolite. Section 6 presents the results of the sensitivity analysis and the optimal operation values of the PSA process. Conclusions on our results are given in Section 7.
2. Experimental Case: Materials and Methods
In this experimental study, four different zeolites were used to determine the maximum adsorption capacity of water: zeolite 3A, Clinoptilolite (natural white zeolite from San Luis Potosi), Heulandite (natural white zeolite from Sonora), and Clinoptilolite (natural green zeolite from Puebla). The procedure for opening pores and activating the zeolites included high temperatures and being mixed with an solution to eliminate the cations () and open more the windows of the natural zeolites. Subsequently, the adsorption capacity process was carried out using the desiccator method ( mixture) and the zeolites Type 3A, Heulandite-Sonora, Clinoptilolite-S.L. Potosi, and Clinoptilolite-Puebla. In the case of Bench-Scale Fixed Bed Adsorber ( mixture), Type 3A, Heulandite-Sonora, and Clinoptilolite-S.L. Potosi were used, at different temperatures and taking samples at different times to determine their mass. Clinoptilolite-Puebla was not used for the mixture since the experiments were carried out at different times and this zeolite was no longer available when the experiments were performed.
The material used to perform the experimental tests is described in Table A1 and shown in Figure A1.
2.1. Borosilicate Glass Desiccators for the Mixture
The procedure to prepare the material and perform the tests was as follows: The two desiccators must be cleaned (use soap and distilled water to rinse). Once this was done, the desiccator was filled with water to know its maximum volume, since the adsorption process took place in this desiccator.
A unicel cover was constructed and it was lined with aluminum, to cover the desiccators in order to reduce the temperature exchange with the environment (Figure A2). For small desiccators, the sample of each zeolite (natural and synthetic) was measured.
Similarly, a bottle was used to deposit zeolite 3A. It was washed with water and soap and then rinsed with distilled water. Figure A3 shows the bottle. As can be seen, the bottle was also lined with aluminum.
2.2. Bench-Scale Fixed Bed Adsorber for the Mixture
A bench-scale fixed bed adsorber prototype was constructed with the following dimensions: 17 cm in height and 12 cm in diameter. The temperature was controlled using an electric heated sleeves (type 98-1-C), consisting of a temperature sensor, a potentiometer to rapidly raise the temperature, three buttons to adjust the desired temperature reference, a display to visualize the temperature, and an indicator when the set point was reached. To achieve and maintain a constant temperature throughout the prototype, a heating resistance was used. The heating resistance surrounds the internal diameter and the height of the prototype (color blue tank), as can be appreciated in Figure 1. In addition, Figure 1 shows that all joins were isolated with heating tape.In this experiment, the mixture was heated and steam boiled up from a 500 mL flask surrounded by an electric heating mantle, having a constant pressure of 767 mmHg. Inside the column (color blue tank), the zeolite samples (bottles containing 1 g of different types of zeolites) were placed. A flow of steam passed through a conduit that joins the column and the neck of the flask (from which the steam was boiled from the flask), resulting in the ethanol–water molecules dispersing inside the column at a constant temperature. The temperature of the heating resistance and the boiling steam were controlled and kept constant during the experiments (Figure 1).
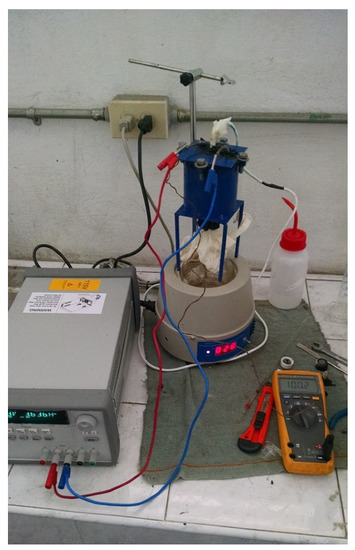
Figure 1.
Bench-scale fixed bed adsorber prototype.
A desiccator was used to place the bottles with different samples of zeolites. Then, they were taken out of the column to measure the weights of different concentrations of ethanol and water.
The theermal and chemical activation processes of the natural and synthetic zeolites (Clinoptilolite, Heulandite, and Type 3A) are presented in detail in Appendix A.
The characterization and identification of elements and materials (using SEM) that conformed to the natural and synthetic zeolites are shown in Appendix B.
3. Experimental Procedure
3.1. Experimental Procedure for the Mixture
The bottles were introduced into the small desiccator containing different concentrations of the mixture with a total volume of 71.42 mL, equivalent to 3.5714%, being the desiccator had a maximum capacity of 2 L.
The equation to determine the volume of that must be entered for the different concentrations is expressed as follows.
where is the initial concentration, is the final concentration, is the initial volume, and is the final volume.
For all cases and concentrations (Table A3), it was necessary to find the initial volume , since it was the amount entered into the small desiccator where the adsorption and separation of the mixture occurred.
Table 1 shows the maximum adsorption capacities of each zeolite (natural and synthetic). The adsorption capacities were calculated using the desiccator method until a constant mass was obtained. It is important to mention that the experiments were carried out at a constant temperature. The samples obtained were taken every 12 h until a constant mass was obtained for different concentrations of the mixture .

Table 1.
Adsorption of samples at different concentrations ( thermodynamic equilibrium).
3.2. Experimental Procedure for the Mixture
For the experiments of the mixture, the bottles were inserted into the blue tank (Figure 1). Only one sample was used for each zeolite since space was reduced to put more samples inside the blue tank. The temperature of the flask and the blue tank was controlled and kept constant during the runs. They were prepared by weighing the desired amounts of distilled water and ethanol to make about 250 mL solution (having a 500 mL capacity). The samples were removed every 5 min to measure their weight and calculate how much they had adsorbed (water molecule) until they achieved a constant mass. Several experiments were carried out at 50 and 70 C, in order to have a close azeotrope temperature of the ethanol–water mixture, with different concentrations, as shown in Table A4 (10–90%, 92%, 95%, 97%, 98%, and 99% wt ethanol).
Equation (1) was used to obtain the volume of the solution at different concentrations.
Table 2 shows the maximum adsorption capacities of each zeolite (natural and synthetic), which were calculated using the blue tank connected to a flask that was temperature controlled. The mass of each bottle with zeolite was measured at different times and concentrations until obtaining a constant mass.
Table 2.
Adsorption of samples at different concentrations ( thermodynamic equilibrium).
It can be seen in Table 3 that, for a temperature of 50 C, Type 3A zeolite began absorbing at 5 min, with a breaking time at 90 min, and reached its thermodynamic and kinetic equilibrium point at 200 min. In the case of the Heulandite-Sonora, it was observed that it had a time greater than 20 min to start adsorbing the molecules, with a breaking time of 100 min, achieving its thermodynamic and kinetic equilibrium at 185 min. Clinoptilolite-S.L. Potosí had an initial adsorption time at 30 min, a breaking time at 110 min, and reached its thermodynamic and kinetic equilibrium at 190 min. (T is the temperature at which the experiment was conducted inside an airtight container without interaction with the outside temperature.)
Table 3.
Adsorption of samples at different time ( kinetic equilibrium).
For cases of adsorption at 70 C, Type 3A had an initial time of 5 min to start adsorbing, a different case for zeolite Heulandite and Clinoptilolite that its initial time was between 15 and 30 min. The breaking times for these temperatures (50 and 70 C) were observed to have a greater effect on Heulandite, since it reached its breaking time at 50 min, and the time to reach its thermodynamic and kinetic balance of the zeolites was 115, 120, and 130 min, observing that it was faster when using a temperature of 50 C
To calculate water uptake at every feed composition, which changes with time, it is necessary to know the relative pressure, partial pressure, water saturated steam pressure, and the feed composition. From the difference between the mass of adsorbent and the mass of water adsorbed on the bottles, the uptake of water can be calculated at each value of the feed composition. The initial feed composition was used to determine the steam composition fed to the desiccators and adsorption column (blue tank) from the equilibrium relationship as follows:
The value of water saturated steam pressure was found at temperatures of 23 ( mixture), 50, and 70 C ( mixture). The relative pressure and adsorption loads were calculated as shown in Table A5 and Table A6.
The adsorption isotherms of the molecule and measured on the natural and synthetic zeolites at a temperature of 23 C, including the adsorption isotherms synthesized under different conditions (temperatures of 50 and 70 C), are presented in Figure 2, Figure 3 and Figure 4.
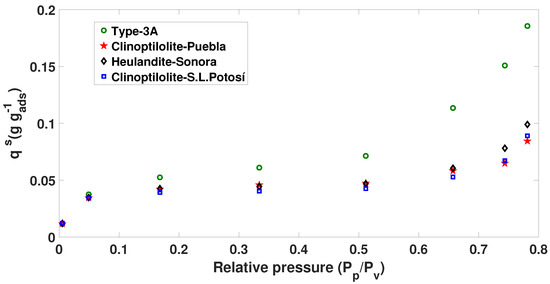
Figure 2.
The 23 C adsorption isotherm ( mixture) of Brunauer–Emmett–Teller (BET).
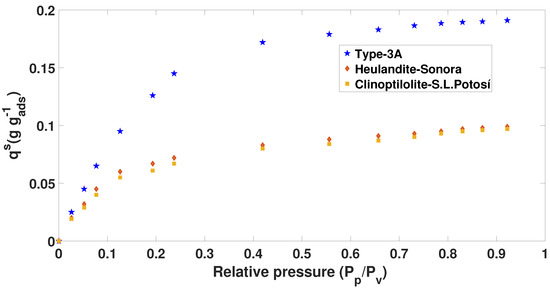
Figure 3.
The 50 C Adsorption isotherm ( mixture) of Brunauer–Emmett–Teller (BET).
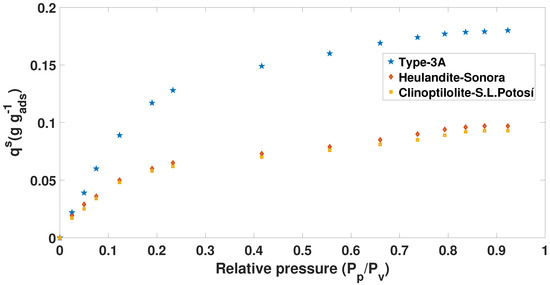
Figure 4.
The 70 C Adsorption isotherm ( mixture) of Brunauer–Emmett–Teller (BET).
All the isotherms in Figure 2 are of Type II according to the IUPAC classification, and the adsorption data of the mixture in the range of 0.0054377–0.7812 were treated with the BET equation to calculate the specific surface of each of the oxides of the series. The adsorption isotherms of the mixture exhibited a well-defined elbow in the area of low relative pressure.
Thus, although a powder consisting of non-porous particles gives rise to a Type II isotherm, the results presented here confirm that the inverse is not necessarily true, that is, natural and synthetic zeolites with heat treatment of more than 200 C produced a Type II isotherm but presented a high degree of microporosity.
The presence of some wide mesopores or narrow macropores in these materials caused the upward deviation of the isotherms at high relative pressure. Since the amount of such relatively wide pores is probably small, the scale of the development of adsorption multilayers, that is, the filling of mesopores, can be quite small (given the dimensions of the pores) and produces very small hysteresis cycles.
In the case of the isotherms in Figure 3 and Figure 4, the prototype of the blue tank was used to calculate the adsorption capacity at different concentrations. In addition, from the chemical and thermal treatment that was applied, it was observed that the results show isotherms similar to Type I.
Figure 3 shows that Type 3A zeolite has a higher adsorption capacity compared to Heulandite and Clinoptilolite (see Table 4). We also observed that, at a higher relative pressure and a lower temperature, there is an increase in adsorption on the water molecule. This was defined by comparing the data shown in Figure 2, Figure 3 and Figure 4.
Table 4.
Maximum saturations in two different concentrations with a constant temperature of 50 C.
For the data presented in Figure 4, it is possible to observe that the adsorption capacity of the (natural and synthetic) zeolites decreases. However, for the kinetic part, the data shown in Table 3 indicate that they have a faster speed in adsorbing the molecule of water ( mixture) (see Table 5).
Table 5.
Maximum saturations in two different concentrations with a constant temperature of 70 C.
The adsorption process was quantified by the elaboration of adsorption isotherms in order to obtain the number of molecules (adsorbate) that accumulated on the (natural and synthetic) zeolites. In this study, the Langmuir mathematical model was used. This model assumes that: (a) the surface is homogeneous; (b) a specific number of molecules can be adsorbed, i.e. all sites are occupied and it is not possible for adsorption to continue (the system it is saturated); (c) the heat of adsorption is independent of the degree of coating; and (d) all sites are equivalent and the energy of adsorbed molecules is independent of the presence of other molecules.
The Langmuir isotherm can be described by the following equation:
To know the Langmuir constant K, it is necessary to develop the linearized Langmuir equation.
4. Results of the Experimental Case
Langmuir and GAB Equation for Mixtures and
To define the linearization of the Langmuir isotherm, the data of the partial pressure of the () mixture and the divided value of the partial pressure between saturation loading were used. Only those points that do not depart from the linear approximation (linear fit) were defined and the furthest points were not taken into account, as shown in Figure 5.
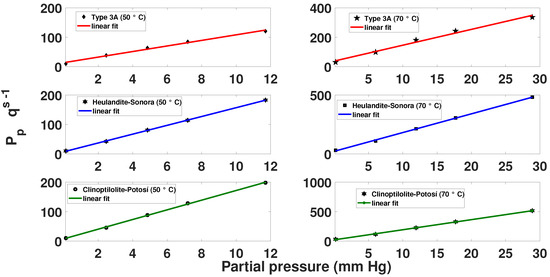
Figure 5.
Linearized Langmuir isotherm for the mixture.
To know the Langmuir constants, the following equations are proposed. From the results in Figure 5, the slopes of the lines were calculated:
Similarly, the data of the interception of the straight line with the axis () were found, as shown in the following equation:
The result is shown in Table 6. The equilibrium curve with the Langmuir isotherm was performed through Equation (3), and the results are shown in Figure 6.
Table 6.
Values of the thermodynamic constants as a function of temperature for the mixture.
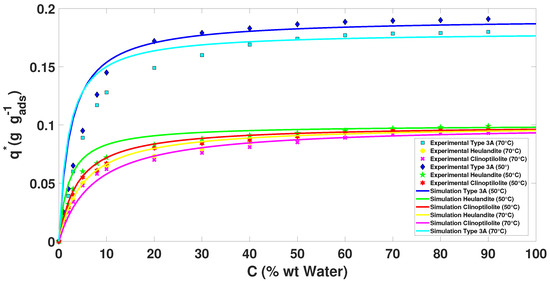
Figure 6.
Langmuir adsorption isotherms for the mixture.
To obtain the isothermal curves of the mixture, it was decided to use the GAB model (Guggenheim, Anderson, and De Boer), since it was adjusted and approached appropriately to the experimentally obtained data [1].
The GAB model is based on the same theory as that of the BET model. The GAB model can be represented by the following equation:
where X is the water uptake on adsorbent (g g), aw is the water activity, is the monolayer capacity (g g), is the energy constant related to the difference between the chemical potentials of sorbate in the upper layers and that in the monolayer, and is another energy constant related to the difference in the sorbate’s liquid states and in the upper states. The products of both and represent an energy constant equivalent to the energy constant of BET model, CBET [29]. The GAB model has some advantages over the BET model.
The GAB parameters are shown in Table 7 for different types of zeolites and Figure 7 shows predicted response using GAB model for water adsorption. It is seen that this model fit the experimental data reasonably well for all cases.
Table 7.
Values of the thermodynamic constants as a function of temperature for the mixture.
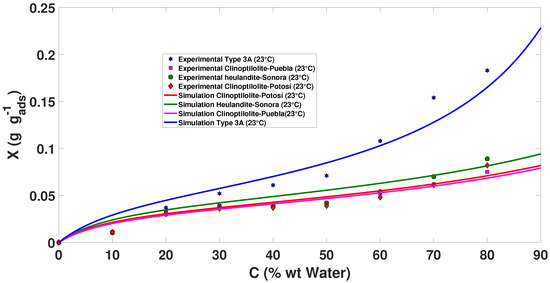
Figure 7.
GAB adsorption isotherms for the mixture.
The natural and synthetic zeolites used for the separation of the mixtures and presented selectivity on the molecule and adsorption capacity at different temperatures; however, the one with the highest adsorption capacity is the zeolite Type 3A (synthetic), absorbing up to 20% of its own weight in water compared to natural zeolites (Clinoptilolite and Heulandite).
Natural (Heulandite) zeolite showed better results in breaking times compared to those of Type 3A zeolite; they are shorter and reach thermodynamic equilibrium in less time.
The content of “Si” and “Al” impregnated in the pores of Zeolite 3A is the most dominant factor that influences the adsorption of steam on the impregnated adsorbent, while, in the cases of Heulandite and Clinoptilolite, the dominant elements are “Si” and “C ”. However, the presence of “K” within the pores decreased the speed of water vapor transport and, therefore, the effective diffusivity decreased. Natural zeolites are considered cheaper than synthetic molecular sieves (3A). Therefore, using them as alternatives to adsorb the water molecule of the mixture within a bed and operating them with pressure swing adsorption or temperature swing adsorption is a promising method giving good adsorption results.
It was observed that, as the temperature increased, the zeolites decreased the amount of adsorption, but the speed to adsorb increased, reaching the thermodynamic and kinetic equilibrium point in a short time. On the other hand, as the temperature decreased, the adsorption capacity increased, but the speed to adsorb the water molecule was affected.
In the case of pressure variation, something similar occurred but in reverse when the temperature varied.
5. Simulation Case: Pressure Swing Adsorption Processes
PSA has become a significant tool for the creation of biofuels. PSA is used for the dehydration of ethanol. It consists of two parallel columns containing (natural or synthetic) zeolite and is generally carried out in six steps divided into two stages that make up a cycle: the first phase is the production of ethanol (adsorption) and the second one corresponds to the zeolite regeneration (depressurization, purge, and repressurization). This cycle operates in both beds: while the first produces ethanol the second regenerates the zeolite, inverting after some time to start a new cycle. The model was carried out in Aspen Adsorption®. The simulation consisted of two beds, 0.5 m high and 0.1 m in diameter and 10 valves of reversible flow setter type: three used for the feeding of the columns, three used for the waste, one for the purge, and the last three corresponding to the product part. The feed composition of the water–ethanol mixture had a concentration close to the azeotropic point (10% weight of water and 90% weight of ethanol) 0.22 and 0.78 of molar composition (for water and ethanol, respectively) at a temperature of 393.15 K, which must be kept constant and above 373.15 K because the process works in the vapor phase, releasing the molecules of water absorbed by the zeolite during regeneration. The pressure of the adsorption is 204.5 kPa since the attraction between the zeolite and the water is higher, while the pressure in the regeneration stage is lower (13.4 kPa); this facilitates the breaking of the weak bond formed by the absorbent and the water molecules. The schematic design of this model is presented in Figure 8 and the column parameters are shown in Table A9.
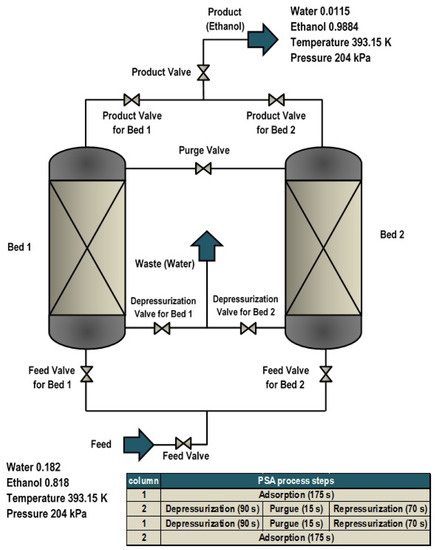
Figure 8.
Pressure swing adsorption processes.
The adsorbent parameters that were used (see Table A9) are the characteristics and properties of the Type 3A zeolite presented in this work from the results obtained previously (Table 6, Table 7, and Table A8 and Figure A13).
The description method used, Derivation of Upwind Differencing Scheme 2 option, predicts sharper fronts than Upwind Differencing Scheme 1, but the solution tends to oscillate.
The first-order (convection) term is:
The second-order (dispersion) term is approximated with a second-order accurate central differencing scheme:
5.1. Mathematical Modeling
The adsorption column models use a set of Partial Differential Equations (PDEs) to represent the momentum, heat, and material balances across the column.
The mathematical model describes the dynamics of the six-step cyclic process and the effects of the variables (pressure, temperature, composition, and flows) involved in the PSA process. To have a practical description, the following assumptions were made for this model:
- The material balance is given by convection with constant dispersion.
- The momentum balance is specified by the Ergun equation.
- The bed operates under non-isothermal with solid conduction energy balance.
- The heat of adsorption and the form of heat transfer coefficient are constant.
- Adsorption equilibrium is described by the Langmuir 1 Model with isotherm dependency by partial pressure.
- The kinetic model is designated by lumped resistance with linear model.
- The handling of partial differential equation uses the UDS2 discretization method.
5.2. Material Balance
The equations of the mathematical model predicted the profiles of pressure, saturation load, temperature, and flows as a function of time and/or space along the bed.
An equation was established to determine the amount of water molecule absorbed in each column:
where is the convection term, is the accumulation of matter in the gas phase, is the flow over the solid surface, and is the amount adsorbed.
The axial dispersion is insignificant (null) compared to the convective part, thus it is considered constant with a very small value in the proposed model.
5.3. Energy Balance
The adsorber model uses the following energy balance to represent the heat transportations of non-isothermal system:
where is the axial thermal conductivity in the solid that depends on the conductivity of the zeolite, is the accumulation of energy in the solid, is the absorbent heat, is the adsorption heat, and is the solid–gas heat transfer depending on the coefficient of heat transfer and area heat transfer.
5.4. Langmuir (Thermodynamic Model)
Langmuir isotherm models typically apply to the adsorption of a single molecule layer on completely homogeneous surfaces, with negligible interaction between adsorbed molecules.
where is partial pressure and are isothermal parameters.
5.5. Kinetic Model (LDF)
Rigorous simulation of an adsorption process requires an accurate representation of the adsorption kinetics for the adsorbent used.
where is the mass transfer coefficient of of solid, is the effective diffusivity, and is the parameter in the Glueckauf expression.
5.6. Pressure Drop
To estimate the pressure drops, the Ergun equation was used, with data obtained from:
This model (Equations (9)–(13)) was used in Aspen Adsorption®to simulate gas processes with adsorption only and adsorptive reaction gas processes where both reaction and adsorption occur simultaneously.
The adsorption of the process and bed models are usually setters, but within the bed they can be both flow setters and pressure setters. This is because they determine internal pressure profiles and gas velocity profiles, provided the general compressible flow model is used. Therefore, the nature of the process and its operating conditions determine the type of model to use.
The solution of PDEs must satisfy certain auxiliary conditions (initial and boundary) on the boundary of the specified domain. These auxiliary conditions of a PDE system determine its unique solution from among an infinite number of solutions. The boundary conditions are a fundamental part of the description of the process system behavior, while the initial conditions define the initial state of the process system and may often differ from one simulation to next.
6. PSA Process Results
A periodic adsorption process operates on sequential steps (continuously repeated steps of feed, purge, pressure equalization, blow down, and production) with multiple adsorbers packed with single or multiple adsorber layers. Although the operation of each bed is batchwise, the whole system is continuous because of the use of multiple beds that are ultimately operated in a cyclic steady state within a confined cycle time. Cyclic Steady State (CSS), which is the nature of periodic adsorption processes, implies a steady state in which the conditions at the end of each cycle are identical to those at its beginning.
Based in the above concept, direct determination of CSS will effectively save the costs for optimization of periodic adsorption process since the technique could offer an extremely efficient design tool that can be more readily used as an optimization package to determine optimal design and operating conditions.
After the PSA process starts with the nominal values, initially, the amount adsorbed on the first column is 0 mL (0 mol) pressurized at 2045 bar at a temperature of 393.15 K. The initial composition of ethanol is 78% (0.78 molar fraction of ethanol) and the composition of water is 22% (0.22 molar fraction of water). When the steam of the ethanol–water mixture comes into contact with the zeolites, rapid adsorption is carried out. After 42 cycles (14,700 s) in the simulation, the cyclic stable state (CSS) is reached. Figure 9 shows the behavior of ethanol, with the most noticeable rising peaks in the initial cycles and as the stable state of the PSA approaches the changes in purity are minimal.
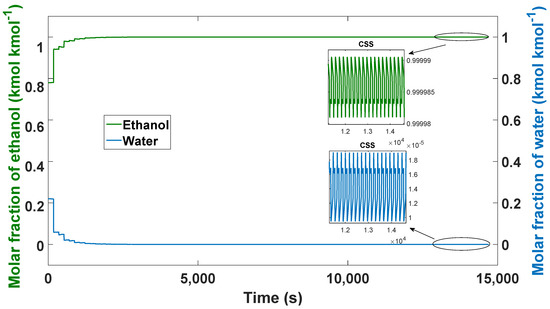
Figure 9.
Ethanol–water mixture purity profile, process from boot to CSS.
The different temperature profiles (Figure 10) are also shown from the start of the process until reaching the CSS; each temperature profile represents a distance or node of the column of 0.5 m. It can be observed that there is a decrease in temperature in the upper part of the column (node 20—0.5 m), which is caused by the steam output of the product obtained and by being used to purge and repressurize Column 2.
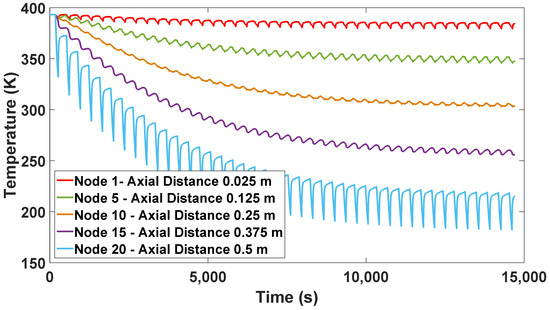
Figure 10.
Solid temperature profile from start-up to CSS.
Therefore, during the regeneration phase, the lower part of the column has the highest temperature profiles. This is because most of the water is concentrated in this part of the bed. Conversely, lower levels of heat are maintained at the top of the column, since purging and ethanol production are carried out in this section.
Figure 11 shows the dynamic behavior of the process during the first 350 s, corresponding to one cycle. These times cover four steps: adsorption, 175 s; depressurization, 90 s; purge, 15 s; and repressurization, 70 s. It can be seen that between 90 and 175 s of the adsorption step, there is a small pressure drop (insignificant) because there are open valves that share a certain portion of the production flow between Columns 1 and 2.
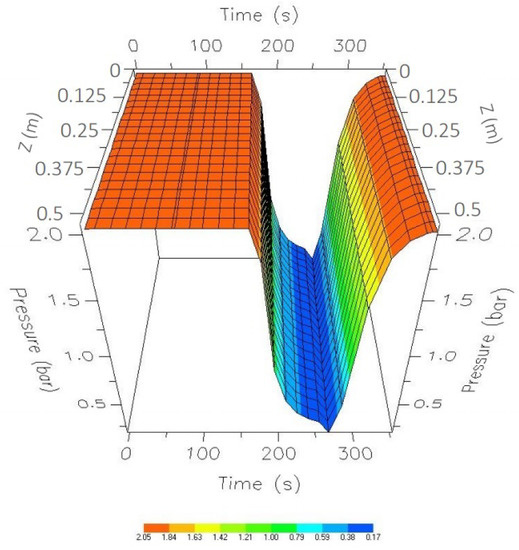
Figure 11.
One-cycle pressure profile while in CSS.
In addition, the temperature profile is shown in Figure 12. It was observed that, during the depressurization and purge steps, there is a decrease in temperature because there is a steam outlet in the upper part of the column, and part of this steam is the product obtained from Column 1 and is also used to purge and repressurize Column 2.
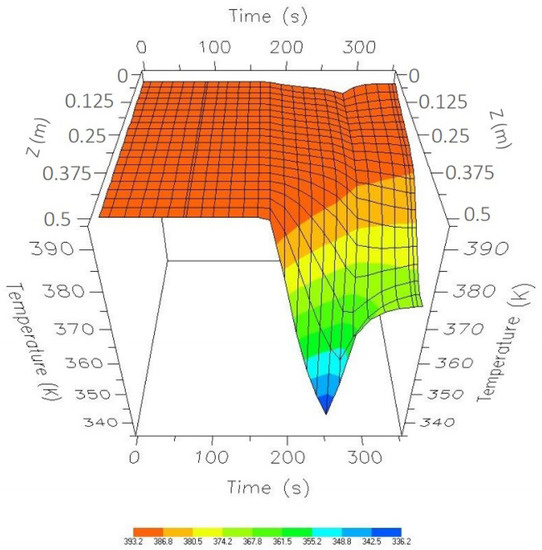
Figure 12.
One-cycle temperature profile while in CSS.
Water adsorption profiles along the column at different operating time values are shown in Figure 13. The better adsorption of water is carried out in the lower parts of the bed and changes in efficiency can be observed throughout the length of the column, which is due to the changes in temperature and pressure that are observed in the length of the bed during the process.
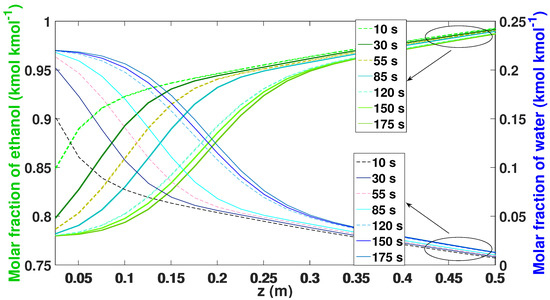
Figure 13.
Molar fraction of ethanol–water during the adsorption phase while in the CSS.
As the adsorption stage progresses, in the first parts of the bed, the composition of the ethanol increases to the level of the produced ethanol. In the low parts of the bed, most of the water is adsorbed, inversely corresponding to the adsorption profile of ethanol.
Figure 14 shows the behavior of the regeneration step along the bed. The profile of the 175 s of the adsorption stage becomes the starting profile (0 s). It is possible to observe that the profile begins to release the amount of water on the bottom of the bed (between nodes 1 and 5), so that more water accumulates. After 120 s, the bed begins to release the largest amount of water molecule, allowing all the active sites of the zeolite to be released to be used again.
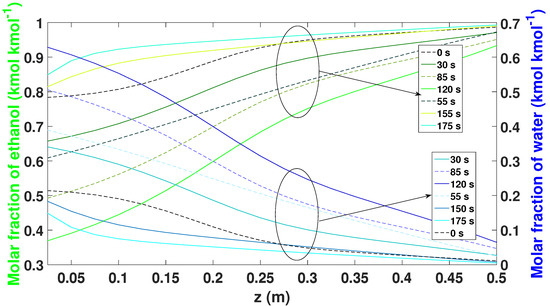
Figure 14.
Molar fraction of ethanol–water during the regeneration phase while in the CSS.
For the case of the temperature profiles in the adsorption and regeneration stages, it is observed that there is a decrease in temperature along the column (Figure 15) because part of the 12 and 20 nodes (discretized length) did not generate good adsorption at these distances. Thus, it is important to control and keep the temperature constant.
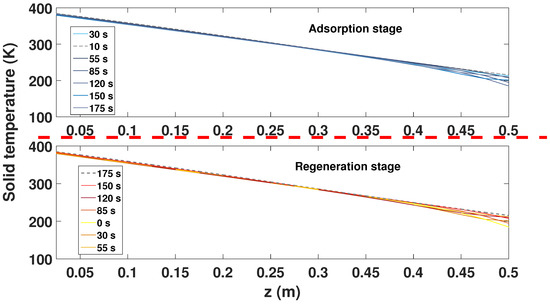
Figure 15.
Molar fraction of ethanol–water during the adsorption phase while in the CSS.
To determine the input values that may affect the performance of the model, modifications were made to the nominal model and the results of ethanol purity were obtained (Table 8).
Table 8.
Comparative table of values used in simulations to find the optimal values of the PSA process.
The effect of the pressure on the process performance was remarkable (see Table 8 and Figure 16). A nominal pressure value of 2.45 bar (204.5 kPa) gave us an ethanol purity of 99.29% and 0.7% of water after 42 cycles. In the case of lower pressure (154.5 kPa), a drop in purity quality of 98.50% for the ethanol and an increase of 1.5% for water was observed, taking 46 cycles to reach the CSS. On the contrary, by increasing the pressure to 404.5 kPa, an ethanol composition of 99.82% was obtained after 45 cycles.
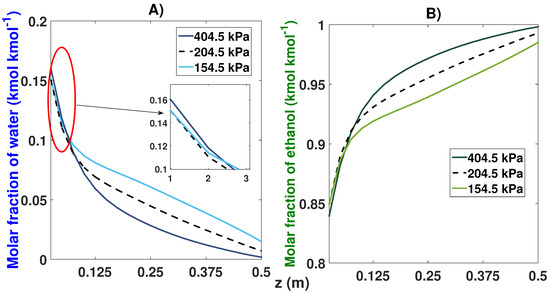
Figure 16.
Molar fraction profile in the bed from the start-up and at CSS for three different feed pressures. (A) Effect of feed pressure on the molar fraction of water; (B) Effect of feed pressure on the molar fraction of ethanol.
It can also be seen in Figure 16B that the maximum adsorption capacity increased when a pressure of 404.5 kPa was used compared to the profile shown at the pressure of 154.5 kPa; however, the pressure of 154.5 kPa used the entire length of the bed to adsorb more water molecules.
The temperature variation observed in the comparisons did not represent notable changes (see Table 8 and Figure 17). The nominal temperature value was 120 C (393.15 K). The variations were made with a difference of 20 C. For the first case (373.15 K), it took 46 cycles to reach the CSS, obtaining purity levels of 99.30% and 0.7% for ethanol and water, respectively. By increasing the temperature to 413.15 K, a small decrease in the purity of ethanol of 99.26% was obtained; in this case, the simulation lasted 45 cycles in reaching the CSS.
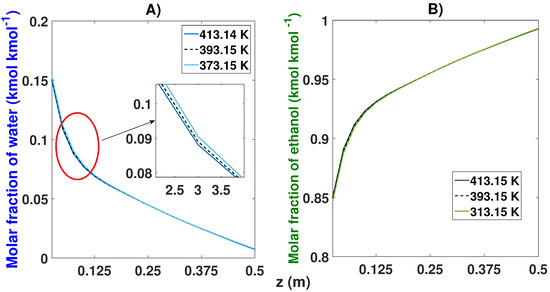
Figure 17.
Molar fraction profile in the bed from the start-up and at CSS for three different feed temperatures. (A) Effect of feed temperature on the molar fraction of water; (B) Effect of feed temperature on the molar fraction of ethanol.
Modifications in the purge pressure were shown to grant variations in the purity obtained (see Table 8 and Figure 18). The decrease in the purge pressure managed to obtain 99.41% purity for ethanol after 46 cycles with a pressure of 11 kPa, compared to the 99.29% purity obtained with the nominal value (13.4 kPa). When the purge pressure value increased, an ethanol purity of 99.19% was obtained after 45 cycles.
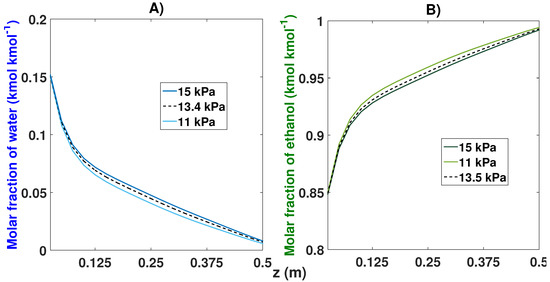
Figure 18.
Molar fraction profile in the bed from the start-up and at CSS for three different purge pressures. (A) Effect of purge pressure on the molar fraction of water; (B) Effect of purge pressure on the molar fraction of ethanol.
The changes in the feed composition (see Table 8 and Figure 19) greatly affected the purity obtained because the azeotropic point of the water–ethanol mixture was 10% water and 90% ethanol. The nominal simulation (78% ethanol and 22% water) obtained purity of 99.29%. When we moved closer to the azeotropic point with a feed of 83% ethanol and 17% water, it showed an increase in purity of 99.82% for the ethanol after 44 cycles. conversely, by decreasing the composition in the feed (73% and 27%), we noticed a decrease in purity of 98.51% after the CSS (48 cycles).
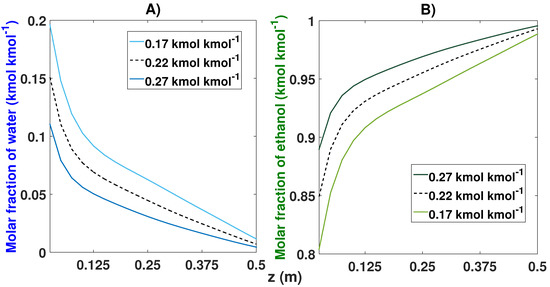
Figure 19.
Molar fraction profile in the bed from the start-up and at CSS for three different compositions. (A) Effect of feed composition on the molar fraction of water; (B) Effect of feed composition on the molar fraction of ethanol.
From the sensitivity analysis that was carried out from the start-up, the optimum values of production pressure, feed temperature, purge pressure, and feed composition were found.
The results of the optimal values are shown in Table 8 (orange color) and compared with the nominal values shown in Table 8 selected in blue. The simulated model proved to grant a purity of 99.99% taking 45 cycles (15,750 s) to reach its stable state (Figure 20).
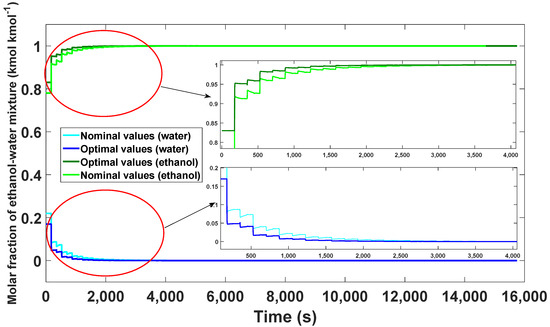
Figure 20.
Comparison of the optimal results with the nominal values from the start-up to the CSS.
Compared to the nominal values obtained, a better quality in the purity of ethanol was observed, taking only three more cycles than in the nominal model.
Figure 21 shows the dynamic behavior of the pressure when using the four steps (adsorption, depressurization, purge, and repressurization) and presents the new optimal values applied to the PSA process. Figure 22 presents the pressure changes favoring the bed temperature; it is possible to observe that, in the passage of depressurization and purging, there is little decrease in temperature compared to that shown in Figure 12.
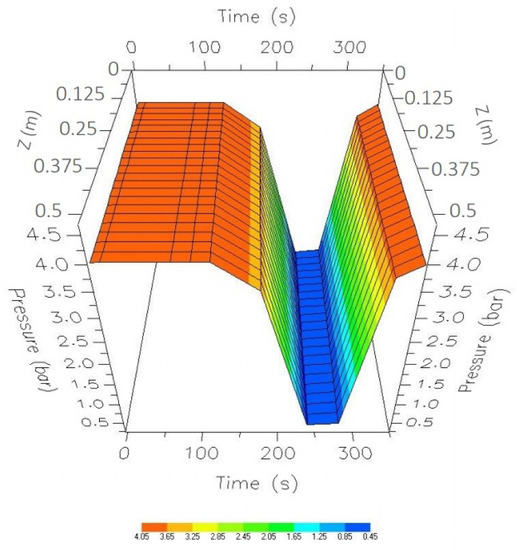
Figure 21.
Comparison of the optimal results with the nominal values from the start-up to the CSS.
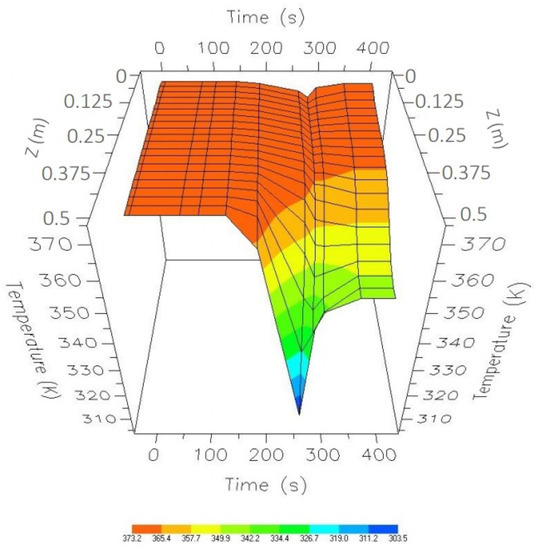
Figure 22.
Comparison of the optimal results with the nominal values from the start-up to the CSS.
However, there is still a decrease in temperature; thus, it is necessary to establish a control law that manages to keep that temperature constant in the event of existing disturbances in the input supply.
The proposed model demonstrates greater efficiency. The lower parts of the column adsorb more water compared to the nominal values, while the upper parts of the bed adsorb less water (Figure 23).
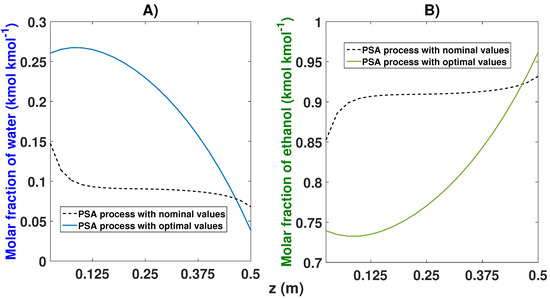
Figure 23.
Comparison of water–ethanol adsorption of the optimal model proposed based on the axial coordinate. (A) Effects of nominal and optimal values on the molar fraction of water; (B) Effects of nominal and optimal values on the molar fraction of ethanol.
The adsorption profiles of ethanol showed greater efficiency in the highest part of the bed (where the production is carried out), while, in the lower part of the column, the greatest amount of water is adsorbed, as shown in the previous figure. The optimal model eliminates the adsorption peak in the first parts of the column seen in the nominal model. With this, the upper parts of the bed can adsorb more ethanol and grant greater purity.
7. Conclusions
This paper presents a desiccator method to separate the mixture and fixed bed adsorber (blue color tank) at bank scale to separate the mixture , and favorable results were obtained. Thermal and chemical activation was applied to natural zeolites (Clinoptilolite and Heulandite). The results show that it has great porosity, can withstand high temperatures, and manages to absorb up to 12% of its own weight in water. In addition, the synthetic zeolite (Type 3A) manages to add more water molecules (19% by weight in water) in the mixtures of both hydrochloric and . We conclude that the zeolite Type 3A and Heulandite usually adsorb very quickly the water molecules when the temperature increases and the adsorption capacity decreases. Therefore, it can be concluded that both natural and synthetic zeolites used in this work for the different mixtures can be used in future works to rot and separate (oxygen, nitrogen, , ethanol, sulfuric acid, hydrogen, or water treatment) at larger-scale certain elements of a mixture.
On the other hand, the simulation results of the PSA process indicate that it is a highly nonlinear oscillatory process due to the cyclic nature. The process could replace other processes that are used to separate the ethanol–water mixture since it has lower energy costs and higher productivity of ethanol purity. In addition, the process obtained does not contain traces of separating agents, as presented in the processes of extractive distillation with salts and azeotropic.
The results of the sensitivity analysis from the start-up show the dynamic sharing of the process by changing the feeding variables such as production pressure, purge pressure, composition, and temperature. It was observed that these variables affect the obtained purity and take advantage of the bed at its maximum capacity (length) to adsorbe more water molecules and have a high productivity of ethanol purity.
Finally, the nominal values of the 0.5 m column showed good ethanol purity results with low ethanol composition values. Finally, simulation results corroborate the influence of temperature, pressure, and composition dynamics on the proposed model. This is because the optimal values were closer to the azeotropic point of the ethanol–water mixture.
Author Contributions
J.Y.R.M. and A.F.P.V. worked on the characterization of zeolites using the SEM. G.O.T. and F.d.J.S.V. worked on the mathematical model to represent the isotherms of thermodynamic and kinetic equilibrium curves of natural and synthetic zeolites. J.A.B.M. and A.U.S.V. worked on the mathematical model of the PSA process by applying some considerations to reduce the model. M.D.-l.-T., J.S.V.M. and J.Y.R.M. worked on the simulation to define the optimal values of the PSA process. All authors have read and agreed to the published version of the manuscript.
Funding
This research received no external funding.
Conflicts of Interest
The authors declare no conflict of interest.
Notations
| Notation | Description | Units |
| Specific particle surface per unit volume bed, particle area/bed | m2 m−3 | |
| C | Water concentration by weight | % wt |
| C1 | Initial concentration | % wt |
| C2 | Final concentration | % wt |
| Energy constant | ||
| Molar concentration of component i | ||
| Specific heat capacity of adsorbed phase | ||
| Specific heat capacity of adsorbent | MJ kmol−1 K−1 | |
| Micropore diffusion coefficient of component i | m2 s−1 | |
| Knudsen diffusion coefficient of component i | m2 s−1 | |
| Molecular diffusivity i | m2 s−1 | |
| Effective adsorbed phase diffusivity of component i | m2 s−1 | |
| Axial dispersion coefficient of component i | m2 s−1 | |
| F | Flow | kmol h−1 |
| Fluid/solid heat transfer coefficient | W m−2 K−1 | |
| Isotherm parameters for component i | ||
| Mass transfer rate of component i to/from adsorbent/bed | kmol m−3 s−1 | |
| M | Molecular weight | kg kmol−1 |
| Solid film mass transfer coefficient | s−1 | |
| P | Gas pressure | |
| Partial pressure | mmHg | |
| Water saturated steam pressure | mmHg | |
| Relative Pressure | mmHg mmHg−1 | |
| Saturation loading | g g | |
| Equilibrium loading | g g | |
| K | Langmuir constant | |
| Henry’s coefficient i | m3 kg−1 | |
| Dimensionless isotherm slope of component i (Henry’s coefficient) | ||
| Film resistance coefficient i | m2 s−1 | |
| Macropore diffusion coefficient i | m2 s−1 | |
| Solid thermal conductivity | MW m−1 K−1 | |
| R | Gas constant | 8.31451 × 10⁻³ MJ kmol−1 K−1 |
| Radius of crystalline or primary micropore | ||
| Spherical particle radius | ||
| t | Time | |
| T | Temperature | or C |
| Tortuosity factor | ||
| V1 | Initial volume | mL |
| V2 | Final volume | mL |
| Gas phase Superficial velocity | m s−1 | |
| Amount adsorbed for component i (adsorbent) | kmol kg−1 | |
| Equilibrium amount adsorbed for component i (adsorbent) | kmol kg−1 | |
| X | Water uptake | g g |
| Monolayer capacity | g g | |
| y | Gas phase mole fraction for component i | |
| z | Axial distance coordinate | |
| Greek symbols | ||
| Bed (interparticle) voidage: void/bed | m3 m−3 | |
| Intraparticle voidage | ||
| Bed packing density | kg m−3 | |
| Adsorbent bulk density | kg m−3 | |
| Particle density (solid density, true density) | kmol m−3 | |
| Gas phase molar density | kmol m−3 | |
| Heat of adsorption of component i | MJ kmol−1 | |
| Particle shape factor | ||
| Dynamic viscosity | N s m−2 | |
| Parameter in Glueckauf expression | ||
| Subscripts | ||
| Feed stream | ||
| i | Component water (w) or ethanol (e) | |
| g | gas phase | |
| s | solid phase | |
| p | particle | |
| b | bulk or packed bed | |
| adsorbent |
Appendix A. Materials and Concentration of Elements
Table A1.
Work materials to perform the experiments.
Table A1.
Work materials to perform the experiments.
| Material | Description |
|---|---|
| Jars | Amber color, glass, 4.5 mL |
| Gloves | Sterilized, disposable |
| Desiccators | One of 2 L and one of 7 L |
| Digital analytical balance | Precision 0.001 g, 1 mg to 300 g |
| Unicel | Circular mold |
| Electric oven | Temperatures of 260 |
| Fume hood | The inner Bell, the deflector hopper, and cover, in 18 gauge stainless steel |
| High temperature gloves | For work with temperatures of up to 230 C |
| Lab coat, glasses, and mask | Equipment to work in the zeolite laboratory |

Figure A1.
Work materials.
Figure A1.
Work materials.


Figure A2.
Material cover.
Figure A2.
Material cover.


Figure A3.
Numbered jars.
Figure A3.
Numbered jars.

Table A2.
Bottle labels filled with (natural and synthetic) zeolites.
Table A2.
Bottle labels filled with (natural and synthetic) zeolites.
| Nomenclature | Bottle Label |
|---|---|
| Zeolite 3A | , , |
| Zeolite of San Luis Potosí | , , |
| Zeolite of Sonora | , , |
| Zeolite of Puebla | , , |
Table A3.
Measurement of different concentrations ().
Table A3.
Measurement of different concentrations ().
| Acid Concentration wt | Steam Pressure 23 C (Partial Pressure) | Mass |
|---|---|---|
| 10% | 17.24 | up to constant mass |
| 20% | 16.41 | up to constant mass |
| 30% | 14.50 | up to constant mass |
| 40% | 11.29 | up to constant mass |
| 50% | 7.37 | up to constant mass |
| 60% | 3.71 | up to constant mass |
| 70% | 1.09 | up to constant mass |
| 80% | 0.12 | up to constant mass |
Table A4.
Measurement of different concentrations ().
Table A4.
Measurement of different concentrations ().
| Ethanol Concentration % wt | Steam Pressure 50 C (Partial Pressure) mm Hg | Steam Pressure 70 C (Partial Pressure) mm Hg |
|---|---|---|
| 99% | 2.46 | 6.03 |
| 98% | 4.85 | 11.93 |
| 97% | 7.19 | 17.70 |
| 95% | 11.70 | 28.89 |
| 92% | 18.03 | 44.63 |
| 90% | 21.99 | 54.54 |
| 80% | 38.85 | 97.36 |
| 70% | 51.54 | 130.18 |
| 60% | 60.92 | 154.69 |
| 50% | 67.78 | 172.61 |
| 40% | 72.87 | 185.66 |
| 30% | 76.92 | 195.70 |
| 20% | 80.77 | 204.89 |
| 10% | 85.46 | 216.10 |
Table A5.
Relative pressure at different concentrations ( mixture) at temperature of 23 C.
Table A5.
Relative pressure at different concentrations ( mixture) at temperature of 23 C.
| Concentration | Pr (mmHg mmHg−1) |
|---|---|
| 80% | |
| 70% | |
| 60% | |
| 50% | |
| 40% | |
| 30% | |
| 20% | |
| 10% |
Table A6.
Pressure relative to different concentrations ( mix) and at two temperatures (50 C and 70 C).
Table A6.
Pressure relative to different concentrations ( mix) and at two temperatures (50 C and 70 C).
| Concentration | Pr (mmHg mmHg−1) at 50 ¼C | Pr (mmHg mmHg−1) at 70 ¼C |
|---|---|---|
| 99% | ||
| 98% | ||
| 97% | ||
| 95% | ||
| 92% | ||
| 90% | ||
| 80% | ||
| 70% | ||
| 60% | ||
| 50% | ||
| 40% | ||
| 30% | ||
| 20% | ||
| 10% |
Appendix B. Chemical and Thermal Activation
- Chemical activation.
This process is to promote ionic exchange in order to free space within the cavity of the zeolite between the ions that the zeolite naturally possesses, for others of equal or different size and charge that, considering their physical and chemical characteristics, promote the formation of the compound to be obtained. The process of chemical activation of natural zeolites is carried out by ion exchange.
- A
- Stage 1.
Only 1 kg of the different natural zeolites was treated. They passed through a mesh to remove plastics and non-porous stones, as shown in Figure A4.

Figure A4.
Treatment of natural zeolites (Clinoptilolite-Puebla and San Luis potosí, Heulandite-sonora).
Figure A4.
Treatment of natural zeolites (Clinoptilolite-Puebla and San Luis potosí, Heulandite-sonora).

The clean zeolites (1 kg each of the three types of zeolites) are subjected to a heat treatment at 250 C for 2.5 h; an aluminum container was used to heat them in the oven.
Subsequently, a 0.1 N solution of was created, using a 1 L volumetric flask, 400 mL beaker, 5 mL pipette, and a knob. The calculation was obtained as follows. The molecular weight of = 36.46 and the amount to be added to the solution was determined by the following equation:
However, because it was in liquid phase, density was used. HCl density = 1.18 g mL
The total volume used was 3084 mL (hydrochloric acid), which was measured with a pipette and added to the volumetric flask. Then, distilled water was added to the capacity mark; all this must be done in the extraction hood (see Figure A5 and Figure A6a).

Figure A5.
Total volume to be used (3084 mL).
Figure A5.
Total volume to be used (3084 mL).

The heating of the 0.1 N solution was carried out until its boiling point, and beakers were used for the high temperatures (placed in the smoke hood) (Figure A6a). The temperature was checked with the thermometer so that it did not pass its boiling point.
It is important to note that the thermal activation of the zeolite heated in the oven must conclude at the same time as the heating of the placed on the electric grill (Figure A6b).

Figure A6.
Heated zeolite in the oven and the acid heated on the grill.
Figure A6.
Heated zeolite in the oven and the acid heated on the grill.

The heated zeolite and was mixed until dissolved (Figure A7).

Figure A7.
Mixture of zeolite and HCl.
Figure A7.
Mixture of zeolite and HCl.

- B
- Stage 2.
Once the zeolite and were mixed, it was necessary to decant the solution to remove the acid. To develop this task, a syringe was used to extract a small portion and obtain samples to visualize if there was acid in the zeolite (two drops of were added to the samples) (Figure A8).

Figure A8.
Decantation and absence of hydrochloric acid.
Figure A8.
Decantation and absence of hydrochloric acid.

The zeolite was washed with distilled water (1 L). This process was carried out several times until the acid was no longer present in the sample solution. Since in the samples it was reflected that the acid does not exist, the zeolite was left under the sun for drying. Subsequently, the activation was carried out by heat treatment.
- Thermal activation.
This task consisted in heating the zeolite to temperatures above 200 C, in order to improve the surface properties and free occluded water that was trapped inside the solid structure at the time of formation.
Before starting the heat treatment, it was necessary to measure the mass of the bottle (with a lid) and the mass of the bottle with 1 g of zeolite. Each zeolite type was added to three bottles to obtain three samples, as shown in Table A7 and Figure A9.

Figure A9.
Measurement of the different zeolite samples.
Figure A9.
Measurement of the different zeolite samples.

Table A7.
Bottle weights and the bottle plus zeolite.
Table A7.
Bottle weights and the bottle plus zeolite.
| Type of Zeolite | Label | Bottle Weight | Bottle Weight and Zeolite |
|---|---|---|---|
| Type 3A (Silica Gel) | Ia | 22.719 g | 23.720 g |
| Ib | 22.048 g | 23.051 g | |
| Ic | 23.004 g | 24.008 g | |
| Clinoptilolite (S.L.Potosí) | IIa | 22.048 g | 23.051 g |
| IIb | 23.014 g | 24.018 g | |
| IIc | 22.297 g | 23.296 g | |
| Heulandite (Sonora) | IIIa | 21.548 g | 22.550 g |
| IIIb | 21.359 g | 22.354 g | |
| IIIc | 22.319 g | 23.315 g | |
| Clinoptilolite (Puebla) | IVa | 22.502 g | 23.497 g |
| IVb | 22.801 g | 23.804 g | |
| IVc | 21.902 g | 22.900 g |
The heat treatment preparation consisted in heating 1 kg of zeolite (natural and synthetic) combined in equal proportions for 2 h at 210 C (Figure A10). The combined zeolite was located below in the internal part of the large desiccator. The main function was to adsorb all the molecules that were inside the desiccator.

Figure A10.
Combined (natural and synthetic) zeolites.
Figure A10.
Combined (natural and synthetic) zeolites.

After heating the combined zeolites, the sample bottles were introduced into the oven with different zeolites at a temperature of 250 C for 5 h or at a temperature of 150 C, measuring the dough every 6 or 8 h until it was constant (Figure A10).
Subsequently, the sample bottles with heated zeolites were very carefully introduced into the large desiccator, where the zeolite heated to 210 C was at the bottom of the desiccator and the bottles (without lids) with samples heated to 250 C being placed above the base of the large desiccator. Then, the bottles with the samples of different zeolites were allowed to cool (without lids) at room temperature to measure the mass of each sample, every 5 h, until the mass was constant Figure A11.

Figure A11.
Desiccator with cover to reduce the exchange of temperature with the outside.
Figure A11.
Desiccator with cover to reduce the exchange of temperature with the outside.

Appendix C. Adsorbents
A synthetic zeolite (Type 3A) and three natural zeolites (Clinoptilolite-San Luis Potosi, Clinoptilolite-Puebla, and Heulandite-sonora) were chosen as adsorbents. They were used to break the azeotrope in the HO/HSO and HO/COH mixtures, adsorbing and having selectivity on the water molecule (Figure A12).

Figure A12.
Desiccator with cover to reduce the exchange of temperature with the outside.
Figure A12.
Desiccator with cover to reduce the exchange of temperature with the outside.

A Scanning Electron Microscope (SEM) was used to observe the zeolites after being chemically and thermally activated. It was observed that the measured diameters, obtained by the Tyler/mesh procedure, were within the range of 2.10–4.50 . Similarly, the materials and elements with which the different natural and synthetic zeolites were composed were observed (Figure A13,Figure A14,Figure A15,Figure A16 and Table A8).
Table A8.
Physical and chemical analysis of zeolites.
Table A8.
Physical and chemical analysis of zeolites.
| Parameters | Type 3A | Clipnotilolite (S.L.Potosí) | Clinoptilolite (Puebla) | Heulandite (Sonora) |
|---|---|---|---|---|
| Density (g mL) | 2.7 | 2.1 | 2.15 | 2.8 |
| Porosity | 0.61 | 0.5 | 0.33 | 0.71 |
The Heterogeneity of the zeolite grains is clearly presented in Figure A13,Figure A14,Figure A15 and Figure A16. The SEM pictures show kaolin exfoliated into thin slices (layers). The 3A zeolite crystallized in fine particles, a greater amount of which was well-formed cubic crystals (Figure A13).
The SEM images demonstrate that the Heulandite and Clinoptilolite are lamellar texture materials (Figure A14,Figure A15 and Figure A16). Increasing the dividing ability shows separate plates or bars (microns in size) are not individual crystal grains of the Heulandite and Clinoptilolite, but only aggregates presented by finer grains of the mineral. Such splitting of zeolite grains is typical for Heulandite and Clinoptilolite cleavage and is a consequence of hydrothermal solution filtration [2].
Figure A14,Figure A15 and Figure A16 show the micrographs of the matter prima (Clinoptilolite and Heulandite). In Figure A14, it can be seen that the particles of Clinoptilolite-S.L. Potosi are larger than those of the Clinoptilolite population with a size greater than 0.4 cm in length and average width. Figure A15 shows the Clinoptilolite-Puebla zeolite particles passed through the # 400 mesh of 38-mm pore size after being ground and crushed. Particles of sizes smaller than 2 mm can also be observed. In addition, nano-sized particles are probably present. In Figure A15 and Figure A16, agglomerated particles are observed, because the zeolite at these sizes is highly hygroscopic with the humidity of the air, and its hydration forms larger clusters.
All zeolites were characterized by SEM to verify their chemical composition and verify that they had no organic matter that could interfere with their subsequent modification. They were also subjected to different temperatures greater than 200 C to observe their thermal behavior.

Figure A13.
Scale display through SEM and chemical composition of Type 3A.
Figure A13.
Scale display through SEM and chemical composition of Type 3A.


Figure A14.
Scale display through SEM and chemical composition of Clinoptilolite-Potosí.
Figure A14.
Scale display through SEM and chemical composition of Clinoptilolite-Potosí.


Figure A15.
Scale display through SEM and chemical composition of Clinoptilolite-Puebla.
Figure A15.
Scale display through SEM and chemical composition of Clinoptilolite-Puebla.


Figure A16.
Scale display through SEM and chemical composition of Heulandite-Sonora.
Figure A16.
Scale display through SEM and chemical composition of Heulandite-Sonora.

Appendix D. PSA Model Parameters
Table A9.
Specification of required parameters to create the model simulation [16].
Table A9.
Specification of required parameters to create the model simulation [16].
| Value | Units | |
|---|---|---|
| Bed height | 0.5 | m |
| Internal diameter of bed | 0.1 | m |
| Inter-particle voidage | 0.4 | m m |
| Intra-particle voidage | 0.63 | m m |
| Bulk density of adsorbent | 729.62 | kg m |
| Adsorbent particle radius | 0.0015975 | m |
| Adsorbent shape factor | 0.0 | n/a |
| Constant mass transfer coefficient (E) | 0.016605 | s |
| Constant mass transfer coefficient (W) | 0.054976 | s |
| Constant dispersion coefficient (E) | 1.0 × 10 | m s |
| Constant dispersion coefficient (W) | 1.7117 × 10 | m s |
| IP | 0.0181 | n/a |
| IP | 0.0 | n/a |
| IP | 42.3794 | n/a |
| IP | 0.0 | n/a |
| Heat capacity of the adsorbent | 1260 | J kg K |
| Constant for the heat transfer coefficient | 1.0 × 10 | J s m K |
| Constant for heat of adsorption (W) | −51.9 | MJ kmol |
| Constant for heat of adsorption (E) | −51.9 | MJ kmol |
| Adsorbent thermal conductivity | 41.26 | W mK |
| Specific surface area of adsorbent | 1126.760 | m |
| Production temperature | 393.15 | K |
| Production pressure | 204.5 | kPa |
| Purge pressure | 16.2811 | kPa |
| Molar fraction (E) | 0.78 | kmol kmol |
| Molar fraction (W) | 0.22 | kmol kmol |
| Number of nodes | 20 | |
| Discretization method | UDS2 |
Table A10.
Initial and boundary conditions for the four basic steps.
Table A10.
Initial and boundary conditions for the four basic steps.
| Cycle PSA | |||
|---|---|---|---|
| Step I (Adsorption) | Step II (Despressurization) | ||
| t = 0 | t=0 | ||
| z = 0 | z = 0 | ||
| z = L | z = L | F= F(valve) | |
| Step III (Purge) | Step IV Repressurization | ||
| t = 0 | t = 0 | ||
| z = 0 | F=F | z = 0 | F= F (valve) |
| z = L | z = L | ||
| Step V (cycle next) | |||
| t = 0 |
References
- Al-Asheh, S.; Banat, F.; Fara, A.A. Dehydration of ethanol–water azeotropic mixture by adsorption through phillipsite packed-column. Sep. Sci. Technol. 2009, 44, 3170–3188. [Google Scholar] [CrossRef]
- Mansouri, N.; Rikhtegar, N.; Panahi, H.A.; Atabi, F.; Karimi, S.B. Porosity, Characterization and structural properties of natural zeolite–Clinoptilolite–as a sorbent. Environ. Prot. Eng. 2013, 39, 139–152. [Google Scholar]
- Carmo, M.J.; Gubulin, J.C. Ethanol–water adsorption on commercial 3a zeolites: Kinetic and thermodynamic data. Braz. J. Chem. Eng. 1997, 14, 1–9. [Google Scholar] [CrossRef]
- Derco, J.; Dudas, J.; Valicková, M.; Sumegová, L.; Murínová, S. Removal of Alkylphenols from Industrial and Municipal Wastewater. Chem. Biochem. Eng. Q. 2017, 31, 173–178. [Google Scholar] [CrossRef]
- Desai, R.; Hussain, M.; Ruthven, D.M. Adsorption of water vapour on activated alumina. I—Equilibrium behaviour. Can. J. Chem. Eng. 1972, 70, 699–706. [Google Scholar] [CrossRef]
- Khalid, M.; Joly, G.; Renaud, A.; Magnoux, P. Removal of phenol from water by adsorption using zeolites. Ind. Eng. Chem. Res. 2004, 43, 5275–5280. [Google Scholar] [CrossRef]
- Williams, C.; Kwakye-Awuah, B.; Sefa-Ntiri, B.; Von-Kiti, E.; Nkrumah, I. Adsorptive removal of iron and manganese from groundwater samples in ghana by zeolite Y synthesized from bauxite and kaolin. Water 2019, 11, 1912. [Google Scholar]
- Muhammad, A.; Shah, A.H.A.; Bilal, S. Comparative study of the adsorption of acid blue 40 on polyaniline, magnetic oxide and their composites: Synthesis, characterization and application. Materials 2019, 12, 2854. [Google Scholar] [CrossRef]
- Rondón, W.; Freire, D.; Benzo, Z.; Sifontes, A.; González, Y.; Valero, M.; Brito, J. Application of 3A zeolite prepared from venezuelan kaolin for removal of Pb (II) from wastewater and its determination by flame atomic absorption spectrometry. Am. J. Anal. Chem. 2013, 4, 584–593. [Google Scholar] [CrossRef]
- Papurello, D.; Gandiglio, M.; Kafashan, J.; Lanzini, A. Biogas Purification: A comparison of adsorption performance in D4 siloxane removal between commercial activated carbons and waste wood-derived char using isotherm equations. Processes 2019, 7, 774. [Google Scholar] [CrossRef]
- Reshetnikov, S.; Kurzina, I.; Livanova, A.; Meshcheryakov, E.; Isupova, L. Effect of Li, Na and K modification of alumina on its physical and chemical properties and water adsorption ability. Matereials 2019, 12, 4212. [Google Scholar] [CrossRef] [PubMed]
- García-Soto, A.R. Síntesis, caracterización y evaluación de un tamiz molecular para la deshidratación de etanol azeotrópico. Master’s Thesis, Universidad Nacional de Colombia, Bogotá, Colombia, 2012. [Google Scholar]
- Hervé, D.M.; Garrido, M.V. Comparación de dos muestras de zeolita en la adsorción De humedad Y remoción de olores. Infomin 2012, 4, 21–31. [Google Scholar]
- Xu, R.; Peng, Y. Preparation of magnetic g-C3N4/Fe3O4 composite and its application in the separation of catechol from water. Materials 2019, 12, 2844. [Google Scholar] [CrossRef] [PubMed]
- Zhao, D.; Cleare, K.; Oliver, C.; Ingram, C.; Cook, D.; Szostak, R.; Kevan, L. Characteristics of the synthetic Heulandite- Clinoptilolite family of zeolites. Micropor. Mesopor. Mat. 1998, 21, 371–379. [Google Scholar] [CrossRef]
- Simo, M.; Brown, C.J.; Hlavacek, V. Simulation of pressure swing adsorption in fuel ethanol production process. Comput. Chem. Eng. 2008, 32, 1635–1649. [Google Scholar] [CrossRef]
- Latifi, M.A.; Salhi, D.; Tondeur, D. Optimisation-based simulation of a pressure swing adsorption process. Adsorption 2008, 14, 1567–1573. [Google Scholar] [CrossRef]
- Sarrouh, B.F.; Jover, J.; Gonzlez, E. Estudio de la hidrólisis del bagazo con acido sulfúrico concentrado utilizando dos variantes de una sola etapa y una sola etapa modificada para la obtención de etanol y análisis técnico-económico de dicho proceso. Rev. Ing. Inv. 2005, 25, 34–38. [Google Scholar]
- Marchetti, J.M.; Errazu, A.F. Esterification of free fatty acids using sulfuric acid as catalyst in the presence of triglycerides. Biomass Bioenergy 2008, 32, 892–895. [Google Scholar] [CrossRef]
- Rumbo-Morales, J.Y.; López-López, G.; Alvarado-Martínez, V.M.; Valdez-Martinez, J.; Sorcia-Vázquez, F.J.; Brizuela-Mendoza, J.A. Simulation and control of a pressure swing adsorption process to dehydrate ethanol. Rev. Mex. Ing. Quím. 2018, 17, 1051–1081. [Google Scholar] [CrossRef]
- Marcoberardino, G.D.; Vitali, D.; Spinelli, F.; Binotti, M.; Manzolini, G. Green hydrogen production from raw biogas: A techno-economic investigation of conventional processes using pressure wing adsorption unit. Processes 2018, 19, 19. [Google Scholar] [CrossRef]
- Chinh, P.V.; Hieu, N.T.; Tien, V.D.; Nguyen, T.Y.; Nguyen, H.N.; Anh, N.T.; Thom, D.V. Simulation and experimental study of a single fixed-bed model of nitrogen gas generator working by pressure swing adsorption. Processes 2019, 7, 654. [Google Scholar] [CrossRef]
- Danilevich, V.V.; Isupova, L.A.; Kagyrmanova, A.P. Highly effective water adsorbents based on aluminum oxide. Kinet. Catal. 2012, 53, 632–639. [Google Scholar] [CrossRef]
- Chapin, G.A.; Sarrouh, B.F.; de la Prida, J.J.; Suarez, E.G. Estudio de la hidrolisis del bagazo con acido sulfurico concentrado para la obtencion de etanol y analisis tecnico-economico de dicho proceso. Rev. Cubana Quím. 2006, 18, 1–95. [Google Scholar]
- Rumbo-Morales, J.Y.; López-López, G.; Alvarado-Martínez, V.M.; Sorcia-Vázquez, F.J.; Brizuela-Mendoza, J.A.; Martínez-García, M. Parametric study and control of a pressure swing adsorption process to separate the water–ethanol mixture under disturbances. Sep. Purif. Technol. 2020, 236, 116214. [Google Scholar] [CrossRef]
- Ucán, C.A.; Abatal, M.; Romero, C.M.; Franseschi, F.A.; Elias, M.A.R.; Lozano, D.C. Removal of an ethoxylated alkylphenol by adsorption on zeolites and photocatalysis with TiO2/Ag. Processes 2019, 7, 889. [Google Scholar] [CrossRef]
- Wang, P.; Sun, Q.; Zhang, Y.; Cao, J. Synthesis of zeolite 4A from kaolin and its adsorption equilibrium of carbon dioxide. Materials 2019, 12, 1536. [Google Scholar] [CrossRef]
- Hauchhum, L.; Mahanta, P.; De Wilde, J. Capture of CO2 from glue gas onto coconut fibre-based activated carbon and zeolites in a fixed Bed. Transp. Porous. Med. 2015, 110, 503–519. [Google Scholar] [CrossRef]
- Zhang, X.J.; Qiu, L.M. Moisture transport and adsorption on silica gel-calcium chloride composite adsorbents. Energy Conv. Man. 2007, 48, 320–326. [Google Scholar] [CrossRef]


© 2020 by the authors. Licensee MDPI, Basel, Switzerland. This article is an open access article distributed under the terms and conditions of the Creative Commons Attribution (CC BY) license (http://creativecommons.org/licenses/by/4.0/).