Article

A Protection Scheme for a Power System with Solar Energy Penetration

1
Department of Electrical Engineering, Manipal University Jaipur, Rajasthan 303007, India
2
Department of Electrical Engineering, BSD University Jaipur, Rajasthan 303007, India
3
Department of Electrical Engineering, Hawassa University, Awasa, Ethiopia
4
Power System Planning Division, Rajasthan Rajya Vidhyut Prasaran Nigam Ltd., Jaipur, Rajasthan 302005, India
5
Department of Electrical and Computer Engineering, Isfahan University of Technology, Isfahan 84156-83111, Iran
6
Department of Electrical Power Engineering, Faculty of Mechanical and Electrical Engineering, Tishreen University, Lattakia 2230, Syria
7
Department of Management & Innovation Systems, University of Salerno, 84084 Fisciano (SA), Italy
*
Authors to whom correspondence should be addressed.
Appl. Sci. 2020, 10(4), 1516; https://doi.org/10.3390/app10041516
Submission received: 31 January 2020 / Revised: 16 February 2020 / Accepted: 20 February 2020 / Published: 23 February 2020

Abstract

:
As renewable energy (RE) penetration has a continuously increasing trend, the protection of RE integrated power systems is a critical issue. Recently, power networks developed for grid integration of solar energy (SE) have been designed with the help of multi-tapped lines to integrate small- and medium-sized SE plants and simultaneously supplying power to the loads. These tapped lines create protection challenges. This paper introduces an algorithm for the recognition of faults in the grid to which a solar photovoltaic (PV) system is integrated. A fault index (FI) was introduced to identify faults. This FI was calculated by multiplying the Wigner distribution (WD) index and Alienation (ALN) index. The WD-index was based on the energy density of the current signal evaluated using Wigner distribution function. The ALN-index was evaluated using sample-based alienation coefficients of the current signal. The performance of the algorithm was validated for various scenarios with different fault types at various locations, different fault incident angles, fault impedances, sampling frequencies, hybrid line consisting of overhead (OH) line and underground (UG) cable sections, different types of transformer windings and the presence of noise. Two phase faults with and without the involvement of ground were differentiated using the ground fault index based on the zero sequence current. This study was performed on the IEEE-13 nodes test network to which a solar PV plant with a capacity of 1 MW was integrated. The performance of the algorithm was also tested on the western part of utility grid in the Rajasthan State in India where solar PV energy integration is high. The performance of the algorithm was effectively established by comparing it with the discrete Wavelet transform (DWT), Wavelet packet transform (WPT) and Stockwell transform-based methods.

1. Introduction

Solar energy (SE) integration into the network of power system networks is continuously increasing to meet the decarbonisation targets. This will change the fault level, network topology and the system’s stability. Fault levels become intermittent in nature due to uncertainties of solar energy which depend on the environmental conditions [1]. This may result in the failure of the operation of existing protection schemes due to the pre-set values. This has forced the design and selection of a suitable protection scheme for the reliable operation and control of the power system with a high penetration level of SE. Protection systems deployed for the power system network with SE integration must be independent of events which include direction of power flow, fault current, unbalanced loads, variable generation, and plug and play generators [2]. This can be achieved by the use of signal processing and machine learning techniques in the field of protection. An elaboration along with the relative performance of various methods for the detection of faults in the solar PV-based system is presented in [3] where the authors discussed various methods for the recognition of faults on both direct current (DC) and the alternating current (AC) side of the solar PV interfaced grid. This study is also effective in differentiating faulty events from islanding events. A detailed study of the challenges associated with the protection of grid integrated distributed generation (DG) and adaptive protection schemes for these systems are presented in [4]. This study helps to select a protection scheme for RE integrated grids depending on the penetration level. A detailed study related to the application of signal processing techniques and intelligent methods such as artificial neural network (ANN), fuzzy set theory (FST), and expert system (ES) in the field of the protection of DG sources in an integrated power system is presented in [5]. This study is effective in selecting the most suitable protection scheme for the RE-based grids depending on the type of RE source, the type of generator and the penetration level. Harrou et al. [6] proposed a fault detection method by reducing noise and false alarms in the solar photovoltaic (PV) integrated power network. This is based on a multi-scale representation of the Wavelets. This method is effective in monitoring faults on a DC bus with a solar PV system. This protection scheme is capable of providing protection in the presence of noise using multiscale representation. In [7], the authors proposed a protection scheme for a solar PV-integrated micro-grid using a deep convolution neural network (CNN) which is effective under the intermittent nature of solar radiation. This has the merit of identifying the discriminatory features with a reduced computational cost. Valencia et al. [8], proposed a special protection scheme (SPS) for the Chilean grid which helps to increase the penetration level of solar energy. This was achieved in terms of technical and economic incentives by managing the congestion and dynamic response. In [9], the authors introduced an algorithm based on fast recursive discrete Fourier transform (FRDFT) for the protection of a distribution system integrated with DG. This is a novel, fast and adaptive relay technique for relay systems which is effective for obtaining the optimal protection settings when system conditions are continuously changing. A wavelet packet transform (WPT)-supported technique for the identification of faults in the solar PV system integrated grid using energy- and standard deviation-based indices is reported in [10]. It is established that performance of WPT is superior than the WT due to the use of detailed filtering for finding all frequencies superimposed on the signal. A better performance was achieved by this method due to its detailed filtering of signals.
A scheme for the protection of the power system network interfaced with a solar PV generation plant using discrete wavelet transform (DWT) is presented in [11]. However, the performance of this method is affected by the presence of noise. In [12], the authors proposed an algorithm supported by the Stockwell transform for the protection of the power system network integrated with solar PV generation. This algorithm overcomes the demerits of the DWT-based scheme; however, it has the disadvantage of a low protection speed due to the requirement of the large size of the input data. Hence, a new algorithm for protection of the power system with SE penetration which has the merits of a high protection speed, independently of the direction of the power flow, fault current, nature of loads and generation, needs to be designed. These are considered as key factors in this work and the main contributions are detailed below.
  • This paper introduced an algorithm which is effective for providing high-speed protection to the power system incorporated with SE.
  • The proposed protection scheme is based on the use of fault index computed from the combined features which are extracted from current signals using the Wigner distribution function and alienation coefficient. The type of fault is recognized using the number of faulty phases identified with the help of the proposed fault index. However, a ground fault index computed using the Wigner distribution function-based decomposition of zero sequence current is proposed for the discrimination of the double phase fault and the double phase to ground fault from each other.
  • The performance of the algorithm will not be affected by the presence of noise. Furthermore, this algorithm works well in various operating scenarios in the presence of solar energy such as fault location, variations in the fault impedance, fault incidence angle, all types of transformer windings and hybrid combination of the OH line and the UG cable.
  • Algorithm effectively discriminates the switching transients from the faulty transients.
The contents of this article are arranged into ten sections. After the introduction in Section 1, 
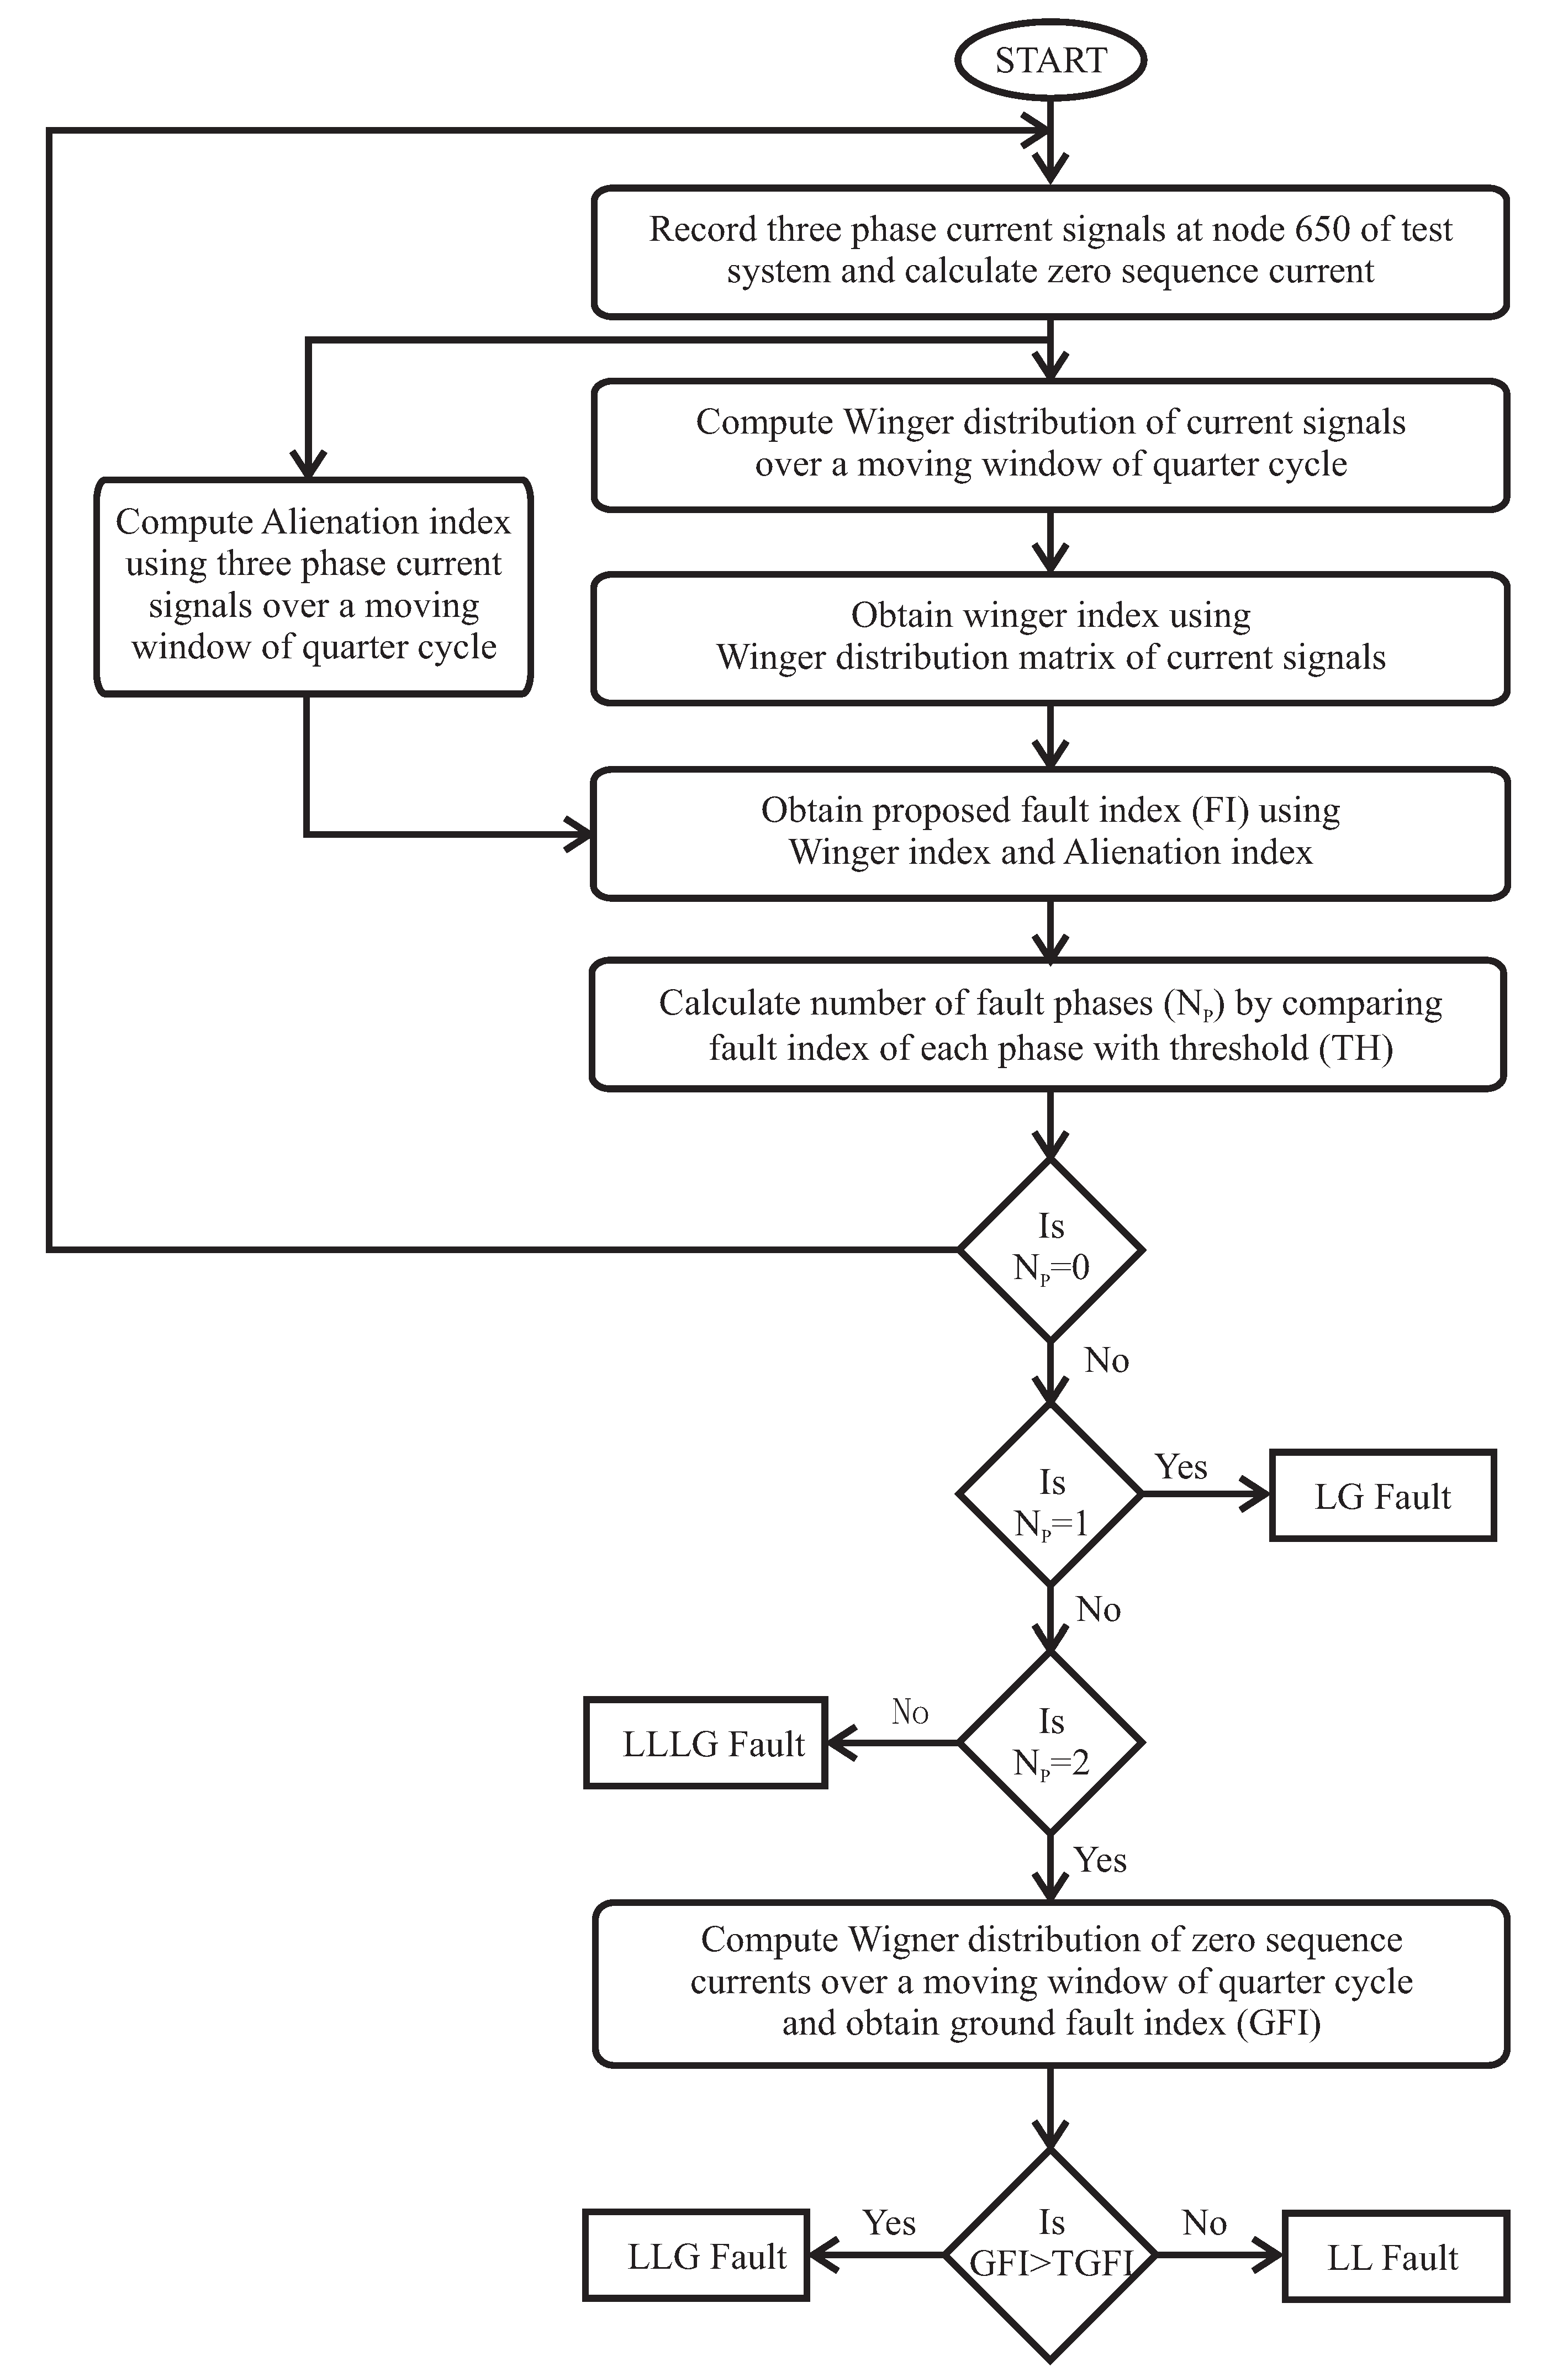
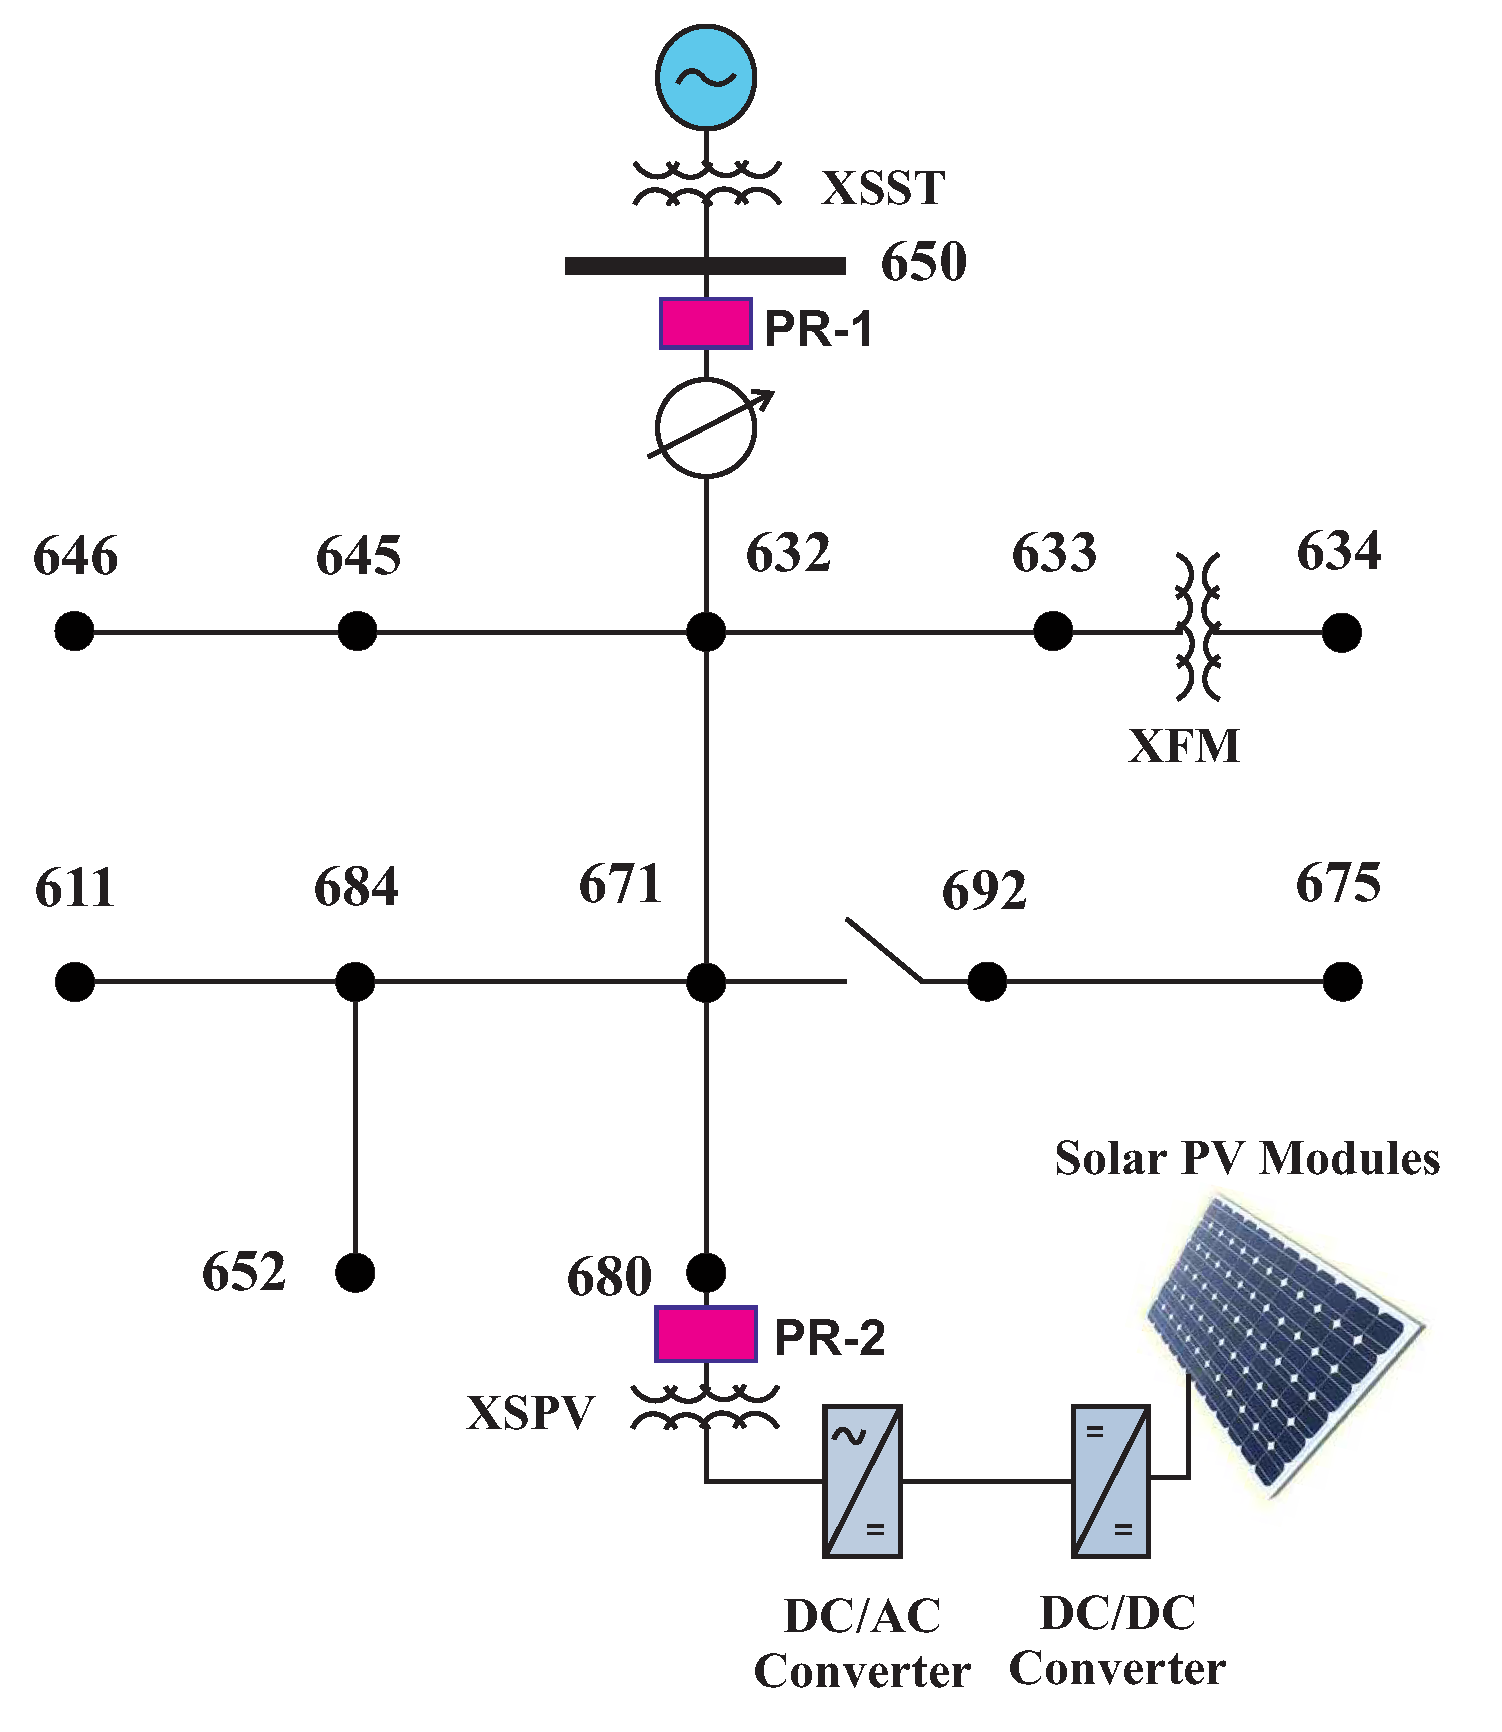
Section 2 describes the IEEE-13 node test network, incorporated with SE. The algorithm of the proposed protection scheme is detailed in the Section 3. 
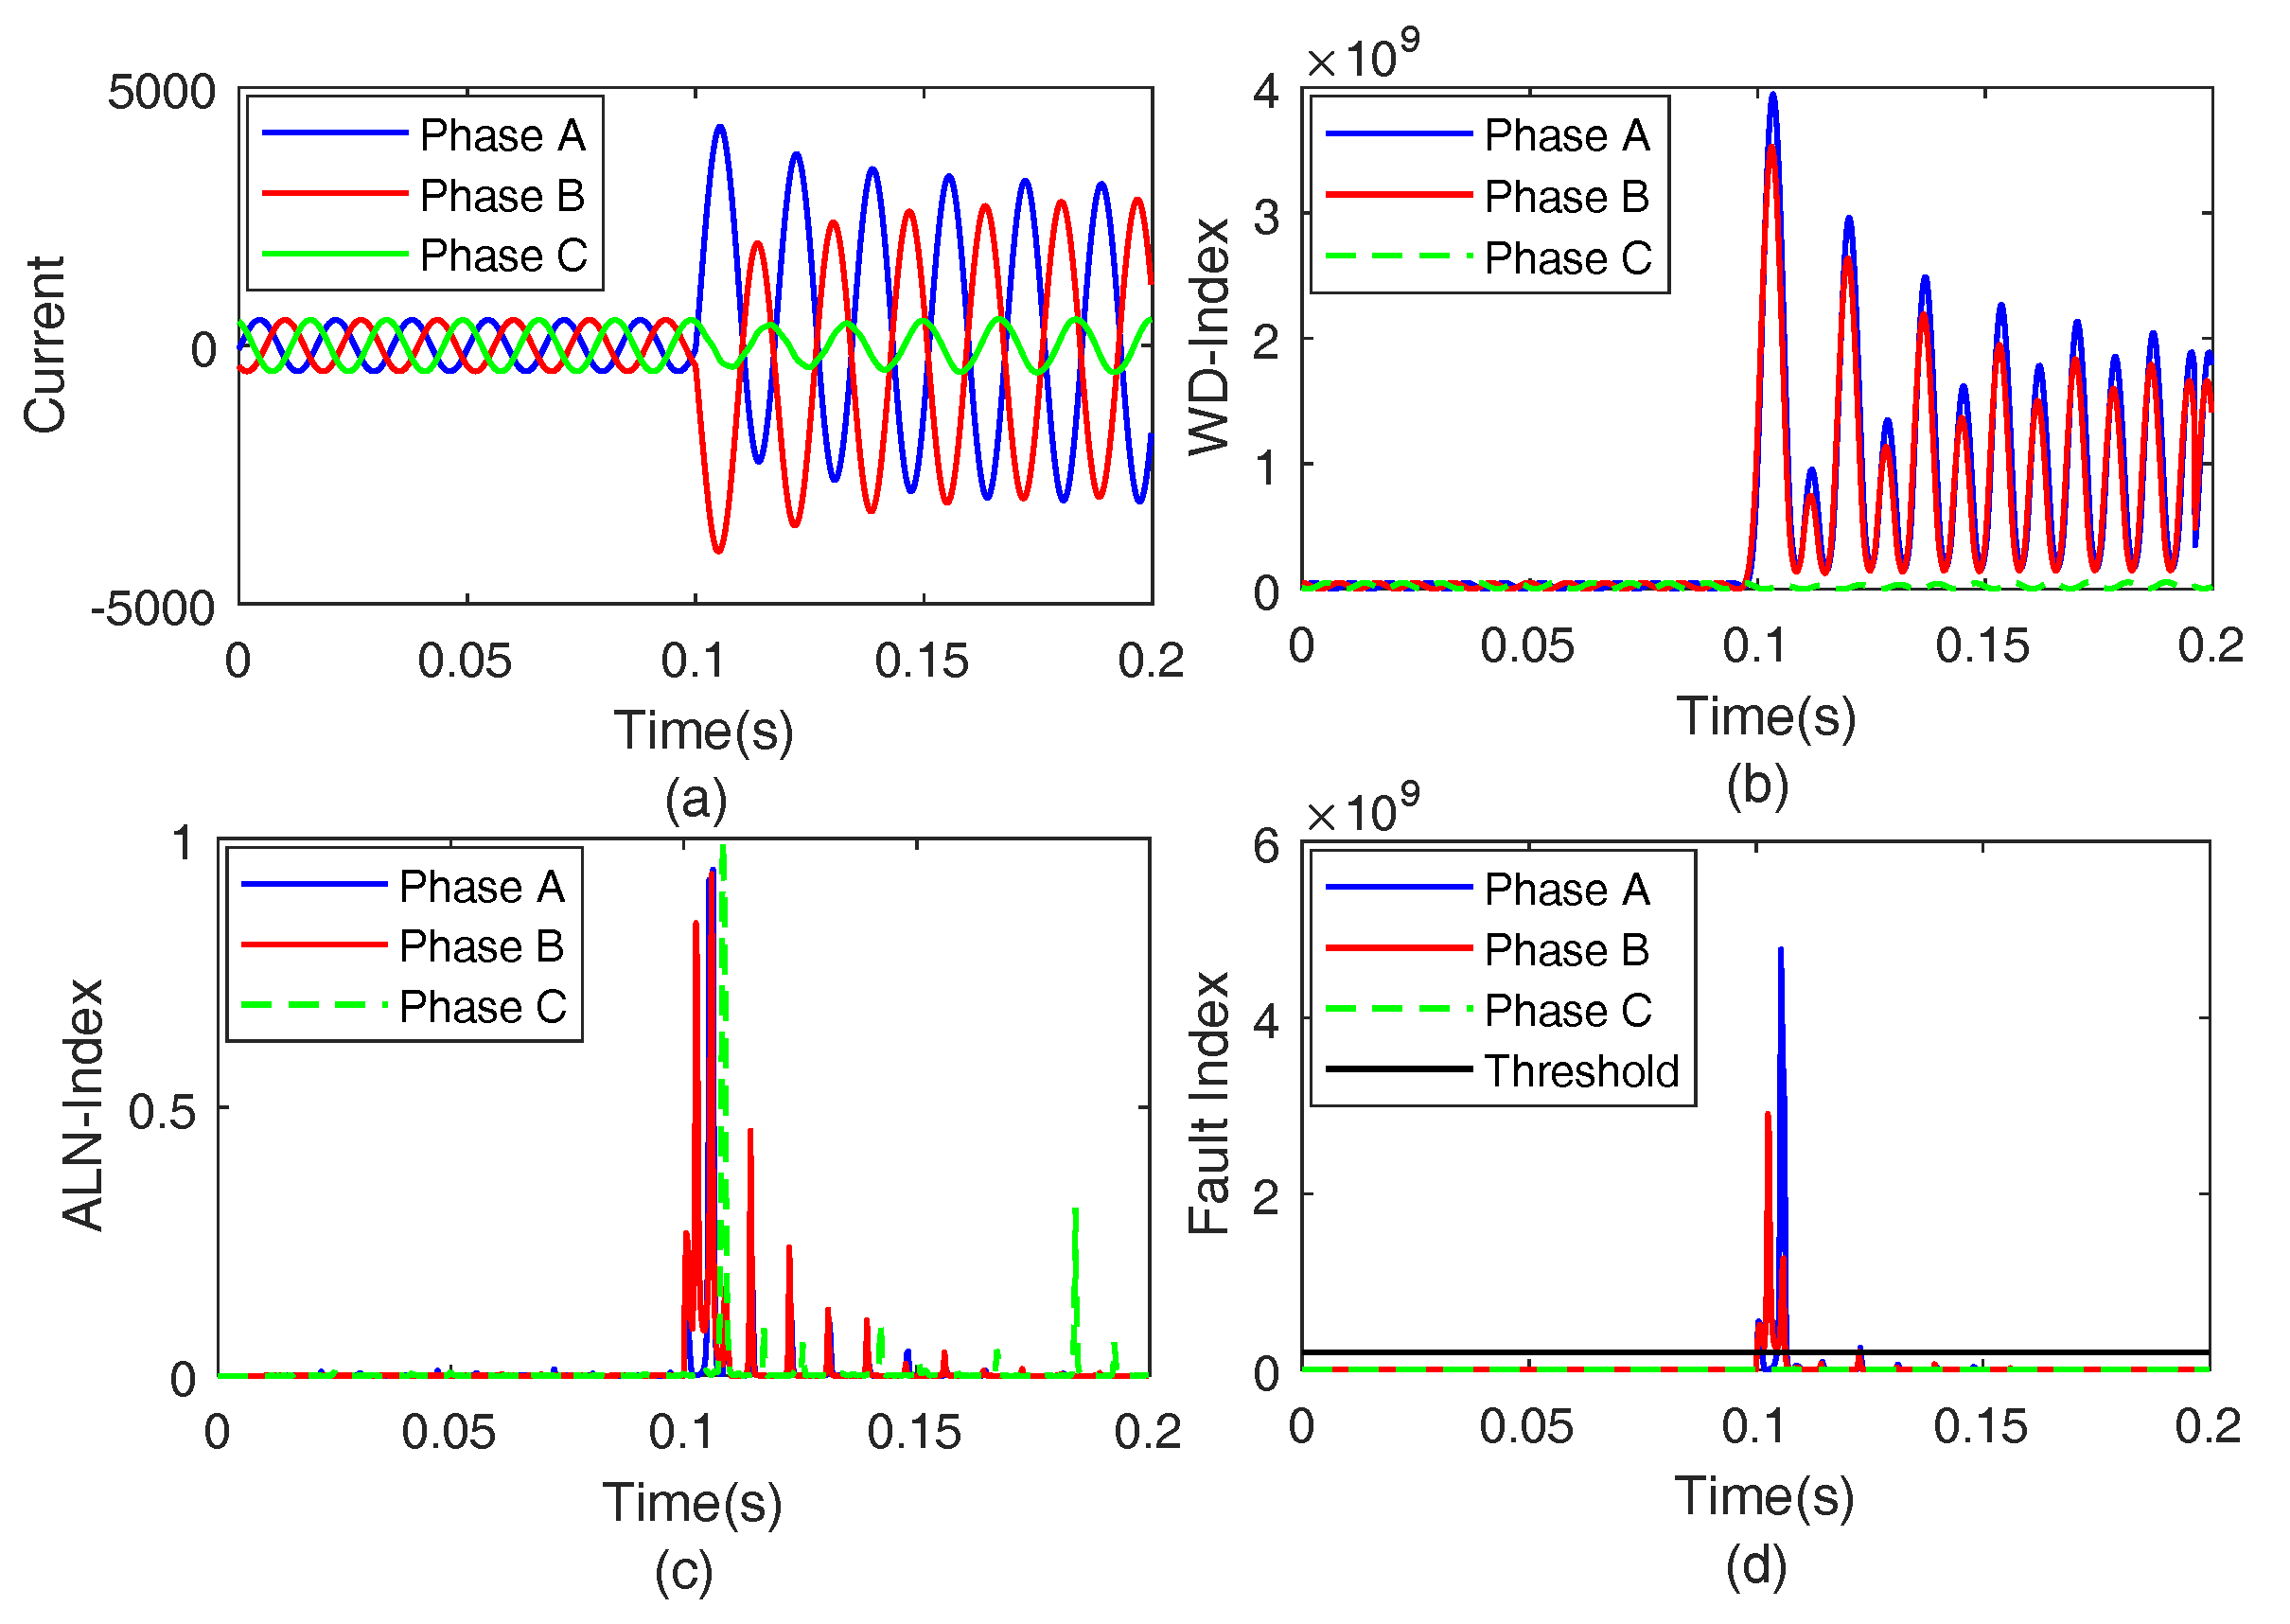
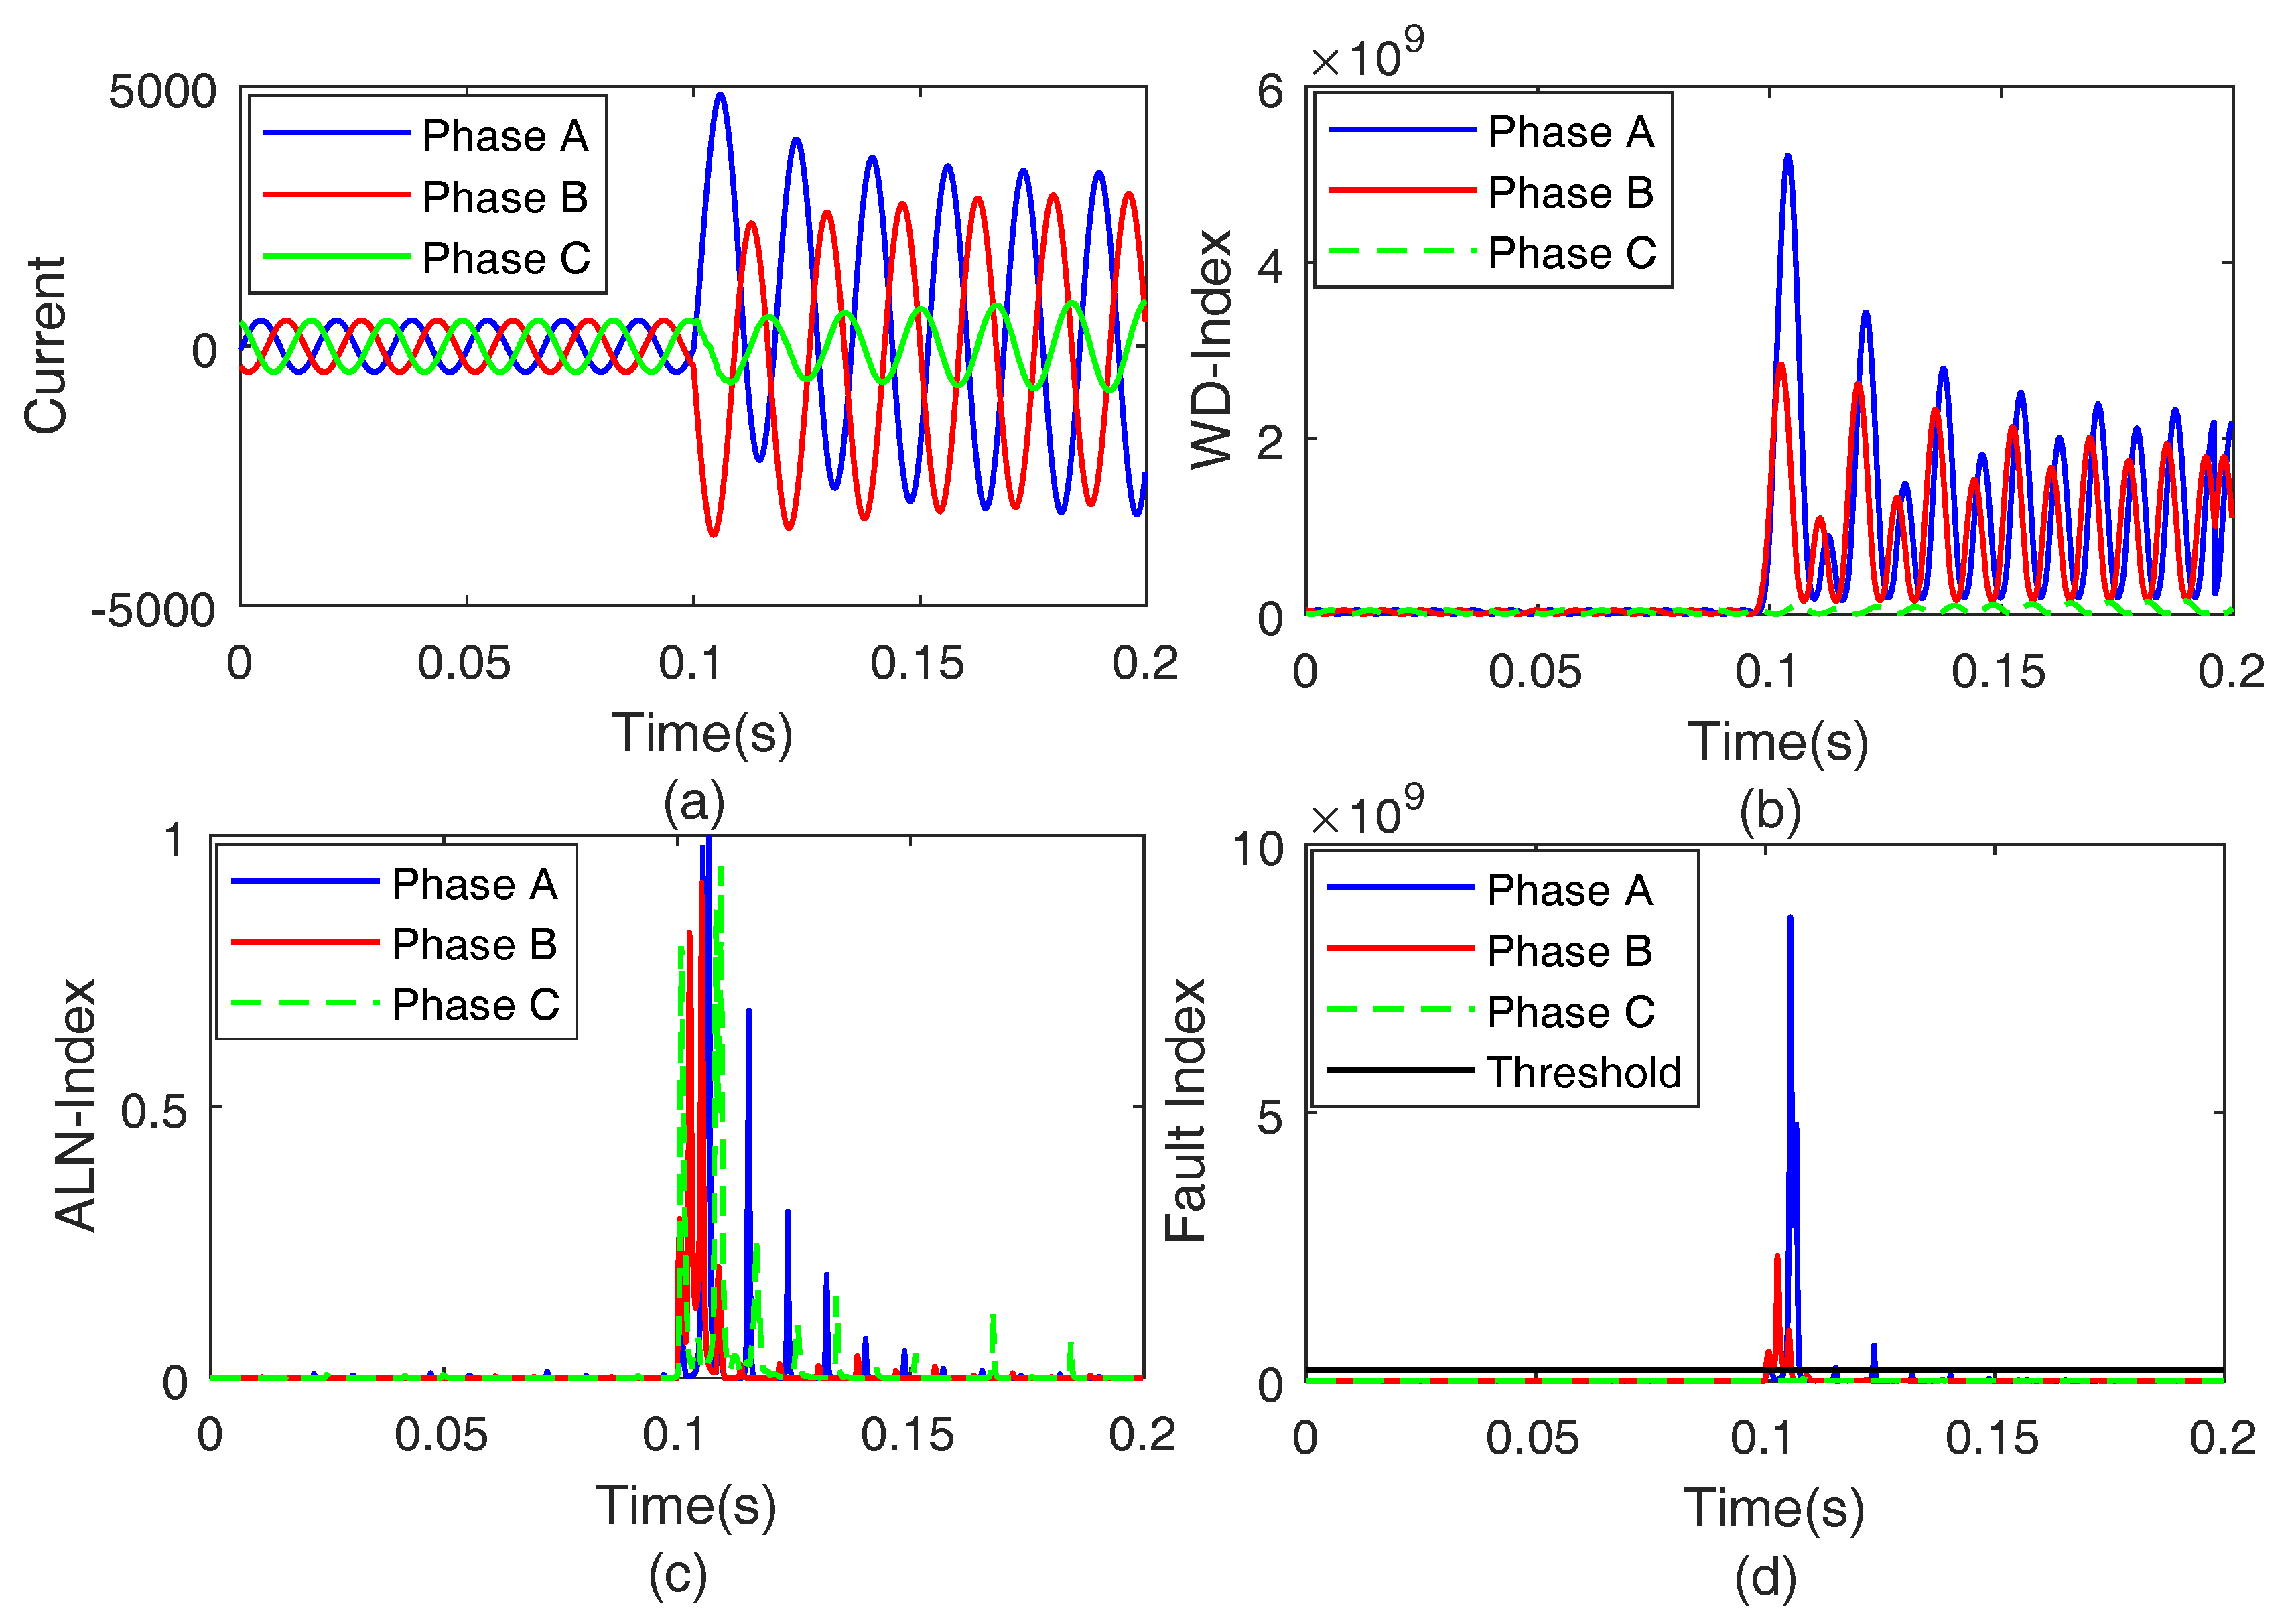
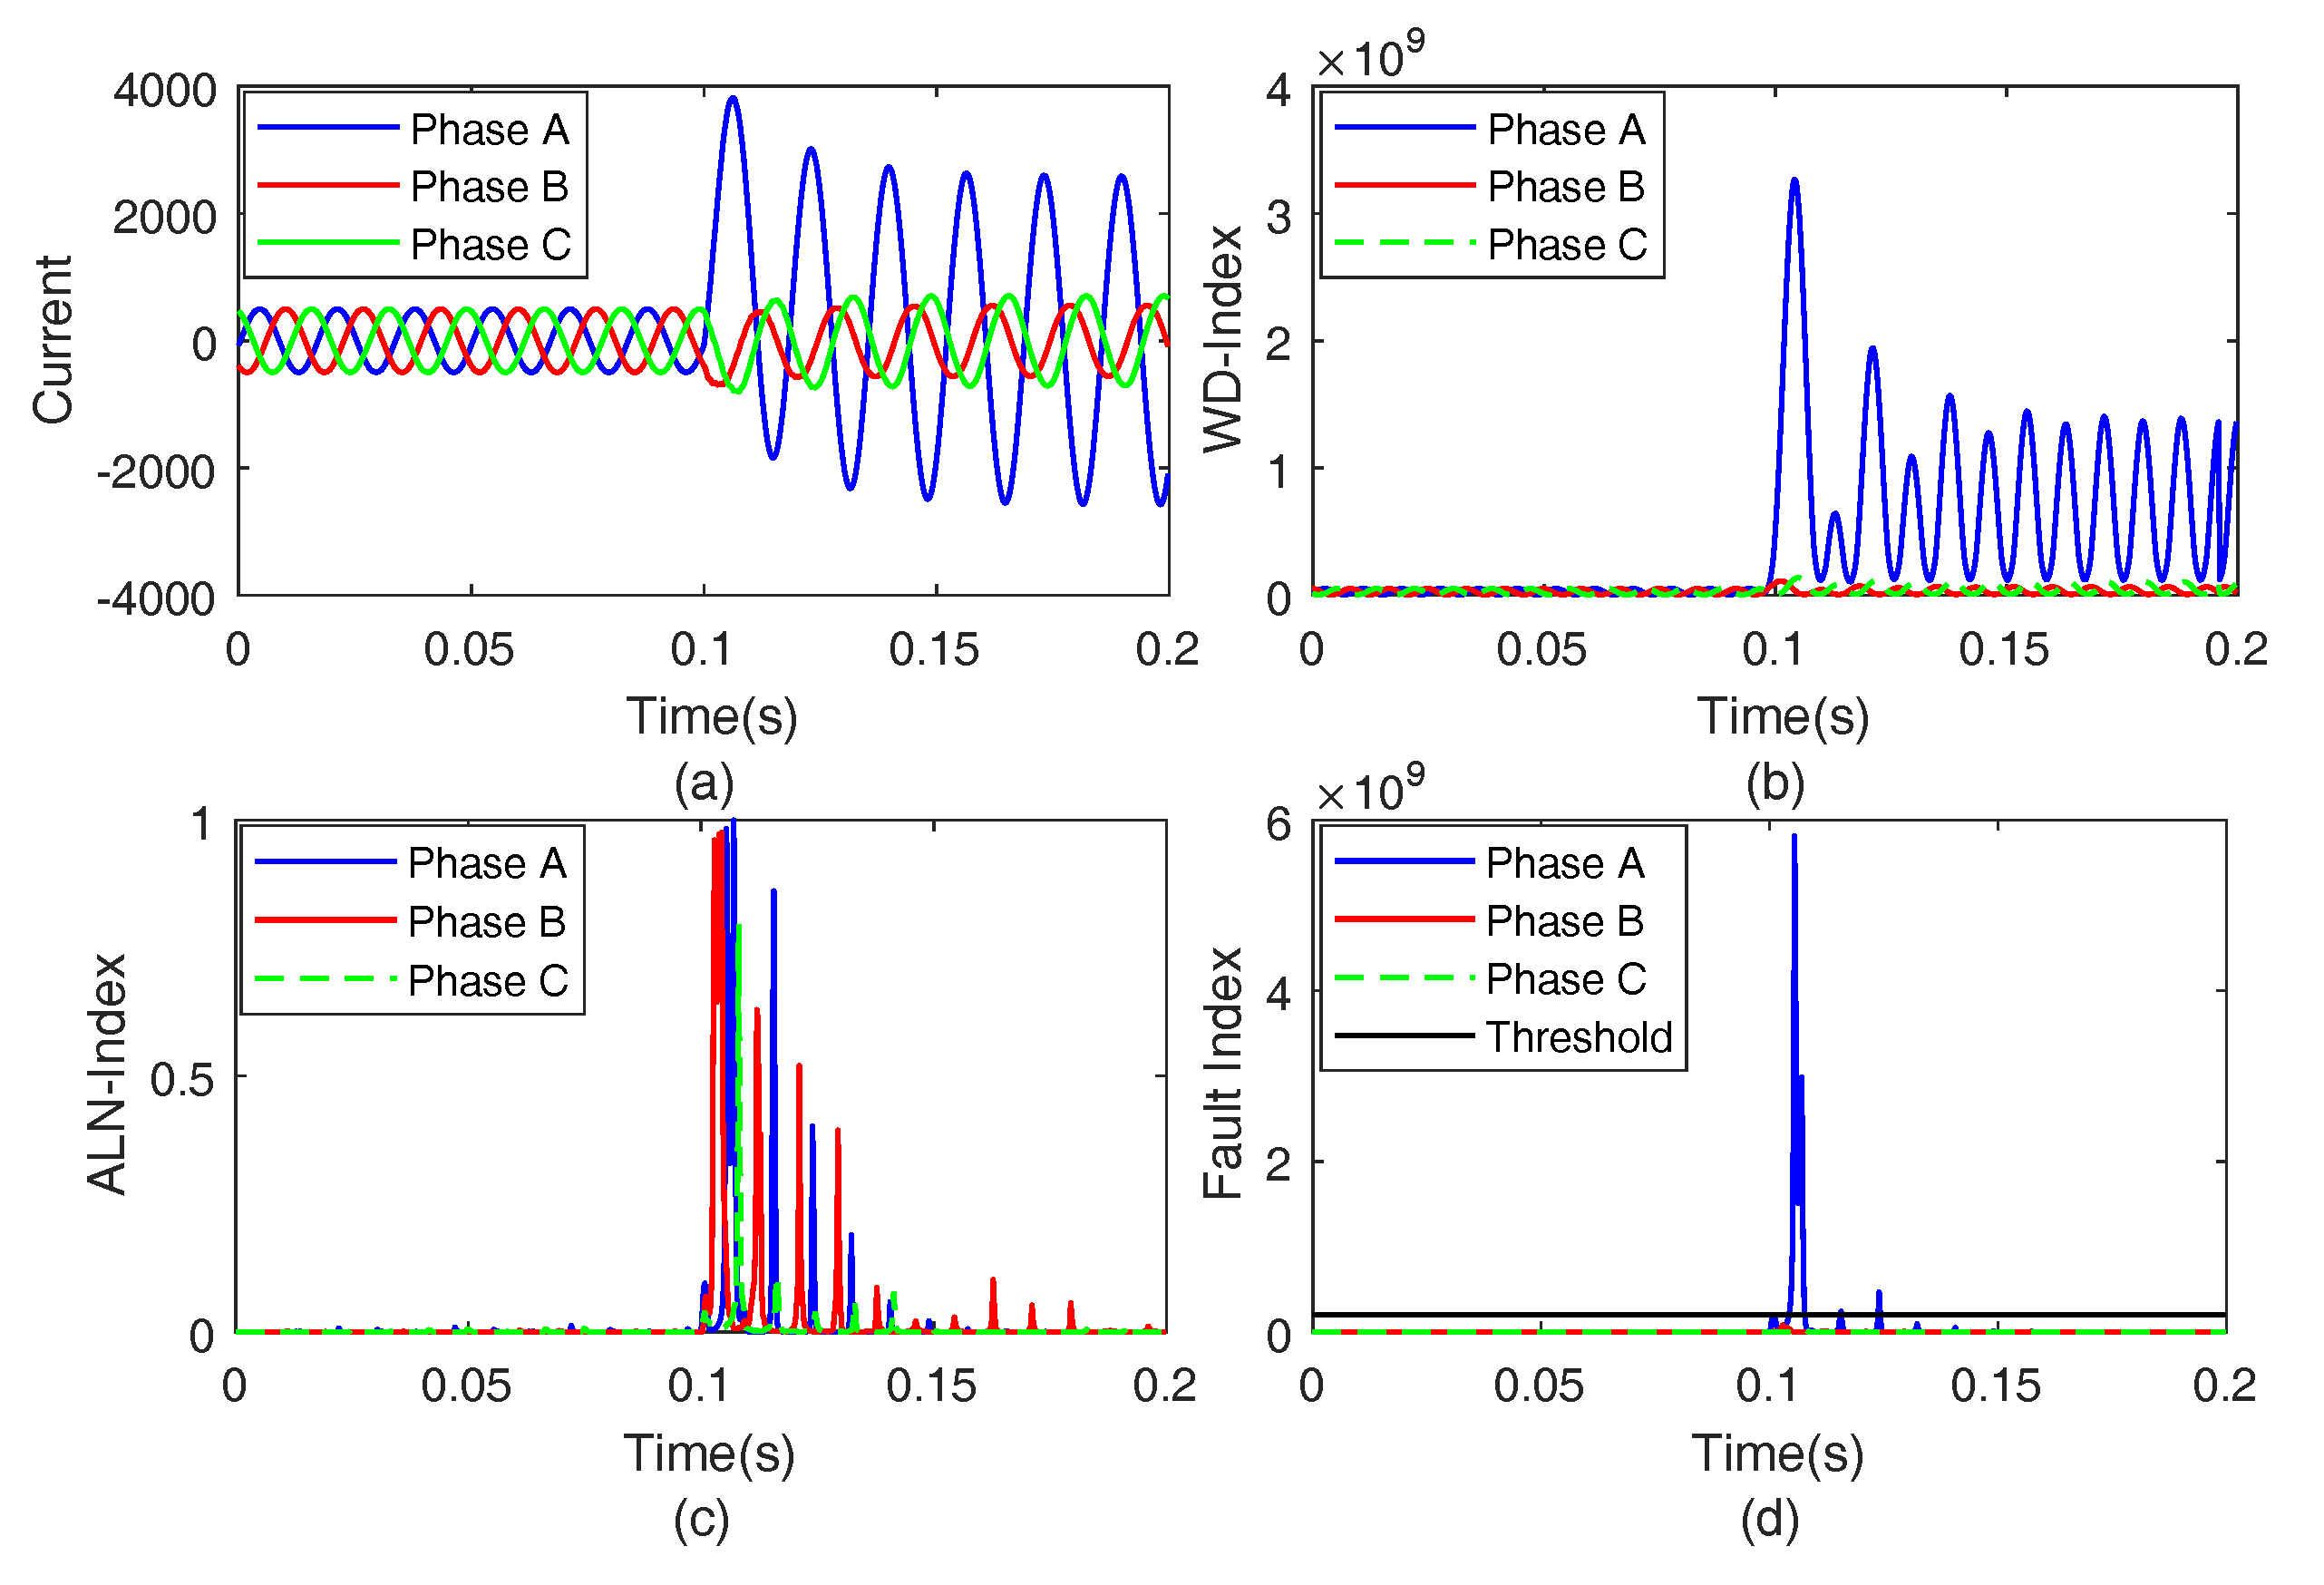
Section 4 includes simulation results for the fault identification. Fault classification results are included in Section 5. The results for various case studies are included in 
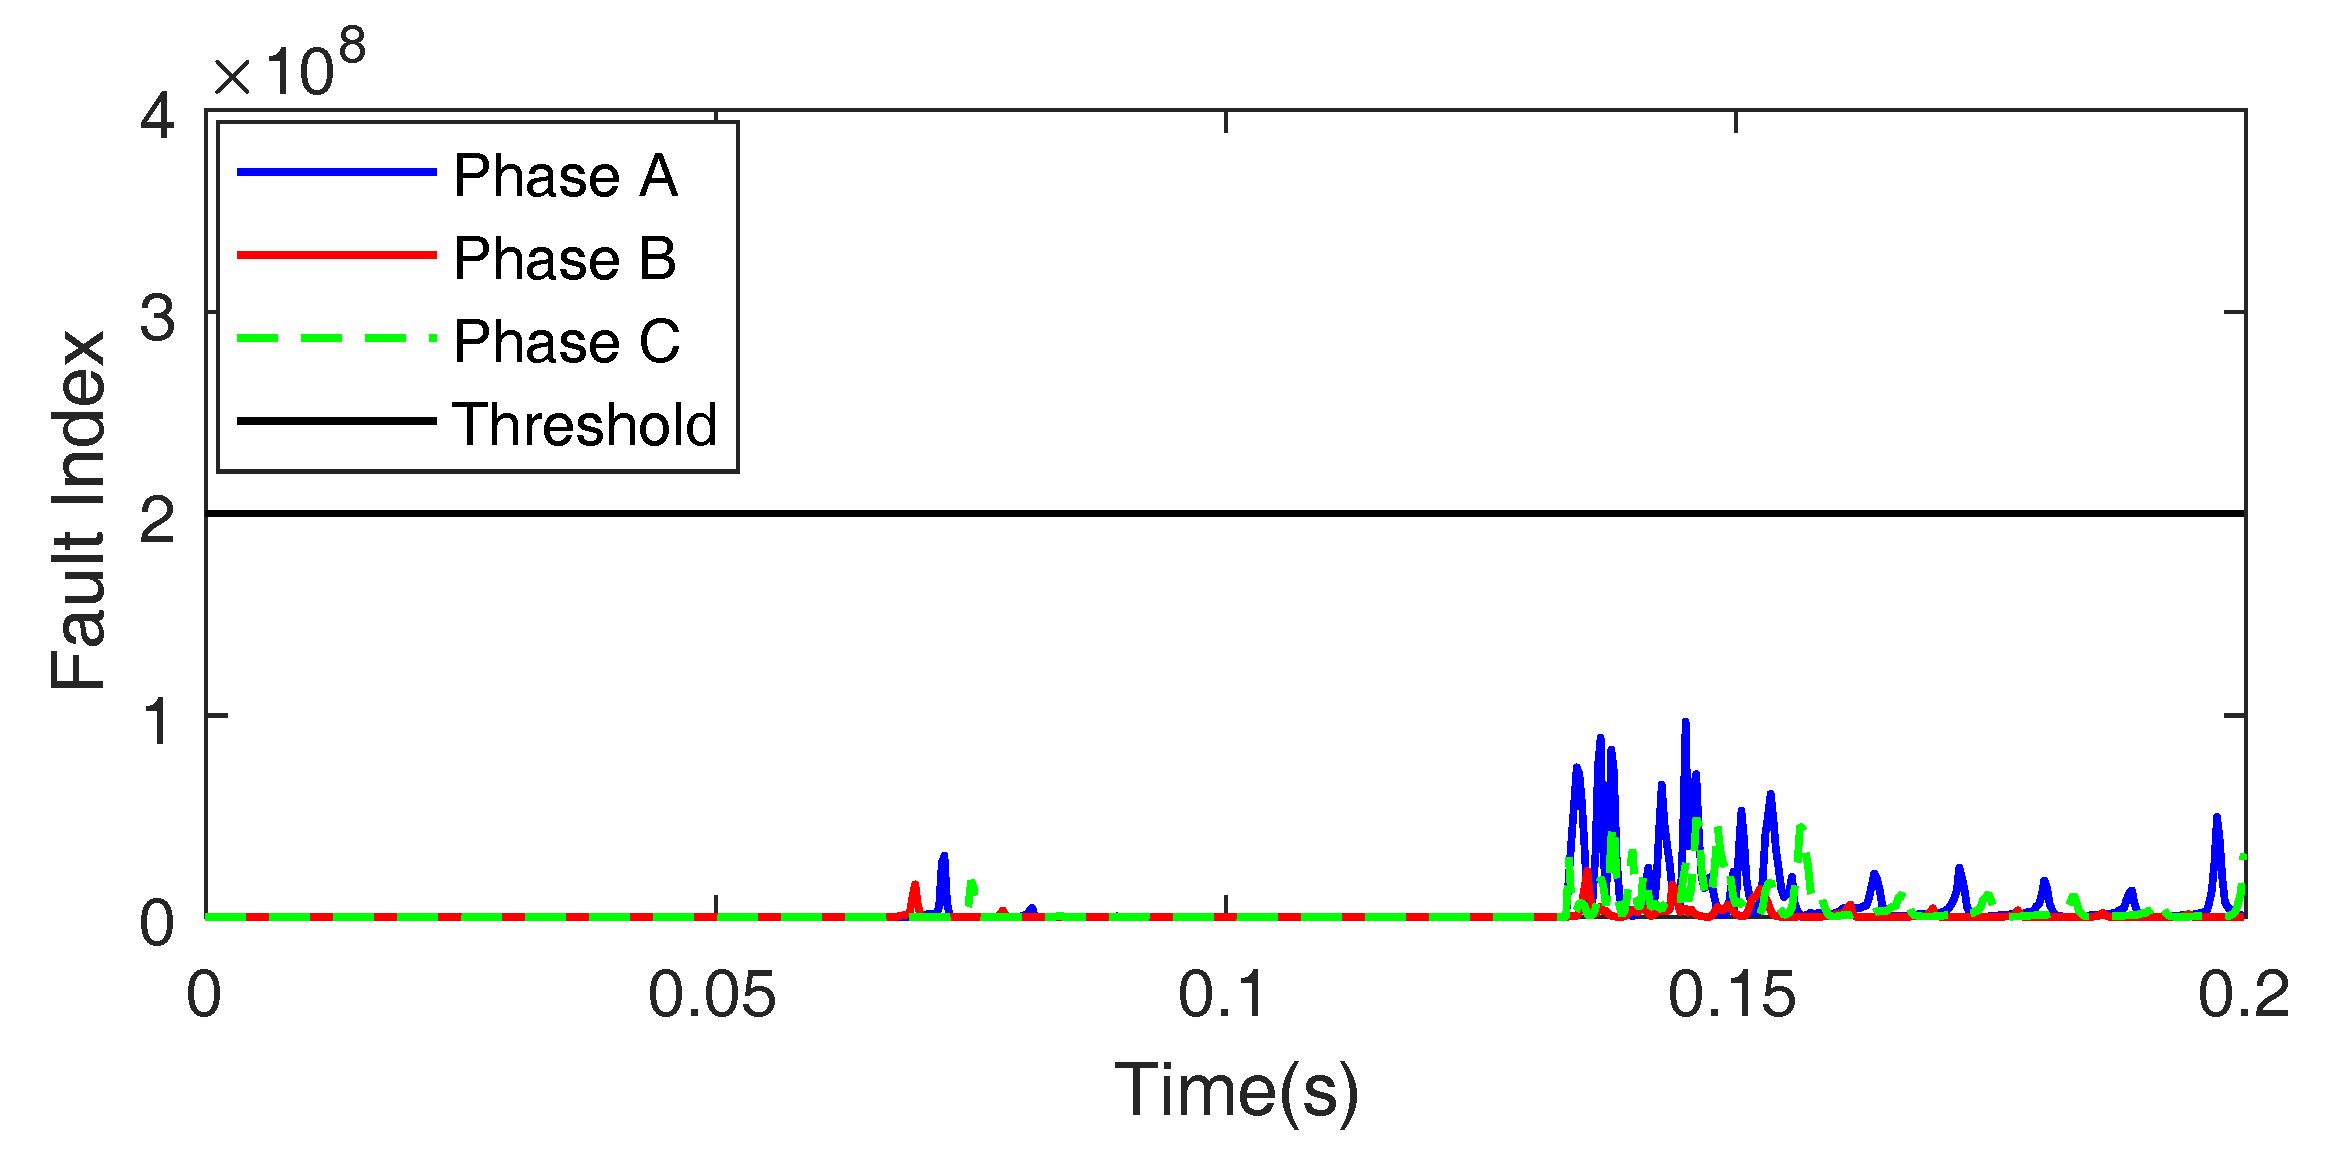
Section 6. The discrimination of switching transients from the faulty transients is discussed in Section 7. The validation of the protection scheme on the real-time network of Rajasthan State in India is included in Section 8. A performance comparison of the proposed protection scheme with other existed schemes in the presence of solar energy is detailed in Section 9, followed by Section 10, which presents the conclusion.

2. Proposed Test System

A modified IEEE-13 node network was used to perform the study of protection in the presence of SE. This network has the capacity of 5 M V A which supplies power to feed balanced and unbalanced loads. It is operated at a 60 Hz frequency and voltage levels of 0.48 kV and 4.16 kV [13,14]. This network was modified by incorporating a solar PV system with a capacity of 1 MW at node 680 using a transformer XSPV and overhead line with a length of 5 km, as illustrated in Figure 1. The positive and zero sequence resistances of this line are 0.1153 and 0.413 Ω /km, respectively. The positive and zero sequence inductances of the line are 1.05 e 3 and 3.32 e 3 H/km, respectively. The positive and zero sequence capacitances of the line are 11.33 e 9 and 5.01 e 9 F/km, respectively.
Three phase overhead (OH) lines and underground (UG) cables were used is this network for the proposed study, as illustrated in Table 1. OH lines used configuration 601, for which the impedance matrix ( Z 601 ) is given by the relation (1) in Ω /km. The UG cable used the configuration 606, for which the impedance matrix ( Z 606 ) is given by the relation (2) in Ω /km. Positive and zero sequence capacitance magnitudes of 1.57199 nF/km and 1.3398 nF/km, respectively, were used for configuration 601 of OH line. These values used for configuration 606 of the UG cable are each equal to 15.96979 µF/km. All the loads are considered as three-phase balanced whose details are provided in Table 2. The lengths of all OH lines and UG cables are the same as those used in the network of the original test system [15,16].
Z 601 = 0.2153 + j 0.6325 0.0969 + j 0.3117 0.0982 + j 0.2632 0.0969 + j 0.3117 0.2097 + j 0.6511 0.0954 + j 0.2392 0.0982 + j 0.2632 0.0954 + j 0.2392 0.2121 + j 0.6430
Z 606 = 0.4960 + j 0.2773 0.1983 + j 0.0204 0.1770 + j 0.0089 0.1983 + j 0.0204 0.4903 + j 0.2511 0.1983 + j 0.0204 0.1770 + j 0.0089 0.1983 + j 0.0204 0.4960 + j 0.2773
The test feeder was integrated to the grid using a substation transformer (XSST). The transformer used between nodes 633 and 634 was designated as XFM. The details of transformer parameters are tabulated in Table 3.
Protection relay (PR-1) was installed near node 650 of the test system to disconnect the test network from the grid due to fault event. The currents were recorded and continuously processed using the proposed algorithm and tripping signals were given to the circuit breaker (CB) during the faulty event. A protection relay (PR-2) was also installed near the node 680 to isolate the solar PV plant during the faulty condition. However, as per the actual requirement of the system, the protection relay may be installed at any node of the test system. The proposed algorithm works well for all the locations. However, a weight factor may be required for the proposed fault index which depends on the relay location. Detailed results are discussed for PR-1.

Solar PV System

A photovoltaic (PV) system operated in grid integrated mode consists of components such as solar PV plates, a boost converter, a maximum power point tracking (MPPT) system, an inverter, a grid coupling inductor and a capacitor, and a transformer. For a solar PV power generation system, the device in which actual power generation takes place (solar to electrical) is the solar panel, which consists of series and parallel combinations of solar cells. A solar cell consists of a p-n junction (p-n diode) fabricated in a thin layer of the semiconductor.Its operational characteristics are similar to the p-n diode. These characteristics also depend on the solar radiations and surface temperature of the PV plate. The electrical equivalent circuit of a solar cell is modelled using a single diode or double diode topology. Double-diode model has high accuracy under certain operating conditions. However, the single diode equivalent model is simple in nature with sufficient accuracy. This allows for the development of explicit models using the single diode model. The single diode equivalent circuit of the solar PV cell with parallel and series resistances utilized in this study is shown in Figure 2 [17].
In present study, a solar PV plant with a capicity of 1 MW was used. This consists of ten units (each with a capacity of 100 kW) connected in parallel. The relation between the output voltage (V) and current (I) for a solar cell (single-diode equivalent circuit) is expressed as below [18].
I = I p h I 0 e x p q ( V + I R s ) A k T 1 V + I R s R s h
where I p h : photo-current of PV cell, I 0 : saturation current of PV cell, A: curve fitting factor of PV cell, R s h : shunt resistance of PV cell, R s : series resistance of PV cell, q: electronic charge, and k: Boltzmann constant.
The magnitude of R s h is infinite in short-circuit conditions. At this condition, the slope of I-V characteristics tends toward zero [18]. Hence, I p h is equal to short-circuit current ( I s c ) [17]. For a PV array organized in N p parallel and N s series connected solar cells, the current is expressed as follows:
I = N p I s c N p I 0 e x p q ( V + I ( N s / N p ) R s ) N s A k T 1
The parameters simulated in this study for each module (at standard test conditions) are as follows: V o c = 64.2 V, I s c = 5.96 A, V m p = 54.7 V, I m p = 5.58 A, R s = 0.037998 Ω , R s h = 993.51 Ω , I 0 = 1.1753 e 8 A, diode quality factor Q d = 1.3 , and I p h = 5.9602 A [19]. The V m p and I m p are, respectively, the voltage and the current at the point of maximum power tracking.

3. Proposed Algorithm of Protection Scheme

The algorithm supported by the Wigner distribution function and alienation coefficient is proposed to be implemented in two steps for the identification and classification of faults on the power system incorporated with a solar PV plant. The first step involves the detection of the investigated faults. The second step involves the classification of faults using the number of faulty phases identified in the detection stage. A fault index (FI) is introduced for the detection of faults on the SE-penetrated power network. This FI is obtained by multiplication of the WD-index and ALN-index. The threshold was set to a value of 2 × 10 8 , which was decided by testing the algorithm on 25 datasets of each type of fault. This dataset was prepared by the variations in parameters, such as fault incidence angle, fault impedance, fault location, superimposing noise on current signals, etc. FI is considered as a key factor for the discrimination of the faulty and healthy phases. A higher FI magnitude compared to the threshold value indicates the faulty phase and a lower magnitude indicates the healthy phase. The number of faulty phases was used to identify the fault type. A ground fault index (GFI) was introduced to discriminate the double phase fault and double phases to the ground fault. This algorithm used the waveform pattern deviations; hence, the normalization of parameters is not required. The performance of the algorithm will be affected by the power network configuration and penetration level of the SE. However, the algorithm can be used in different network configuration and SE penetration levels by changing the threshold magnitude. The proposed algorithm is detailed in Figure 3. The WD-index, ALN-index, FI and GFI are described below.

3.1. ALN-Index

The alienation index (ALN-index) is evaluated using sample-based alienation coefficients of current signals. The sampling frequency used for the study was 3.84 kHz. The selection of this sampling frequency is explained in the case studies section. The following relation was utilized for the evaluation of the ALN-index:
A L N i n d e x = 1 r 2
where r is used to indicate the correlation coefficient between variables x and y. The following relation expresses these variables:
r = N s x y ( x ) ( y ) [ N s x 2 ( x ) 2 ] [ N s y 2 ( y ) 2 ]
where N s indicates the sample numbers in a cycle (64 samples in this study), x represents the current samples recorded at t 0 time, y represents the current samples recorded at T + t 0 time where T is the current signal time period [20,21]. The ALN-index is computed using the moving window approach using quarter-cycle samples. This is implemented by comparing the data of the present quarter cycle with the data of the previous cycle with the help of a moving window (one sample step) with a quarter-cycle width. The ALN-index has the merit of a sharp change at the time of fault incidence, which helps to reduce the fault detection time and make the protection scheme fast.

3.2. WD-Index

The Wigner distribution function was used to decompose the current signal at sampling frequency of 3.84 kHz to compute the WD-index. This index was evaluated by obtaining the Wigner distribution of the current signals over a quarter cycle. The window moving by the one sample step is used for the continuous computation of the Wigner distribution. The Wigner distribution uses the energy density of the current signal for fault estimation. This performs a bilinear analysis using the time domain current signal f ( t ) twice. The advantages of the WD-index include the higher concentration of energy and time-frequency resolution [22]. The WD-index evaluated using current signal ( f ( t ) ) is effectively expressed by the following relation [23,24]:
W D i n d e x = f ( t + τ 2 ) f * ( t + τ 2 ) e j ω τ d τ
where t: sliding variable of time; ω : angular frequency of signal; τ : signal function in time domain.

3.3. Fault Index

The fault index (FI) used for the identification of faults on the power system incorporating SE was evaluated by multiplying the ALN-index with the WD-index for a period of a quarter cycle using the following relation:
F I = ( A L N i n d e x ) × ( W D i n d e x )
The proposed fault index using combined features of WD-index and ALN-index detects faults in the power network with SE penetration with a high accuracy. However, a false tripping indication may be observed by the use of the WD-index and the ALN-index, individually.

3.4. Ground Fault Index

FI is not effective to discriminate between the double phase fault and double phases to ground fault. Hence, a new index based on the Wigner distribution of the zero sequence component of the current signal sampled at a frequency of 3.84 kHz was introduced and designated as the ground fault index (GFI). In the event of double phases to the ground fault, the GFI magnitude is high compared to the threshold of the ground fault index (TGFI). The low magnitude of the GFI compared to the TGFI indicates the event of a double phase fault. The TGFI is set as equal to 2 × 10 7 .

4. Identification of Faulty Events

The results for the identification of various natures of faults incidents on network of the power system in the presence of solar energy are detailed in this section. All fault types are simulated at node 671 of the test system whereas the current is recorded on node 650 at the location of the protection relay (PR-1).

4.1. Phase-A to Ground Fault

A fault on phase-A involving ground (AG fault) was simulated as an incident at the sixth cycle. The currents recorded on the node 650 processed using the algorithm and results for a period of 0.2 s (12 cycles) are described in Figure 4. It can be seen from Figure 4a that the current corresponding to phase-A increases after the AG fault whereas the change in the currents of phase-B and phase-C is very small. Figure 4b depicts the WD-index corresponding to the phase-A with high magnitude when there is the incident of a fault.The magnitude of this index corresponding to the phases-B & C is low after the incidence of a fault. Figure 4c illustrates the ALN-index which has a high magnitude corresponding to all the phases at the instant of fault incidence. Figure 4d illustrates the fault index. It can be inferred from this figure that the magnitude of FI corresponding to the faulty phase (phase-A) is high compared to the threshold, whereas the magnitude of this FI corresponding to the healthy phases (phase-B & C) is low compared to the threshold. Hence, the algorithm proposed in this paper effectively detects the AG fault and also identifies the healthy and faulty phases.

4.2. Phase-A to Phase-B Fault

A fault involving phase-A and phase-B (AB fault) was simulated as an incident at the sixth cycle. The currents recorded on the node 650 were processed using the algorithm and the results for a period of 0.2 s (12 cycles) are depicted in Figure 5. It can be seen from Figure 5a that the magnitude of the currents corresponding to phases-A & B increases after the AB fault, whereas the change in the current of phase-C is very small. Figure 5b depicts the WD-index corresponding to phases-A & B, which has a high magnitude during the incidence of a fault. The magnitude of this index corresponding to the phase-C is low after the incidence of a fault. Figure 5c illustrates the ALN-index which has a high magnitude corresponding to all the phases at the time of the fault incidence. Figure 5d illustrates the fault index. It can be inferred that the magnitude of the FI corresponding to faulty phases (phases-A & B) is high compared to the threshold, whereas this FI corresponding to the healthy phase (phase-C) has a low magnitude compared to the threshold. Hence, the algorithm proposed in this paper effectively detects the AB fault and also identifies the healthy and faulty phases.

4.3. Phase-A and Phase-B to Ground Fault

A fault on phases-A & B and involving ground (ABG fault) was simulated as an incident at the sixth cycle. The currents recorded on the node 650 were processed using the algorithm and the results for a period of 0.2 s (12 cycles) are depicted in Figure 6. It can be seen from Figure 6a that the magnitude of the currents corresponding to phases-A & B increase after the ABG fault, whereas the change in the current of phase-C is very small. Figure 6b depicts the WD-index corresponding to phases-A & B, which has a high magnitude during the incidence of a fault. The magnitude of this index corresponding to phase-C is low after the incidence of fault. Figure 6c illustrates the ALN-index with a high magnitude corresponding to all the phases at the time of a fault incidence. Figure 6d illustrates the fault index. It can be inferred that the magnitude of FI corresponding to the faulty phases (phases-A & B) is high compared to the threshold, whereas this FI corresponding to the healthy phase (phase-C) has a low magnitude compared to the threshold. Hence, the algorithm proposed in this paper effectively detects the ABG fault and also identifies the healthy and faulty phases.

4.4. Three Phase Fault Involving Ground

A fault involving all phases and grounds (ABCG fault) was simulated as an incident at the sixth cycle. The currents recorded on node 650 were processed using the algorithm and results for a period of 0.2 s (12 cycles) are depicted in Figure 7. It can be seen from Figure 7a that a magnitude of currents corresponding to all phases increases after the ABCG fault. Figure 7b depicts the WD-index corresponding to all the phases with a high magnitude during the incidence of a fault. Figure 7c illustrates the ALN-index which has a high magnitude corresponding to all the phases at the time of fault incidence. Figure 7d illustrates the fault index in which the FI has a high magnitude compared to the threshold corresponding to all the phases at the time of a fault incidence. Hence, the algorithm proposed in this paper effectively detects the ABCG fault.

5. Fault Classification

Different fault types were classified using the number of faulty phases, as illustrated in Figure 3. There are three faulty phases during the incidence of a three-phase fault and only one phase is faulty during the incidence of a phase to ground fault. There are two faulty phases during the events of a double-phase fault and a double-phase to ground fault. These faults were classified using the ground fault index, as described in Figure 8. It is inferred that GFI has higher magnitude than the TGFI ( 2 × 10 7 ) for the double-phase fault involving ground and lower for the double-phase fault not involving ground.

6. Application of Algorithm to Various Scenarios for Fault Identification: Case Studies

To investigate the application of the proposed algorithm in different conditions in the presence of solar energy, faults were investigated in various scenarios, such as fault location at different nodes of the test system, fault impedance variations, fault incidence angle variations, the effect of noise, the effect of the variable sampling frequency and the effect of the hybrid line consisting of UG cable and OH line. Results are also presented for the recognition of faults at PCC. The results for the identification of faults are discussed in the following sections. A detailed analysis of AG fault is presented and the algorithm is equally applicable for all fault types.

6.1. Effect of Fault Location

The location of a fault on the network also affects the nature of faulty transients, which affects the performance of the protection scheme. Hence, the algorithm was tested for the two critical locations of faults on nodes 652 and 634.

6.1.1. Fault on Bus 652

All the types of faults were simulated on node 652. This node was considered because the line between this node and node 650 (where currents are recorded) consists of hybrid combination of the UG cable and OH lines. The results for phase-A to ground fault are detailed in Figure 9. WD-index corresponding to the phase-A has a high magnitude at the moment of fault incidence, as depicted in Figure 9b, whereas the magnitude of this index corresponding to the phases-B & C is low. Figure 9c illustrates that ALN-index has a high magnitude corresponding to all the phases due to fault incidence. Figure 9d illustrates that the fault index corresponding to faulty phase (phase-A) is high compared to the threshold, whereas this FI corresponding to healthy phases (phases-B & C) has a low magnitude compared to the threshold. Hence, the algorithm effectively detects the AG fault and also identifies the nature of the phases. It is also established that the algorithm is effective in the identification of faults on a hybrid combination of lines consisting of the UG cable and OH line sections.

6.1.2. Fault on Bus 634

All types of faults were simulated on node 634. This node is considered because a transformer (XFM) is available between nodes 633 and 634. Node 634 is operated at a voltage of 0.48 kV and node 633 is operated at a voltage of 4.16 kV. The results for the phase-A to ground fault are detailed in Figure 10. The WD-index corresponding to phase-A has a high magnitude at the moment of fault incidence, as depicted in Figure 10b which shows that the magnitude of this index corresponding to phases-B & C is low. Figure 10c illustrates that the ALN-index has a high magnitude corresponding to all the phases due to fault incidence. Figure 10d illustrates that the fault index corresponding to faulty phase (phase-A) is high compared to the threshold, whereas this FI corresponding to the healthy phases (phase-B & C) has a low magnitude compared to the threshold. Hence, the algorithm effectively detects the AG fault incidence on node 634 and also identifies the nature of the phases. This also established that the algorithm is effective for the identification and classification of faults when transformers and lines are available between the fault location point and the point at which the protection scheme is established.

6.2. Variation of Fault Impedance

The nature of the fault transients depends on the fault impedance which might affect the performance of the protection scheme. Hence, the algorithm was tested for fault impedances of 0 Ω , 5 Ω , 10 Ω , 15 Ω , 20 Ω and 25 Ω for all the investigated faults. The fault index magnitude associated with all the phases during the incidence of an AG fault on node 671 is provided in Table 4. This is infers that the fault index has a higher value compared to the threshold ( 2 × 10 8 ) corresponding to phase-A and low corresponding to phases-B & C. Hence, the AG fault is effectively detected in the presence of fault impedance up to 25 Ω . The algorithm also works efficiently for all types of faults.

6.3. Variation of Fault Incidence Angle

The nature of fault transients also depends on the fault incidence angle which might affect the performance of the protection scheme. Hence, the performance of the algorithm was tested with various incidence angles of faulty events which include 0°, 30°, 60°, 90°, 120° and 150° for all types of investigated faults. The fault index magnitude associated with all the phases during the incidence of an AG fault at node 671 is provided in Table 5. It can be observed that the fault index has a higher value compared to the threshold ( 2 × 10 8 ) corresponding to phase-A and a low value corresponding to phases-B & C for all fault incidence angles. Hence, the AG fault was effectively detected with different fault incidence angles. The algorithm also works efficiently for all types of faults. Hence, it is established that the proposed algorithm is effective for the identification of different types of faults with different fault incidence angles.

6.4. Effect of Type of Transformer Winding

The nature of fault transients may be affected by the type of windings of the transformer installed between the fault location and the relay point which might affect the performance of the protection scheme [25]. Hence, the performance of the algorithm was tested using different types of windings for the transformer (XFM) installed between nodes 633 and 634 for all types of investigated faults. The fault index magnitude associated with all the phases during the incidence of an AG fault at node 671 in the presence of a transformer with windings such as star-star ( Y Y ), where both windings are the start type with grounding ( Y g Y g ), star-delta ( Y Δ ), delta-delta ( Δ Δ ) and the primary winding is the start type with grounding and the secondary winding is delta ( Y g Δ ), provided in Table 6. It can be observed that the fault index has higher values than the threshold ( 2 × 10 8 ), corresponding to phase-A and low values corresponding to phases-B & C in the presence different types of transformer windings. It is also observed that the presence of delta winding reduces the FI. Further, the presence of ground connection also reduces the FI. Therefore, before installation of relay at a particular location, a proper weight factor should be selected to avoid any false tripping indication. Hence, it is established that the proposed algorithm is effective for the identification of different types of faults in the presence of different types of transformer windings.

6.5. Effect of Noise

Power system distribution and transmission lines pass through the terrain where the possibility of interference from external factors is high. This may introduce noise which might affect the performance of the protection schemes and result in false tripping. Hence, the algorithm was tested for the identification of all types of faults by adding a noise level of 10 dB signal to noise ratio (SNR) to the current signals. The results of the phase-A to ground fault are detailed in Figure 11. The WD-index corresponding to phase-A has a high magnitude during the incidence of a fault, as depicted in Figure 11b, whereas the magnitude of this index corresponding to phases-B & C is low. Figure 11c illustrates that the ALN-index has a high magnitude corresponding to all the phases at the time of fault incidence. Figure 11d illustrates that the fault index corresponding to the faulty phase (phase-A) is high compared to the threshold, whereas this FI has a lower magnitude than the threshold corresponding to the healthy phases (phase-B & C). Hence, the algorithm effectively detects the AG fault and also identifies the nature of phases in the presence of a high level noise of 10dB SNR.

6.6. Effect of Variation in Sampling Frequency

The frequency used for sampling the current signals might affect the performance of the protection scheme. Hence, the algorithm was tested for various sampling frequencies. It is observed that during the event of phase-A to ground fault, the FI corresponding to the faulty phase-A was found to be 9.7 × 10 8 , 2.8 × 10 9 and 3.1 × 10 9 with sampling frequencies of 1.92 kHz, 3.84 kHz and 7.68 kHz, respectively. Hence, for sampling frequency below 3.84 kHz, the peak magnitude of FI decreases and it may go below the set threshold magnitude. A sampling frequency higher than 3.84 kHz improves the accuracy of protection scheme but increases the fault detection time due to the bulky input dataset. Therefore, the optimum sampling frequency was selected as 3.84 kHz for the protection scheme.

6.7. Effect of Variation in Feeder Parameters

The proposed algorithm was tested for variations in the parameters of the feeder between nodes 632 and 671. The algorithm was tested for line to ground (AG) fault with the impedance of this feeder kept equal to 100%, 80%, 110%, 120% and 150% and the values of the fault index corresponding to the faulty phase (phase-A) were observed, respectively, as 5.8 × 10 9 , 7.1 × 10 9 , 5.6 × 10 9 , 5.4 × 10 9 , and 4.2 × 10 9 . Further, the FI corresponding to the healthy phases-A & B was found to be below the threshold value. Hence, the algorithm effectively works with the variations in the parameters. The algorithm also effectively detected the LL, LLG and LLLG faults with variable parameters of the feeder between nodes 632 and 671.

6.8. Fault identification with Current Measurement on SE Injection Node

To generalize the applicability of the proposed algorithm, the current was recorded at node 680 (PR-2 relay location) of the test system where solar power was injected during a phase-A to ground fault on node 671. The current was processed using the algorithm and the results are illustrated in Figure 12. A weight with a value of 5 was used for FI to detect the fault on the PR-2 relay location (node 680). Figure 12 illustrates that the fault index corresponding to the faulty phase (phase-A) is higher than the threshold whereas this FI has a lower magnitude corresponding to healthy phases (phase-B & C) than the threshold. Hence, the algorithm effectively detects the AG fault on node 671 by a current measurement on node 680 (point of SE injection).

7. Differentiation between Switching and Faulty Transients

The algorithm was also tested to discriminate the switching events from the faulty events and the results are discussed in this section.

7.1. Effect of Feeder Tripping and Reclosing

The switch between nodes 671 and 692 was opened at the fourth cycle and re-closed at the sixth cycle to realize the event of feeder tripping and re-closing. The results for a period of twelve cycles to analyse the performance of algorithm are detailed in Figure 13. It can be inferred from Figure 13a that the current waveform deviates from its sinusoidal nature at the moment of feeder tripping as well as re-closing by a small disturbance. It can be observed from Figure 13b that the WD-index has small magnitude peaks at the moment of feeder tripping and re-closing. Figure 13c indicates that the ALN-index has high magnitude peaks at the time of tripping and re-closing of the feeder. Figure 13d indicates that FI has relatively high magnitudes at the time of feeder tripping and re-closing. However, the peak magnitude of this FI is lower than the threshold value. Hence, the proposed algorithm effectively discriminates the switching transients due the tripping and re-closing of the feeder from faulty events.

7.2. Capacitive Switching

A capacitor connected on the node 675 was switched off at the fourth cycle and switched on again at the sixth cycle. The current signal recorded on node 650 was processed using the algorithm and FI was evaluated, as illustrated in Figure 14. It was established that FI has lower values than the threshold during the transients due to the switching off and on of the capacitive load. Hence, the proposed algorithm effectively discriminates the switching transients due to the capacitor switching from the faulty transients.

7.3. Load Switching

The load at node 671 was switched off at the fourth cycle and switched on at the sixth cycle. The cCurrent signal recorded at node 650 was processed using the algorithm and FI was evaluated as described in Figure 15. It is established that FI has lower values than the threshold during the transients due to the switching off and on of the load. Hence, the proposed algorithm effectively discriminates the load switching transients from the faulty transients.

8. Real Time Validation

The proposed algorithm was tested on a real-time basis for the practical transmission network of Rajasthan state in India. This network consists of conventional generators such as thermal power plants, nuclear and hydro power plants. Renewable energy was also integrated to the network in a significant amount. The transmission network in Bhadla region of Rajasthan state is detailed in Figure 16 where the large capacity of solar PV power is integrated into the grid. The 400 kV, 220 kV and 132 kV grid substation (GSS) and lines are described in detail. The installed capacity (IC) of solar PV plants is also mentioned. Power flow in the lines, transformers and from solar PV generation are also mentioned in terms of active power and reactive power, which were obtained through load flow study (LFS) using the MiPower software by using a database of the complete grid of Rajasthan state. Phase-A to ground fault was created on the 220 kV Bhadla-Kanasar line and the current was recorded on the Bhadla end. This current was processed using the proposed algorithm in the MATLAB software and FI is illustrated in Figure 17. It is observed that the FI has higher values than the threshold for phase-A and has lower values than the threshold for phases-B & C. Hence, the proposed algorithm can effectively be used for the protection of the grid with a high penetration of solar energy in the utility grid.

9. Performance Comparison

The performance of the algorithm was compared with algorithms used for the detection of faults in the presence of solar energy using DWT [11], WPT [10] and Stockwell transform [12]. It is observed that the performance of the algorithms based on the DWT and WPT was affected by the presence of noise. The DWT technique was found to work well for a noise level up to 50 dB, SNR whereas the WPT gives better results with a noise level of 32 dB SNR. These two techniques did not affect a high level of noise such as 10 dB SNR. However, the performance of the proposed algorithm is effective even in the presence of a high noise level of 10 dB SNR. Further, the Stockwell transform-based algorithm reported in [12] uses the patterns of various contours and plots for the fault detection, which range from a half cycle to one cycle. However, the proposed algorithm is effective to detect faults in the presence of SE within a quarter-cycle time period. Hence, it is established that the performance of the algorithm proposed is superior to DWT [11], WPT [10] and Stockwell transform [12]-based methods.

10. Conclusions

This paper introduced a method for the detection and classification of faults in a power network integrated with solar energy. The detection of various faults, including phase to ground, double-phase fault, double phases to ground and three-phase fault with and without the involvement of solar energy, were successfully achieved using the proposed fault index. This FI was obtained using the Wigner distribution function (WD-index) and the alienation coefficient (ALN-index)-based decomposition of the current signals. The classification of the faults was achieved using the number of faulty phases which were identified using the proposed FI. However, a ground fault index based on the Wigner distribution function supporting the decomposition of negative sequence current is used for the discrimination of a double-phase fault and double phase to ground fault. It can be concluded that the algorithm is fast and accurate for the detection of all types of faults in the presence of SE in the grid. This algorithm works effectively in the presence of a high level noise, different fault incidence angles, transformers with different types of windings, high fault impedance and different fault locations. The algorithm is also effective in the discrimination of switching transients due to the capacitor switching, load switching and feeder tripping/reclosing from the faulty transients. Its performance is not affected by the presence of hybrid lines consisting of OH line and UG cable sections. The algorithm was successfully validated in a real-time network of Rajasthan state in India. It is also established that the performance of the proposed algorithm is better compared to the DWT, WPT and Stockwell transform at providing protection to the grid with solar energy penetration. As a future enhancement, more complex hybrid systems can also be utilized to test the developed method.

Author Contributions

Conceptualization, S.R.O., O.P.M., A.S. and S.K.G.; methodology, S.R.O. and O.P.M.; software, S.R.O. and O.P.M.; validation, S.R.O. and O.P.M.; formal analysis, S.R.O., B.K. and O.P.M.; investigation, S.R.O. and O.P.M.; resources, A.S., S.K.G., S.K.J., H.H.A.; data curation, S.R.O., B.K. and O.P.M.; writing–original draft preparation, S.R.O., B.K. and O.P.M.; writing–review and editing, B.K. and H.H.A.; visualization, B.K., H.H.A. and P.S.; supervision, A.S., S.K.G., S.K.J., H.H.A., and P.S. All authors have read and agreed to the published version of the manuscript.

Funding

This research received no external funding.

Conflicts of Interest

The authors declare that they have no known conflicts of interest.

Abbreviations

Abbreviations used in this article are detailed below:
ALNAlienation
ANNArtificial neural network
CBCircuit breaker
CNNConvolution neural network
DGDistributed generation
DWTDiscrete Wavelet transform
ESExpert system
FIFault index
FRDFTFast recursive discrete Fourier transform
FSTFuzzy set theory
GFIGround fault index
GSSGrid substation
IEEEInstitute of Electrical and Electronics Engineers
OHOverhead
LFSLoad flow study
MATLABMatrix laboratory
MPPTMaximum power point tracking
PRProtection relay
PVPhotovoltaic
SESolar energy
SNRSignal to noise ratio
SPSSpecial protection scheme
TGFIThreshold of the ground fault index
UGUnderground
WDWigner distribution
WPTWavelet packet transform

References

  1. Telukunta, V.; Pradhan, J.; Agrawal, A.; Singh, M.; Srivani, S.G. Protection challenges under bulk penetration of renewable energy resources in power systems: A review. CSEE J. Power Energy Syst. 2017, 3, 365–379. [Google Scholar] [CrossRef]
  2. Eissa, M.; Awadalla, M.H. Centralized protection scheme for smart grid integrated with multiple renewable resources using Internet of Energy. Glob. Transit. 2019, 1, 50–60. [Google Scholar] [CrossRef]
  3. Madeti, S.R.; Singh, S. A comprehensive study on different types of faults and detection techniques for solar photovoltaic system. Solar Energy 2017, 158, 161–185. [Google Scholar] [CrossRef]
  4. Barra, P.; Coury, D.; Fernandes, R. A survey on adaptive protection of microgrids and distribution systems with distributed generators. Renew. Sustain. Energy Rev. 2020, 118, 109524. [Google Scholar] [CrossRef]
  5. Eissa, M. Protection techniques with renewable resources and smart grids—A survey. Renew. Sustain. Energy Rev. 2015, 52, 1645–1667. [Google Scholar] [CrossRef]
  6. Harrou, F.; Taghezouit, B.; Sun, Y. Robust and flexible strategy for fault detection in grid-connected photovoltaic systems. Energy Convers. Manag. 2019, 180, 1153–1166. [Google Scholar] [CrossRef]
  7. Manohar, M.; Koley, E.; Ghosh, S.; Mohanta, D.K.; Bansal, R. Spatio-temporal information based protection scheme for PV integrated microgrid under solar irradiance intermittency using deep convolutional neural network. Int. J. Electr. Power Energy Syst. 2020, 116, 105576. [Google Scholar] [CrossRef]
  8. Valencia, F.; Palma-Behnke, R.; Ortiz-Villalba, D.; De La Quintana, A.; Rahmann, C.; Cifuentes, R. Special Protection Systems: Challenges in the Chilean Market in the Face of the Massive Integration of Solar Energy. IEEE Trans. Power Deliv. 2017, 32, 575–584. [Google Scholar] [CrossRef]
  9. Kumar, D.S.; Srinivasan, D.; Reindl, T. A Fast and Scalable Protection Scheme for Distribution Networks With Distributed Generation. IEEE Trans. Power Deliv. 2016, 31, 67–75. [Google Scholar] [CrossRef]
  10. Ray, P.K.; Mohanty, A.; Panigrahi, B.K.; Rout, P.K. Modified wavelet transform based fault analysis in a solar photovoltaic system. Optik 2018, 168, 754–763. [Google Scholar] [CrossRef]
  11. Suman, T.; Mahela, O.P.; Ola, S.R. Detection of transmission line faults in the presence of solar PV generation using discrete wavelet. In Proceedings of the 2016 IEEE 7th Power India International Conference (PIICON), Bikaner, India, 25–27 November 2016. [Google Scholar] [CrossRef]
  12. Thukral, S.; Mahela, O.P.; Kumar, B. Detection of transmission line faults in the presence of solar PV system using stockwell’s transform. In Proceedings of the 2016 IEEE 7th Power India International Conference (PIICON), Bikaner, India, 25–27 November 2016. [Google Scholar] [CrossRef]
  13. Kersting, W.H. Radial distribution test feeders. IEEE Trans. Power Syst. 1991, 6, 975–985. [Google Scholar] [CrossRef]
  14. Kersting, W. Radial distribution test feeders. In Proceedings of the IEEE Power Engineering Society Winter Meeting, Columbus, OH, USA, 28 January–1 February 2001; Volume 2, pp. 908–912. [Google Scholar] [CrossRef]
  15. Mahela, O.P.; Shaik, A.G. Power quality improvement in distribution network using {DSTATCOM} with battery energy storage system. Int. J. Electr. Power Energy Syst. 2016, 83, 229–240. [Google Scholar] [CrossRef]
  16. Paz, M.C.R.; Ferraz, R.G.; Bretas, A.S.; Leborgne, R.C. System unbalance and fault impedance effect on faulted distribution networks. Comput. Math. Appl. 2010, 60, 1105–1114. [Google Scholar] [CrossRef] [Green Version]
  17. Kuo, C.L.; Lin, C.H.; Yau, H.T.; Chen, J.L. Using Self-Synchronization Error Dynamics Formulation Based Controller for Maximum Photovoltaic Power Tracking in Micro-Grid Systems. IEEE J. Emerg. Sel. Top. Circuits Syst. 2013, 3, 459–467. [Google Scholar] [CrossRef]
  18. Ding, K.; Bian, X.; Liu, H.; Peng, T. A MATLAB-Simulink-Based PV Module Model and Its Application Under Conditions of Nonuniform Irradiance. IEEE Trans. Energy Convers. 2012, 27, 864–872. [Google Scholar] [CrossRef]
  19. Mahela, O.P.; Shaik, A.G. Power quality recognition in distribution system with solar energy penetration using S-transform and Fuzzy C-means clustering. Renew. Energy 2017, 106, 37–51. [Google Scholar] [CrossRef]
  20. Rathore, B. Alienation based fault detection and classification in transmission lines. In Proceedings of the 2015 Annual IEEE India Conference (INDICON), New Delhi, India, 17–20 December 2015; pp. 1–6. [Google Scholar] [CrossRef]
  21. Rathore, B.; Shaik, A.G. Wavelet-alienation based protection scheme for multi-terminal transmission line. Electr. Power Syst. Res. 2018, 161, 8–16. [Google Scholar] [CrossRef]
  22. Khan, N.A.; Taj, I.A.; Jaffri, M.N.; Ijaz, S. Cross-term elimination in Wigner distribution based on 2D signal processing techniques. Signal Process. 2011, 91, 590–599. [Google Scholar] [CrossRef]
  23. Mahela, O.P.; Saraswat, A.; Goyal, S.K.; Jhajharia, S.; Rathore, B.; Ola, S.R. Wigner Distribution Function and Alienation Coefficient Based Transmission Line Protection Scheme. IET Gener. Transm. Distrib. 2020. [Google Scholar] [CrossRef]
  24. Cheng, J.Y.; Huang, S.J.; Hsieh, C.T. Application of Gabor–Wigner transform to inspect high-impedance fault-generated signals. Int. J. Electr. Power Energy Syst. 2015, 73, 192–199. [Google Scholar] [CrossRef]
  25. Aung, M.T.; Milanovic, J.V. The influence of transformer winding connections on the propagation of voltage sags. IEEE Trans. Power Deliv. 2005, 21, 262–269. [Google Scholar] [CrossRef]
Figure 1. IEEE-13 node test power system incorporating solar PV plant.
Applsci 10 01516 g001
Figure 2. Single-diode equivalent circuit of a solar cell.
Applsci 10 01516 g002
Figure 3. Flow chart of the proposed algorithm for the detection and classification of faults on the network of power system with solar energy penetration.
Applsci 10 01516 g003
Figure 4. Identification of phase-A to a ground fault incident on node 671 of the test system (a) Current waveform (b) WD-index (c) ALN-index (d) Fault index.
Applsci 10 01516 g004
Figure 5. Identification of a phase-A to phase-B fault incident on node 671 of the test system (a) Current waveform (b) WD-index (c) ALN-index (d) Fault index.
Applsci 10 01516 g005
Figure 6. Identification of phase-A and phase-B to a ground fault incident on node 671 of the test system (a) Current waveform (b) WD-index (c) ALN-index (d) Fault index.
Applsci 10 01516 g006
Figure 7. Identification of a three-phase fault involving ground and an incident on node 671 of the test system (a) Current waveform (b) WD-index (c) ALN-index (d) Fault index.
Applsci 10 01516 g007
Figure 8. Classification of a two-phase fault with and without the involvement of ground.
Applsci 10 01516 g008
Figure 9. Identification of a phase-A to ground fault and incident on node 652 of the test system (a) Current waveform (b) WD-index (c) ALN-index (d) Fault index.
Applsci 10 01516 g009
Figure 10. Identification of phase-A to ground fault and incident on node 634 of a test system (a) Current waveform (b) WD-index (c) ALN-index (d) Fault index.
Applsci 10 01516 g010
Figure 11. Effect of noise (10 dB SNR) on the detection of phase-A to ground fault on node 671 (a) Current waveform (b) WD-index (c) ALN-index (d) Fault index.
Applsci 10 01516 g011
Figure 12. Identification of AG fault incident on node 671 and current measurement on node 680 (point of solar PV integration).
Applsci 10 01516 g012
Figure 13. Effect of feeder tripping and re-closing on the performance of algorithm (a) Current waveform (b) WD-index (c) ALN-index (d) Fault index.
Applsci 10 01516 g013
Figure 14. Effect of switching transients associated with capacitive load on the performance of the algorithm.
Applsci 10 01516 g014
Figure 15. Effect of switching transients associated with inductive load on the performance of the algorithm.
Applsci 10 01516 g015
Figure 16. Transmission network of Bhadla region of Rajasthan state in India.
Applsci 10 01516 g016
Figure 17. Fault index with AG fault on 400 kV bus of 400 kV GSS Bhadla, Rajasthan, India.
Applsci 10 01516 g017
Table 1. Test System Feeder Data.
Node ANode BLength of Feeder (m)Configuration of Feeder
632645152.40601
632633152.40601
6336340XFM
64564691.440601
650632609.60601
684652243.84606
632671609.60601
671684680.00601
6716920Switch
68461191.44601
692675152.40606
Table 2. Test System Load Data.
NodesLoad ModelLoadCapacitor Banks
kWkVAr(kVAr)
634Y-PQ400290
645Y-PQ170125
646Y-PQ230132
652Y-PQ12886
671Y-PQ1155660
675Y-PQ843462600
692Y-PQ170151
611Y-PQ17080100
632-671Y-PQ200116
Table 3. Test Network Transformer Parameters.
TransformerMVAkVkVHV WindingLV Winding
HighLowR ( Ω ) X ( Ω ) R ( Ω ) X ( Ω )
XSST101154.1629.095211.600.11420.8306
XFM54.160.480.38072.76880.05100.0042
XSPV0.14.160.2600.1730195.700.00070.7645
Table 4. Fault Index with variation in fault impedance (AG fault).
Phase NameFault Index Magnitude
0 Ω 5 Ω 10 Ω 15 Ω 20 Ω 25 Ω
Phase-A 5.8 × 10 9 1.4 × 10 9 9.2 × 10 8 8.1 × 10 8 7 × 10 8 5.9 × 10 8
Phase-B 3.5 × 10 6 8 × 10 5 4.5 × 10 5 1.1 × 10 5 9.2 × 10 4 7.7 × 10 4
Phase-C 9.7 × 10 5 3 × 10 5 9.1 × 10 4 6.3 × 10 4 2.7 × 10 4 5.3 × 10 3
Table 5. Fault index with variation in the fault incidence angle (AG fault).
Phase NameFault Index Magnitude
30°60°90°120°150°
Phase-A 5.8 × 10 9 4.7 × 10 9 2.3 × 10 9 1.6 × 10 9 5.3 × 10 9 6.2 × 10 9
Phase-B 3.5 × 10 6 6 × 10 7 2.5 × 10 7 6.1 × 10 7 7.7 × 10 7 7.5 × 10 7
Phase-C 9.7 × 10 5 3.1 × 10 7 1.8 × 10 7 1.8 × 10 7 1.1 × 10 7 2.8 × 10 6
Table 6. Fault index with different types of transformer windings (AG fault).
Phase NameFault Index Magnitude
Y Y Yg Yg Y Δ Δ Δ Yg Δ
Phase-A 3.9 × 10 8 2.6 × 10 8 3.1 × 10 8 2.5 × 10 8 2.4 × 10 8
Phase-B 7.2 × 10 4 2.4 × 10 3 9.1 × 10 3 1.9 × 10 3 1.5 × 10 3
Phase-C 2.5 × 10 4 1.7 × 10 3 7.4 × 10 3 1.4 × 10 3 1.1 × 10 3

