Abstract
More recent attention has been focused on the utilization of Jatropha curcas in the field of water treatment. The potential of Jatropha oil in the synthesis of membrane for water filtration had been explored, its performance compared to the addition of graphene oxide (GO) in the polymer matrix. Jatropha oil was modified in a two-step method to produce Jatropha oil-based polyol (JOL) and was blended with hexamethylene diisocyanate (HDI) to produce Jatropha polyurethane membrane (JPU). JPU was synthesized in different conditions to obtain the optimized membrane and was blended with different GO loading to form Jatropha/graphene oxide composite membrane (JPU/GO) for performance improvement. The synthesized pristine JPU and JPU/GO were evaluated and the materials were analyzed using fourier transform infrared spectroscopy (FTIR), differential scanning calorimetry (DSC), thermogravimetric analysis (TGA), contact angle, water flux, and field emission scanning electron microscopy (FESEM). Results showed that the ratio of HDI to JOL for optimized JPU was obtained at 5:5 (v/v) with the cross-linking temperature at 90 °C and curing temperature at 150 °C. As GO was added into JPU, several changes were observed. The glass transition temperature (Tg) and onset temperature (To) increased from 58 °C to 69 °C and from 170 °C to 202 °C, respectively. The contact angle, however, decreased from 88.8° to 52.1° while the water flux improved from 223.33 L/m2·h to 523.33 L/m2·h, and the pore distribution in JPU/GO became more orderly. Filtration of copper ions using the synthesized membrane was performed to give rejection percentages between 33.51% and 71.60%. The results indicated that GO had a significant impact on JPU. Taken together, these results have suggested that JPU/GO has the potential for use in water filtration.
1. Introduction
There has been an increasing interest in exploring environment-friendly membrane filters for water treatment from green and sustainable alternative materials. This scenario has instigated a change in the conventional approach to inorganic sources by exploiting biodegradable and fully sustainable materials such as those coming from plants and microorganisms due to the multitude uses of petroleum-derived materials [1,2,3,4].
Belonging to Euphorbiaceae family, Jatropha curcas has gained increasing attentions for various industrial applications like environment, agriculture, energy production, and pharmaceuticals [5,6,7]. Amid its benefits, Jatropha curcas oil has been explored as a replacement for fossil fuels in minimizing greenhouse gas emissions [8], making candles, soaps, cosmetics [9], and also surface coatings [10]. In addition, the seed extracts and press cake were utilized in water and wastewater treatment [11,12,13,14]. In recent years, Jatropha oil-derived materials have been exploited to produce biodegradable film for packaging, insulation, and furniture [15,16,17]. Jatropha oil has been reported to contain high iodine value (IV) [18,19], indicating the amount of unsaturated double bond in the fatty acid chain.
A common method to minimize the amount of undesired particles in the contaminated water is through filtration. Several studies have been reported to consider alternative sustainable materials in synthesizing biodegradable membrane filter, including cellulose [20], plant xylem [4], and Spirulina platensis [3]. This trend has led to the investigation on the potential of Jatropha oil-derived polymers as a substitute for inorganic materials in membrane filter synthesis. Jatropha oil possess a triglyceride structure from oleic and linoleic acid that serve as captivating spots for chemical modification [21].
Jatropha curcas oil has shown significant potential in preparing Jatropha oil-based polyol (JOL) containing multiple hydroxyl groups for many uses such as aqueous polyurethane dispersions and polyurethane wood adhesive [21,22]. Hydroxyl groups are important to form new linkages during reaction, but they are unfortunately absent in most natural oils [23,24]. Thus, the unsaturated sites in natural oils are exploited to introduce hydroxyl groups [16,21,23]. Crude Jatropha oil (CJO) normally undergoes a two-step process of epoxidation and ring opening in producing JOL [21]. JOL then reacts with HDI, forming JPU. Thus, the structure of the isocyanate group is also crucial for fulfilling the biodegradable purpose. According to Asefnejad et al. [25], HDI is widely used for the synthesis of biodegradable polyurethane due to its linear structure. A key aspect of JPU as a membrane filter is its hydrophilicity and morphology. Thus, some modifications are essential to be studied in order to improve its properties.
Previous investigations have shown that GO loading affected polymer thermal stability and morphology [26] since oxygen functional groups in GO such as carbonyl and hydroxyl [27,28,29], participated in side reaction when exposed to isocyanate [29] to generate GO functionalization. Among the polymers that had been reported to form composites with functionalized GO are poly(methyl methacrylate) (PMMA), polyvinyl acetate (PVA), polyaniline (PANI), polyurethane (PU), nylon, and polyesters [30,31,32,33,34]. For evaluating any material suitability for filter purpose, information about material properties, water flux, and rejection performance is vital. In this work, green JPU with different percentages of GO were assessed to determine JPU/GO potential as a membrane filter. To date, synthesis of membrane filter from JPU with GO composite has not been previously reported.
This work aims to investigate the effect of JOL:HDI ratio, reaction temperature, and curing temperature in producing an optimum pristine JPU membrane, followed by appropriate characterization. GO introduction as composite material to JPU membrane was also assessed in order to improve water flux and rejection rate capability.
2. Experimental
2.1. Materials
CJO was supplied by Bionas Sdn Bhd., Kuala Lumpur, Malaysia, and was used as received. Glacial acetic acid was purchased from Fisher Scientific. Amberlite IR-120, graphene oxide (GO), hexamethylene diisocyanate (HDI), and 30% hydrogen peroxide (H2O2) were bought from Sigma-Aldrich. Sodium carbonate (Na2CO3) and methanol were supplied by R&M Chemicals. Anhydrous sodium sulfate (Na2SO4) was obtained from PC Laboratory Reagent.
2.2. Synthesis of Epoxide Crude Jatropha Oil (EJO)
EJO was synthesized using the same method as detailed by Farah et al. [18]. CJO and glacial acetic acid was added into a 1L flask with 16 wt% of catalyst amberlite IR-120 from the total CJO. The mixture was heated at 65 °C in water bath (BUCHI B-100) with continuous stirring by WiseStir HT50AX. 30% H2O2 was added drop by drop within 30 min with the molar ratio of glacial acetic acid/double bond/H2O2 at 6:1.0:1.7. The heating temperature was then increased to 75 °C for 5 h. After the removal of catalyst, the product was washed with excess water three times in different temperatures that comprised of 90 °C, 20 °C, and 90 °C, respectively. Two layers consisting of epoxy at the top and aqueous at the bottom were formed during the washing process. The aqueous layer was discarded for every washing process. In the ratio of 1:0.15 (m/m), Na2SO4 was added into the collected EJO as drying agent and was left in the oven for 12 h at 80 °C. The final yield was weighed after Na2SO4 was discarded.
2.3. Synthesis of Jatropha Oil-Based Polyol (JOL)
This compound was prepared by adapting the procedure used by Salaah et al. [21]. Water was added in a 1 L flask at 10% (w/w) of total EJO. Methanol and sulfuric acid were then added into the same flask with a molar ratio of methanol to water at 5:1 while sulfuric acid was added at 0.3 wt% of the total mixture. The mixture was then heated in water bath (BUCHI B-100) with continuous stirring by using WiseStir HT50AX until the temperature reached 64 °C. EJO was then added for another 30 min before the addition of Na2CO3 for quenching. The polyol was left to be cooled down before discarding the deposited residues. Methanol and water were removed through vacuum rotary evaporation at 45 °C.
2.4. Preparation of JPU Membranes
JPU membrane was prepared by modifying some procedure used by Marlina et al. [35]. Jatropha oil-based polyol (JOL) was reacted with hexamethylene diisocyanate (HDI) at three different variables as presented in Table 1. JOL and HDI were added in a 250 mL flask and stirred by using magnetic stirrer at 600 rpm while heated in water bath within 20 min. The formed polyurethane solution was cast on glass petri dish that was marked at 0.5 mm thickness and was cured for 8 h before the formed sheet of membrane was exfoliated using a spatula.

Table 1.
Reaction variables for the synthesis of JPU.
2.5. Preparation of JPU/GO Composite Membrane
From the elementary studies, the optimum ratio of JOL to HDI was obtained at 5:5 (v/v). The amount of GO was measured at 0.35 wt%, 0.50 wt%, and 0.65 wt% from the total polymer, respectively to produce three different samples. At different loadings of GO, JOL was mixed with GO through sonication. Next, three samples of GO/JOL blending were mixed with HDI separately for 20 min at 90 °C–100 °C in water bath and stirred at 600 rpm. Jatropha polyurethane with GO solution (JPU/GO) was then cast on glass petri dish (marked at 0.5 mm thickness) and was thermally cured at 150 °C for 8 h. The formed JPU/GO composite membrane was subsequently exfoliated using a spatula.
2.6. Characterization
Various JPU membranes were prepared and optimized with respect to a different ratio (v/v) of JOL to HDI, reaction temperature and curing temperature. At the same time, the membrane’s texture, dryness, and solidification were observed. The optimized JPU was then introduced with a different loading of GO. The functional groups were determined by Fourier-transform infrared spectrometer (FTIR), while thermal stabilities of the membrane were determined by differential scanning calorimetry (DSC) and thermogravimetric analysis (TGA). Apart from that, field emission scanning electron microscopy (FESEM) was done to identify the morphology of the membrane, while contact angle was determined to verify the hydrophilicity of the membrane.
Porosity was studied through image processing from ImageJ, percentage water content (%), and porosity (%) calculation. Each sample was processed individually through ImageJ (version 1.5b for Windows, 64 bit, free software, National Institutes of Health, Bethesda, MD, USA). For the thresholding process, the threshold was adjusted manually through the default setting to achieve the highest degree of visualized porosity. The percentage of porosity values in terms of its Feret diameter was plotted in histogram.
The membrane samples were further analyzed by calculating the water content and the porosity percentages. To obtain the water content, both the wet membrane and dry membrane weight was measured using the following procedures. The membrane sample was soaked in water for 24 h, wiped off with tissue paper, and weighed for wet membrane weight. The membranes were then dried in an oven at 40 °C for 24 h, and then weighed to obtain dry membrane weight. Membrane water content (%) and porosity (%) were calculated by following the below equation [36]:
where Ww is the weight of wet membrane, Wd is the weight of dry membrane, d is density of water (g/cm3), A is the membrane effective area (cm2), and L is the thickness of membrane (cm).
2.7. Water Flux and Heavy Metal Removal
A customized cross-flow filtration system was used to evaluate the performance of both the JPU and JPU/GO membrane, as shown in Figure 1. The membrane was measured to have an effective surface area 9 cm2 for pristine JPU and JPU/GO samples. Initially, feed water was pumped into the membrane module containing the membrane sample using a peristaltic pump at 40 rpm. Once the module was completely filled with water, the pressure was set at 0.5 bar and the experiments were monitored in 10 min time. Water flux was determined by measuring the total water permeated through the membrane samples at selected area, time, water speed, and pressure. The flux rate was calculated by referring to the equation below [36]:
where Jw is the water flux (L/m2·h), Q is the permeate (L), A is the effective surface area (m2), and Δt is the duration time (h).
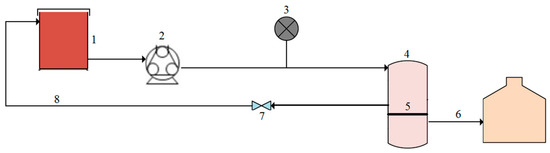
Figure 1.
Schematic representation of the experimental setup with (1) feed tank, (2) peristaltic pump, (3) pressure gauge, (4) cross-flow module, (5) membrane, (6) permeate, (7) control valve, and (8) concentrate.
The experiment was then continued by using heavy metal solution from copper (Cu(II)) to further confirm the performance of the membranes. 100 ppm of copper sulfate pentahydrate (CuSO4·5H2O) was prepared as the feed to the filtration process. The experiments was conducted at 1.5 bar to give a substantial heavy metal rejection [37]. The amount of Cu(II) ions in the feed solution and in permeate were measured using atomic absorption spectroscopy (AAS) and further used in Equation (4) in order to calculate the heavy metal rejection [36,38]:
where Cp and Cf are the heavy metal concentrations in permeate and the feed, respectively.
3. Results and Discussion
3.1. JPU Membrane Synthesis and Optimization
The present study was designed to determine the optimum conditions for the synthesis of dried and solidified JPU. Three factors had been selected as being potentially important: polyol to HDI ratio, reaction temperature, and curing temperature. Further analysis was done to investigate the effect of GO on the properties of JPU for the purpose of improvement.
3.1.1. Effect of Different JOL:HDI Ratio
Mainly, JPU membrane was prepared by cross-linking method between JOL and HDI in different ratios at 90 °C with stirring rate at 600 rpm. The solution was then cured at 150 °C for 8 h. Based on Table 2, JPU solutions at 5:1 and 5:3 (v/v) ratio were not dried and were not solidified as the amount of HDI was not sufficient enough to produce a dried membrane. This was due to the low concentration of isocyanate (–NCO) that reacted to hydroxyl (–OH) which formed primarily unstable carbamic acid (urethane link). In addition to the reaction, the primary reaction could be reverted at an elevated temperature due to the unstable bond [39,40,41,42,43,44]. By adding more HDI, at 5:7 (v/v), a solid membrane was produced. However, it was too dried and brittle. The membrane broken into small hard fragments when exfoliated from the petri dish. This could be due to the excess isocyanate (aliphatic isocyanate) loading which might form other linkages when heating to give an extremely stable and irreversible isocyanurate linkage and produce allophanate and trimerize [39,40,43,44,45,46]. Generally, excess isocyanates are needed to form sufficient cross-linkages during secondary reactions to synthesize a dried and solidified JPU. However, over excessive isocyanate generate undesirable surplus linkages which resulted in a too dried and brittle membrane [47,48,49].
Table 2.
Physical appearance of JPU and JPU/GO membrane prepared at different conditions.
At a ratio of 5:5 (v/v), the synthesized JPU membrane dried favorably as desired and became solidified. This view was supported by Rehman [39] who suggested that an adequate and appropriate excess amount of isocyanates was crucial to promote the cross-linking reaction during polyurethane synthesis. Thus it can be concluded that the optimum JOL:HDI ratio, in order to obtain dried, elastic, and solidified JPU membrane, was at 5:5 (v/v).
3.1.2. Effect of Different Reaction Temperature
Curing temperature and the JOL:HDI ratio for the optimum JPU membrane were at 150 °C and 5:5 (v/v), respectively. In this part, the reaction temperature for blending JOL and HDI was conducted at different values of 50 °C, 70 °C, and 90 °C. As shown in Table 2, the JPU solution still remains as liquid at 50 °C and was also not completely solidified at 70 °C. It seemed possible that these results were caused by the primary reactions. At low temperature, the hydroxyl groups started to react with isocyanate to form primarily urethane linkage that was unstable. These findings corroborated the ideas of Szycher [50], who highlighted that the unstable primarily urethane linkage had started to form from room temperature. At 90 °C, the JPU membrane was completely dried and easily removed as the back surface was not fractured. This was attributed to the higher cross-linking and branching through secondary reactions that occurred at the elevated temperature [50]. Since the reactions and curing process happened in a very quick overlapping succession process [50], the reaction temperature was monitored by heating the solution on a hot plate stirrer. This is also very important to avoid rapid reactions that converted the polymer into solid end products. Hence, the findings here confirmed that the optimum reaction temperature for JPU membrane was 90 °C.
3.1.3. Effect of Different Curing Temperature
The selected JOL:HDI ratio for subsequent investigation in the synthesis of JPU membrane was at 5:5 (v/v). At this stage, the JPU membrane was produced with constant JOL:HDI ratio and heated at 90 °C during cross-linking reaction but was cured at different temperature. As shown in Table 2, JPU solutions at 90 °C and 120 °C were dried, but the texture was brittle when exfoliated from the petri dish. These results suggested that the curing temperature was not sufficient to obtain the peak performance from the cross-linking reactions. As stated by Zhao [49], other side reactions were insignificant during branching reactions but were likely to be crucial during curing session to have a notable polyurethane properties. In comparison to result at 150 °C, the JPU solution became dried, solidified, and yellowish in color due to the increased cross-linking reactions at elevated curing temperature. Curing process could enhance the achievement of polyurethane synthesis [49] as the slight excess of isocyanate had promoted higher formation of branches [39]. However, as the curing temperature was increased to 170 °C, the JPU solution was excessively dried and formed a scorch mark due to the tendency of thermo-oxidative degradation reaction [42]. Taken together, these results indicated that the optimum JPU membrane was at 150 °C during curing reaction.
3.1.4. Effect of Different Amount of GO
As the optimized pristine JPU was obtained, GO was then introduced in the JPU matrix to enhance its properties. A recent study on the effect of GO in polyethersulfone (PES) membranes by Zinadini et al. [51] had reported that 1 wt% of GO loading, resulted in an increment of the contact angle due to the aggregation of GO. Hence, lower amount of GO loading was selected. JPU/GO samples were prepared with different percentage loading of GO from the total polymer at 0.35 wt%, 0.50 wt%, and 0.65 wt%. From the observations, there was no significant difference when comparing the three JPU/GO samples with pristine JPU, as shown in Table 2. Further data collections were done in characterizations to determine exactly how GO had affected the properties of JPU membrane.
3.2. Membrane Characterization
Properties of EJO, JOL, and pristine JPU were studied to verify the synthesis of optimum Jatropha polyurethane, while JPU/GO samples were studied to determine the effect of GO loading on the properties of Jatropha polyurethane in three different parameters: 0.35 wt%, 0.50 wt%, and 0.65 wt% of GO from the total polymer. The significant changes of the properties were verified with a few characterizations that comprised of FTIR, DSC, TGA, FESEM, and contact angle. The functional groups were determined from FTIR, while thermal stabilities of the membrane were determined from DSC and TGA. Apart from that, FESEM was done to identify the changes in membrane morphology. The hydrophilicity changes of the membrane were analyzed from the contact angle. For the porosity, it was studied through image processing from ImageJ, water content (%), and porosity (%) calculation. The experiment was duplicated, and average values were taken.
3.2.1. Fourier-Transform Infrared Spectroscopy (FTIR)
The chemical structures of EJO, JOL, and JPU were characterized by identifying the functional groups through FTIR analysis. The FTIR results had shown the changes of FTIR peaks and patterns for every synthesis due to further reactions, as recorded in Figure 2. The synthesis of epoxy was observed from the absence spectra of the double bond at 3008 cm−1 [52,53,54] and the appearance of a new peak (–COC) at 835 cm−1 [18,21]. The undesirable side reactions in JPU were prompted by the presence of water and acid [16,21]. In EJO spectra, a minimum side reaction of ring opening was observed at 3464 cm−1 with weak and broad tip due to the formation of hydroxyl (–OH). Carbonyl group (C=O) in ester was also found at 1742 cm−1 in EJO [18,52,53,54].
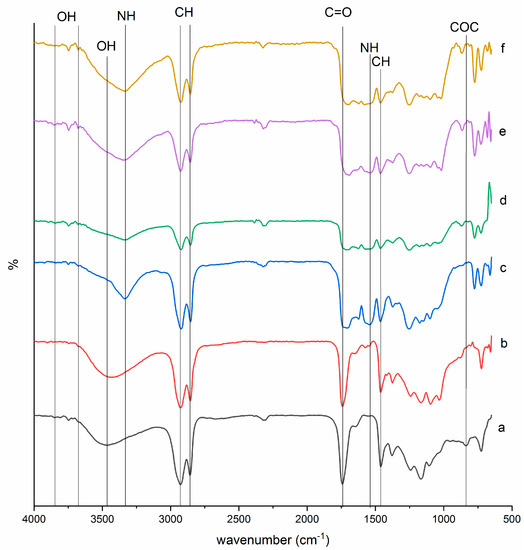
Figure 2.
FTIR spectra of (a) EJO, (b) JOL, (c) JPU, (d) JPU/GO 0.35 wt%, (e) JPU/GO 0.50 wt%, and (f) JPU/GO 0.65 wt%.
While in JOL spectra, the hindrance of hydroxyl (–OH) band in EJO with the appearance of higher intensity absorbance band at 3431 cm−1 corresponded to the formation of hydroxyl group (–OH) due to the ring opening reaction. The carbonyl group (C=O) of ester in JOL was found to be shifted at 1741cm−1. With the absence of (N=C=O) group band in the range at 2254 cm−1 to 2310 cm−1, the isocyanate group was confirmed to be completely reacted [55]. In JPU spectra, the functional groups were observed in four main peaks: N-H group stretching at 3336 cm−1, urethane carbonyl group (C=O) for urethane linkage at 1705 cm−1, (C–O) stretching at 1254 cm−1, and (N–H) bending at 1542 cm−1. The finding of hydrogen-bonded carbonyl group (C=O) at 1705 cm−1 seemed to be consistent with other researches [25,56]. Apart from that, a sharp peak at 2922 cm−1 and 2854 cm−1 corresponded to the (–CH) stretching as other bands of (–CH) vibrations at 1463 cm−1 and 1373 cm−1 [25]. As reported by Ahmad et al. [16], bands from 1100 cm−1 to 1200 cm−1 were the spectral ranges for polyether and polyester.
The functional group of JPU/GO samples was also studied through FTIR to determine the effect of GO in Jatropha polyurethane properties. Apparently, isocyanate was prompted to have reaction with the functional groups of GO as side reaction, whether from the edge carboxylic acid, surface hydroxyl, or epoxide in producing amides or carbamate esters [57]. As stated by Sun et al. [58], the sequence of isocyanate reactivity with different functional group was in the sequence as primary amine > secondary amine > hydroxyl > acid > anhydride > epoxide. Due to the reactivity of isocyanate versus different functional group, isocyanate had higher reactivity with the hydroxyl group compared to the other functional group of GO. In JPU/GO samples, the hydroxyl (–OH) band was found at 3675.84 cm−1 and 3675.56 cm−1 in JPU/GO 0.35 wt% and JPU/GO 0.50 wt% samples, respectively [59,60,61,62]. However, (–OH) stretching band in JPU/GO 0.65 wt% sample was reduced with the overlapping of (–NH) stretching. This was due to the higher GO functionalized as GO loading increased [63]. The appearance of another peak was observed near 867 cm−1, 864 cm−1, and 870 cm−1 for JPU/GO 0.35 wt%, JPU/GO 0.50 wt%, and JPU/GO 0.65 wt% samples, respectively, which was predicted to be (–CH) vibration. The reactivity of isocyanate toward hydroxyl (–OH) groups also depended on whether they were free or hydrogen bonded due to the higher activation energies required for the reaction as provided by hydrogen-bonded alcohols than free alcohols [63,64,65]. Free hydroxyl groups could be observed in the spectra range near 3821 cm−1, 3852 cm−1, and 3843 cm−1 for JPU/GO 0.35 wt%, JPU/GO 0.50 wt%, and JPU/GO 0.65 wt% samples, respectively [59].
3.2.2. DSC
DSC was used to analyze the thermal stability of the polymer membrane. DSC technique was able to spot the changes of glass transition temperature (Tg) in the polymer membrane. From DSC thermogram, all JPU samples were showing a low-intensity peak in the range of 58 °C to 69 °C as shown in Figure 3. JPU/GO membranes had higher Tg compared to pristine JPU and Tg increased with the increased of GO loading as in the following order: JPU/GO 0.65 wt% > JPU/GO 0.50 wt% > JPU/GO 0.35 wt% > JPU (Table 3). The thermal stabilities of the JPU/GO samples increased and were compatible with the decomposition temperature of TGA thermograms. As reported by Avishek et al. [66], the uniform distribution of the nanofillers within the polymer had caused the increment of thermal stability due to the restraining of the flexibility and mobility of the polymer chains.
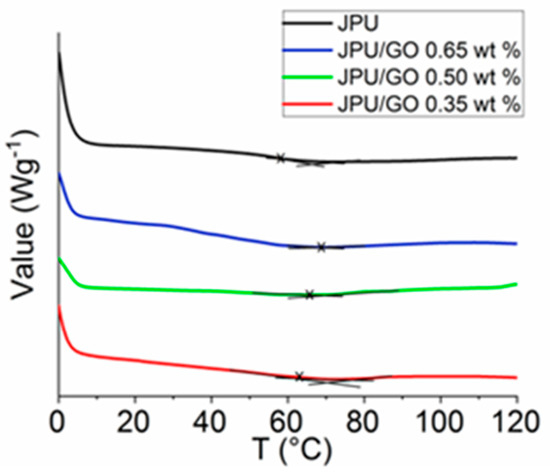
Figure 3.
DSC thermograms of JPU, JPU/GO 0.35 wt%, JPU/GO 0.50 wt%, and JPU/GO 0.65 wt%.
Table 3.
Glass transition temperature (Tg) for JPU, JPU/GO 0.35 wt%, JPU/GO 0.50 wt%, and JPU/GO 0.65 wt%.
3.2.3. Thermogravimetric Analysis (TGA)
Results from TGA provided the degradation peaks versus temperature with residue weight of the JPU membrane. Thermal stability is defined as the stability of a molecule at high temperature which is affected by the mobility of the polymeric chains. With the formation of side chain, the decomposition of material became difficult due to the steric hindrance. At high cross-linking, the polymeric membrane became thermally stable at elevated temperature with the char formation [16]. TGA curve displayed four degradation peaks for pristine JPU, as shown in Figure 4. In the first step, the initial low weight loss began with the removal of water, while the second step was from the easily altered urethane group. The third and fourth steps indicated the degradation of other already formed compounds such as primary or secondary amine as well as olefin and isocyanurate with the continuous evolution of the volatile compound due to the elevated temperature [67,68]; lastly was the char formation [16,69,70,71]. However, degradation of polyurethane usually involved complex multistep of consecutive [72]. The general decomposition of urethane can be explained based on the equation below [73] with R’ as aromatic constituent and R’’ and R’’’ as aliphatic constituents:
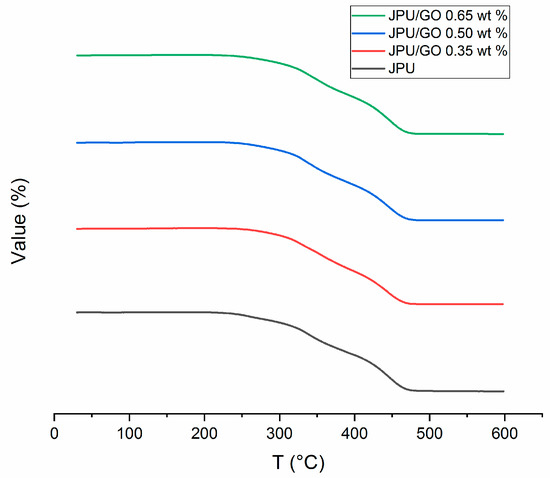
Figure 4.
TGA curves for JPU, JPU/GO 0.35 wt%, JPU/GO 0.50 wt%, and JPU/GO 0.65 wt%.
Interestingly, a new peak from JPU/GO samples was detected between peak 2 and peak 3 when compared to pristine JPU, as shown in Figure 5. These results matched with those observed in earlier studies on other modified GO derivative [63] and suggested that new degradation at peak 3 was formed due to the pyrolysis of surface oxygen functional groups from GO; namely, epoxide, hydroxyl, and carboxylic acid. As recorded in Table 4, both JPU/GO 0.65 wt% and JPU/GO 0.50 wt% had higher degradation at step 3 than JPU/GO 0.35 wt% as the GO loading increased. By observing the degradation rate at step 4, the weight loss of JPU/GO samples were higher than pristine JPU due to the pyrolysis of covalently grafted isocyanate to GO, as well as other evolution of volatile compound in JPU composite. During reaction, GO was functionalized as a side reaction between hydroxyl groups of GO when exposed with isocyanate [29], forming a composite with polymer membrane [30,31,32,33,34]. There were similarities between the degradation at step 4 described in this result and those expressed from the previous studies [63,74]. The remaining step 5 showed the char formation.
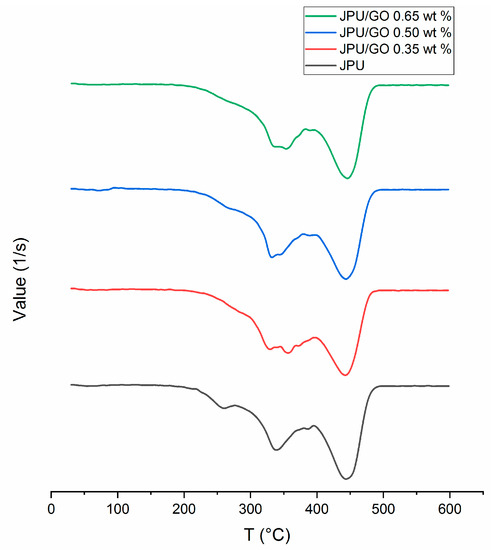
Figure 5.
DTG curves for JPU, JPU/GO 0.35 wt%, JPU/GO 0.50 wt%, and JPU/GO 0.65 wt%.
Table 4.
Degradation rate (%) of JPU, JPU/GO 0.35 wt%, JPU/GO 0.50 wt%, and JPU/GO 0.65 wt%.
Other notable results were based on the initial onset temperatures (To). To for JPU/GO composites were higher than the pristine JPU due to the more stable thermal stability of JPU/GO composites, as shown in Table 5. For maximum temperature (Tmax), Tmax from JPU/GO samples were shifted to a higher temperature compared to pristine JPU by following the increment of GO loading in the JPU matrix. The introduction of GO attributed to the rigidity of the polymer, which led to the restriction motion of the cross-linked chain [75].
Table 5.
To and Tmax for JPU, JPU/GO 0.35 wt%, JPU/GO 0.50 wt%, and JPU/GO 0.65 wt%.
3.2.4. FESEM
Figure 6 shows the cross-sectional area of the samples for pristine JPU, JPU/GO 0.35 wt%, JPU/GO 0.50 wt%, and JPU/GO 0.65 wt%. Based on Figure 6a,b, pristine JPU and JPU/GO 0.35 wt% samples had a disorderly sponge’s pores with huge different sizes of pores. As the loading of GO in JPU was increased to 0.50 wt% from the total polymer, the arrangement of pores was orderly altered by GO nanofillers, as shown in Figure 6c. Figure 6d shows that the higher loading of GO up to 0.65 wt% from the total polymer was beyond the optimum level as the pores decreased.
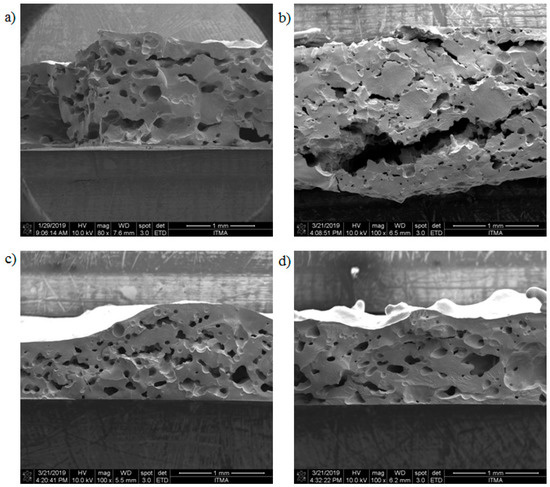
Figure 6.
FESEM micrograph image of different JPU samples with different loading of GO for (a) JPU, (b) JPU/GO 0.35 wt%, (c) JPU/GO 0.50 wt%, and (d) JPU/GO 0.65 wt%.
It should be noted that well dispersion of GO in the polymer matrix was crucial for enhancing membrane properties. Ionita et al. [76] had found that high loading of GO to the polymer matrices only initiated poor dispersion of GO due to aggregation. Thereby, higher loading of GO has caused low porosity for the JPU/GO 0.65 wt% sample as well as increased the membrane surface roughness [77]. Ammar et al. [78] stated that the viscosity of the polymer solution could be affected by the addition of GO. The pore size of the membrane was reduced due to the higher viscosity of the polymer solutions as it exceeded the optimum loading of GO. The findings were supported by Chien et al. [79] in their studies for the addition of sulfonated graphene oxide (SGO) to Nafion polymer matrices. They stated that the solution viscosity of the polymer was increased with the increased SGO loading. This is due to the cooperative bonds interaction that occurred between the Nafion and SGO functional group.
3.2.5. Contact Angle
Data analysis was based on the angle of water droplet’s shape from the surface of material. Lower contact angle indicates the tendency of the surface to be more hydrophilic. Contact angle data was recorded to monitor the changes of the surface wettability from the introduction of GO as illustrated in Figure 7. According to this result, the contact angle for pristine JPU did not change for the whole 8 min and remained constant at 88.8°. After the loading of GO in JPU, the contact angle for JPU/GO samples decreased within 8 min, as in Table 6. 0.50 wt% JPU/GO sample with contact angle of 52.1° became the most hydrophilic sample. As explained earlier, the addition of GO during the cross-linking of JOL and HDI have caused side reactions that decreased the hydrophilicity. Typically, high reaction temperature led to lower degree of functionalization between GO and isocyanate since the reaction of n-alcohol with phenyl isocyanate is inversely proportional to temperature [80]. In these experiments, the reaction between alcohol and isocyanate was exothermic. The increased of reaction temperature resulted in the decreased yield of functionalized isocyanate-GO products [63] that led to more untreated hydroxyl from GO surface at the end of the reaction. The hydrophilicity (decreasing contact angle) was seen to improve as the loading of GO to the polymer matrix increased to give a more orderly porous surface [81] since the oxygen groups in GO reduced the van der Waals forces and enabled water molecules to penetrate through the interlayer [29].
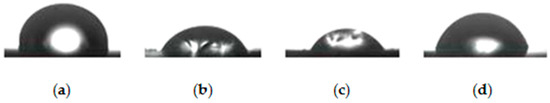
Figure 7.
Image wetting test for the contact angle at 8 min for sample (a) JPU, (b) JPU/GO 0.35 wt%, (c) JPU/GO 0.50 wt%, and (d) JPU/GO 0.65 wt%.
Table 6.
Average angle for JPU, JPU/GO 0.35 wt%, JPU/GO 0.50 wt%, and JPU/GO 0.65 wt% at 0 min, 4 min, and 8 min.
On the other hand, as the GO loading of the membrane was continued to increase to 0.65 wt%, the contact angle surprisingly increased. It should be noted that the occupancy of GO in the polymer matrix might affect the pore size and the pore distribution inside the membrane framework [78,82]. According to Zhao et al. [83] in their studies about the loading of isocyanate-treated graphene oxide (iGO) to polysulfone (PSf) membrane, the water flux decreased with the increased iGO. This was due to the decrease in pore size and the altered pore structure. The hydrophilic properties were still apparent for JPU/GO 0.65 wt%, but more time is required to decrease the contact angle at the optimum value. In accordance with the present results, previous studies on polyethersulfone/GO composite membrane by Zinadini et al. [51] had demonstrated that the contact angle increased with the loading of GO beyond the optimum level. These findings further supported that the increased contact angle was due to aggregation of nanoparticles.
3.2.6. Porosity
As shown in Figure 8, larger and disordered pores were observed from pristine JPU and JPU/GO 0.35 wt% membrane samples, while more orderly and smaller pores were observed from JPU/GO 0.50 wt% membrane samples. However, as the GO loading increased to 0.65 wt%, the porosity reduced. From ImageJ analysis, the Feret diameter of the porosity was recorded and exported into histogram. As shown in Figure 9, the visualized porosity of PU/GO 0.50 wt% membrane sample revealed the optimum level of desired porosity with the higher amount of Feret diameter below 300 µm at 22 counts, followed by PU/GO 0.35 wt% at 19 counts, while PU/GO 0.65 wt% and JPU are both at 18 counts with the presence of pores at 600–700 µm Feret diameter for pristine JPU. As indicated in Figure 10, membrane water content and porosity increased significantly with the higher content of GO loading, but the optimum result was achieved by JPU/GO 0.50 wt% with 39.42% of water content and 93.14% of porosity. Membrane sample with the optimum amount of GO loading had shown the greatest water content. This phenomenon proved that the increment of GO loading in the membrane structure had led to the higher porosity of the membrane. However, as the loading of GO exceeded the optimum level, the water content and porosity percentage decreased. This degraded porosity might be due to the agglomeration of extra GO loading in the polymer matrix [84,85,86].
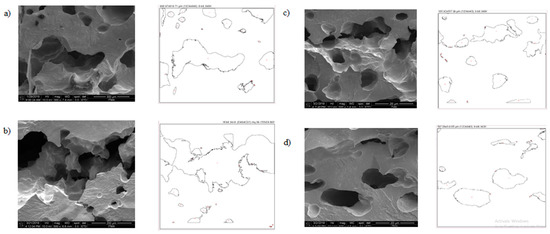
Figure 8.
Outline porosity of the selected area from ImageJ analysis for (a) JPU, (b) JPU/GO 0.35 wt%, (c) JPU/GO 0.50 wt%, (d) and JPU/GO 65 wt%.
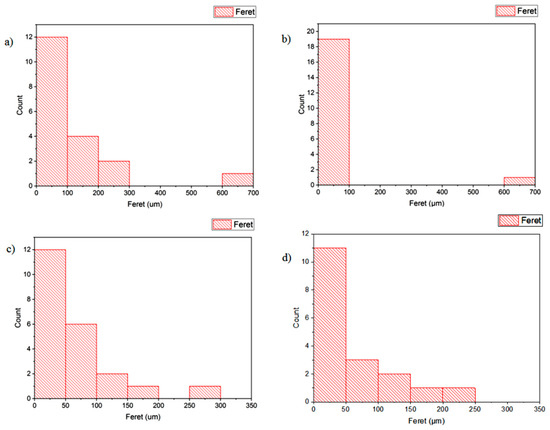
Figure 9.
Histogram porosity Feret diameter (µm) from ImageJ analysis for (a) JPU, (b) JPU/GO 0.35 wt%, (c) JPU/GO 0.50 wt%, (d) and JPU/GO 65 wt%.
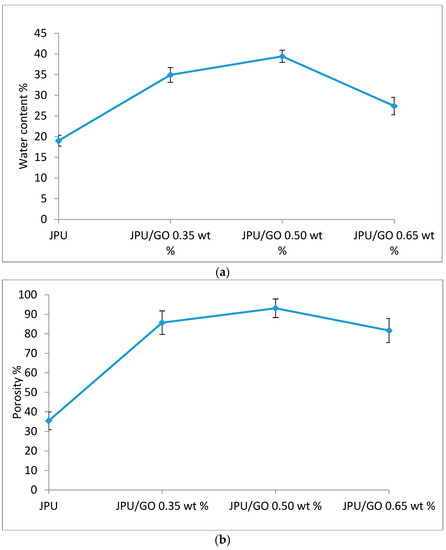
Figure 10.
Membrane (a) water content and (b) porosity in JPU, JPU/GO 0.35 wt%, JPU/GO 0.50 wt%, and JPU/GO 0.65 wt%.
3.3. Membrane Performance
Membrane performance was studied through water flux and heavy metal rejection from aqueous solutions. The concentration of Cu in feedstock and permeate was analyzed with AAS. The experiments were done in a customized cross-flow system membrane filtration and were duplicated for the average values.
3.3.1. Water Flux
As recorded in Figure 11, JPU/GO samples gave higher water flux than pristine JPU. These findings were consistent with those of Hu et al. who reported the fabrication of GO membrane with layer-by-layer method on a polydopamine-coated polysulfone and 1,3,5-benzenetricarbonyl trichloride as cross-linker which had higher water flux than most commercial nanofiltration (NF) membranes [87]. Similarly, Yin and coworkers found that GO-enhanced polyamide thin-film nanocomposite (TFN) membrane had higher water flux compared to TFN membrane containing MCM-41 silica nanoparticles with 59.4 ± 0.4 L/m2·h and 46.6 L/m2·h, respectively [88,89]. The amphiphilic nature of GO had formed water channel as water molecules were first absorbed onto the hydrophilic sites to allow water diffusion onto the hydrophobic carbon sites [84,90]. Similarly, in the case of polysulfone-nanostructured reduced graphene oxide (Ps-nRGO) composite UF membrane, loading of nRGO in Ps matrix had formed automatically smooth interconnected interlayer that caused higher water flux in Ps-nRGO than pristine Ps NF membrane [66].
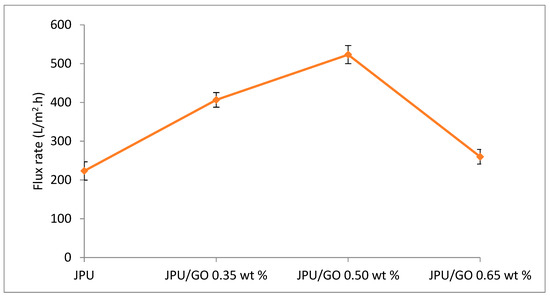
Figure 11.
Water flux JPU, JPU/GO 0.35 wt%, JPU/GO 0.50 wt%, and JPU/GO 0.65 wt%.
However, as loading of GO in JPU matrix increased to 0.65 wt%, water flux decreased to 260 L/m2·h, which is almost similar to pristine JPU at 223.33 L/m2·h. In contrast to JPU/GO samples with 0.35 wt% and 0.50 wt% GO loading in JPU matrix, higher water flux was recorded at 406.66 L/m2·h and 523.33 L/m2·h, respectively. These results were due to the GO sheet agglomeration in the polymer matrix that reduced the hydrophilicity and defected the membrane porosity [84,85,86]. Thus, the loading of GO in polymer matrix was crucial for enhancing JPU/GO membrane. The increase of water flux for JPU/GO samples compared to pristine JPU was consistent with the contact angle analysis as discussed earlier.
3.3.2. Cu(II) Ions Removal
The performance of membranes for Cu(II) ions removal was shown in Figure 12. JPU/GO exhibited higher rejection of heavy metals than pristine JPU due to the presence of GO. Various oxygenated functionalities on GO surface have increased the effectiveness in heavy metal removal [91] through the sharing of the lone electron pair on oxygen that binds with the metal ion to form a metal complex [92] compared to pristine membrane. A recent study reported the ability of GO-impregnated mixed matrix membrane using polysulfone (PSF) in N,N-dimethylformamide (DMF) for the absorption of metal ions such as Cr(VI), Cu(II), Pb(II), and Cd(II) from the solution [93]. Similarly, Ren et al. reported the removal of Cu(II) and Pb(II) by using graphene nanosheet/δ-MnO2 (GNS/MnO2) [94]. However, as loading of GO in JPU matrix increased to 0.65 wt%, Cu(II) rejection decreased. In membrane studies, pore size and electrostatic interaction with membrane surface were the two factors affecting the solute rejections [93]. By increasing the loading of GO, pore sizes of the membrane decreased due to the agglomeration of GO and became the influencing factor in lowering membrane performance. Thus, the solute rejection decreased with higher loading of GO beyond the optimum level. In the present study, the order of Cu(II) ions rejection is as follows: JPU/GO 0.50 wt% > JPU/GO 0.35 wt% > JPU/GO 0.65 wt% > JPU with rejections values of 71.60%, 67.56%, 63.58%, and 33.51%, respectively. Taken together, the results indicated that JPU/GO 0.50 wt% have the potential to be used as a membrane filtration for heavy metal rejection.
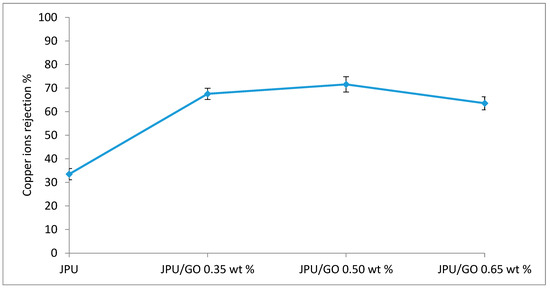
Figure 12.
Copper ion rejection on JPU, JPU/GO 0.35 wt%, JPU/GO 0.50 wt%, and JPU/GO 0.65 wt% membranes.
4. Conclusions
Jatropha oil-based polyol (JOL) was obtained from the modification of CJO through epoxidation and ring opening reaction. JPU was obtained from the blending of JOL and HDI. The addition of GO into JPU matrix remarkably improved the membrane properties in JPU/GO. JPU/GO composite membrane showed better thermal stability, porosity, hydrophilicity, and higher water flux, as well as Cu(II) ions removal compared to pristine JPU membrane. However, excessive addition of GO adversely affected the properties of JPU/GO membrane. This study is the preliminary experiment in revealing the capability of JPU/GO membrane for water treatment. Other further studies are required in the future to ensure good water permeation. Nonetheless, these results indicate JPU/GO samples have the potential to be exploited for membrane filtration in water treatment.
Author Contributions
Conceptualization, N.H.H., Z.Z.A.; methodology, N.H.H., Z.Z.A., A.H.A., R.O.; validation, N.H.H., Z.Z.A.; investigation, N.H.H., Z.Z.A.; analysis, N.H.H., Z.Z.A., A.H.A., R.O.; writing original draft preparation, N.H.H.; supervision, Z.Z.A., A.H.A., R.O.; project administration, Z.Z.A.; funding acquisition, Z.Z.A. All authors have read and agreed to the published version of the manuscript.
Funding
The project and student assistance were funded by Universiti Putra Malaysia Grant under project UPM/700-1/2/GPPI/2017/9531400 and Special Graduate Research Allowance (SGRA) respectively.
Acknowledgments
The authors would like to thank University Putra Malaysia and Colleague in UKM during execution of work in the lab.
Conflicts of Interest
The authors declare that there is no conflict of interest regarding the publication of this paper.
List of Abbreviation
| CJO | Crude Jatropha oil |
| EJO | Epoxide crude Jatropha oil |
| JOL | Jatropha-oil based polyol |
| GO | Graphene oxide |
| JPU | Jatropha polyurethane |
| JPU/GO | Jatropha polyurethane/graphene oxide |
| HDI | Hexamethylene diisocyanate |
References
- Lubasova, D.; Mullerova, J.; Netravali, A.N. Water-resistant plant protein-based nanofiber membranes. J. Appl. Polym. Sci. 2015, 132, 41852–41860. [Google Scholar] [CrossRef]
- Feng, X.; Kawabata, K.; Kaufman, G.; Elimelech, M.; Osuji, C.O. Highly Selective Vertically Aligned Nanopores in Sustainably Derived Polymer Membranes by Molecular Templating. ACS Nano 2017, 11, 3911–3921. [Google Scholar] [CrossRef] [PubMed]
- Al-Homaidan, A.A.; Al-Houri, H.J.; Al-Hazzani, A.A.; Elgaaly, G.; Moubayed, N.M.S. Biosorption of copper ions from aqueous solutions by Spirulina platensis biomass. Arab. J. Chem. 2014, 7, 57–62. [Google Scholar] [CrossRef]
- Boutilier, M.S.H.; Lee, J.; Chambers, V.; Venkatesh, V.; Karnik, R. Water Filtration Using Plant Xylem. PLoS ONE 2014, 9, e89934. [Google Scholar] [CrossRef] [PubMed]
- Medina, G. Jatropha Curcas: Biology, Cultivation and Potential Uses; Nova Science Publishers, Inc.: Hauppauge, NY, USA, 2015; ISBN 978-1-63483-112-3. [Google Scholar]
- Prasad, D.R.; Izam, A.; Khan, M.M.R. Reddy Prasad Jatropha curcas: Plant of medical benefits. J. Med. Plants Res. 2012, 6, 2691–2699. [Google Scholar]
- Issariyakul, T.; Dalai, A.K. Biodiesel from vegetable oils. Renew. Sustain. Energy Rev. 2014, 31, 446–471. [Google Scholar] [CrossRef]
- Abdelgadir, H.A.; Jäger, A.K.; Johnson, S.D.; Van Staden, J. Influence of plant growth regulators on flowering, fruiting, seed oil content, and oil quality of Jatropha curcas. S. Afr. J. Bot. 2010, 76, 440–446. [Google Scholar] [CrossRef]
- Abdelgadir, H.A.; Van Staden, J. Ethnobotany, ethnopharmacology and toxicity of Jatropha curcas L. (Euphorbiaceae): A review. S. Afr. J. Bot. 2013, 88, 204–218. [Google Scholar] [CrossRef]
- Boruah, M.; Gogoi, P.; Adhikari, B.; Dolui, S.K. Preparation and characterization of Jatropha Curcas oil based alkyd resin suitable for surface coating. Prog. Org. Coat. 2012, 74, 596–602. [Google Scholar] [CrossRef]
- Yongabi, K.A. Biocoagulants for Water and Waste Water Purification: A Review. Int. Rev. Chem. Eng. 2010, 2, 444–458. [Google Scholar]
- Pritchard, M.; Mkandawire, T.; Edmondson, A.; O’Neill, J.G.; Kululanga, G. Potential of using plant extracts for purification of shallow well water in Malawi. Phys. Chem. Earth Parts ABC 2009, 34, 799–805. [Google Scholar]
- Abidin, Z.Z.; Ismail, N.; Yunus, R.; Ahamad, I.S.; Idris, A. A preliminary study on Jatropha curcas as coagulant in wastewater treatment. Environ. Technol. 2011, 32, 971–977. [Google Scholar] [CrossRef] [PubMed]
- Abidin, Z.Z.; Madehi, N.; Yunus, R.; Derahman, A. Effect of Storage Conditions on Jatropha curcas Performance as Biocoagulant for Treating Palm Oil Mill Effluent. J. Environ. Sci. Technol. 2019, 12, 92–101. [Google Scholar] [CrossRef]
- Montiel-Juárez, L.-F.; Martínez Ayala, A.L.; Ríos-Corripio, M.A.; Arzate-Vázquez, I.; Zaca-Moran, P.; Rojas-López, M. Characterization of Biodegradable Nanocomposite Films Prepared with Glutelin from Jatropha curcas L. by Response Surface Methodology and Infrared Spectroscopy. Anal. Lett. 2019, 52, 423–438. [Google Scholar] [CrossRef]
- Ahmad Hazmi, A.S. Synthesis and Characerization of Jatropha Oil-Based Polyurethane from Jatropha Oil-Based Polyol. Master’s Thesis, Universiti Putra Malaysia, Selangor, Malaysia, 2012. [Google Scholar]
- Gofferje, G.; Schmid, M.; Stäbler, A. Characterization of Jatropha curcas L. Protein Cast Films with respect to Packaging Relevant Properties. Int. J. Polym. Sci. 2015, 2015, 1–9. [Google Scholar] [CrossRef]
- Abd Latiff, F.E.; Zurina, Z.A.; Francisco, C.; Dayang Radiah, A.B.; Paridah, M.T.; Khalina, A.; Kan, E.L. Physicochemical, structural and mechanical and evaluation of bio-based epoxidized Jatropha oil blended with amin-cured epoxy resins as new hybrid matrix. J. Eng. Sci. Technol. (JESTEC) 2019, 14, 1071–1087. [Google Scholar]
- Kinetics of Epoxidation of Jatropha Oil with Peroxyacetic and Peroxyformic Acid Catalysed by Acidic Ion Exchange Resin-ScienceDirect. Available online: https://www.sciencedirect.com/science/article/pii/S0009250907003727?via%3Dihub (accessed on 17 July 2019).
- Kamaruzaman, S.; Aris, N.F.; Yahaya, N.; Hong, L.S.; Razak, M.R. Removal of Cu (II) and Cd (II) Ions from Environmental Water Samples by Using Cellulose Acetate Membrane. J. Environ. Anal. Chem. 2017, 4, 4172. [Google Scholar] [CrossRef]
- Saalah, S.; Abdullah, L.C.; Aung, M.M.; Salleh, M.Z.; Awang Biak, D.R.; Basri, M.; Jusoh, E.R.; Mamat, S. Physicochemical Properties of Jatropha Oil-Based Polyol Produced by a Two Steps Method. Molecules 2017, 22, 551. [Google Scholar] [CrossRef]
- Aung, M.M.; Yaakob, Z.; Kamarudin, S.; Abdullah, L.C. Synthesis and characterization of Jatropha (Jatropha curcas L.) oil-based polyurethane wood adhesive. Ind. Crops Prod. 2014, 60, 177–185. [Google Scholar] [CrossRef]
- Petrovic, Z.S. Polyurethanes from Vegetable Oils. Polym. Rev. 2008, 48, 109–155. [Google Scholar] [CrossRef]
- Carlson, K.D.; Chaudhry, A.; Bagby, M.O. Analysis of oil and meal from Lesquerella fendleri seed. J. Am. Oil Chem. Soc. 1990, 67, 438–442. [Google Scholar]
- Asefnejad, A.; Khorasani, M.T.; Behnamghader, A.; Farsadzadeh, B.; Bonakdar, S. Manufacturing of biodegradable polyurethane scaffolds based on polycaprolactone using a phase separation method: Physical properties and in vitro assay. Int. J. Nanomed. 2011, 6, 2375–2384. [Google Scholar] [CrossRef] [PubMed]
- Falqi, F.H.; Bin-Dahman, O.A.; Hussain, M.; Al-Harthi, M.A. Preparation of Miscible PVA/PEG Blends and Effect of Graphene Concentration on Thermal, Crystallization, Morphological, and Mechanical Properties of PVA/PEG (10 wt%) Blend. Int. J. Polym. Sci. 2018, 2018, 1–10. [Google Scholar] [CrossRef]
- Dreyer, D.R.; Park, S.; Bielawski, C.W.; Ruoff, R.S. The chemistry of graphene oxide. Chem. Soc. Rev. 2010, 39, 228–240. [Google Scholar] [CrossRef] [PubMed]
- Pei, S.; Cheng, H.-M. The reduction of graphene oxide. Carbon 2012, 50, 3210–3228. [Google Scholar] [CrossRef]
- Bhattacharya, M. Polymer Nanocomposites—A Comparison between Carbon Nanotubes, Graphene, and Clay as Nanofillers. Materials 2016, 9, 262. [Google Scholar] [CrossRef] [PubMed]
- Hu, K.; Kulkarni, D.D.; Choi, I.; Tsukruk, V.V. Graphene-polymer nanocomposites for structural and functional applications. Prog. Polym. Sci. 2014, 39, 1934–1972. [Google Scholar] [CrossRef]
- Kuilla, T.; Bhadra, S.; Yao, D.; Kim, N.H.; Bose, S.; Lee, J.H. Recent advances in graphene based polymer composites. Prog. Polym. Sci. 2010, 35, 1350–1375. [Google Scholar] [CrossRef]
- Stankovich, S.; Dikin, D.A.; Dommett, G.H.B.; Kohlhaas, K.M.; Zimney, E.J.; Stach, E.A.; Piner, R.D.; Nguyen, S.T.; Ruoff, R.S. Graphene-based composite materials. Nature 2006, 442, 282–286. [Google Scholar] [CrossRef]
- Kim, H.; Abdala, A.A.; Macosko, C.W. Graphene/Polymer Nanocomposites. Macromolecules 2010, 43, 6515–6530. [Google Scholar] [CrossRef]
- Potts, J.R.; Dreyer, D.R.; Bielawski, C.W.; Ruoff, R.S. Graphene-based polymer nanocomposites. Polymer 2011, 52, 5–25. [Google Scholar] [CrossRef]
- Marlina, M.; Farida, M.; Yahya, M. Synthesis and Characterization of Polyurethane Membrane from Nyamplung Seed Oils (Calophyllum inophillum). Asian J. Chem. 2017, 29, 1912–1916. [Google Scholar] [CrossRef]
- Moradihamedani, P.; Kalantari, K.; Abdullah, A.H.; Morad, N.A. High efficient removal of lead(II) and nickel(II) from aqueous solution by novel polysulfone/Fe3O4–talc nanocomposite mixed matrix membrane. Desalin. Water Treat. 2016, 57, 28900–28909. [Google Scholar] [CrossRef]
- Zahabi, S.R.; Hosseini Ravandi, S.A.; Allafchian, A. Removal of nickel and cadmium heavy metals using nanofiber membranes functionalized with (3-mercaptopropyl)trimethoxysilane (TMPTMS). J. Water Health 2016, 14, 630–639. [Google Scholar] [CrossRef]
- Moradihamedani, P.; Abdullah, A.H.B. Phosphate removal from water by polysulfone ultrafiltration membrane using PVP as a hydrophilic modifier. Desalin. Water Treat. 2016, 57, 25542–25550. [Google Scholar]
- Rehman, F.-U. Synthesis and Characterization of Speciality Polyurethane Elastomers. Ph.D. Thesis, University of Agriculture, Faisalabad, Pakistan, 2010. [Google Scholar]
- Clemitson, I.R. Castable Polyurethane Elastomers, 1st ed.; CRC Press: Boca Raton, FL, USA, 2008; ISBN 978-0-429-13726-6. [Google Scholar]
- Ashida, K. Polyurethane and Related Foams: Chemistry and Technology; CRC Press: Boca Raton, FL, USA, 2006; ISBN 978-1-58716-159-9. [Google Scholar]
- Ionescu, M. Chemistry and Technology of Polyols for Polyurethanes; Rapra Technology: Shawbury, UK, 2005; ISBN 978-1-60119-664-4. [Google Scholar]
- Randall, D.; Lee, S. The Polyurethanes Book; John Wiley & Sons: New York, NY, USA, 2002; ISBN 978-0-470-85041-1. [Google Scholar]
- Szycher, M. Szycher’s Handbook of Polyurethanes; CRC Press: Boca Raton, FL, USA, 1999; ISBN 978-0-8493-0602-0. [Google Scholar]
- Hepburn, C. Polyurethane Elastomers, 2nd ed.; Elesiver Science Publishers LTD.: New York, NY, USA, 2012; ISBN 978-1-85166-589-1. [Google Scholar]
- Woods, G. The ICI Polyurethanes Book, 2nd ed.; ICI Polyurethanes: Chichester, UK; Wiley: New York, NY, USA, 1990; ISBN 978-0-471-92658-0. [Google Scholar]
- Duff, D.W.; Maciel, G.E. Carbon-13 and nitrogen-15 CP/MAS NMR characterization of biuret-rich 4,4’-methylenebis(phenyl isocyanate)-based resins. Macromolecules 1990, 23, 4367–4371. [Google Scholar] [CrossRef]
- Singh, P.; Boivin, J.L. Studies on The Stability of The Dimer of 2,4-Tolylene Diisocyanate. Can. J. Chem. 1962, 40, 935–940. [Google Scholar]
- Zhao, Y. Modeling and Experimental Study of Polyurethane Foaming Reactions. Ph.D. Thesis, Philosophy, University of Missouri-Columbia, Columbia, MO, USA, 2015. [Google Scholar]
- Szycher, M. Szycher’s Handbook of Polyurethanes; CRC Press: Boca Raton, FL, USA, 2013; ISBN 978-1-4398-3958-4. [Google Scholar]
- Zinadini, S.; Zinatizadeh, A.A.; Rahimi, M.; Vatanpour, V.; Zangeneh, H. Preparation of a novel antifouling mixed matrix PES membrane by embedding graphene oxide nanoplates. J. Membr. Sci. 2014, 453, 292–301. [Google Scholar]
- Abdullah, B.M.; Salih, N.; Salimon, J. Optimization of the chemoenzymatic mono-epoxidation of linoleic acid using D-optimal design. J. Saudi Chem. Soc. 2014, 18, 276–287. [Google Scholar]
- Ikhuoria, E.U.; Obuleke, R.O.; Okieimen, F.E. Studies on the Kinetics of Epoxidation of the Methyl Esters of Parkia Biglobosa Seed Oil. J. Macromol. Sci. Part A 2007, 44, 235–238. [Google Scholar] [CrossRef]
- Okieimen, F.E.; bakare, O.I.; Okieimen, C.O. Studies on the Epoxidation of Rubber Seed Oil. Ind. Crops Prod. 2002, 15, 139–144. [Google Scholar] [CrossRef]
- Macalino, A.; Salen, V.; Reyes, L. Castor Oil Based Polyurethanes: Synthesis and Characterization. IOP Conf. Ser. Mater. Sci. Eng. 2017, 229, 012016. [Google Scholar] [CrossRef]
- Haji Badri, K.; Wong, C.S.; Raja Shahrom, M.S.; Liow, C.H.; Baderuliksan, N.Y.; Norzali, N.R. Adawiyah Ftir Spectroscopy Analysis of The Prepolymerization of Palm-Based Polyurethane. Solid State Sci. Technol. 2010, 18, 1–8. [Google Scholar]
- Smith, M.; March, J. March’s Advanced Organic Chemistry: Reactions, Mechanisms, and Structure; Wiley-Interscience: Hoboken, NJ, USA, 2007; ISBN 978-0-470-08496-0. [Google Scholar]
- Sun, D.-L.; Mai, J.-J.; Deng, J.-R.; Idem, R.; Liang, Z.-W. One-Pot Synthesis of Dialkyl Hexane-1,6-Dicarbamate from 1,6-Hexanediamine, Urea, and Alcohol over Zinc-Incorporated Berlinite (ZnAlPO4) Catalyst. Catalysts 2016, 6, 28. [Google Scholar] [CrossRef]
- Djomgoue, P.; Njopwouo, D. FT-IR Spectroscopy Applied for Surface Clays Characterization. J. Surf. Eng. Mater. Adv. Technol. 2013, 3, 275–282. [Google Scholar] [CrossRef]
- Zhu, J.; Yang, J.; Bian, Z.-F.; Ren, J.; Liu, Y.-M.; Cao, Y.; Li, H.-X.; He, H.-Y.; Fan, K.-N. Nanocrystalline anatase TiO2 photocatalysts prepared via a facile low temperature nonhydrolytic sol–gel reaction of TiCl4 and benzyl alcohol. Appl. Catal. B Environ. 2007, 76, 82–91. [Google Scholar] [CrossRef]
- Kusiak-Nejman, E.; Moszyński, D.; Kapica-Kozar, J.; Wanag, A.; Morawski, A. Assessment of the Suitability of the One-Step Hydrothermal Method for Preparation of Non-Covalently/Covalently-Bonded TiO2/Graphene-Based Hybrids. Nanomaterials 2018, 8, 647. [Google Scholar] [CrossRef]
- Kuroda, Y.; Mori, T.; Yagi, K.; Makihata, N.; Kawahara, Y.; Nagao, M.; Kittaka, S. Preparation of Visible-Light-Responsive TiO2−xNx Photocatalyst by a Sol−Gel Method: Analysis of the Active Center on TiO2 that Reacts with NH3. Langmuir 2005, 21, 8026–8034. [Google Scholar] [CrossRef]
- Luceño-Sánchez, J.; Maties, G.; Gonzalez-Arellano, C.; Diez-Pascual, A. Synthesis and Characterization of Graphene Oxide Derivatives via Functionalization Reaction with Hexamethylene Diisocyanate. Nanomaterials 2018, 8, 870. [Google Scholar] [CrossRef]
- Ephraim, S.; Woodward, A.E.; Mesrobian, R.B. Kinetic Studies of the Reaction of Phenyl Isocyanate with Alcohols in Various Solvents1. J. Am. Chem. Soc. 1958, 80, 1326–1328. [Google Scholar] [CrossRef]
- Sato, M. The Rate of the Reaction of Isocyanates with Alcohols. II. J. Org. Chem. 1962, 27, 819–825. [Google Scholar] [CrossRef]
- Pal, A.; Kar, S.; Debnath, A.K.; Aswal, D.K.; Bindal, R.C.; Tewari, P.K. Reinforcement of nanostructured reduced graphene oxide: A facile approach to develop high-performance nanocomposite ultrafiltration membranes minimizing the trade-off between flux and selectivity. RSC Adv. 2015, 5, 46801–46816. [Google Scholar] [CrossRef]
- Javni, I.; Petrović, Z.S.; Guo, A.; Fuller, R. Thermal stability of polyurethanes based on vegetable oils. J. Appl. Polym. Sci. 2000, 77, 1723–1734. [Google Scholar] [CrossRef]
- Gaboriaud, F.; Vantelon, J.P. Mechanism of thermal degradation of polyurethane based on MDI and propoxylated trimethylol propane. J. Polym. Sci. Polym. Chem. Ed. 1982, 20, 2063–2071. [Google Scholar] [CrossRef]
- Zhang, C. Polyurethane Films, Foams and Nanocomposites Prepared from Vegetable Oil-Based Polyols. Ph.D. Thesis, Iowa State University, Ames, IA, USA, 2014. [Google Scholar]
- Weng, N.-C.; Wu, C.-F.; Tsen, W.-C.; Wu, C.-L.; Suen, M.-C. Synthesis and properties of shape memory polyurethanes generated from schiff-base chain extender containing benzoyl and pyridyl rings. Des. Monomers Polym. 2018, 21, 55–63. [Google Scholar] [CrossRef]
- Ramirez, D.; Jaramillo, F. Improved mechanical and antibacterial properties of thermoplastic polyurethanes by efficient double functionalization of silver nanoparticles. J. Appl. Polym. Sci. 2018, 135. [Google Scholar] [CrossRef]
- Menczel, J.D.; Prime, R.B. Thermal Analysis of Polymers: Fundamentals and Applications; John Wiley: Hoboken, NJ, USA, 2009; ISBN 978-0-471-76917-0. [Google Scholar]
- Wirpsza, Z.; Kemp, T.J. Polyurethanes: Chemistry, Technology, and Applications; E. Horwood: New York, NY, USA, 1993; ISBN 978-0-13-683186-0. [Google Scholar]
- Hashim, A. Advances in Nanocomposite Technology; InTech: Rijeka, Croatia, 2011; ISBN 978-953-307-347-7. [Google Scholar]
- Wu, G.; Xu, X.; He, X.; Yan, Y. Preparation and Characterization of Graphene Oxide-Modified Sapium sebiferum Oil-Based Polyurethane Composites with Improved Thermal and Mechanical Properties. Polymers 2018, 10, 133. [Google Scholar] [CrossRef]
- Ionita, M.; Pandele, A.M.; Crica, L.; Pilan, L. Improving the thermal and mechanical properties of polysulfone by incorporation of graphene oxide. Compos. Part B Eng. 2014, 59, 133–139. [Google Scholar] [CrossRef]
- Ganesh, B.M.; Isloor, A.M.; Ismail, A.F. Enhanced hydrophilicity and salt rejection study of graphene oxide-polysulfone mixed matrix membrane. Desalination 2013, 313, 199–207. [Google Scholar] [CrossRef]
- Ammar, A.; Al-Enizi, A.M.; AlMaadeed, M.A.; Karim, A. Influence of graphene oxide on mechanical, morphological, barrier, and electrical properties of polymer membranes. Arab. J. Chem. 2016, 9, 274–286. [Google Scholar] [CrossRef]
- Chien, H.-C.; Tsai, L.-D.; Huang, C.-P.; Kang, C.; Lin, J.-N.; Chang, F.-C. Sulfonated graphene oxide/Nafion composite membranes for high-performance direct methanol fuel cells. Int. J. Hydrogen Energy 2013, 38, 13792–13801. [Google Scholar] [CrossRef]
- Dyer, E.; Taylor, H.A.; Mason, S.J.; Samson, J. The Rates of Reaction of Isocyanates with Alcohols. I. Phenyl Isocyanate with 1- and 2-Butanol. J. Am. Chem. Soc. 1949, 71, 4106–4109. [Google Scholar] [CrossRef]
- Zhao, C.; Xu, X.; Chen, J.; Wang, G.; Yang, F. Highly effective antifouling performance of PVDF/graphene oxide composite membrane in membrane bioreactor (MBR) system. Desalination 2014, 340, 59–66. [Google Scholar] [CrossRef]
- Kabiri, R.; Namazi, H. Nanocrystalline cellulose acetate (NCCA)/graphene oxide (GO) nanocomposites with enhanced mechanical properties and barrier against water vapor. Cellulose 2014, 21, 3527–3539. [Google Scholar] [CrossRef]
- Zhao, H.; Wu, L.; Zhou, Z.; Zhang, L.; Chen, H. Improving the antifouling property of polysulfone ultrafiltration membrane by incorporation of isocyanate-treated graphene oxide. Phys. Chem. Chem. Phys. 2013, 15, 9084–9092. [Google Scholar] [CrossRef]
- Sali, S.; Mackey, H.R.; Abdala, A.A. Effect of Graphene Oxide Synthesis Method on Properties and Performance of Polysulfone-Graphene Oxide Mixed Matrix Membranes. Nanomaterials 2019, 9, 769. [Google Scholar] [CrossRef]
- Xu, Z.; Zhang, J.; Shan, M.; Li, Y.; Li, B.; Niu, J.; Zhou, B.; Qian, X. Organosilane-functionalized graphene oxide for enhanced antifouling and mechanical properties of polyvinylidene fluoride ultrafiltration membranes. J. Membr. Sci. 2014, 458, 1–13. [Google Scholar] [CrossRef]
- Orooji, Y.; Faghih, M.; Razmjou, A.; Hou, J.; Moazzam, P.; Emami, N.; Aghababaie, M.; Nourisfa, F.; Chen, V.; Jin, W. Nanostructured mesoporous carbon polyethersulfone composite ultrafiltration membrane with significantly low protein adsorption and bacterial adhesion. Carbon 2017, 111, 689–704. [Google Scholar] [CrossRef]
- Hu, M.; Mi, B. Enabling Graphene Oxide Nanosheets as Water Separation Membranes. Environ. Sci. Technol. 2013, 47, 3715–3723. [Google Scholar] [CrossRef]
- Yin, J.; Kim, E.-S.; Yang, J.; Deng, B. Fabrication of a novel thin-film nanocomposite (TFN) membrane containing MCM-41 silica nanoparticles (NPs) for water purification. J. Membr. Sci. 2012, 423–424, 238–246. [Google Scholar] [CrossRef]
- Yin, J.; Zhu, G.; Deng, B. Graphene oxide (GO) enhanced polyamide (PA) thin-film nanocomposite (TFN) membrane for water purification. Desalination 2016, 379, 93–101. [Google Scholar] [CrossRef]
- Hegab, H.M.; Zou, L. Graphene oxide-assisted membranes: Fabrication and potential applications in desalination and water purification. J. Membr. Sci. 2015, 484, 95–106. [Google Scholar] [CrossRef]
- Ding, Z.; Hu, X.; Morales, V.L.; Gao, B. Filtration and transport of heavy metals in graphene oxide enabled sand columns. Chem. Eng. J. 2014, 257, 248–252. [Google Scholar] [CrossRef]
- Cui, L.; Wang, Y.; Gao, L.; Hu, L.; Yan, L.; Wei, Q.; Du, B. EDTA functionalized magnetic graphene oxide for removal of Pb(II), Hg(II) and Cu(II) in water treatment: Adsorption mechanism and separation property. Chem. Eng. J. 2015, 281, 1–10. [Google Scholar] [CrossRef]
- Mukherjee, R.; Bhunia, P.; De, S. Impact of graphene oxide on removal of heavy metals using mixed matrix membrane. Chem. Eng. J. 2016, 292, 284–297. [Google Scholar] [CrossRef]
- Ren, Y.; Yan, N.; Feng, J.; Ma, J.; Wen, Q.; Li, N.; Dong, Q. Adsorption mechanism of copper and lead ions onto graphene nanosheet/δ-MnO2. Mater. Chem. Phys. 2012, 136, 538–544. [Google Scholar] [CrossRef]


© 2020 by the authors. Licensee MDPI, Basel, Switzerland. This article is an open access article distributed under the terms and conditions of the Creative Commons Attribution (CC BY) license (http://creativecommons.org/licenses/by/4.0/).