Article

Flow and Tableting Behaviors of Some Egyptian Kaolin Powders as Potential Pharmaceutical Excipients

by
Mahmoud E. Awad
1,2,3,
Alberto López-Galindo
2,*,
Djordje Medarević
3,
Jelena Đuriš
3,
Mahmoud M. El-Rahmany
1,
Svetlana Ibrić
3 and
César Viseras
2,4
1
Geology Department, Faculty of Science, Al Azhar University in Cairo, Nasr City 11884, Egypt
2
Andalusian Institute of Earth Sciences IACT, Spanish National Research Council CSIC—University of Granada UGR, 18100 Armilla, Granada, Spain
3
Department of Pharmaceutical Technology, Faculty of Pharmacy, University of Belgrade, 11221 Belgrade, Serbia
4
Department of Pharmacy and Pharmaceutical Technology, Faculty of Pharmacy, University of Granada, 18071 Granada, Spain
*
Author to whom correspondence should be addressed.
Minerals 2020, 10(1), 23; https://doi.org/10.3390/min10010023
Submission received: 19 November 2019 / Revised: 17 December 2019 / Accepted: 21 December 2019 / Published: 26 December 2019
(This article belongs to the Special Issue Special Clays and Their Applications)

Abstract

:
The present work aimed at assessing the pharmaceutical tableting properties of some Egyptian kaolin samples belong to the Abu Zenima kaolin deposits (estimated at 120 million tons). Four representative samples were selected based on kaolinite richness and their structural order-disorder degree, and after purification, they were dried at 70 °C and heated from room temperature up to 400 °C (10 °C/min). Mineralogy, micromorphology, microtexture, granulometry, porosimetry, moisture content, bulk and tapped density, direct and indirect flowability, and tableting characteristics are studied. Results indicated that purified kaolin samples were made up of 95–99% kaolinite, <3% illite, 1% quartz and 1% anatase. The powder showed mesoporous character (pore diameters from 2 to 38 nm and total pore volume from 0.064 to 0.136 cm3/g) with dominance of fine nanosized particles (<1 μm–10 nm). The powder flow characteristics of both the ordered (Hinckley Index HI > 0.7, crystallite size D001 > 30 nm) and disordered (HI < 0.7, D001 < 30 nm) kaolinite-rich samples have been improved (Hausner ratio between 1.24 and 1.09) as their densities were influenced by thermal treatment (with some observed changes in the kaolinite XRD reflection profiles) and by moisture content (variable between 2.98% and 5.82%). The obtained tablets exhibited hardness between 33 and 44 N only from the dehydrated powders at 400 °C, with elastic recovery (ER) between 21.74% and 25.61%, ejection stress (ES) between 7.85 and 11.45 MPa and tensile fracture stress (TFS) between 1.85 and 2.32 MPa, which are strongly correlated with crystallinity (HI) and flowability (HR) parameters. These findings on quality indicators showed the promising pharmaceutical tabletability of the studied Egyptian kaolin powders and the optimization factors for their manufacturability and compactability.

1. Introduction

Tablets represent about 75% of all the common orally administered solid dosage forms. Powder flowability of tableting excipients is one of the most important quality-by-design properties that must be highly adequate because it directly controls the powder transport and tableting characteristics as well as tablet content and dosage uniformity [1]. Kaolinite is the major and common-forming mineral of the sedimentary kaolin deposits, representing the most widely distributed resources and occurrences when compared to those of its kaolin group-polymorph halloysite. Kaolinite is a generally inexpensive, ubiquitous and biologically safe raw geomaterial to be used in pharmaceutical formulations at specific high purity grades. This phyllosilicate mineral exhibits a simple pseudohexagonal platy-form of stacking layered structure, with excellent physical and chemical properties that make it suitable as excipient (e.g., diluent, binder, disintegrant, pelletizing, granulating, amorphizing and film coating, emulsifying and suspending agents and drug carrier) in solid and semi-solid dosage formulations, besides its therapeutic activity in many biomedicinal applications [2,3,4,5,6,7,8,9,10,11,12,13]. Kaolinite particles and its polymorph halloysite nanotubes surfaces exhibit adsorption affinities to many active ingredients including the organic drug and agrochemical molecules, biomolecules and non-toxic bioactive metals [14,15,16,17]. Moreover, developmental studies by Tan et al. [18] and Dey et al. [19] on the kaolinite functionality as pharmaceutical carrier reported that the drug loading capacities and controlled release by this clay mineral can be improved by means of physical and chemical modifications, as well as by hybridation with biopolymers [20,21,22]. In additions, some important natural and modified microporous aluminosilicate minerals (e.g., zeolite and phillipsite) have been proved excellent functionalities in the drug loading and controlled release as pharmaceutical carrier and hence they are compatible with kaolin minerals for solid dosage formulations [23,24,25,26,27,28,29].
Kaolinite is a good compactible mineral that is chemically inert and compatible to bind physically with many other adjuvant substances used in solid dosage formulations. The equilibrium moisture content (EMC) is a physical parameter used to classify pharmaceutical solid excipients based on the relative absorbed and/or adsorbed water amounts by a specific constant mass of each material at the same equilibrium ambient conditions, including storage time, temperature, humidity, etc. [30]. Kaolinite is a weakly hygroscopic mineral as it exhibits very low EMC (<1%), and it is desirable in tablets manufacturing when compared to other strongly hygroscopic clay and non-clay minerals because high moisture contents which exist as confined pore fluids influence undesirably on the performance and efficiency of powder flowability and compressibility during tablet manufacturing, affecting the physical stability of the compressed particles and the chemical stability of the active ingredient in the final tablet product during storage [31,32]. Moreover, kaolinite exhibits the highest chemical stability against acid attack amongst all clay minerals; therefore it is highly gastric acid resistant and preferred for oral dosage formulations, particularly in antacid products [8,33,34].
In high purity kaolin grade, the most variable and modifiable technological properties that generally control the applicability and quality of kaolinite as excipient material in pharmaceutical solid and semisolid formulations are the structural, micromorphological and microtextural characteristics [35,36,37], particularly the kaolinite platelets stacking order-disorder degree and its average coherent thickness, i.e., crystallite size, porosity, particle shape, particle-particle interaction and packing pattern, particle size granulometry and the uniformity or heterogeneous grading character of the kaolin powder [38,39]. Therefore, flowability properties are high probably influenced by these powder characteristics, which could affect the performance and efficiency of tablets manufacturing and their physical and physicochemical stability during storage. For these reasons, the mentioned factors must be taken in consideration while the developmental and optimization studies on the kaolinite-based solid dosage formulations.
The Gamlen® D-series powder compaction analyzer is one of the most advanced and high-performance instrument used in powder compaction analysis and characterization for tablet manufacturing based on quality by design (QbD) approach [40]. Generally, only the halloysite tableting properties, amongst all the clay minerals, were recently characterized by means of this method [41]. The kaolinite resources of Abu Zenima district, located at west central Sinai in Egypt (estimated at 120 million tons), have recently received attention for evaluation and exploitation in pharmaceutical uses [38]. In the present study, the tableting properties of some representative high grade samples of Egyptian kaolins have been characterized by powder compaction analysis following the method of Osamura et al. [42] for evaluating their potentiality and performance as pharmaceutical excipient, checking the effects of their particle micrometrics and powder geometrical characteristics as quality controlling factors on the tableting properties. Basically, the study aims to compare the flow and tableting behaviors of these kaolinite-rich samples with the changes of moisture contents, microstructures and micrometrics after thermal treatment at low (70 °C) and high (400 °C) temperatures.

2. Materials and Methods

2.1. Materials and Preparation

Four representative high-grade (i.e., high purity and quality) raw kaolinite-rich samples (named N-2, F-2, D-6 and K-3) with variable structural ordered-disordered degrees were selected for testing and evaluation of their tableting characteristics and powder flowability. These samples belong to the economically viable Egyptian Abu Zenima kaolin deposits, characterized mineralogically, chemically and proved suitability for pharmaceutical uses according to specifications and limits reported in kaolin monograph of the European and US Pharmacopoeias and the European Medicines Agency [38].
The raw samples were crushed, milled, dried and sieved to particle size <125 µm. Then, samples were subjected to purification following the sedimentation method of Maynard [43]. Kaolin particles were disaggregated by using mechanical stirrer with the addition of a dispersant, sodium hexametaphosphate (conc. 0.75%), to keep the particles flocculated and preventing their agglomeration, due to the increase of the particles repulsion by increasing the negative charge on mineral surfaces. The pH was adjusted to the range 6.5 to 7.0 by using sodium carbonate (conc. 0.25%) to induce the negative charge on both edges and faces of kaolinite particles [44]. The slurry was then kept to settling for 24 h, and then subjected to decantation process. The whiter decanted dispersions were centrifuged and washed three times, then dried and the powders were kept to perform the targeted characterizations of the present study, while the darker settled layers of the coarser silt-sized kaolin particles (>44 µm) with mineral impurities were dried, re-pulverized and recovered.
Thermodynamically, the desorption enthalpy (i.e., energy required for water desorption) increases with decreasing of the equilibrium moisture content. Hence, the intrinsic low equilibrium moisture content of kaolins requires rising of temperatures during the drying process. Clearly, the optimum temperature for the complete desorption of the unbounded water (i.e., the free moisture content that can be easily removed) has been determined experimentally from the moisture sorption isotherms of kaolin as 70 °C [45]. Meanwhile, a higher energy is required to the complete desorption of the bounded water (i.e., that is more difficult to remove in practice) which is possible by heating up to 400 °C with keeping on the kaolinite chemical stability without decomposition. Therefore, the studied purified four samples were fractionated into two testable categories: the first one was dried at 70 °C for 2 h in dryer oven (to easily remove the free unbounded water content), and the other was heated by the rate of 10 °C/min from the room temperature up to 400 °C in a temperature controlling furnace (to remove the bounded water content). Then, all the samples were kept in desiccators at the same conditions. Hence, the study would be focused mainly on testing the influence of desorbing confined pore water on the potential improvement of kaolin powder flowability and enhancing successful tableting behaviors.

2.2. Powder Characterization

2.2.1. XRD/XRF Composition and Microstructure

The purified kaolin samples were analyzed by means of X-ray diffraction (XRD) and X-ray fluorescence (XRF) by following the same methods described in Awad et al. [38]. The XRD analysis was performed by using an X’Pert Pro diffractometer (CuKα radiation, 45 kV, 40 mA, Malvern PANalytical Ltd, Malvern, UK) equipped with an X’Celerator solid-state linear detector (Malvern PANalytical Ltd, Malvern, UK), using a step increment of 0.008° 2θ and a counting time of 10 s/step. The XRF analysis was carried out on prepared pressed pellets samples by using a commercial wavelength dispersive X-ray fluorescence instrument (S4 Pioneer, Bruker AXS Inc., Fitchburg, WI, USA) equipped with an Rh anode X-ray tube (60 KV, 150 mA) and linked to SpectraPlus software (SpectraPLUS-DT, Pioneer Hill Software LLC., Poulsbo, WA, USA). The loss on ignition (LOI) was determined by samples heating to 900 °C for 1 h.
The mineralogical composition was determined by combination of XRD and chemical analysis data following the methods of Moore and Reynolds [46] and López-Galindo et al. [47].The scanned diffraction data of the 020, 0-10 and 11-1 reflections (from 19° to 24° 2θ) were used for determining kaolinite structural order-disorder degree by means of Hinckley Index (HI [48]) and those of the 001 reflection (from 11° to 13.5° 2θ) were used for determining their crystallite sizes (D001) by using the XPOWDER® software (XPOWDER12, UGR, Granada, Spain [49], which was calculated by means of reflection profile broadening analysis based on the Warren modification of the Scherrer equation as explained in Awad et al. [39].

2.2.2. SEM/TEM Microtexture and Micromorphology

Microtexture of kaolinite particles was imaged by field emission scanning electron microscopy (FESEM) by using a SUPRA40VP instrument (Carl Zeiss, Jena, Germany) working at 5 to10 kV. The kaolinite particle morphology was investigated by means of transmission electron microscopy by using a Titan G2 60-300 microscope (FEI, Hillsboro, OR, USA) with a high brightness electron gun (X-FEG) operated at 300 kV and equipped with a SUPER-X silicon-drift window-less EDX detector. The spectra were collected in STEM mode using a HAADF detector (Gatan Inc., Pleasanton, CA, USA).

2.2.3. Laser Granulometry

Granulometric analysis of the purified kaolin samples were performed by using a laser diffraction technique (Mastersizer 2000LF, Malvern Instruments, Malvern, UK) in the particle size range between 0.02 and 1500 μm. The instrument is consisted of a wet sample dispersion unit (Hydro MU, Malvern Instruments, Malvern, UK) and microvolume wet sampler (Hydro 200Up, Malvern Instruments, Malvern, UK) connected to optical bench equipped by light scattering patterns detectors. Prior to the measurement, a few milligrams of the powder sample (<125 μm) were fed into the dispersion unit to the correct concentration for stirring in purified water with sonification for 30 s and then delivered to the optical bench for measurement based on a standard operating procedure. The captured raw data were analyzed and visualized automatically by the Malvern software.

2.2.4. Porosity

The Barrett, Joyner and Halenda (BJH) cumulative pore volumes (cm3/g) between 1.7 and 300 nm diameters of the studied kaolin samples were determined by N2 adsorption/desorption isotherms based on the Brunauer–Emmett–Teller (BET) method. The N2 sorption isotherms were obtained by using a Micromeritics TriStar 3000 (Micromeritics Instrument Corporation, Norcross, GA, USA) under continuous adsorption conditions at 77.300 K. Before measurement, powder samples were heated at 200 °C for 2 h and outgassed to 10−3 Torr using a Micromeritics Flowprep (flow prep station 060, Micromeritics Instr. Corp., Norcross, GA, USA) [50].

2.2.5. Bulk and Tapped Density

The densities of the studied kaolin samples were measured for the two described categories of powder’s heating conditions. The bulk and tapped densities were determined following the method (A) in the d ocument number QAS/11-450 [51] of the international pharmacopeia. A 5 g of each fraction sample passed through 125 μm sieve apertures to break up agglomerates that may formed during storage and poured into a dry 10 mL graduated cylinder (readable to 1 mL) and leveled at fixed specific initial volume (V0 = 6 mL) without compacting. The mass (m) of the fixed powder volume was weighted with 0.0001g accuracy and the bulk densities (d0 in g/mL) calculated by using the formula m/V0. The tapped density (dc in g/mL) was calculated by the formula m/Vc, where Vc is the compaction volume obtained after mechanical tapping of the bulk volume (V0), achieved by STAV 2003 Stampf volumeter (Engelsmann, Laborgerätebörse GmbH, Bruckstr, Burladingen, Germany) for c = 1250 taps. This number of taps (c = 1250) was considered as the optimum tapped volume because the determined difference between V500 and V1250 for each measured sample was <2 mL and even the difference between V1250 and V2500 was insignificant. Triplicate measurements were carried out for both density types to calculate median and standard deviation.

2.2.6. Thermogravimetric Analysis (TGA)

The thermogravimetric analysis was carried out on the studied kaolin samples within the thermal range ~25 °C to ~1000 °C (temperature rising rate of 10 °C/min). It was performed on 10 mg of each sample in a platinum mesh cell (crucible) by using a Shimadzu TGA-50H thermogravimetric analyzer (Shimadzu Corporation, Kyoto, Japan) with vertical oven design and maximum precision of 0.001 mg, and the collected data were processed by using TA-60WS Thermal Analysis Workstation Software (TA-60WS 2.21, developed by Shimadzu Corp., Kyoto, Japan) equipped with the OLE function and ASCII conversion function. Before measurements, the temperature was calibrated and the TG data were corrected as the buoyancy effects and disturbances were eliminated. The targeted moisture contents of the studied samples were determined from the original TGA curves by means of the mass loss% obtained only within the focused heating range from room temperature (~25 °C) up to 400 °C.

2.2.7. Powder Flowability

Flowability of the studied kaolin powders was determined by means of direct and indirect methods. For the direct flowability (g/s), 15 g of each powder sample was poured into the funnel of a flow meter equipment (GDT Erweka, Heusenstamm, Hesse, Germany, [52]) and the time taken through powder flowing was detected automatically and accurately with triplicate measurements. Indirect flowability methods were determined for both of the two cited conditions of powder heating (70 °C and 400 °C) and calculated based on the bulk and tapped density values by means of the flow parameters, Hausner ratio (HR = V0/Vc, [53]) and Compressibility Index, also known as Carr’s index (CI = 100[(V0Vc)/V0], [54]).

2.3. Tablets Manufacturing and Testing Data Analysis

The manufacturing of kaolin tablets for evaluating their tableting potential and performance properties (compressibility, compactability and manufacturability) was performed by using the Gamlen Tablet Press (GTP-1, Gamlen® Instruments, Croydon, London, UK) benchtop single-punch tablet press) [40,55,56]. The tablets were prepared in three steps: (1) after the settings adjustment and calibration (base plate position = 28.348 mm) procedure, a 100 mg of each powder sample (heated up to 400 °C) was poured into the funnel of the die (diameter value was set as 6 mm) in the correct compaction base position and the filled die inserted onto the cradle and locked to the compression position; then the upper punch was moved downwards at a fixed speed (60 mm/min) for compaction at a load of 500 kg with a flat punch of diameter 6 mm; (2) after compaction, the punch moved upwards, then the lock released and the die cradle was rotated vertically to the detachment position; and (3) by completing the detachment, the die cradle was returned horizontally with the correct die base position for tablet ejection. The force (kg) and displacement (mm) data were measured for all the compaction, detachment and ejection processes in seven replicates for each sample (the total was 28 tablets). The hardness and diameters of the produced tablets were measured by the hardness tester TBH 125 (ERWEKA® D-63150 GmbH, Heusenstamm, Germany, [52]) and the tablet thickness was measured by caliper.
Index of elastic recovery (ER, %), ejection stress (ES, MPa) and tensile fracture stress (TFS, MPa) are the main estimated technological quality-by-design parameters used for assessing performance of tableting processes and tablet quality. These tableting characteristics are sensitive to both, material characteristics (i.e., flowability, particle size distribution, moisture content, particle shape and fabrics, porosity, crystallinity, surface area and charge) and compaction process attributes (i.e., the initial load and punch speed settings [42,55,57]). ER value is used to measure the material elasticity, which is the ability to reduce its volume (i.e., measuring the ability of the powder to return to its original volume when a compression load is removed). On ER profiles (displacement in m versus compression force in N), ER% values were calculated by using the following equation:
ER% = 100(hbha)/hb
where hb is the in-die tablet thickness under compression (mm), which was calculated as the difference value between the die base plate position (= 28.348 mm) and the deepest punch position within the die (i.e., at the displacement corresponding to the point b), and ha is the decompression tablet thickness after elastic relaxation (i.e., at the displacement corresponding to the point a, when the compression force becomes 0). The compression energy (N.m) values were calculated as the area under curve (AUC) approach using trapezoidal rule by taking into account the force and displacement data below the deepest punch position (Figure 1a).
The ES value is used to assess the powder manufacturability (i.e., tabletability), which expresses the friction between the material and the equipment; hence it is strongly correlated with manufacturing problems (i.e., tablet failures such as capping and lamination or powder sticking to punch surfaces or die wall). On the ES profiles (displacement in mm versus ejection force in N), ES values were estimated by applying the following equation:
ES (MPa) = Fmax/(π × d × hb)
where Fmax is the maximum ejection force (N), d is the die diameter (=6 mm), and hb is the compression tablet thickness under maximum pressure (mm). The detachment stress values were calculated on its profile (displacement in mm versus detachment force in N) by the following equation:
ES (MPa) = Fmax/A
where Fmax is the maximum detachment force (N), A is the area of contact circle (= 9 π mm2). Both of the ejection and detachment energies (N.m) were also calculated by applying the AUC approach (Figure 1b,c). TFS value is used to assess the powder compactability, which is the ability to form interparticular bonds, and it is determined by using the following equation:
TFS (MPa) = 2H/(π × D × T)
where H is the tablet hardness (in N), D is the tablet diameter (in mm), and T is the out-of-die tablet thickness (in mm).

3. Results and Discussion

3.1. Powder Characteristics

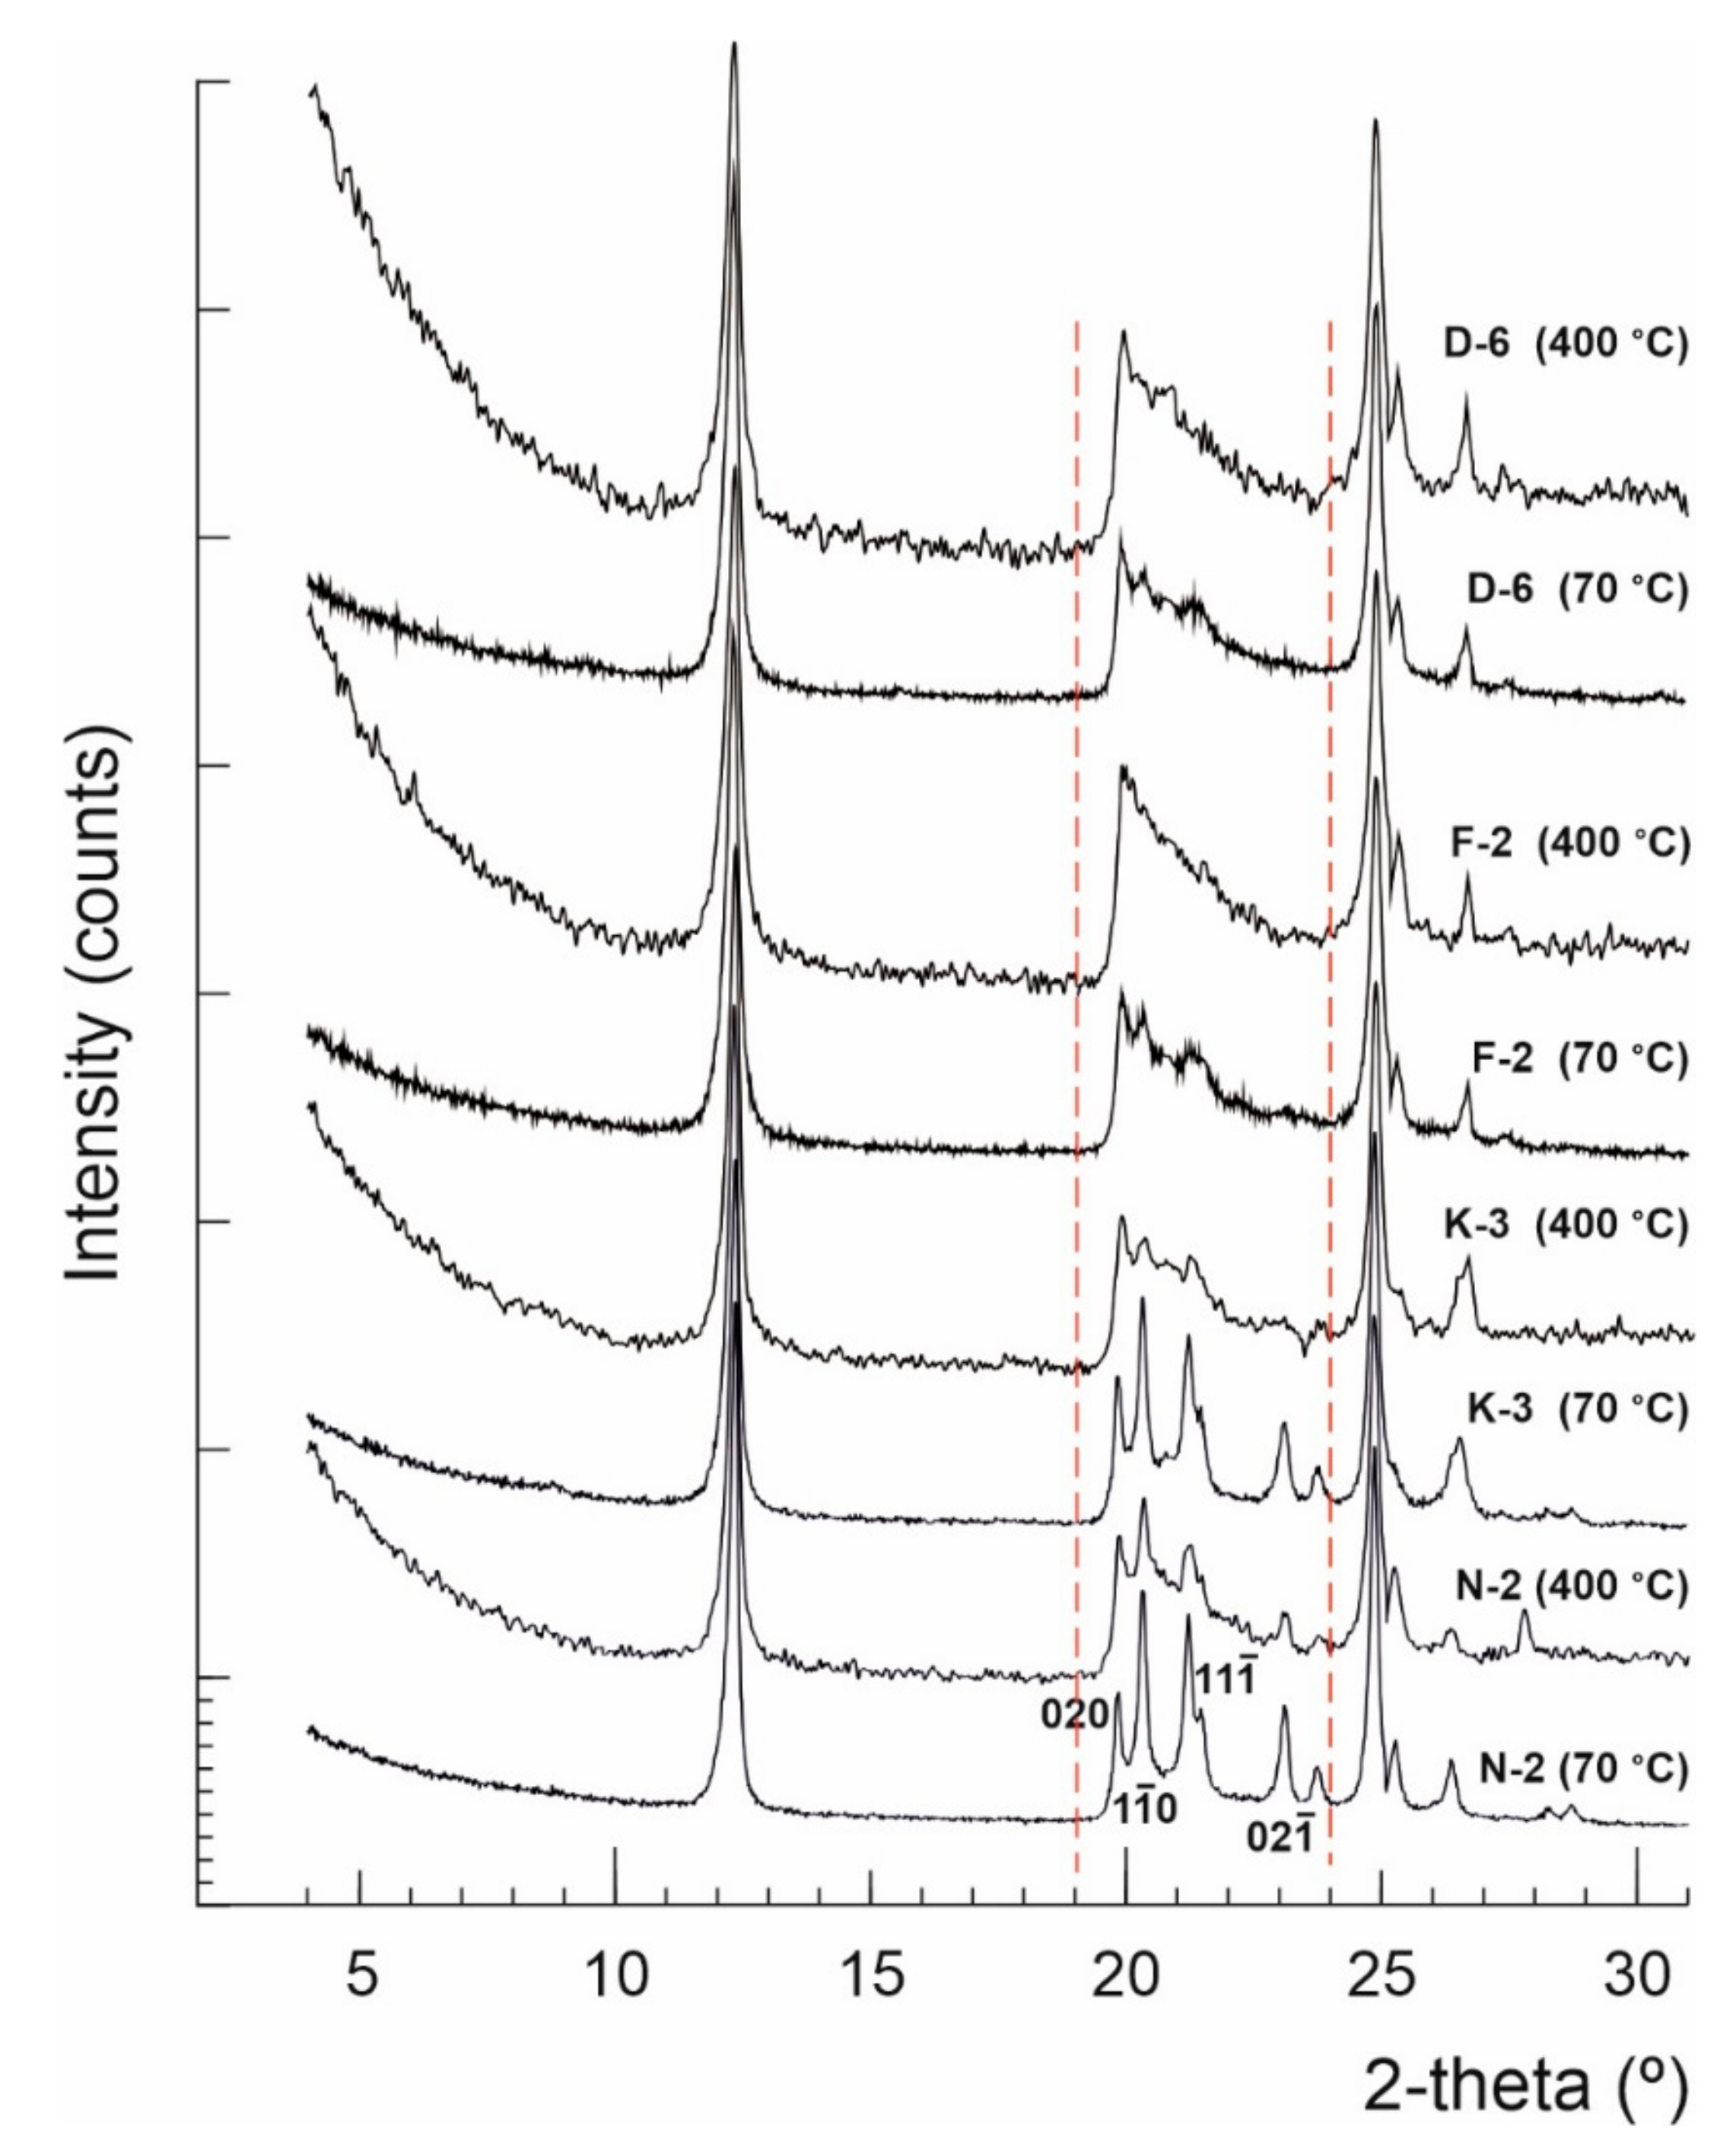
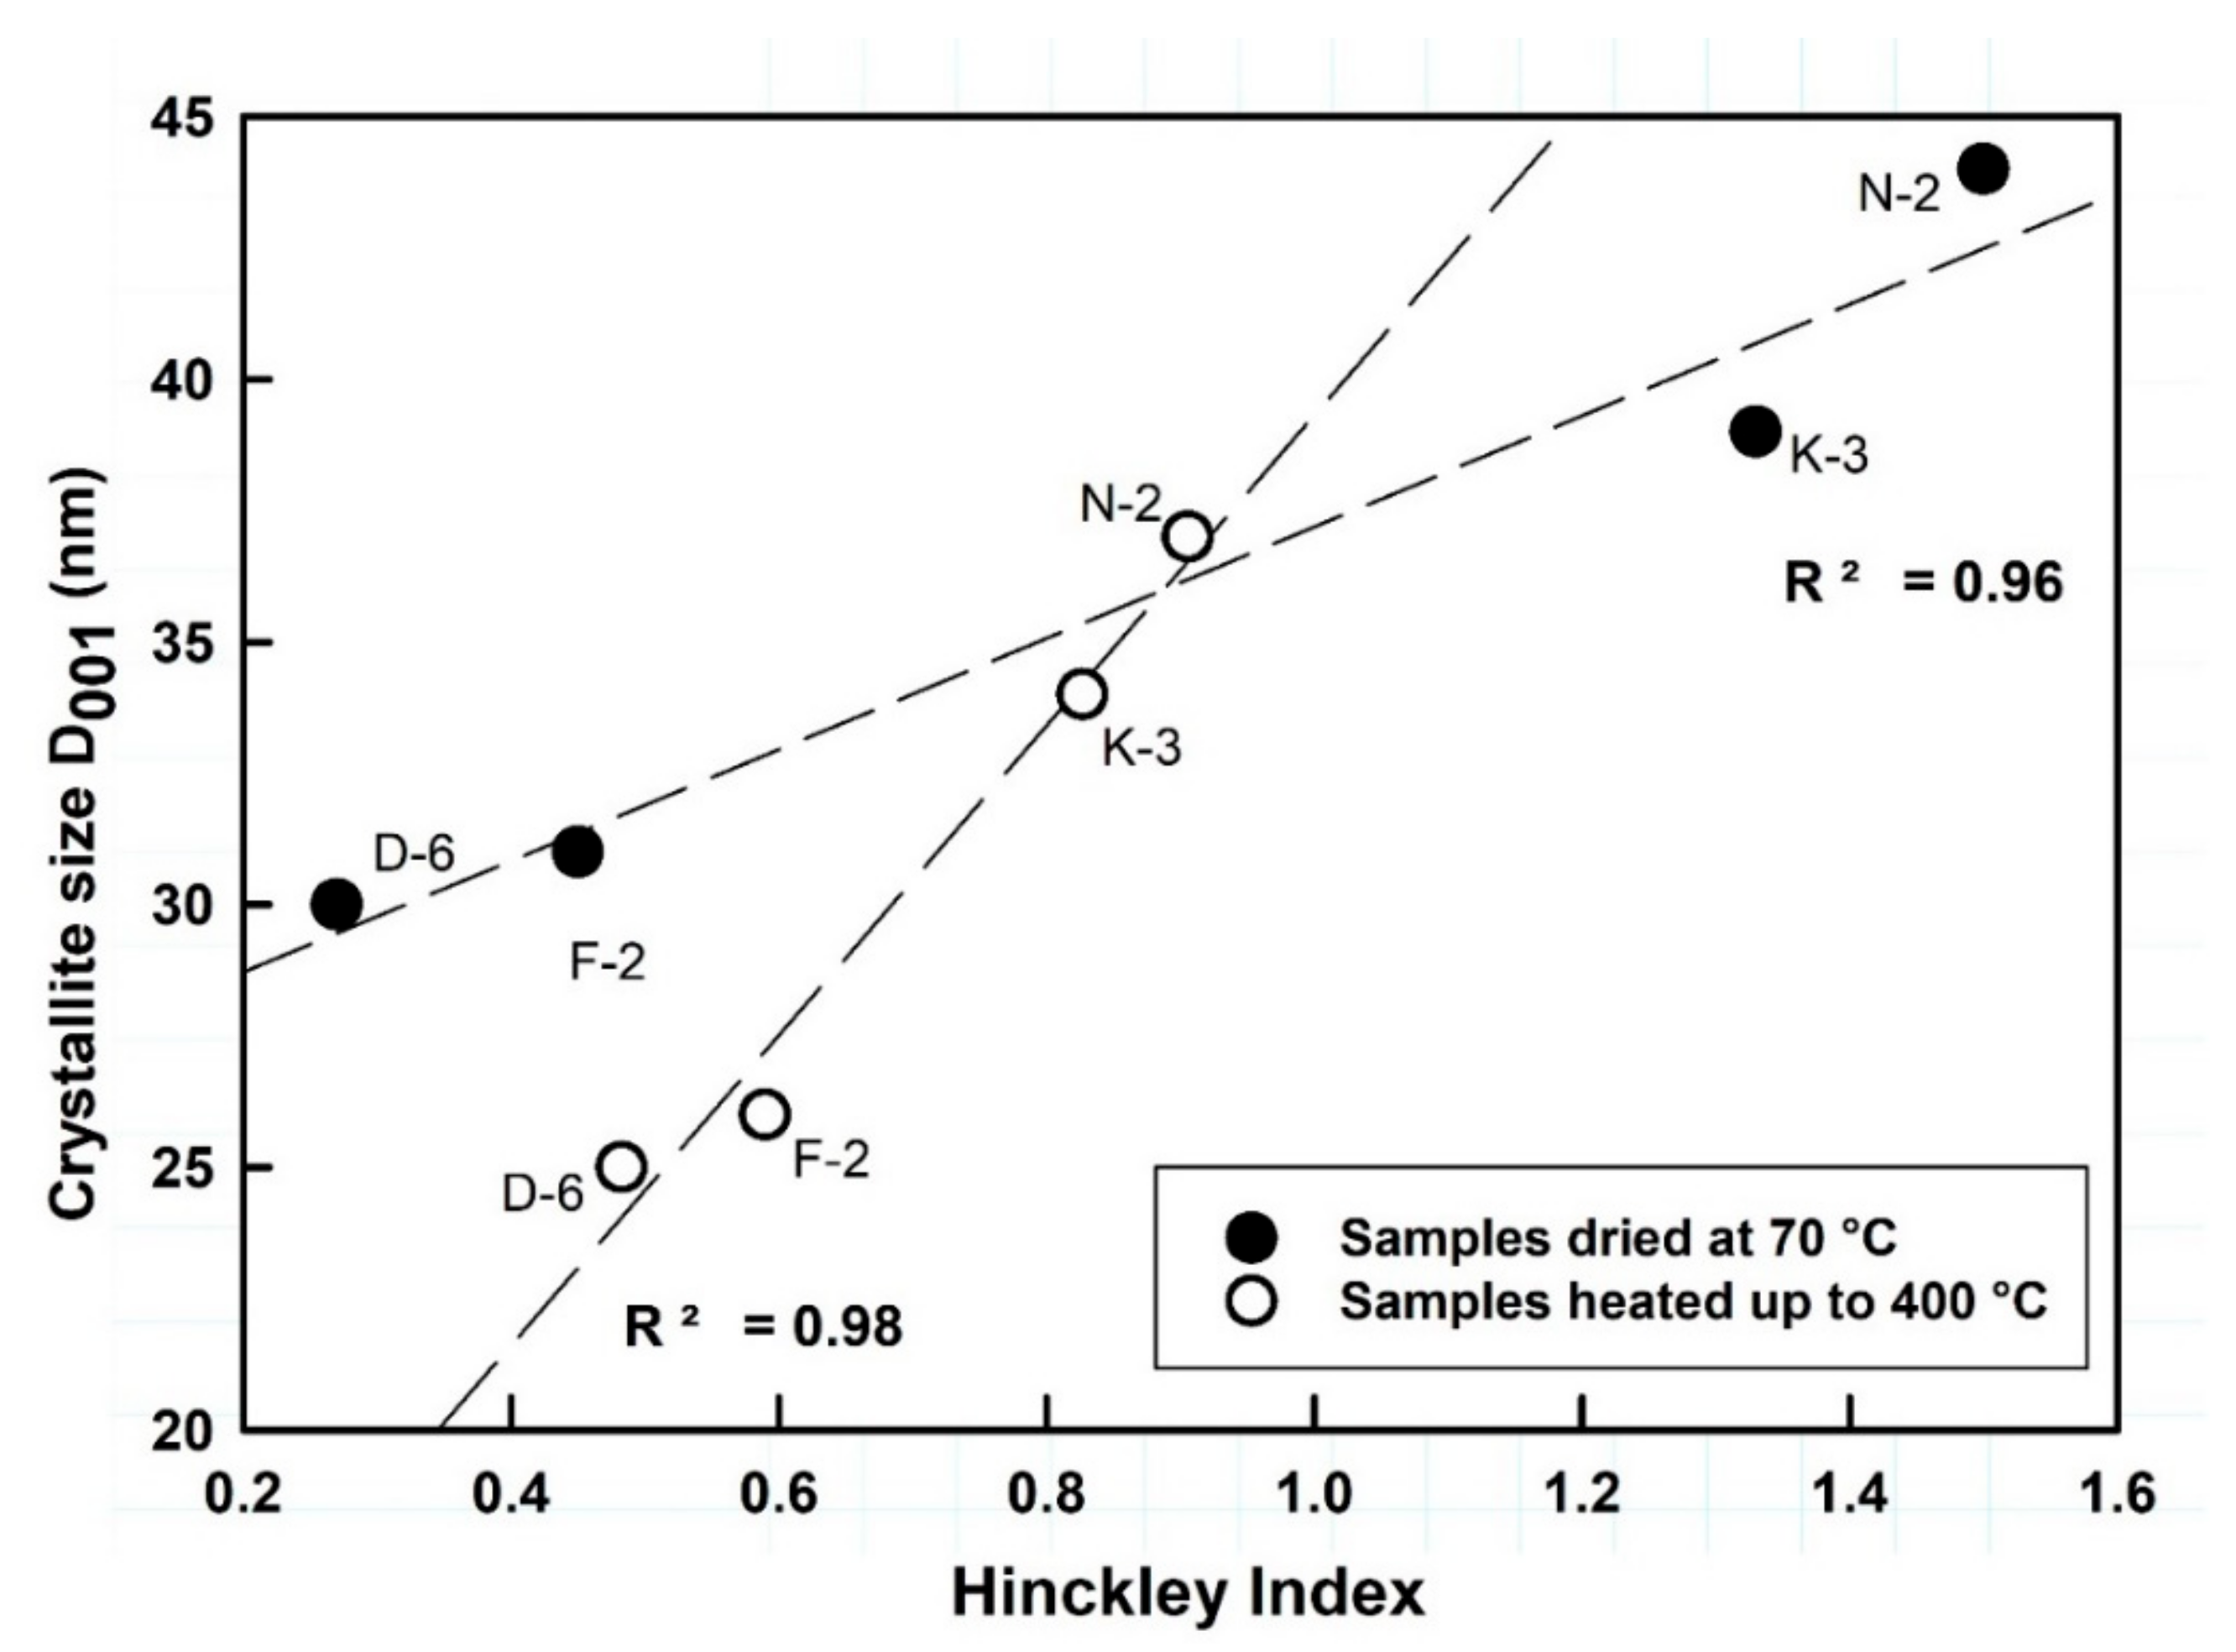
3.1.1. Compostion and Microstructure

Samples N-2, K-3, F-2 and D-6 were highly pure, with kaolinite contents of 99%, 95%, 98% and 98%, respectively. The Al2O3/SiO2 ratios of the bulk kaolin samples were found very close to the stoichiometric ratio (0.85) of the theoretical kaolinite, except in sample K-3 which was slightly influenced by the illite content [38]. Mineral impurities, especially the quartz contents, were detected as traces, which comply with the safety limits of human toxicological specifications (Figure 2 and Table 1, [58]). The samples were also analyzed by using Coupled Plasma Optical Emission Spectrometry (ICP-OES) and Instrumental Neutron Activation Analysis (INAA) and showed no contents of the toxic Class 1 (As, Cd, Hg and Pb) elemental impurities, while their contents from Class 2A (Co, Ni and V) and Class 3 (Cu and Cr) metals were very low and lay within the safe limits of the oral Permitted Daily Exposure (PDE), according to the European Medicines Agency [59]. The studied purified kaolin samples meet the international pharmacopeial specifications for the pharmaceutical kaolin grade.
Normally kaolinite Al2Si2O5(OH)4 is thermally stable up to ~450 °C, considered as the starting point of dehydroxylation, and then it can be transformed to metakaolinite (Al2Si2O7) at 650 °C, which is variable based on kaolinite order-disorder degrees [60]. No significant phase transformations occurred in the studied kaolin samples after thermal treatment by heating up to 400 °C, but only some deformations observed to the widths, lengths and backgrounds of the kaolinite XRD reflections within the range 19–24° 2θ, which imply microstructural thermal changes (Figure 2). The calculated HI values of samples N-2, K-3, F-2 and D-6, dried at 70 °C, were 1.50, 1.33, 0.45 and 0.27, respectively, changing to 0.91, 0.83, 0.59 and 0.48 when heated up to 400 °C, respectively. The average crystallite sizes (D001) slightly changed from 44, 39, 31 and 30 nm, respectively, to 37, 34, 26 and 25 nm, respectively (Figure 3 and Table 2). Both, the crystallite size and order-disorder degrees of kaolinite, are two strongly correlated microstructural characteristics (Figure 3) and sensitive to the thermal effect. The thermal treatment at 400 °C probably causes deformation and/or exfoliation of the stacked kaolinite platelets, as it is observed by the lowering of HI “crystallinity” in the typically well-crystallized and high ordered kaolinite samples (HI > 1) accompanied with a decrease of their crystallite size, while it slightly improved their order degree [61] along the c-axis in the disordered ones (HI < 1).

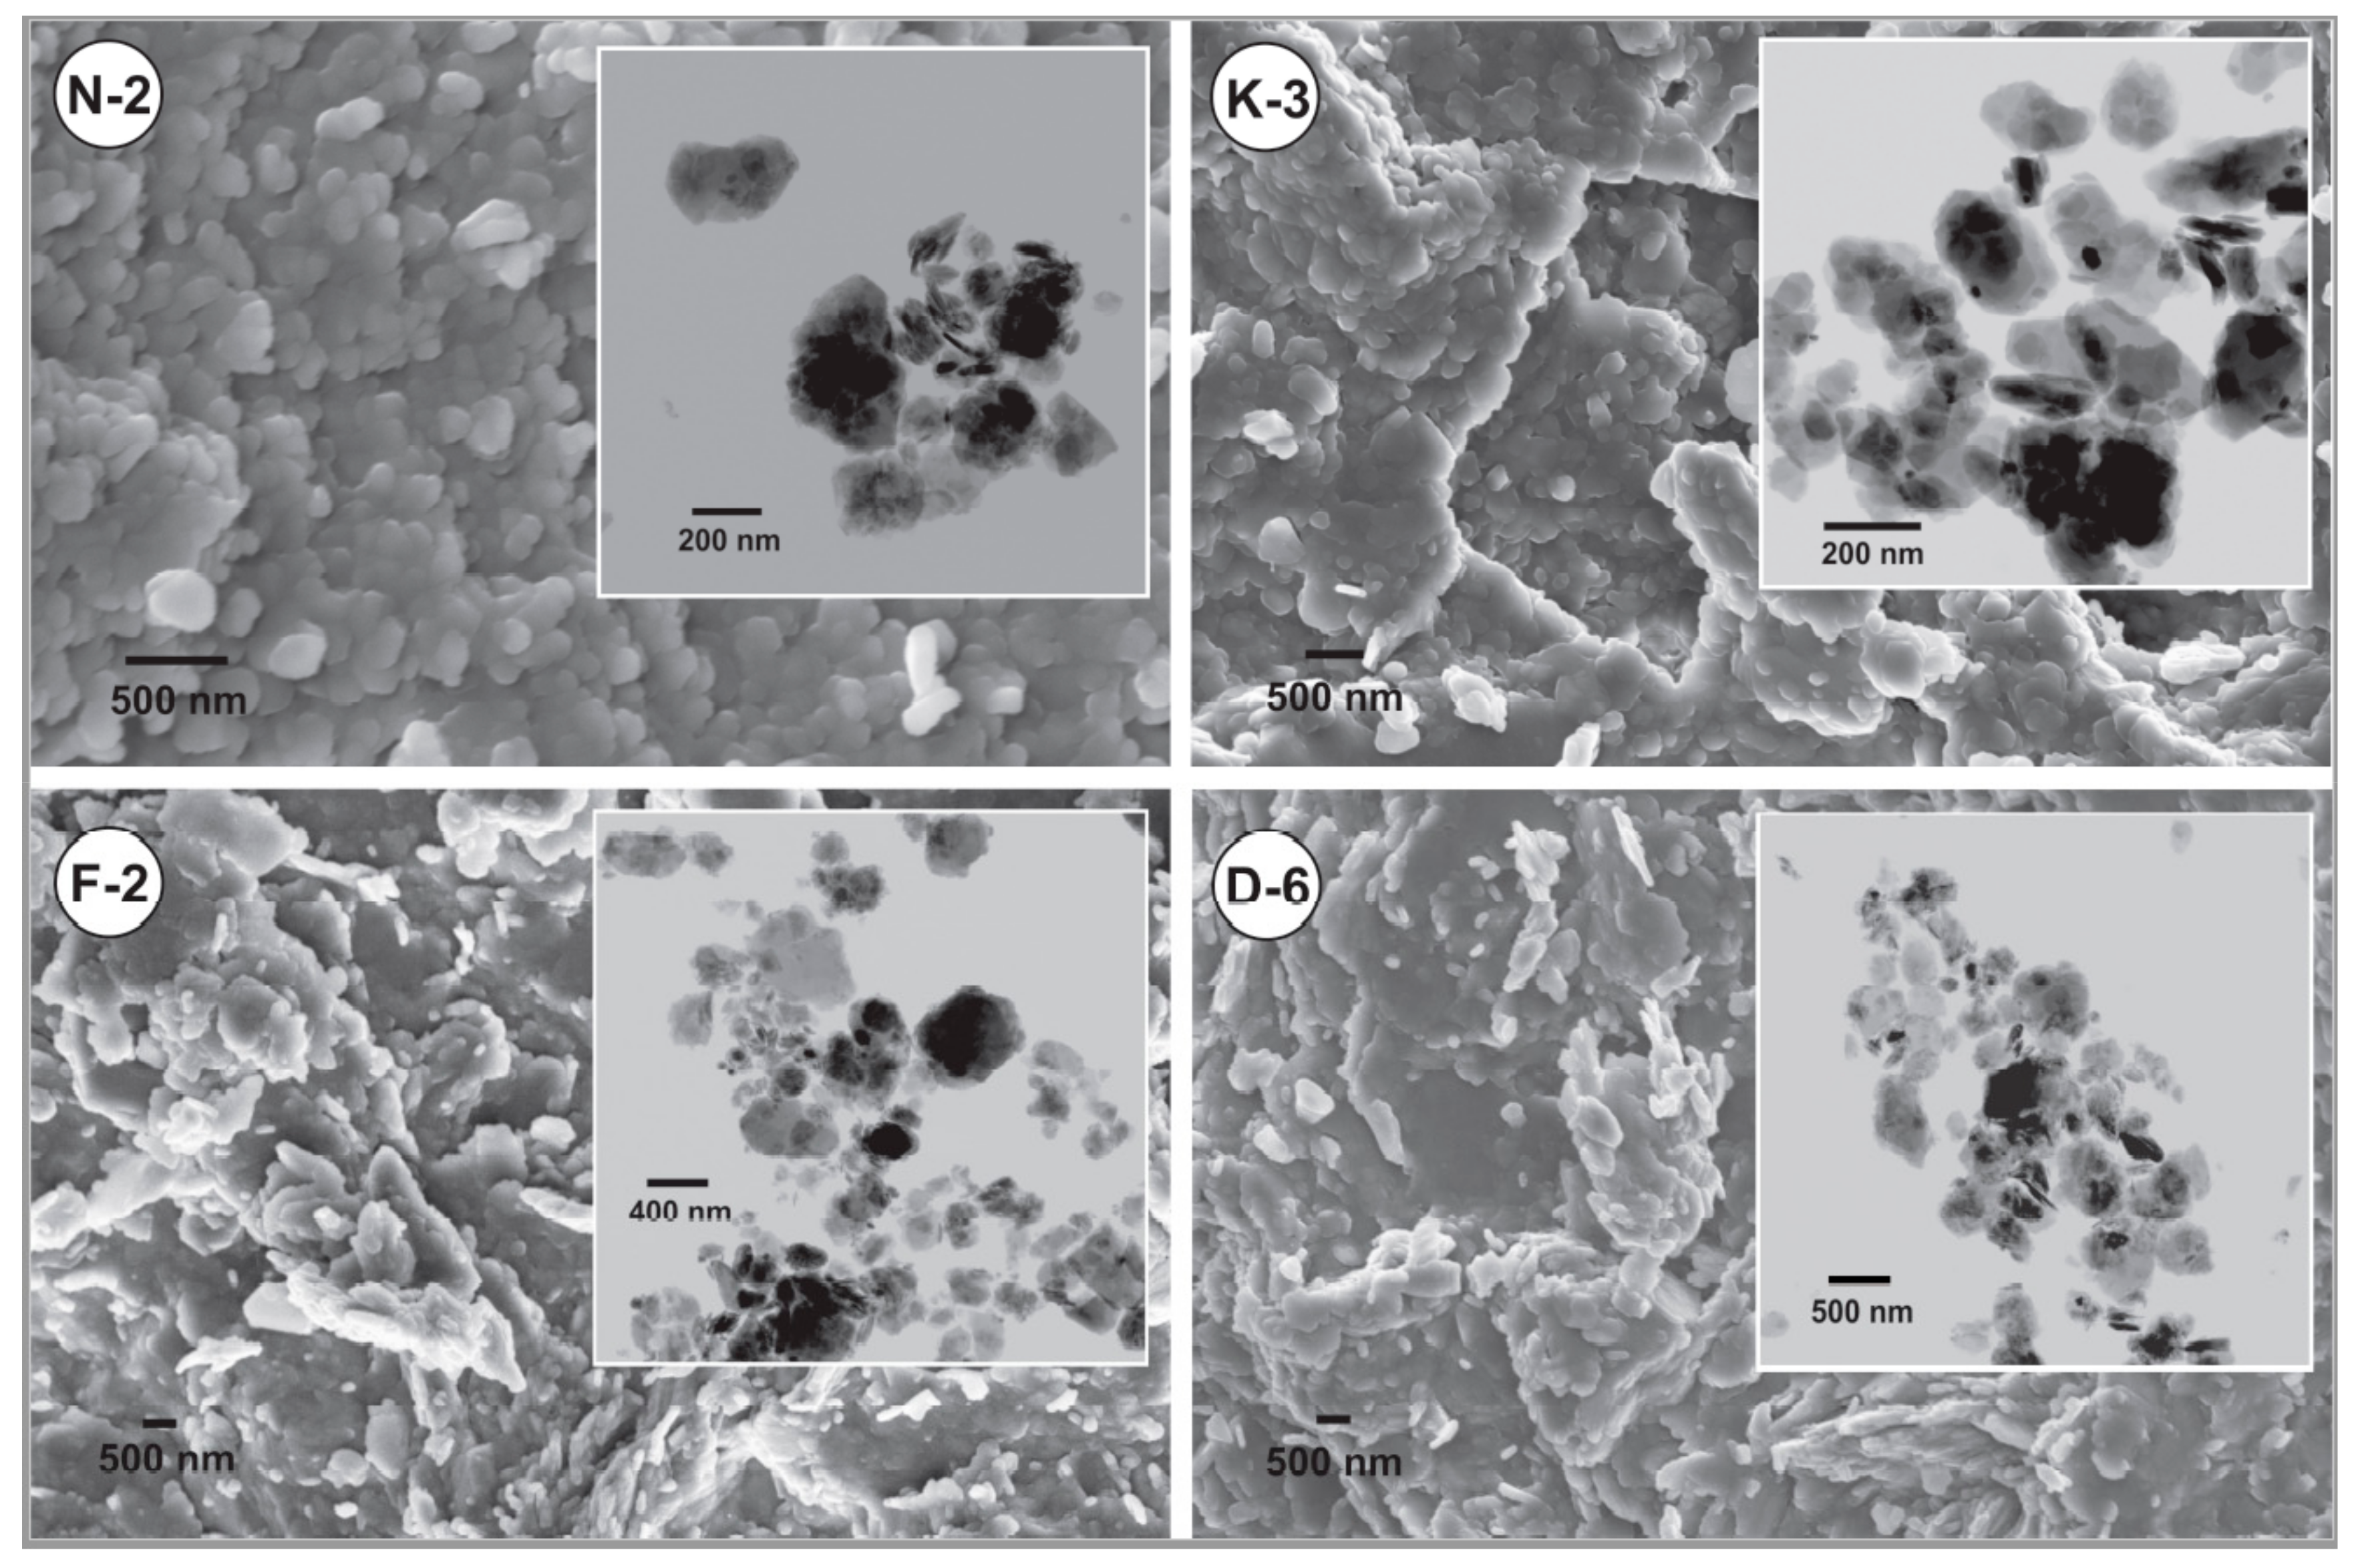
3.1.2. Microtexture and Micromorphology

SEM images indicated that the apparent sizes of kaolinite platy particles are mainly <4 μm for all the studied kaolin powder samples. Clearly, the powder microtexture is appeared as loosely packing of coarser aggregates in a planar alignment surrounded by the finer individual particles (Figure 4). TEM images (upper right views of Figure 4) showed that the studied kaolinite platelets exhibited equant to sub-elongate shape with little pseudohexagonal form, smooth surfaces, rounded anhedral to subhedral edges, and contacted mainly by face-to-face. The individual platelets in all samples mainly showed sizes <700 nm. The particle shape and packing manner influences the flow and compression behaviors. In the regularly shaped particles, the smaller ones attend to rearrange more easily by tapping or under compaction pressure by moving into the interparticle voids to be more tightly packed and producing final volume reduction [62].

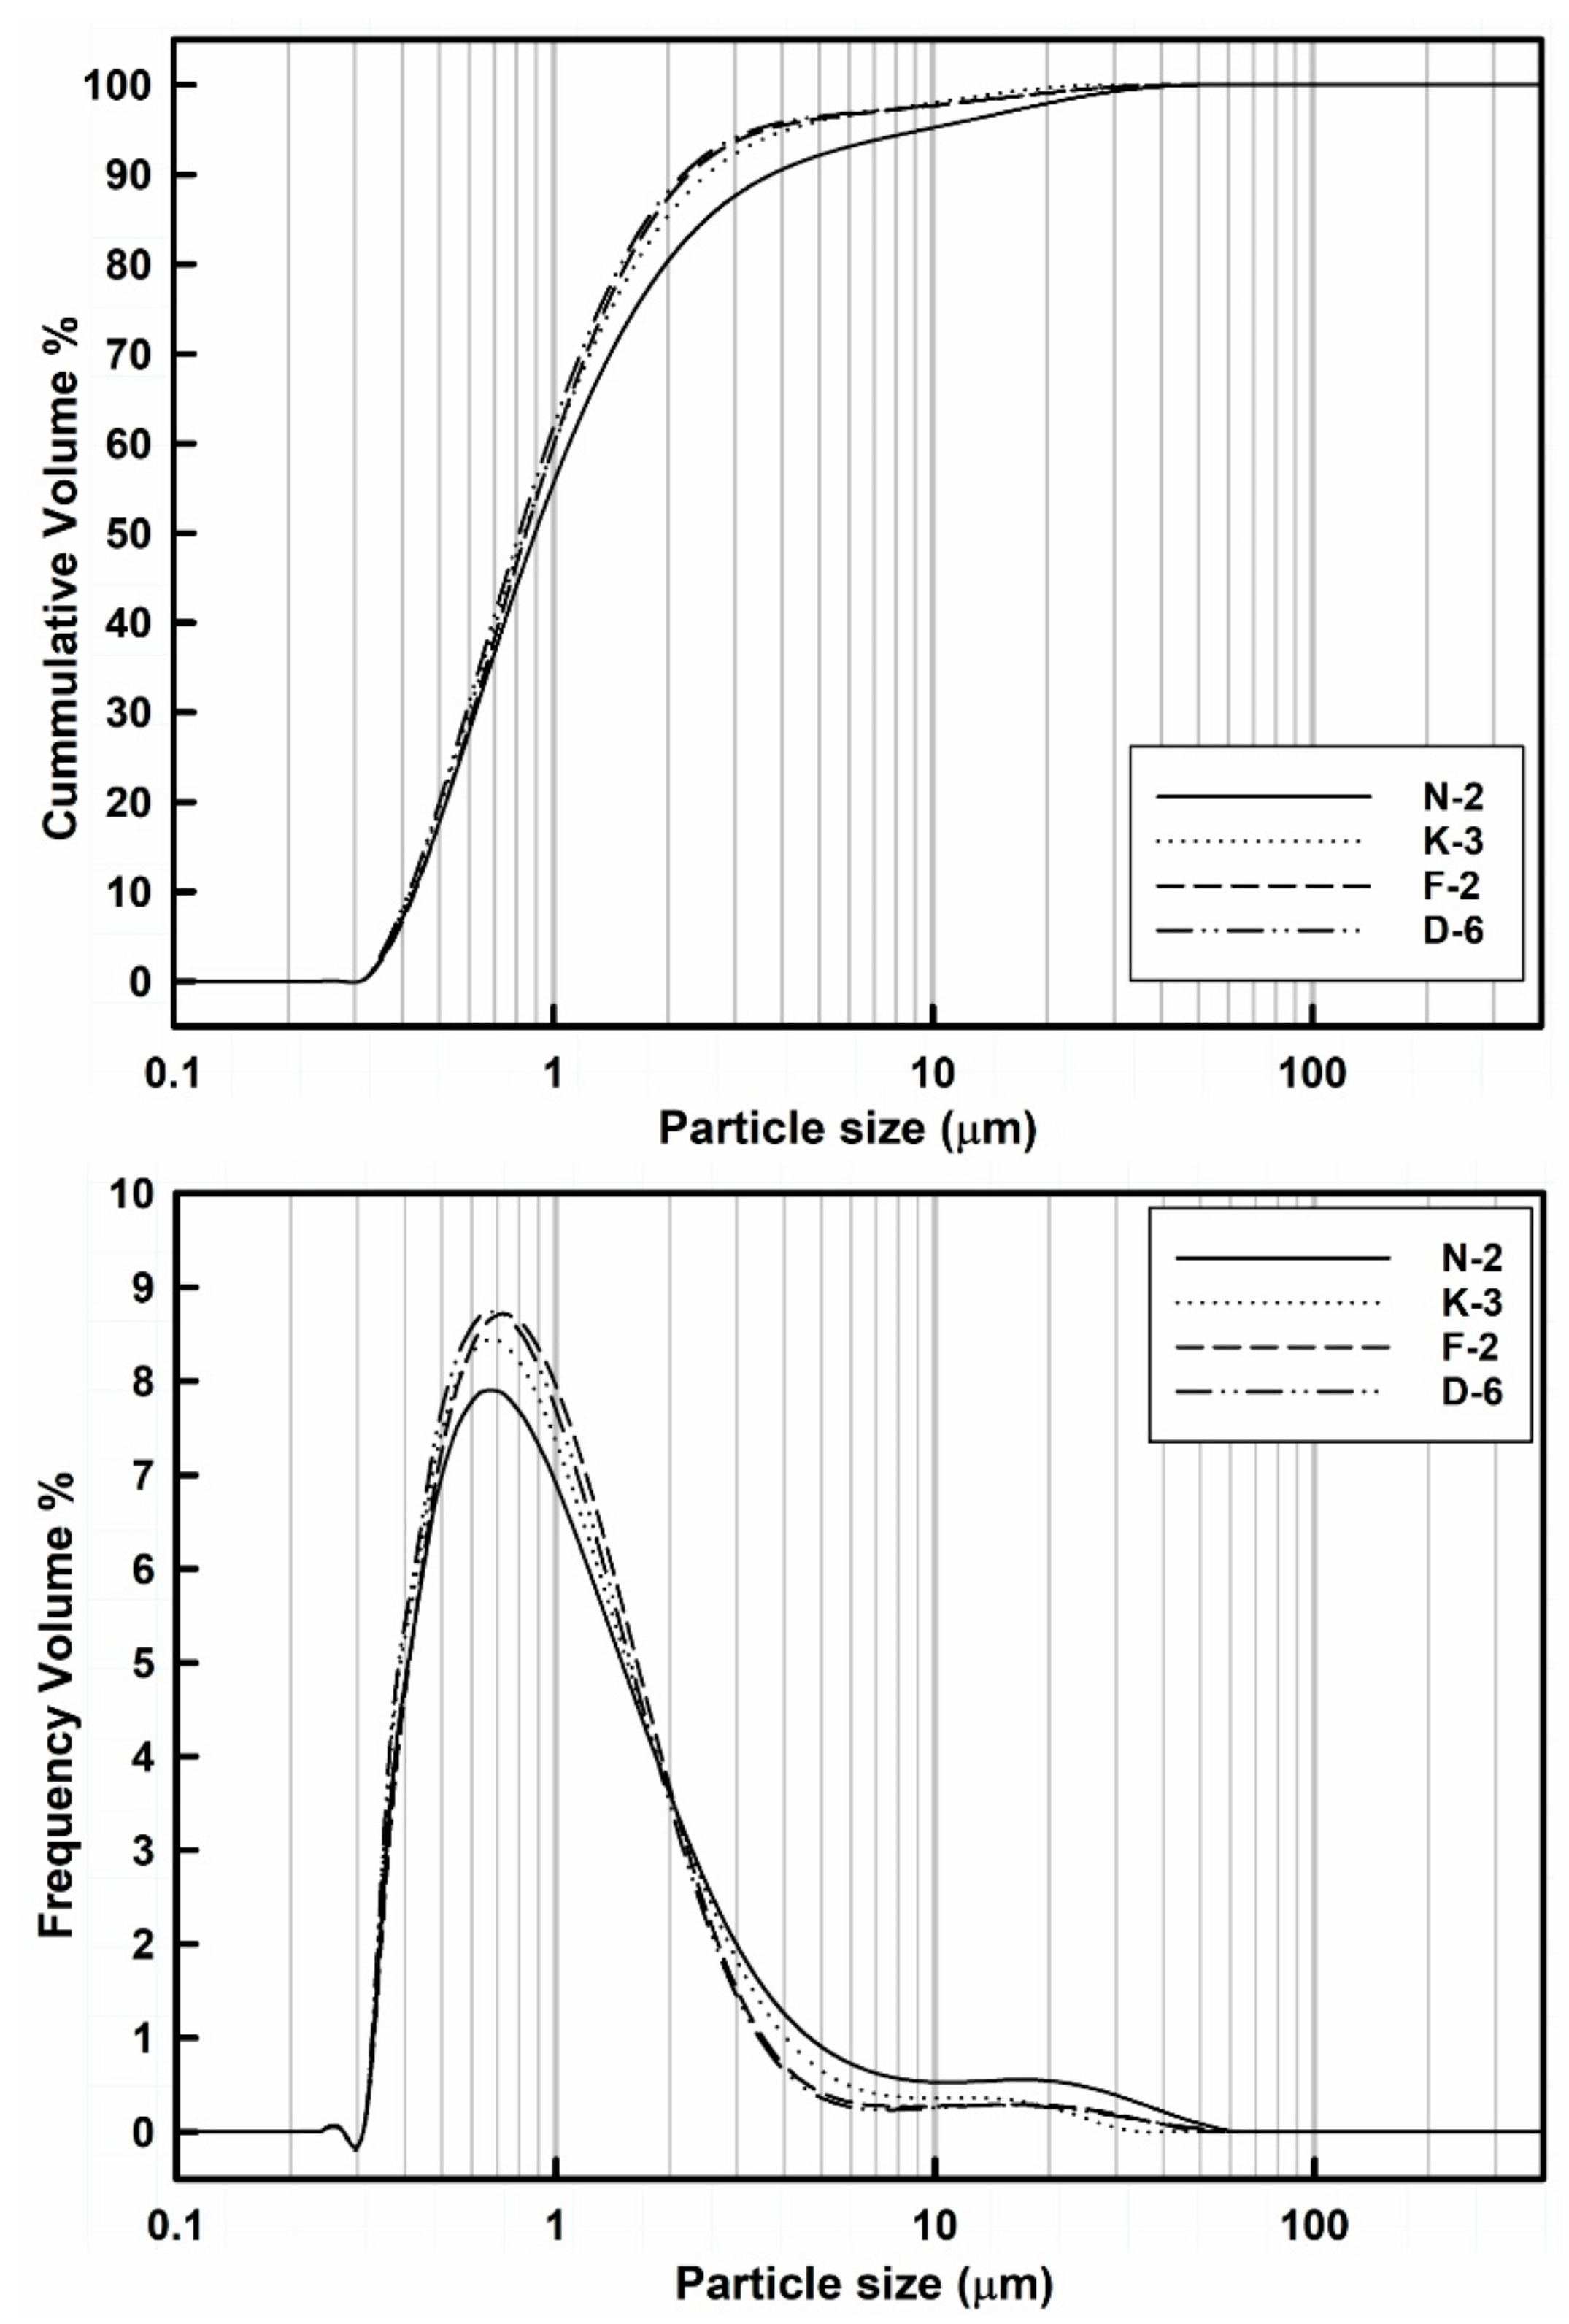
3.1.3. Particle Size Distribution

Table 3 and Figure 5 show the particle size distribution (PSD) and grading characteristics (i.e., the geometric properties of the particle size grading curves) of the analyzed original kaolin powder samples. The particle size uniformity were determined on the basis of the particle size values D10, D50 and D90 and calculated by means of the span = (D90D10)/D50, which is the breadth of PSD unimodal curve (i.e., the narrower the distribution, the smaller the span value), frequently used in quantification and comparison of PSD homogeneity of pharmaceutical powders [63].
The laser granulometric data showed that all samples were dominated by the finer nanosized particle fractions from 10 nm to 1 μm (ranging from 55.22% to 62.24%) followed by the microsized particle fractions 1–10 μm (ranging from 35.9% to 40.33%) and then the coarser size fractions of particle aggregates >10 μm which up to ~40 μm (ranging from 1.78% to 4.45%).
Clearly, the median particle size (D50) values of all the measured powder samples are ranging from 0.81 to 0.87 µm, while 90% of their whole particle sizes (D90) are <4 µm (Table 3). In general, all the powder samples showed similar distributions and median particle sizes (D50), complying with those of pharmaceutical grade kaolin [64]. Samples with the higher disordered kaolinite exhibited the highest contents of the finer particle size fractions: D-6 (lowest HI values) contains 62.24% of the finest particle size fraction (<1 µm) which decreased towards sample N-2 (highest HI values) that exhibited 55.22% of this fraction (Table 3).
In addition to the particle shape, the size is the other most important factor for powder flowability and tableting performance. Generally, the larger particles exhibit the higher mass and hence yield the better flow due to the effect of their higher gravitational force. Kaolinite exhibits higher particle density (true density is 2.65 g/cm3 [65]) when compared with those of the other common excipient materials like maize starch (true density is 1.10 g/cm3 [66]) and microcrystalline cellulose (true density is 1.42–1.66 g/cm3 [67]). Hence, the kaolin powder flow especially increases as the homogeneity of PDS increases, either by the relative reduction of the coarser aggregate fractions, or by cohesiveness of the ultrafine particles (<1 μm), producing uniform sized agglomerates in order to optimize the PSD as indicated by lower span values. Nevertheless, the over-reduction of size increases the inter-particle cohesiveness, the segregation of particles decreases and the flow diminishes [68]. Therefore, the narrower size distribution yields the better flow performance, while the wider size distribution could lead to reduced powder flow and influence the content uniformity during tablet manufacturing. At the same compaction pressure, smaller particles formed tablets of greater tensile strength [69,70,71].
In the studied samples, the homogeneity of particle size distributions was raised (i.e., indicated by reduction of the span values) with increasing of the finer size fractions (<1 μm): sample N-2 showed the lowest content (55.22%) of the finer fraction and the wider size distribution (the span vale is 3.74), while sample D-6 exhibited the narrower size distribution (the span value is 2.14) and the highest content (62.24%) of the finer size fraction (Table 3). The coarser kaolinite agglomerates (>4 μm) can be disaggregated into smaller individual kaolinite platelets under controlled dry grinding and sieving processes to obtain optimum homogeneous fine particle size fractions with smaller span values. Nevertheless, these fine size fractions are frequently accompanied with lesser amounts of agglomerated particles which can be gently disaggregated into smaller particles by the effect of interparticle sliding frictions and vibrational collisions during the powder flow or recovered by milling processes.

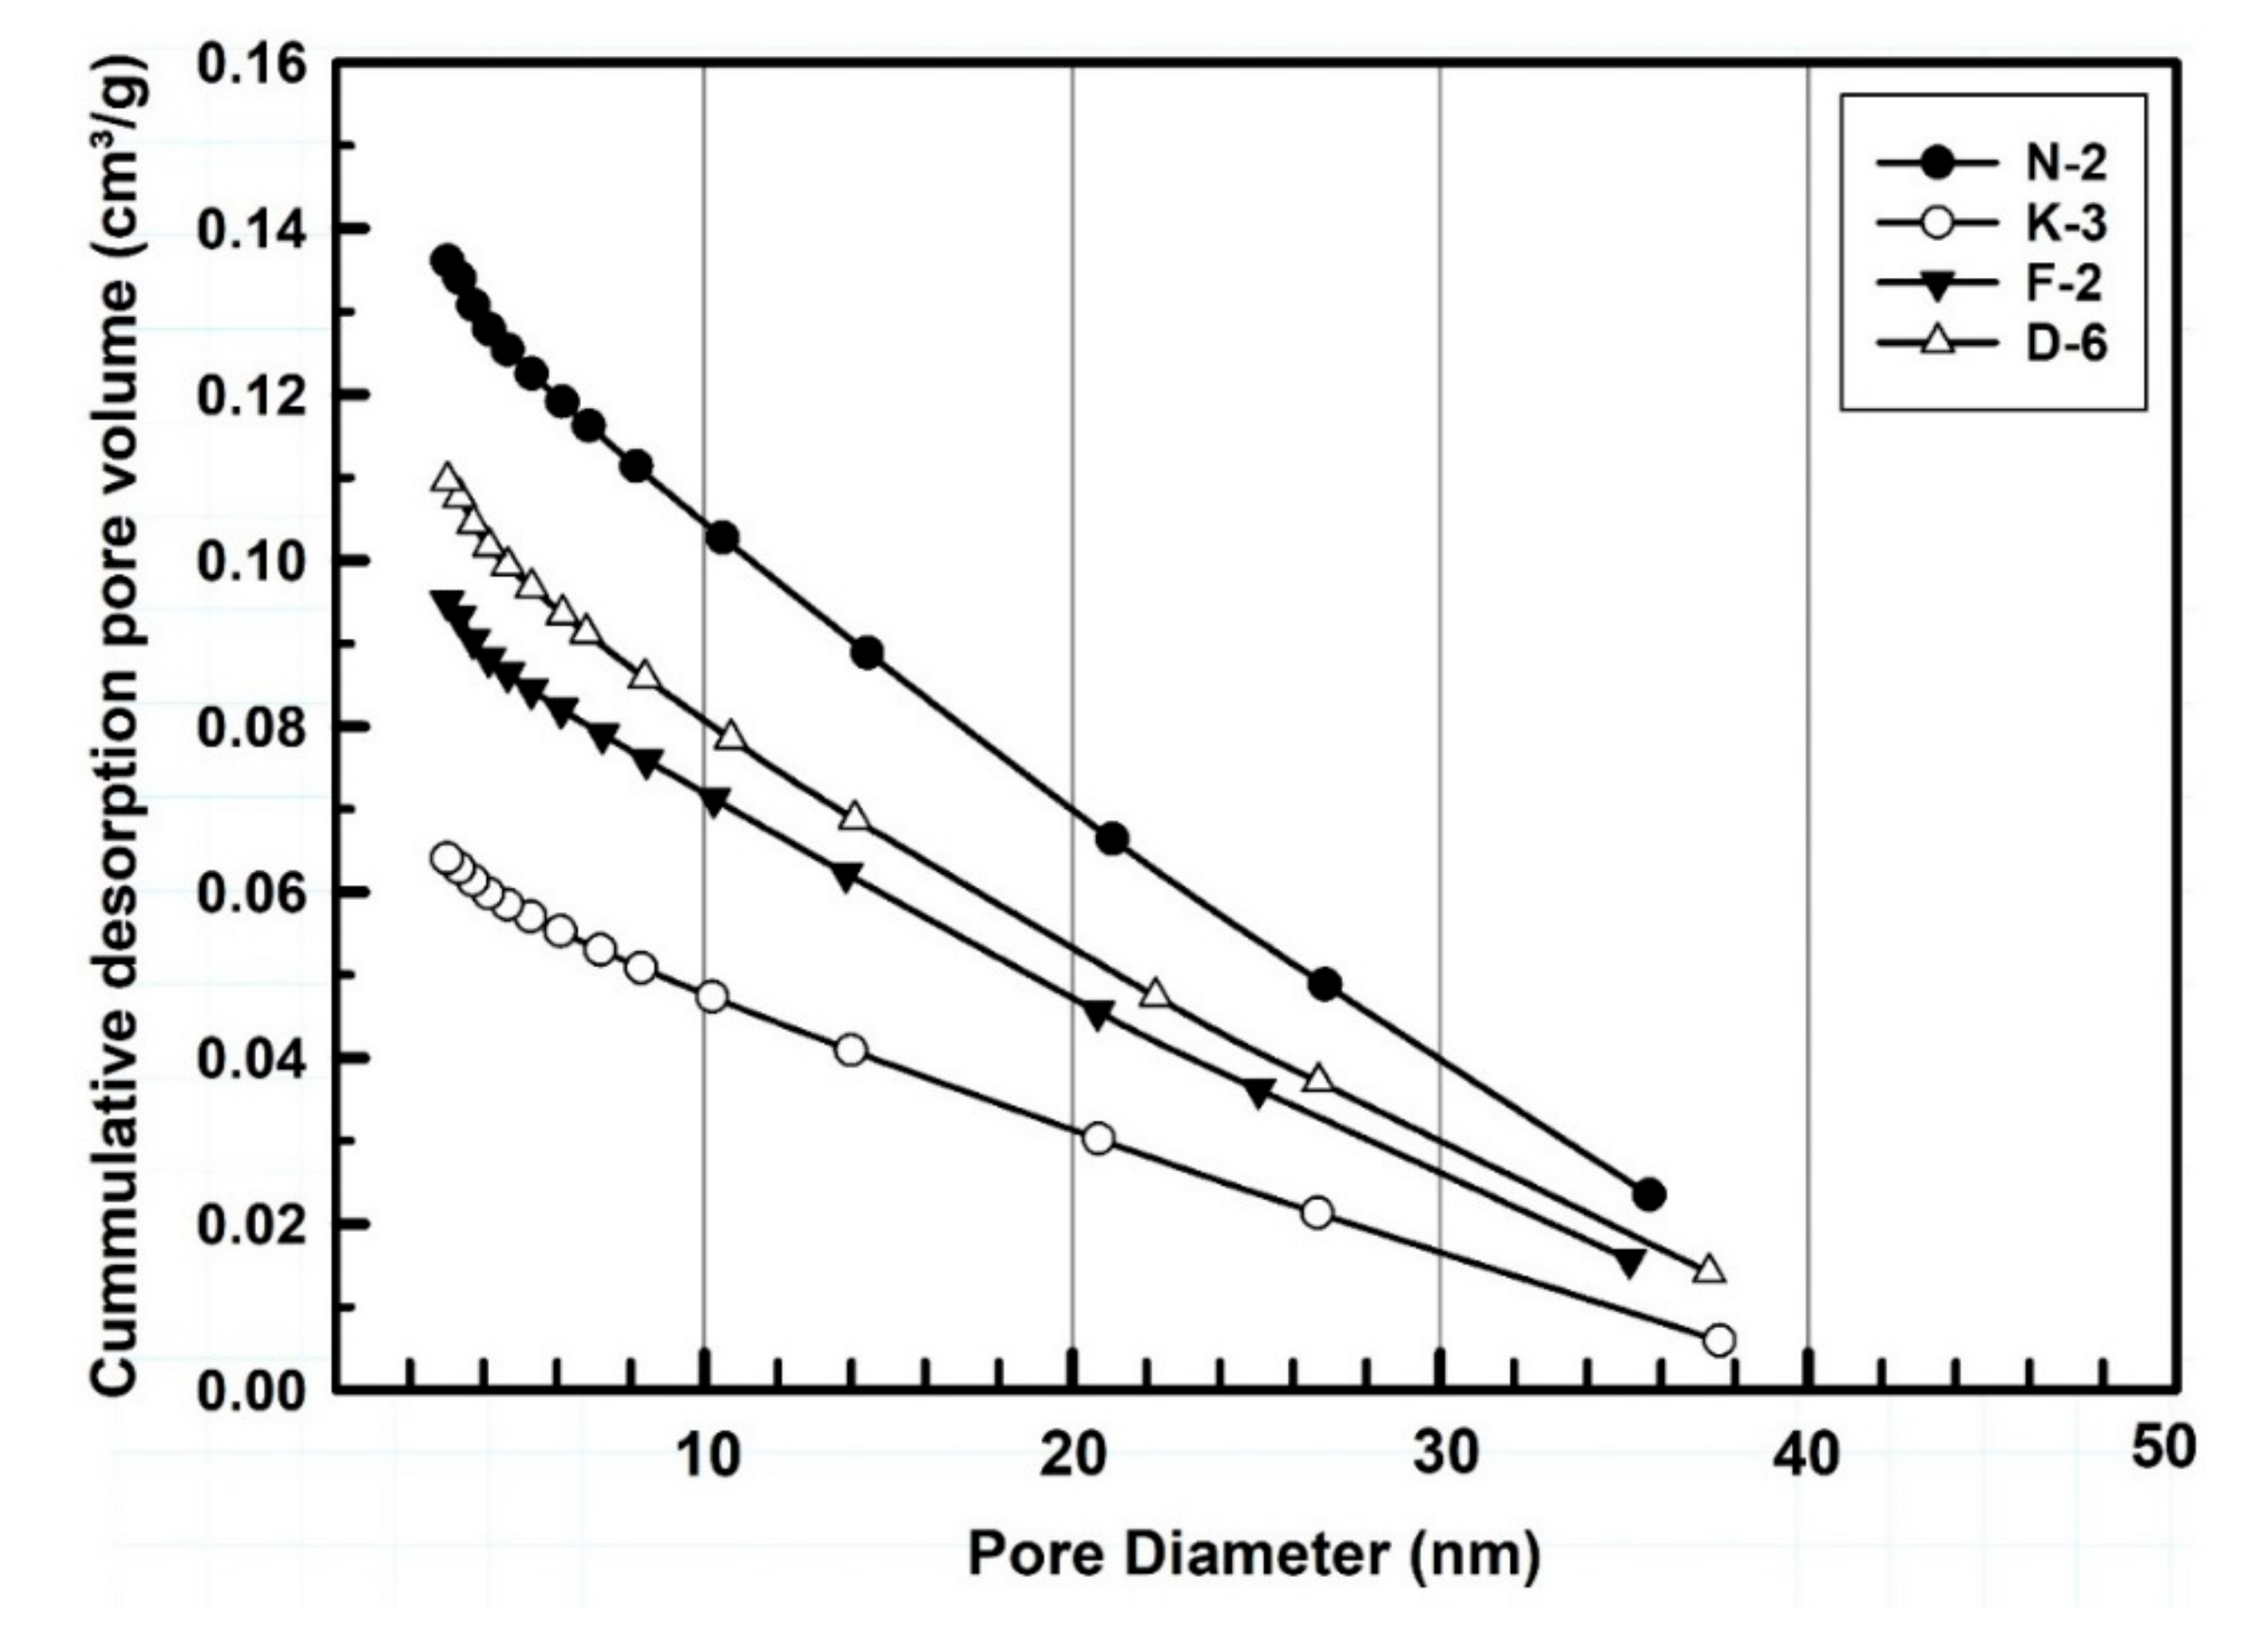
3.1.4. Porosity and Pore Size Distribution

Table 3 and Figure 6 are showing the pore size distribution, porosity gradients and the cumulative pore volume (cm3/g) of the measured kaolin powder samples. According to the IUPAC nomenclature [72], the BJH porosity data indicated that the studied powders exhibited mesoporous character as they containing pores with diameters ranged between 2 and 38 nm. Sample N-2 showed the largest total pore volume (0.136 cm3/g) and greater pore gradient followed. Powder porosity is normally controlled by the variability of particle size ranges, particle morphology and the manner of their packing structure. In the studied samples, dominated by finer size fractions (90% of all particles are <4 μm) distributed in the interstices between the coarsest particles, BJH values are small. Porosity, porosity gradient and pore size distribution represent some of the variables that most influence the tablet strength. The tensile strength decreases exponentially with increasing porosity for all size fractions [70,73,74].

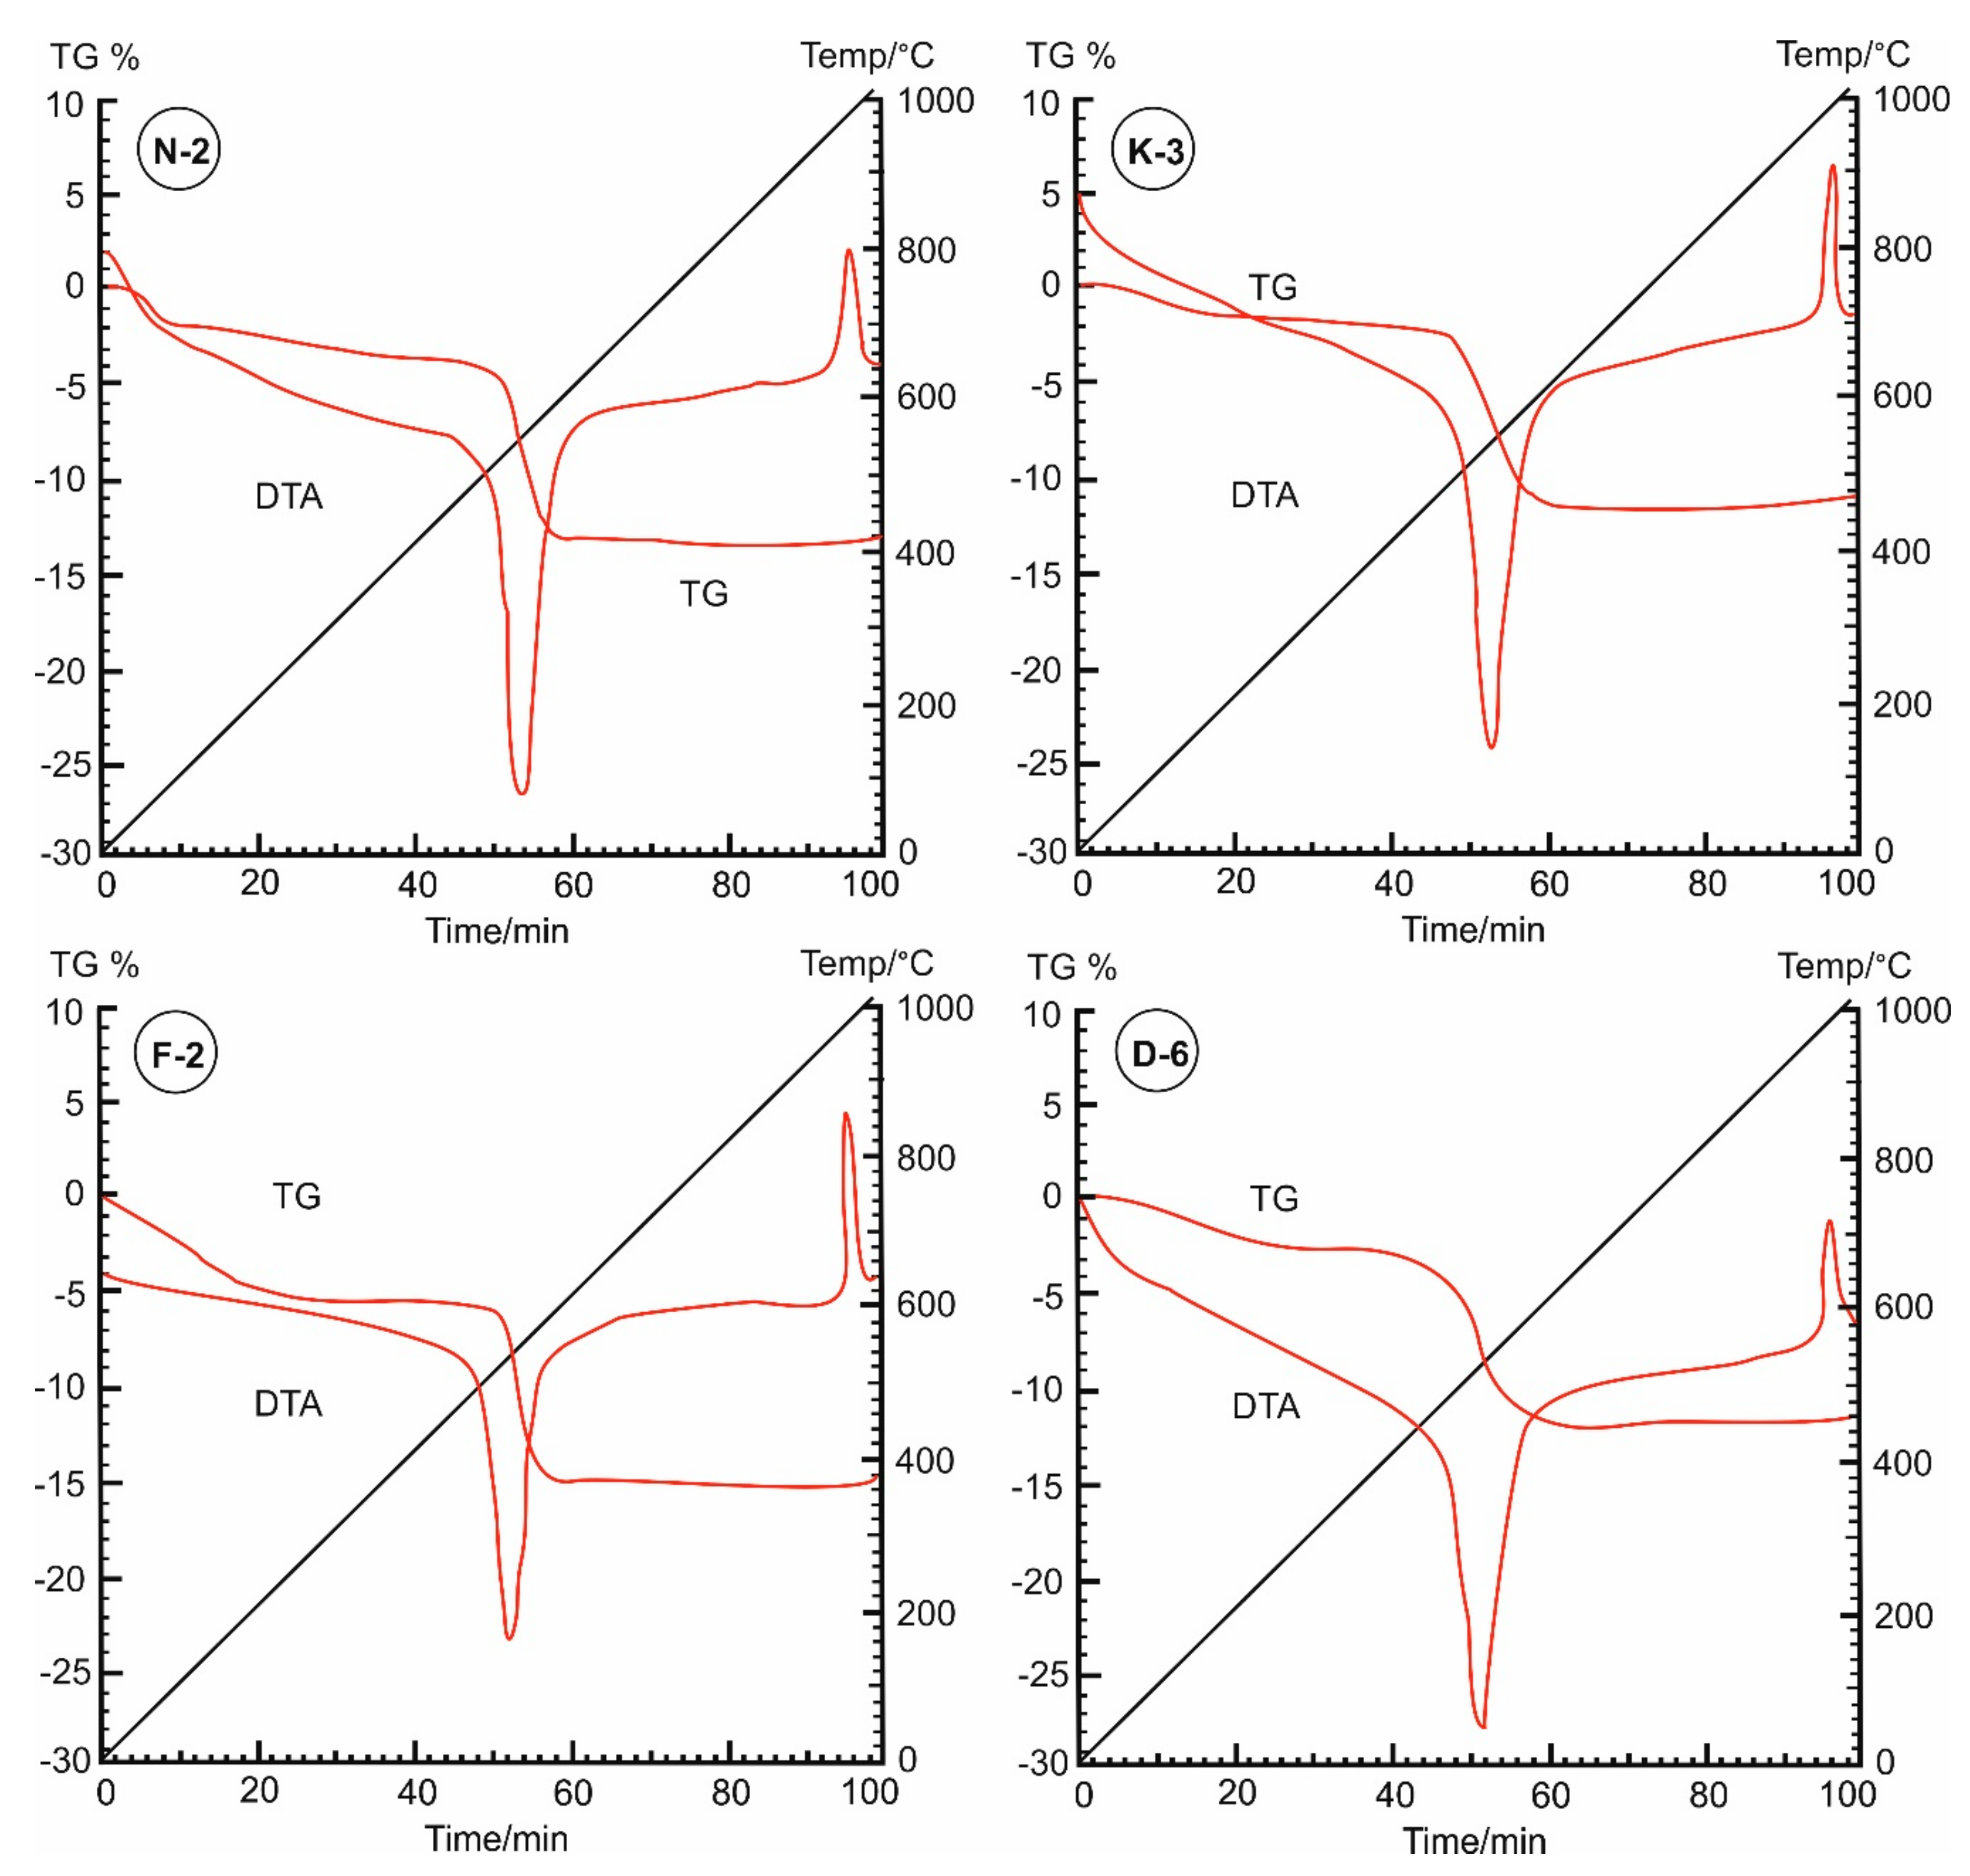
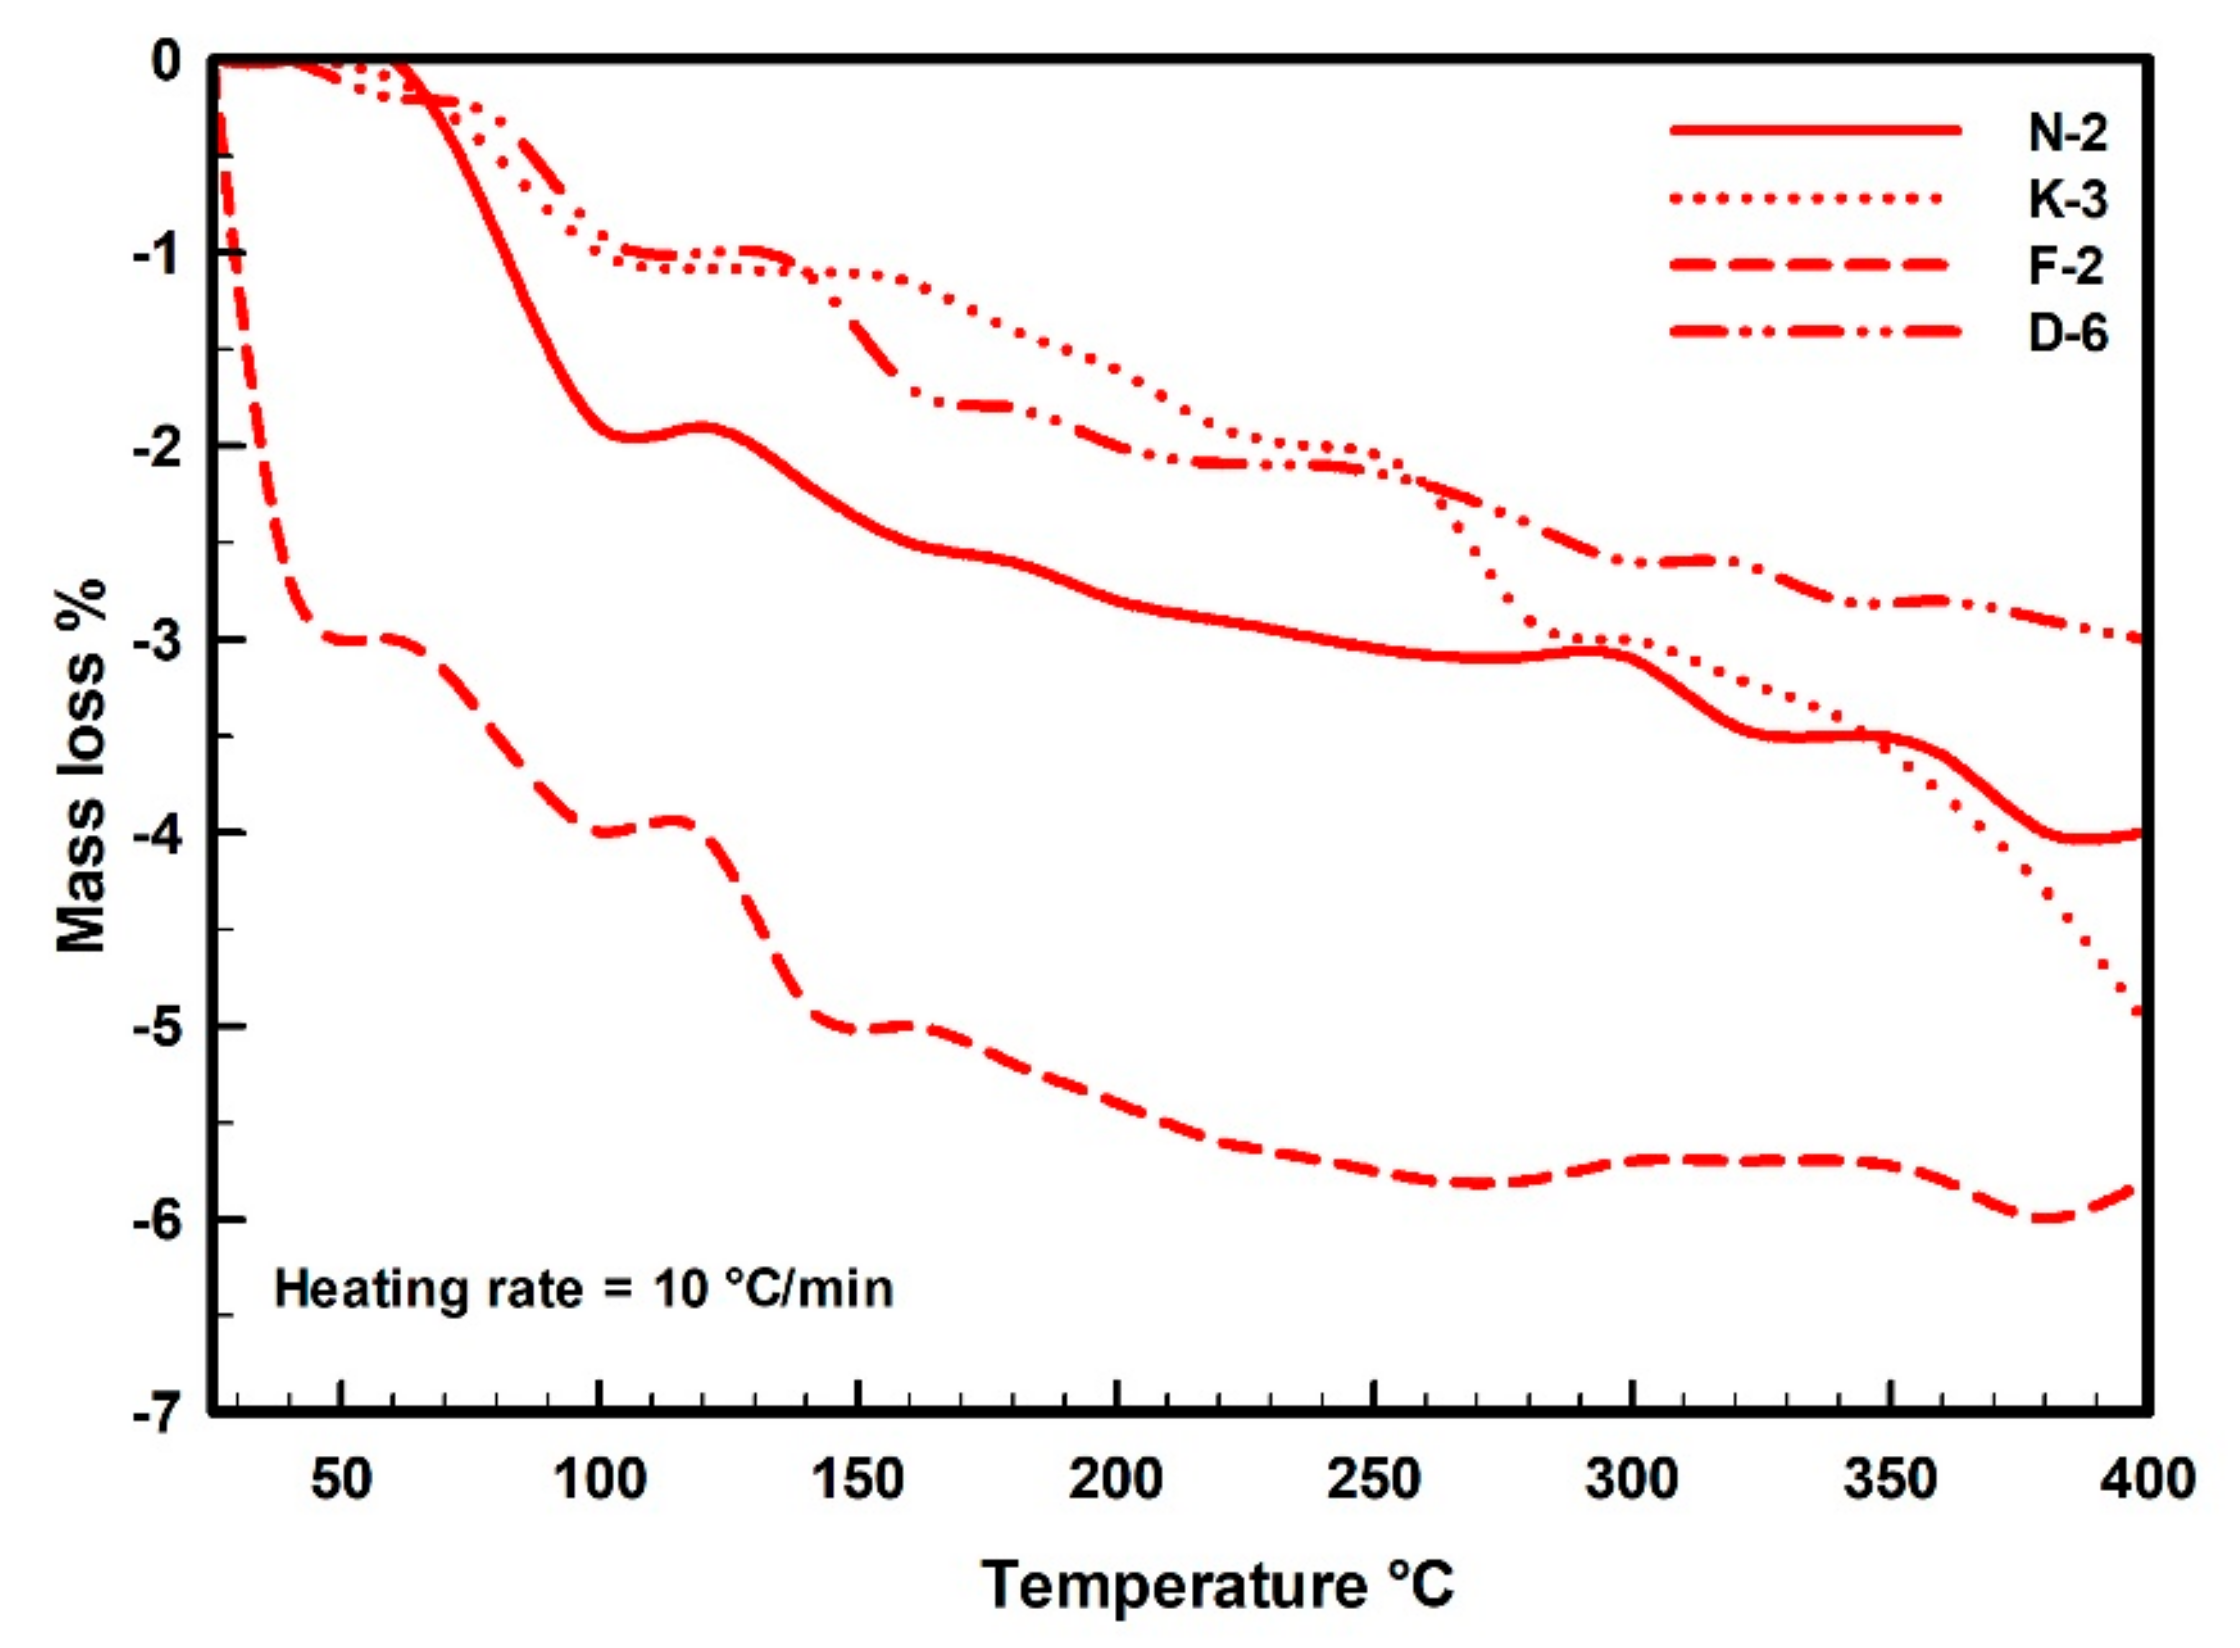
3.1.5. Moisture Content by Thermogravimetry

Noticeably, the moisture contents of the analyzed kaolin samples (as enriched by kaolinite and not accompanied with other hydrous minerals, except 3% illite in sample K-3 which is represented by ~0.36% LOI) can be observed as implied in the difference between the loss on ignition (LOI) values (ranged between 17.91% and 18.99%, Table 1) and the theoretical water content of kaolinite (13.96%). Kaolinite is the most thermally stable amongst clay minerals and when compared with other common pharmaceutical materials at relatively high temperatures, normally up to 400 °C. Consequently, TGA is a suitable approach of great value for quantifying moisture contents of kaolin powder excipient, as it is a more accurate and rapid method for quality-by-design in pharmaceutical formulations. Simultaneous thermal analyses (TGA/DTA) have been employed for determining mass losses and moisture contents, evaluating the thermal stability and identifying the phase transformations of pharmaceutical excipients [75,76,77].
In the thermal curves (Figure 7), the mass loss was steadily increased from the room temperature (~25 °C) until the inflection point (the base temperature) that occurred at 450 °C for samples N-2, K-3 and F-2, while appeared at 400 °C for sample D-6. The adsorbed water on kaolinite particles was completely loss during this range. The moisture contents were determined from the dehydration curves (Figure 8), represented by mass losses of 3.98%, 4.95%, 5.82% and 2.98% in samples N-2, K-3, F-2 and D-6, respectively (Table 3). Then, beyond the inflection point (400–450 °C), it was the beginning of dehydroxylation process (i.e., the rapid loss of the structural water (−OH) from the aluminol surface, indicated by great mass loss rate on the TG curves with endothermic peaks on the DTA curves).
Under the used heating conditions (25–400 °C), kaolinites did not undergo significant phase transformational changes, but only some structural changes existed as indicated on the kaolinite XRD diffraction profiles (Figure 2). TG and DTA curves (Figure 7) are not identical for all the measured samples, indicating different moisture contents and mass loss rates. These different behaviors depend on the initial kaolinite order-disorder degrees [78,79] but also they can be attributed to differences in particle sizes and pore size distributions of the samples. The studied kaolin powders showed improvements in their flowability (Table 2) that could be attributed to these thermal-based structural and microtextural changes accompanied with the observed mass loss (Figure 8).

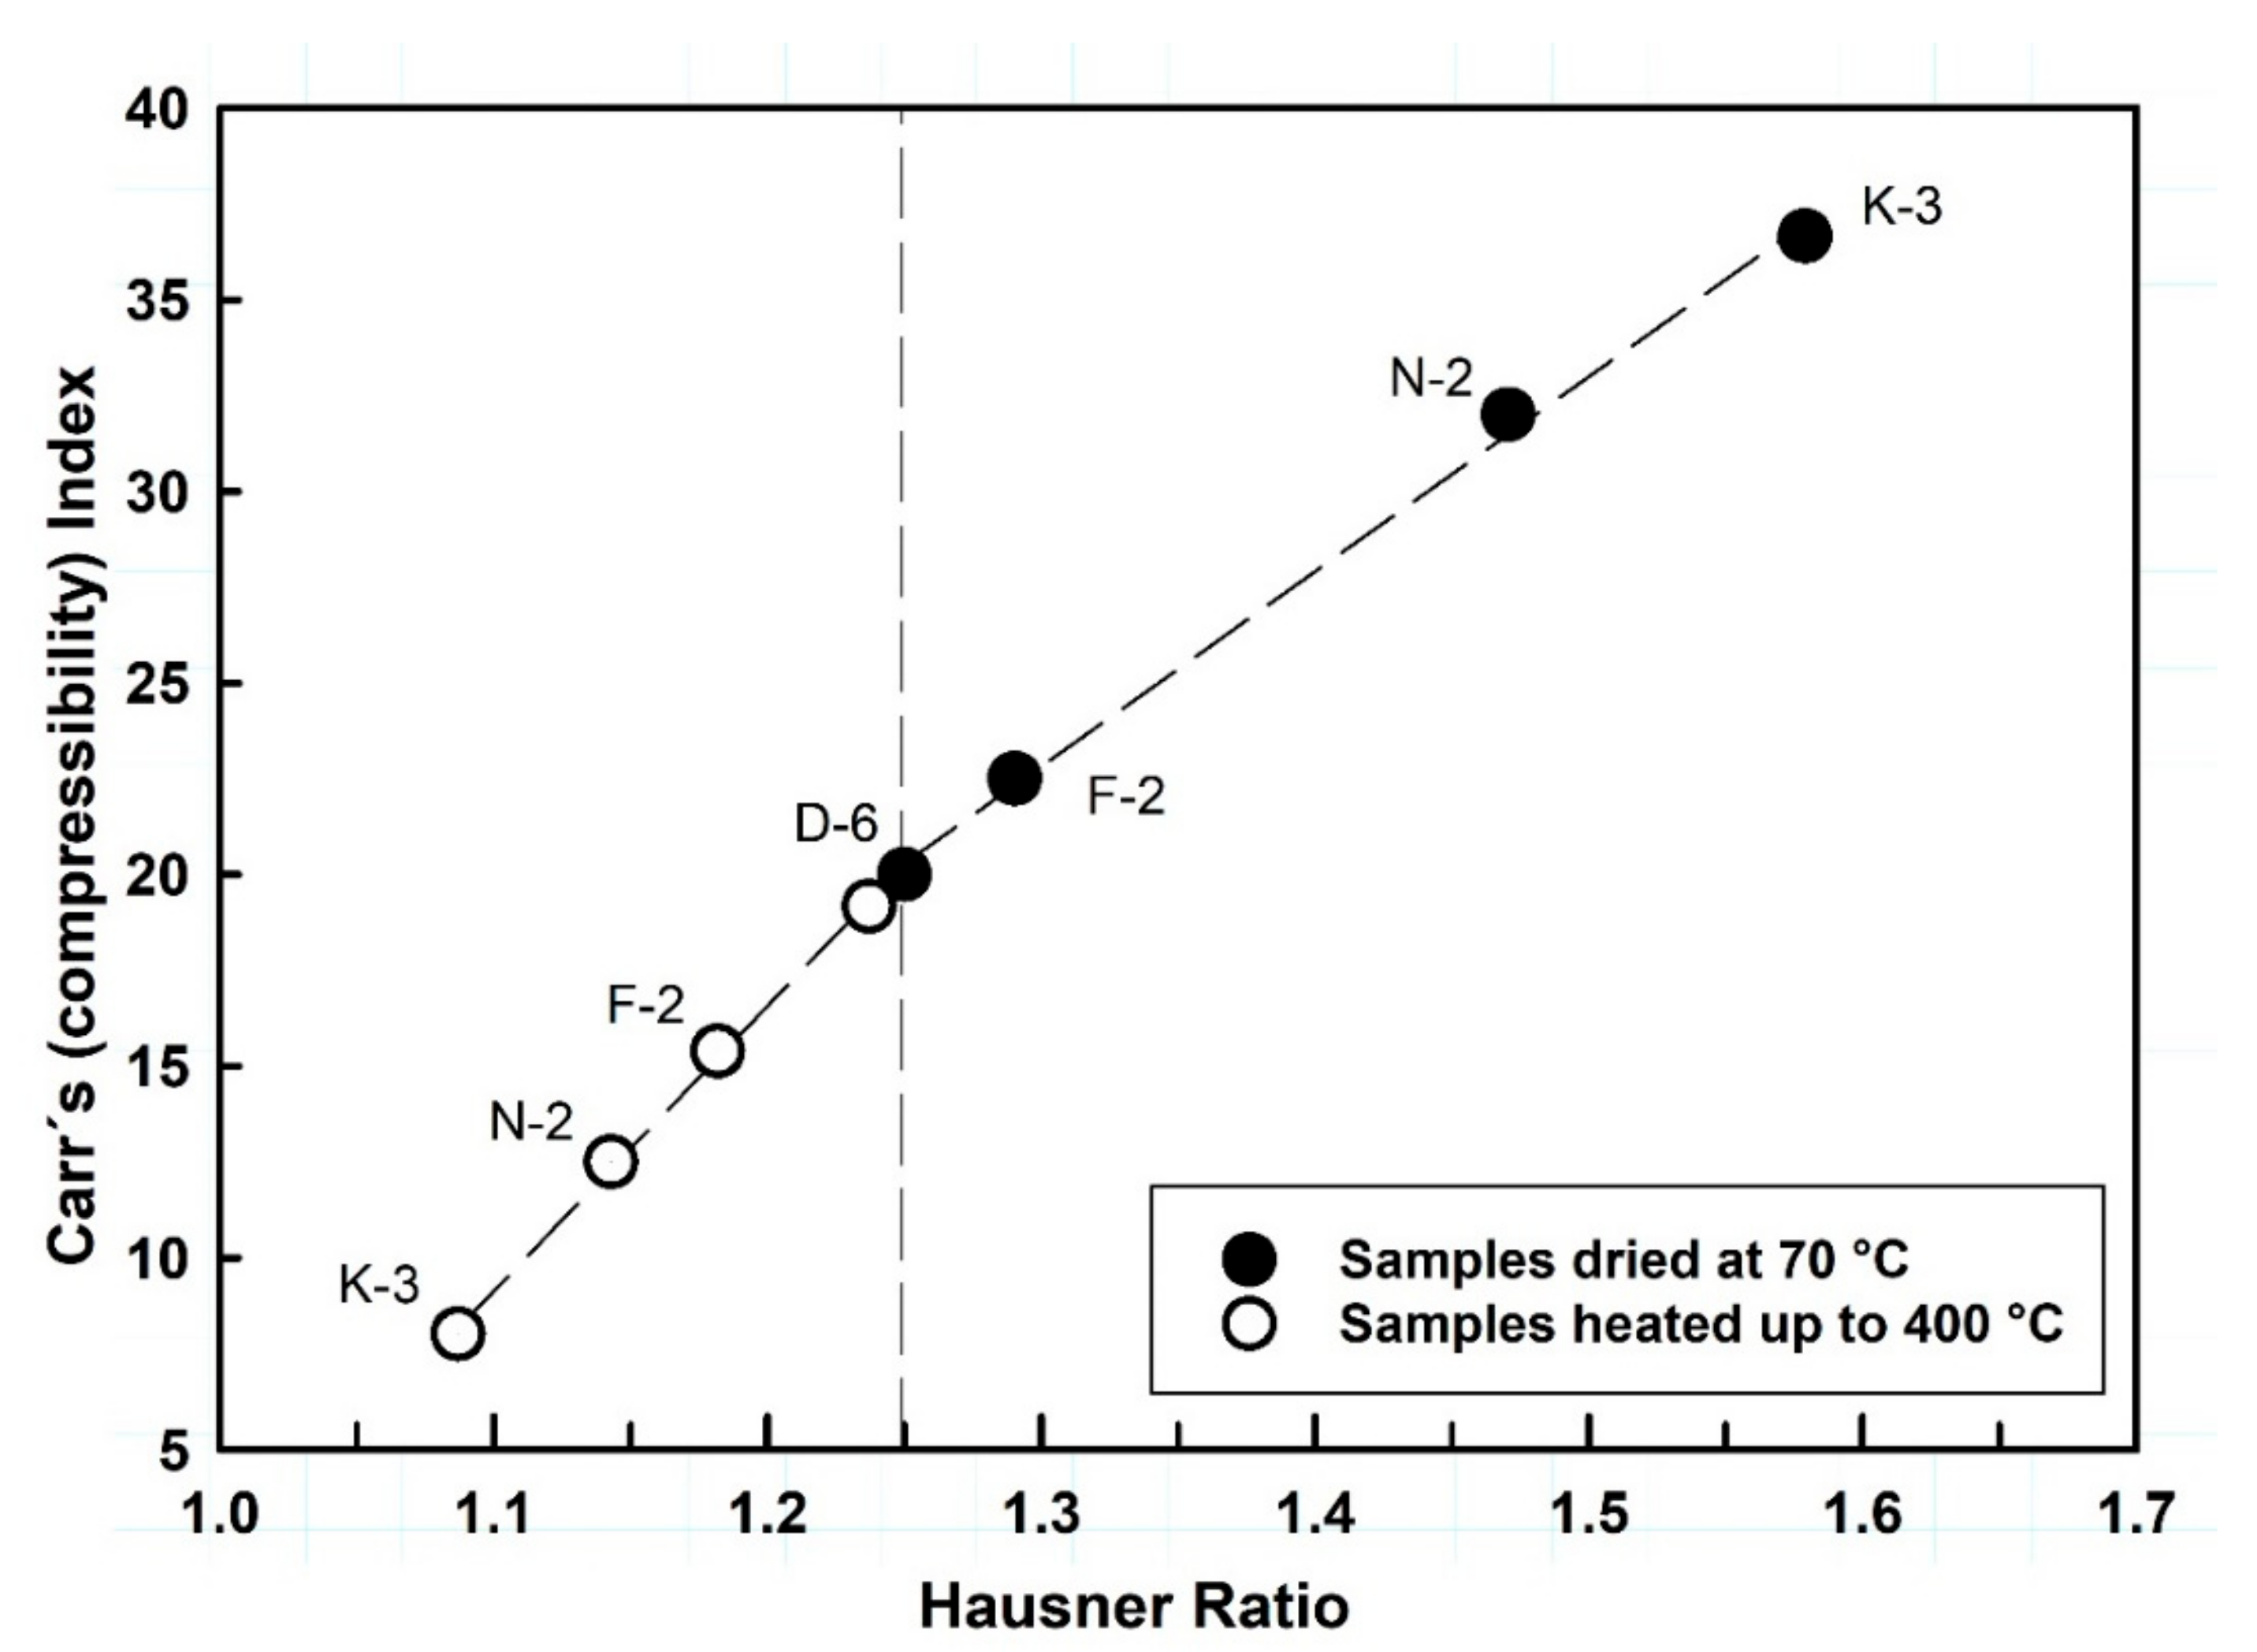
3.1.6. Flow Characteristics

Heating kaolinite to 400 °C is most probably leading to shrinkage and disintegration of aggregated particles due to the removal of the water adsorbed on particle surfaces, which affect interparticle forces and decreases particle friction and cohesion, facilitating particle rearrangement and causing changes in powder density, and hence the increasing of flowability (i.e., the HR values are reduced [80], Figure 9 and Table 2).

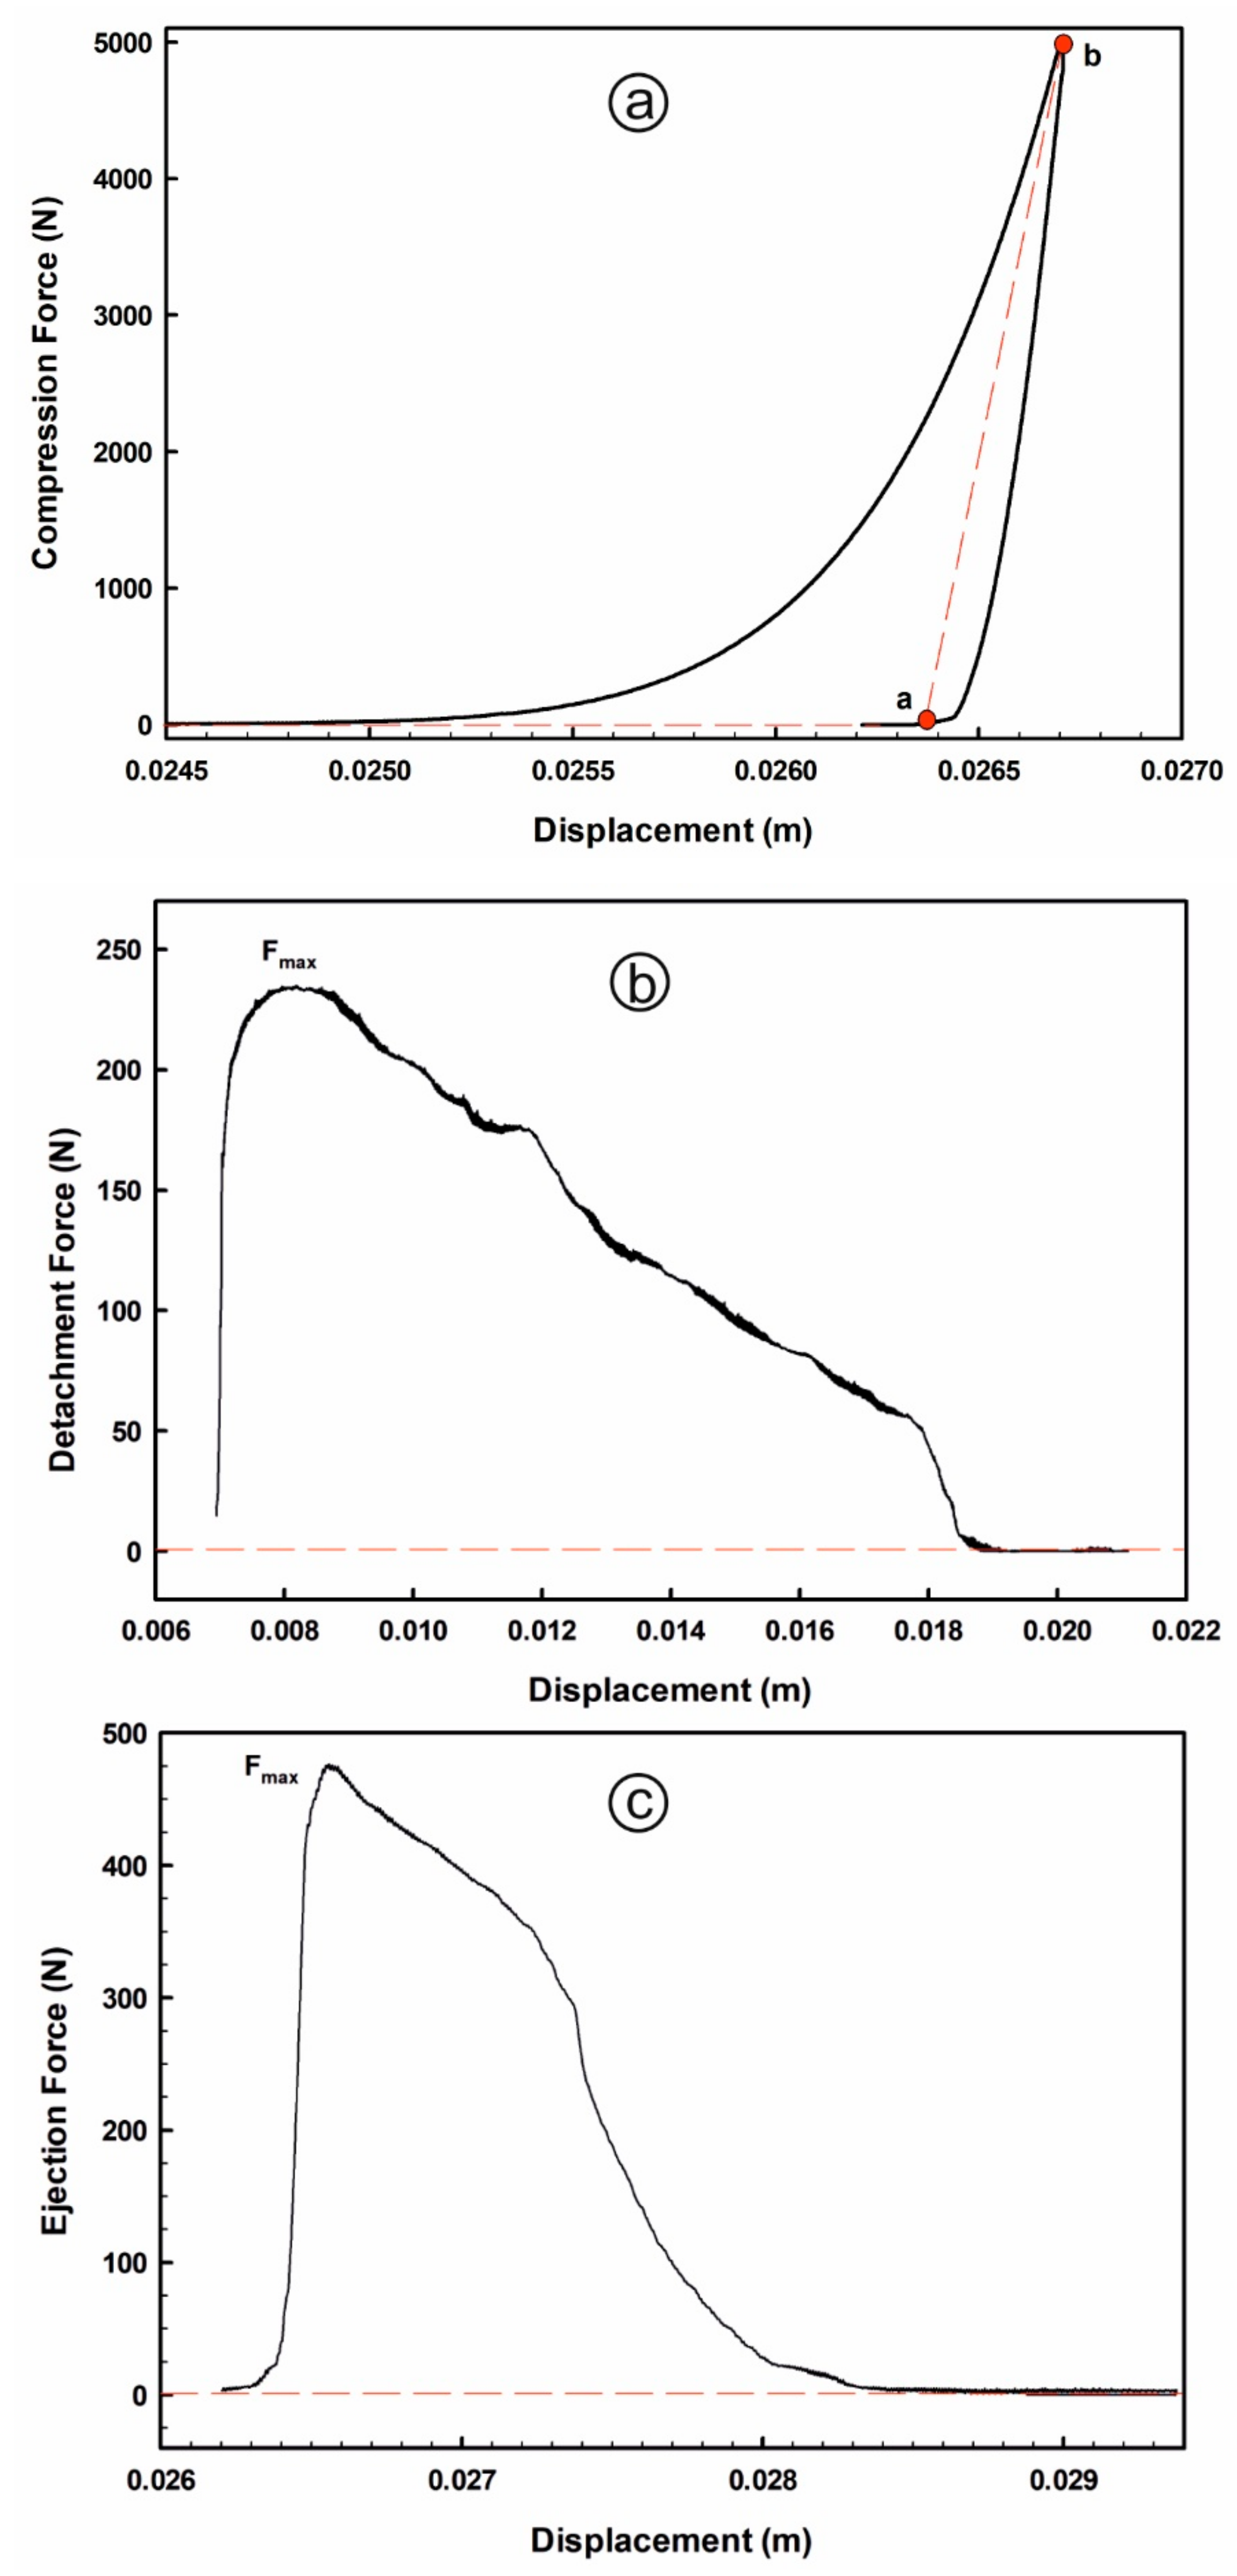
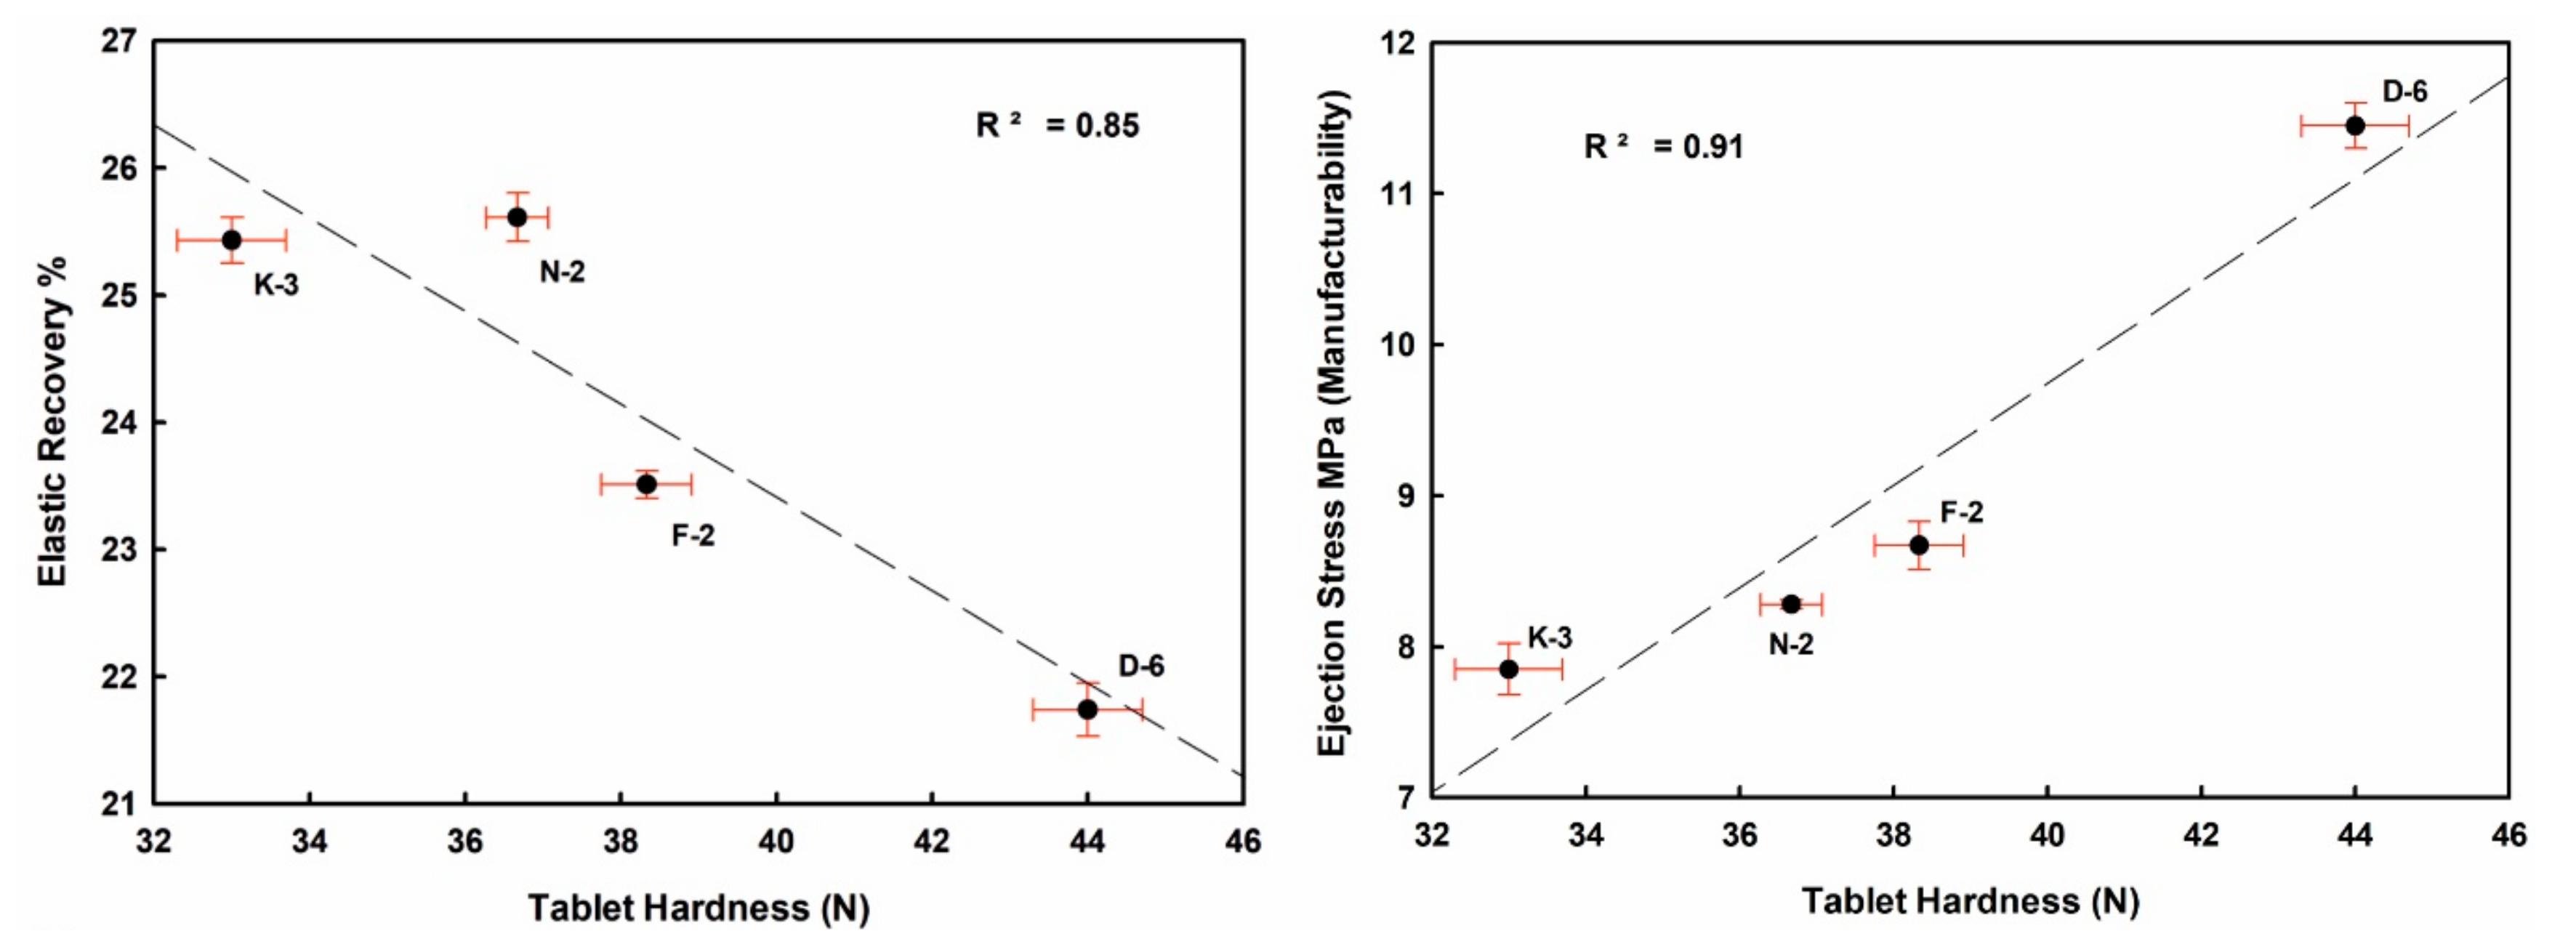
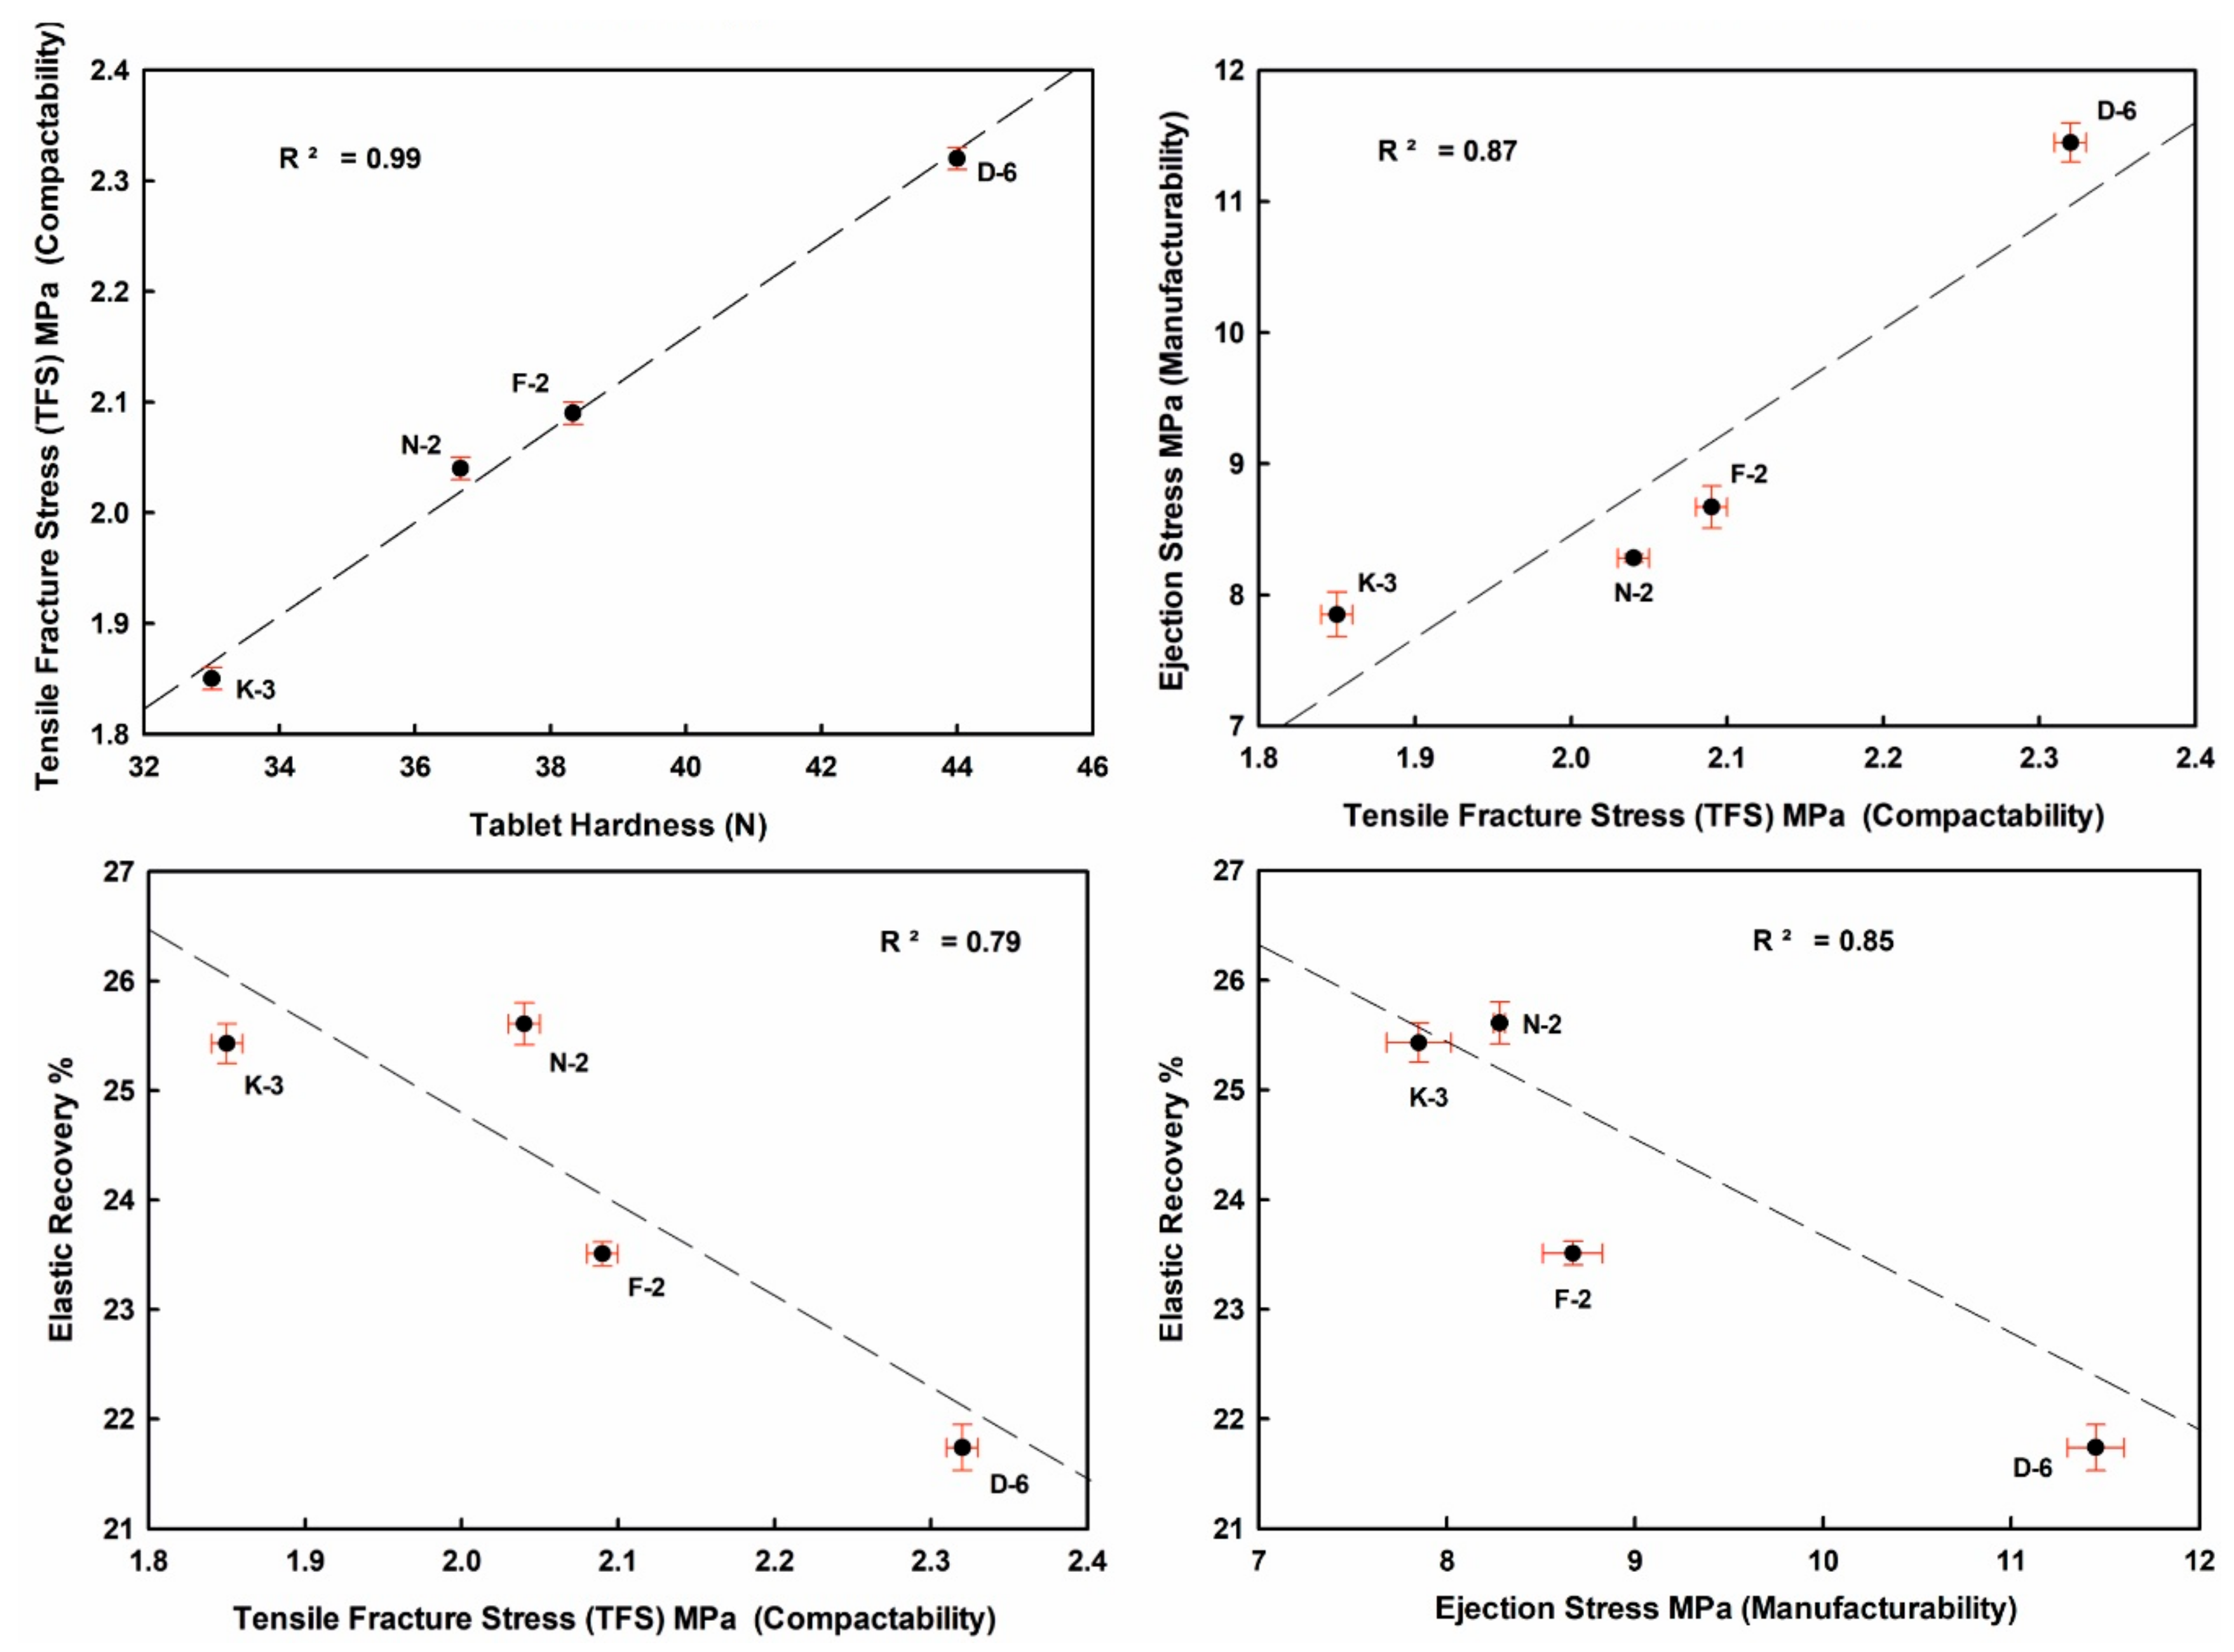
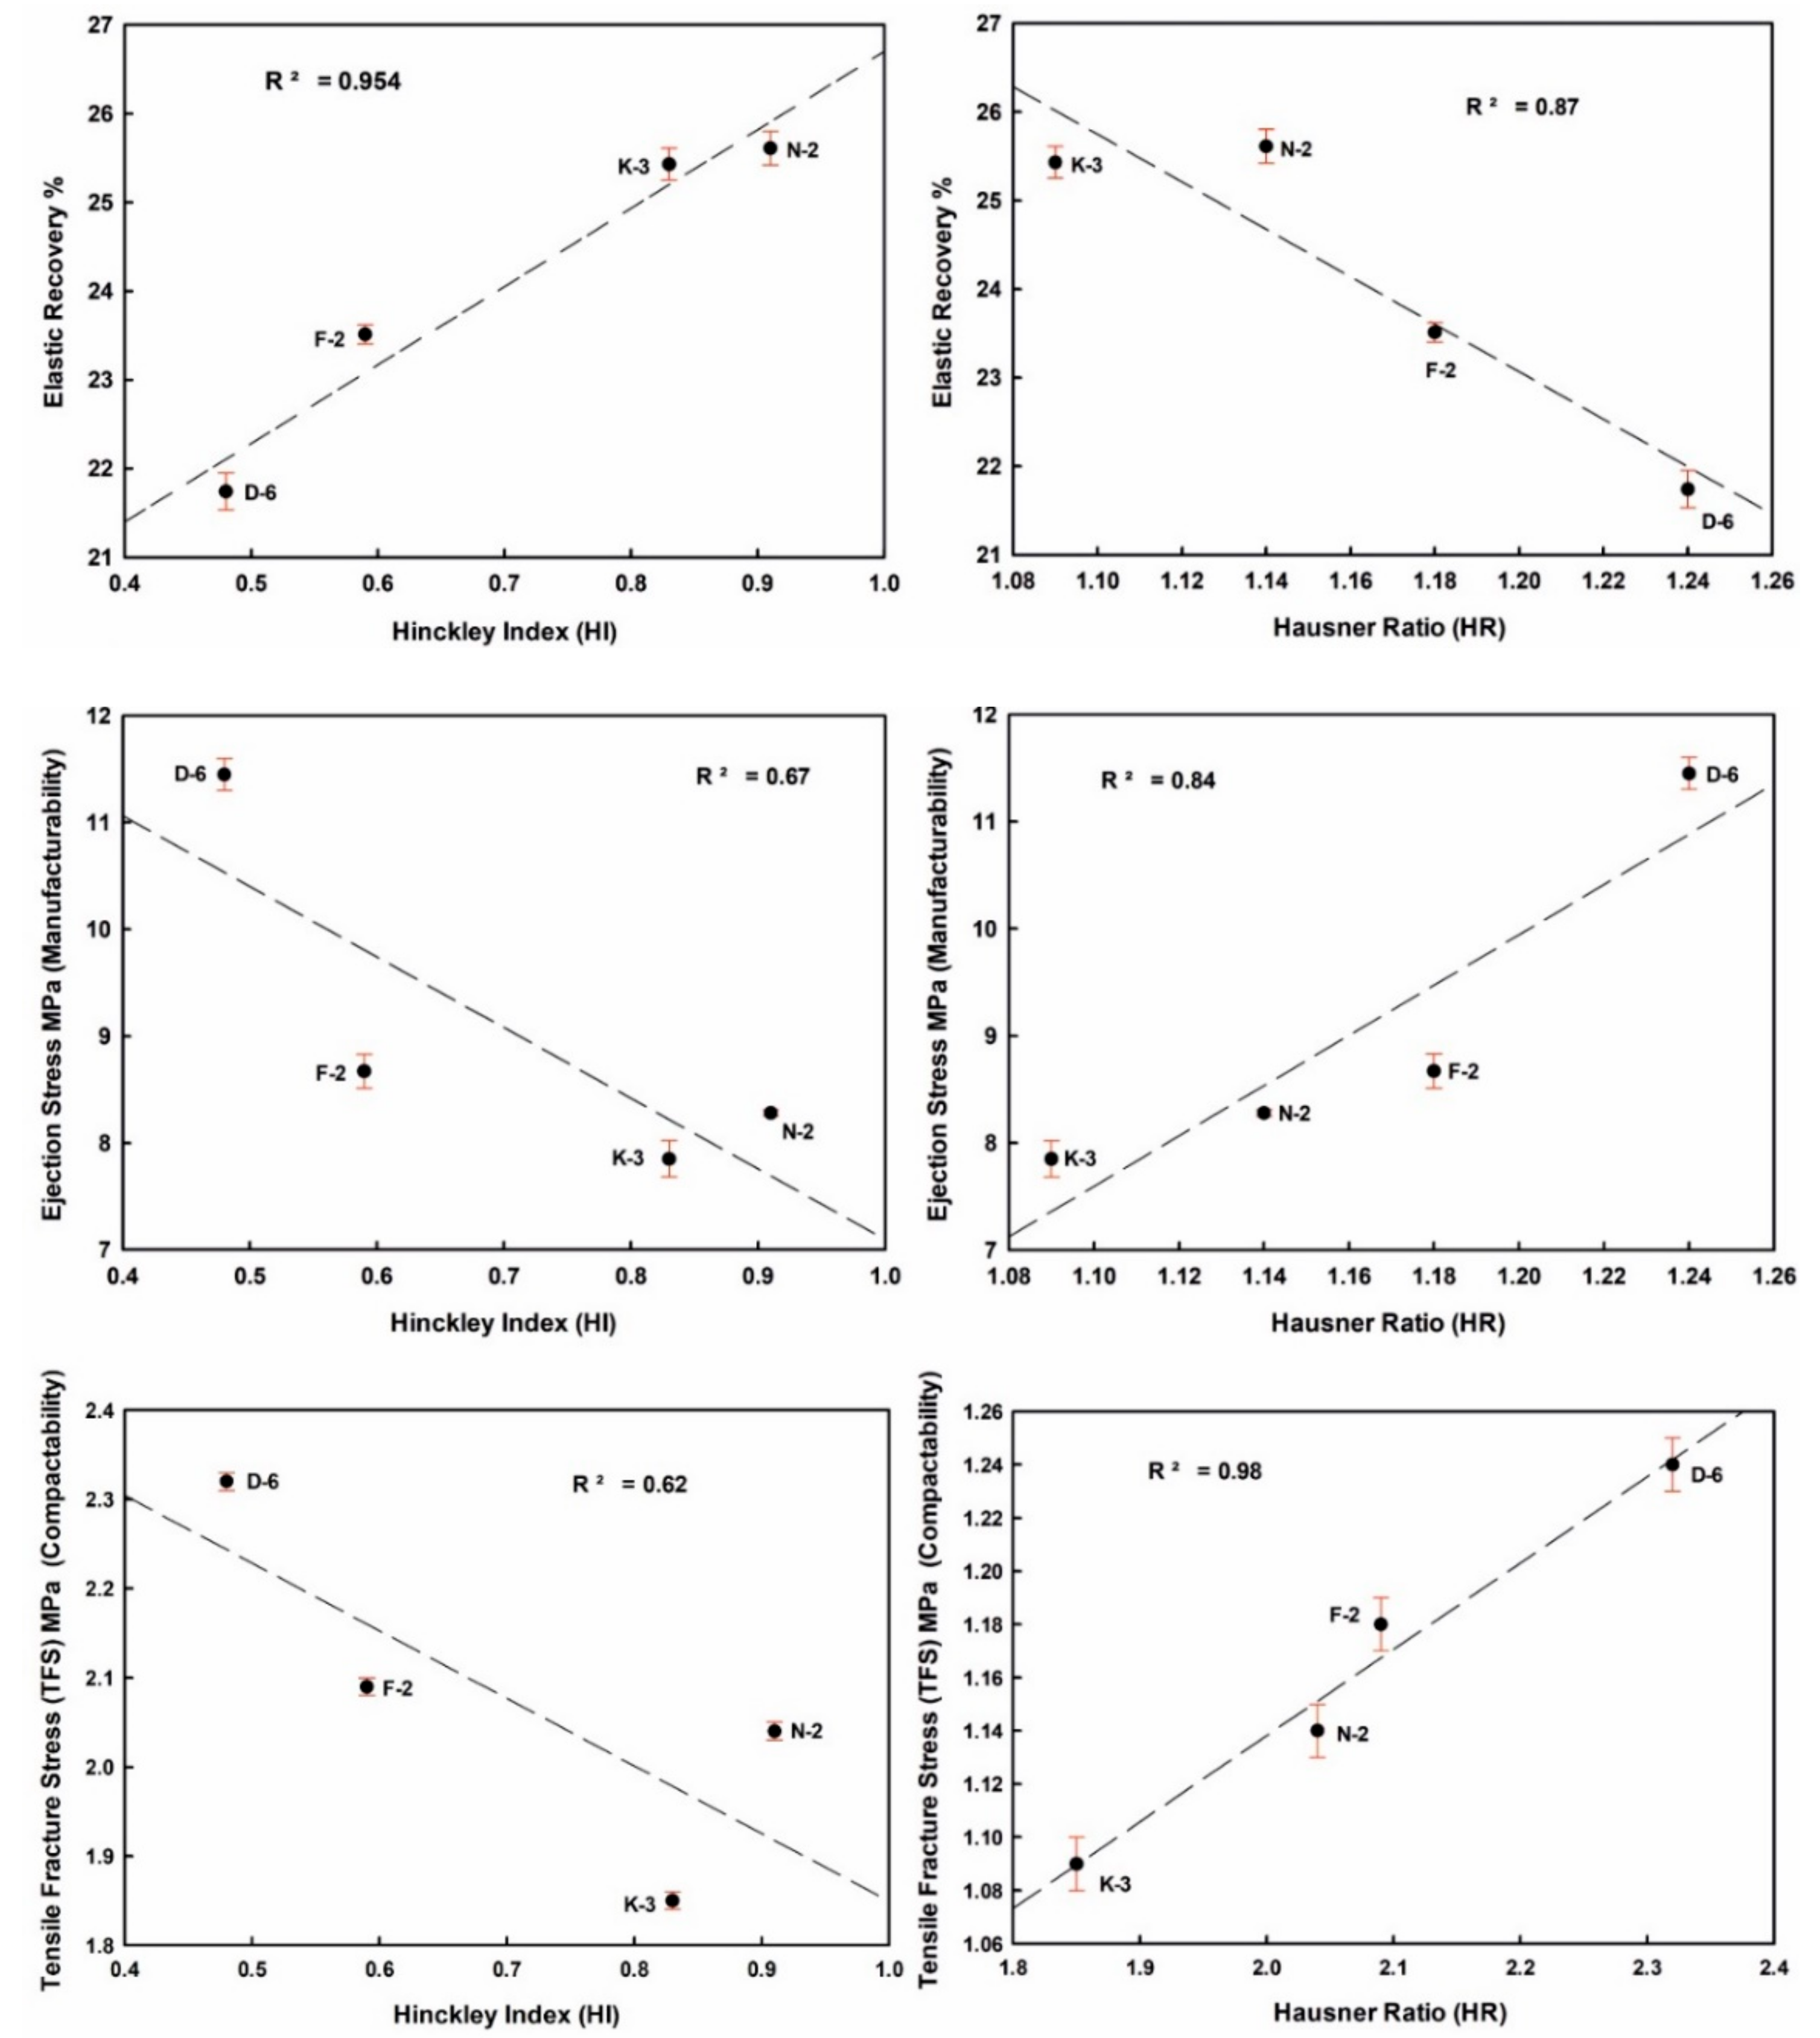
3.2. Tableting Characteristics

It is reported that during the powder compaction process into a tablet, the particles undergo four connected events: rearrangement according to size, shape and density; plastic deformation and/or fragmentation; elastic compact deformation; and elastic recovery when the pressure is removed (unloading) as the tablet is relaxed into its final dimensions. Normally, plastic or elastic particles deform to accommodate the increasing applied force, while brittle particles break into smaller fragments which then displace the pores. The tableting behavior is evaluated on the basis of powder success to form a coherent compact with a measurable strength and without particle adhesion to the equipment (i.e., punch and die wall [42]). Structurally, each kaolinite particle in the overall kaolin powder is composed of aggregated platelets. Each individual platelet exhibits a sheet-like structure of stacked tetrahedral-octahedral T–O layers along the crystallographic c-axis, which may exhibit ordered or disordered growths (i.e., well-crystallized and poorly-crystallized kaolinites, respectively), and have large or small maximum coherent thickness of the T–O layers, known by crystallite size (D001 in nm [39]). Particle size increases with temperature due to platelet-platelet adhesion by the effect of inter-particulate forces (electrostatic and van der Waals) among the kaolinite platelet surfaces and edges of different charges, with removal of the adsorbed water, which lead to the clustering of the ultrafine kaolinite platelets (<1 μm) by face-to-face and edge-to-edge adhesions into larger aggregated particles (Figure 4 [65]).
The interrelated structural characteristics of kaolinite (HI and D001) define the final particle geometric dimensions by means of the shape and size of aggregates. Kaolin powders enriched in well-crystallized and large crystallite-size kaolinites (samples N-2 and K-3), when dominated by ultrafine particles of nanosized diameters, yield particle aggregates of relatively more equant dimensions and more sphericity with smoother surfaces than those yielded by the kaolin powders enriched in the poorly-crystallized kaolinites (samples F-2 and D-6) at similar size ranges and contents of the ultrafine particle fractions (<1 μm). The heating of kaolin powders at 400 °C (10 °C/min) generally optimizes the particle size uniformity and homogeneity, enhances the flowability, facilitates particle rearrangement and minimizes adhesive forces with the surfaces of the equipment during the compaction process, producing successful tablets with measurable hardness (H) values from 33 to 44 N, in the order K-3 < N-2 < F-2 < D-6 (Table 4). Tableting failures were observed in all kaolin powder sample categories prepared either by dryness at 70 °C, due to powder sticking to punch surfaces and die wall, or in those heated at dehydroxylation high-temperature (>400 °C) by capping and fracturing.
Well crystallized kaolinite-enriched kaolin powder showed higher flowability (low HR value) and produced the highest elastic recovery tablets, with relatively better manufacturability (lower ES values toward the ideal limits < 5 MPa) with good compactability (TFS values ≥ 2 MPa [57], Figure 10 and Figure 11).
ER values increased from 21.74% (D-6) to 25.61% (N-2) in the order D-6 < F-2 < K-3 < N-2, indicating strong negative correlations with H, ES and TFS. ES values ranged from 7.85 MPa (K-3) to 11.45 MPa (D-6). TFS values ranged from 1.85 MPa (K-3) to 2.32 MPa (D-6). The goodness degrees of powder manufacturability (ES) and compactability (TFS) were increased in the order K-3 < N-2 < F-2 < D-6. They showed a strong positive correlation among them, and also with H values (Figure 10 and Table 4 and Table 5).
Therefore, kaolin particles exhibit appropriate plasticity and elasticity for compactness. The dehydration of adsorbed water on the kaolinite particle surfaces by heating at the used optimum thermal conditions, the increase of particle size, homogeneity and sphericity by pelletization or granulation processes, as well as the addition of adequate and compatible glidants and/or lubricants, can affect interparticle forces, thus minimizing particle-particle frictions and particle-wall adhesion, to facilitate particle rearrangement and to improve flowability and enhancements of the tabletability performance in the studied kaolin powders.

4. Conclusions

The studied pharmaceutical grade kaolin powders proved that kaolinite, beside its ubiquity, biological safety and good surface properties, is a promising compressible and compactable excipient material in the formulations of tablet solid dosage forms. The effects of temperature (up to 400 °C) can maintained the interrelated structural crystallinity and crystallite size, micrometric and cohesive properties of kaolinite particles, as the most thermal stable clay mineral, and hence led to improving the flowability of kaolin powders. Kaolinite order-disorder degree, thickness of structural T-O layer stacking along c-axis (measured by Hinckley crystallinity Index HI and crystallite size D001) and powder flowability (measured by Carr´s Index CI and Hausner Ratio HR) have been found to be strongly correlated with the mechanical and quality-by-design properties (elastic recovery %, ejection stress MPa and tensile fracture stress MPa) of the kaolin powders that control their tableting characteristics (elasticity, manufacturability and compactability) and tablet hardness. Therefore, the removal of water adsorbed on kaolinite particle surfaces by the effect of heat, with addition of adequate glidants and/or lubricants, can affect interparticle forces, thus decreasing particle friction and cohesion, and facilitate particle rearrangement, causing changes in powder density that increases kaolin powder flowability and tabletability.

Author Contributions

Conceptualization, D.M., J.Đ., S.I., C.V.; Methodology, literature review, interpretation or materials data, discussion, M.E.A., D.M., J.Đ., S.I.; Writing—original draft preparation, M.E.A., M.M.E.-R.; Supervision and writing—review, A.L.-G., C.V.; Editing, A.L.-G. All authors have read and agreed to the published version of the manuscript.

Funding

This work has been funded by the Egyptian Cultural Affairs and Missions Sector (Plan 2013–2014), Ministry of Higher Education, in collaboration with the Group CTS-946 (Junta de Andalucía) and MINECO project CGL2016-80833-R (Spain), and the grant funded by Erasmus+ KA1 mobility program 2016/2017.

Acknowledgments

The first author is very grateful to Biljana Mihailović (Department of Pharmaceutical Chemistry, Faculty of Pharmacy, University of Belgrade, Serbia) and Eduardo Flores (Andalusian Institute of Earth Sciences, IACT-CSIC-UGR, Spain) for the technical assistance.

Conflicts of Interest

The authors declare no conflict of interest.

References

  1. Augsburger, L.L.; Hoag, S.W. (Eds.) Pharmaceutical Dosage Forms: Tablets, Volume 1: Unit Operations and Mechanical Properties, 3rd ed.; Informa Healthcare: London, UK; CRC Press: Boca Raton, FL, USA, 2008; p. 656. [Google Scholar]
  2. Viseras, C.; Aguzzi, C.; Cerezo, P.; Lopez-Galindo, A. Uses of clay minerals in semisolid health care and therapeutic products. Appl. Clay Sci. 2007, 36, 37–50. [Google Scholar] [CrossRef]
  3. Carretero, M.I.; Pozo, M. Clay and non-clay minerals in the pharmaceutical industry: Part I. excipients and medical applications. Appl. Clay Sci. 2009, 46, 73–80. [Google Scholar] [CrossRef]
  4. Carretero, M.I.; Pozo, M. Clay and non-clay minerals in the pharmaceutical and cosmetic industries Part II. Active ingredients. Appl. Clay Sci. 2010, 47, 171–181. [Google Scholar] [CrossRef]
  5. Williams, L.B.; Hillier, S. Kaolins and health: From first grade to first aid. Elements 2014, 10, 207–211. [Google Scholar] [CrossRef]
  6. Khurana, I.S.; Kaur, S.; Kaur, H.; Khurana, R.K. Multifaceted role of clay minerals in pharmaceuticals. Future Sci. OA 2015, 1. [Google Scholar] [CrossRef] [PubMed]
  7. Kim, M.H.; Choi, G.; Elzatahry, A.; Vinu, A.; Bin Choy, Y.; Choy, J.H. Review of clay-drug hybrid materials for biomedical applications: Administration routes. Clays Clay Miner. 2016, 64, 115–130. [Google Scholar] [CrossRef]
  8. Awad, M.E.; López-Galindo, A.; Setti, M.; El-Rahmany, M.M.; Iborra, C.V. Kaolinite in pharmaceutics and biomedicine. Int. J. Pharm. 2017, 533, 34–48. [Google Scholar] [CrossRef]
  9. Rautureau, M.; Gomes, C.F.; Liewig, N.; Katouzian-Safadi, M. Clays and Health: Properties and Therapeutic Uses; Springer: Berlin/Heidelberg, Germany, 2017; p. 217. [Google Scholar]
  10. Detellier, C. Functional kaolinite. Chem. Rec. 2018, 18, 868–877. [Google Scholar] [CrossRef]
  11. Massaro, M.; Colletti, C.; Lazzara, G.; Riela, S. The Use of some clay minerals as natural resources for drug carrier applications. J. Funct. Biomater. 2018, 9, 58. [Google Scholar] [CrossRef] [Green Version]
  12. Viseras, C.; Carazo, E.; Borrego-Sánchez, A.; García-Villén, F.; Sánchez-Espejo, R.; Cerezo, P.; Aguzzi, C. Clay minerals in skin drug delivery. Clays Clay Miner. 2019, 67, 59–71. [Google Scholar] [CrossRef]
  13. Williams, L.B. Natural antibacterial clays: Historical uses and modern advances. Clays Clay Miner. 2019, 67, 7–24. [Google Scholar] [CrossRef]
  14. Tan, D.; Yuan, P.; Annabi-Bergaya, F.; Liu, D.; He, H. Methoxy-modified kaolinite as a novel carrier for high-capacity loading and controlled-release of the herbicide amitrole. Sci. Rep. 2015, 5, 8870. [Google Scholar] [CrossRef] [PubMed] [Green Version]
  15. Zhang, Y.; Long, M.; Huang, P.; Yang, H.; Chang, S.; Hu, Y.; Tang, A.; Mao, L. Intercalated 2D nanoclay for emerging drug delivery in cancer therapy. Nano Res. 2017, 10, 2633–2643. [Google Scholar] [CrossRef]
  16. Zhang, Y.; Huang, P.; Long, M.; Liu, S.; Yang, H.; Yuan, S.; Chang, S. Intercalated kaolinite as an emerging platform for cancer therapy. Sci. China Chem. 2018, 62, 58–61. [Google Scholar] [CrossRef]
  17. Nizam, N.; Ramli, N.I. Preparation and antibacterial properties of cetylpyridinium bromide-modified silver-loaded kaolinite. Mater. Res. Express 2019, 6, 094006. [Google Scholar]
  18. Tan, D.; Yuan, P.; Bergaya, F.A.; Liu, D.; He, H. High-capacity loading of 5-fluorouracil on the methoxy modified kaolinite. Appl. Clay Sci. 2014, 100, 60–65. [Google Scholar] [CrossRef]
  19. Dey, S.C.; Al-Amin, M.; Rashid, T.U.; Ashaduzzaman, M.; Shamsuddin, S.M. pH induced fabrication of kaolinite-chitosan biocomposite. Int. Lett. Chem. Phys. Astron. 2016, 68, 1–9. [Google Scholar] [CrossRef]
  20. Detellier, C.; Schoonheydt, R.A. From platy kaolinite to nanorolls. Elements 2014, 10, 201–206. [Google Scholar] [CrossRef]
  21. Schroeder, P.A.; Erickson, G. Kaolin: From ancient porcelains to nanocomposites. Elements 2014, 10, 177–182. [Google Scholar] [CrossRef]
  22. Reddy, O.S.; Subha, M.C.S.; Jithendra, T.; Madhavi, C.; Rao, K.C.; Mallikarjuna, B. Sodium alginate/gelatin microbeads-intercalated with kaolin nanoclay for emerging drug delivery in wilson’s disease. Int. J. App. Pharm. 2019, 11, 71–80. [Google Scholar] [CrossRef]
  23. Cerri, G.; Farina, M.; Brundu, A.; Daković, A.; Giunchedi, P.; Gavini, E.; Rassu, G. Natural zeolites for pharmaceutical formulations: Preparation and evaluation of a clinoptilolite-based material. Microporous Mesoporous Mater. 2016, 223, 58–67. [Google Scholar] [CrossRef]
  24. De Gennaro, B.; Mercurio, M.; Cappelletti, P.; Catalanotti, L.; Daković, A.; De Bonis, A.; Grifa, C.; Izzo, F.; Kraković, M.; Monetti, V.; et al. Use of surface modified natural zeolite (SMNZ) in pharmaceutical preparations. Part 2. A new approach for a fast functionalization of zeolite-rich carriers. Microporous Mesoporous Mater. 2016, 235, 42–49. [Google Scholar] [CrossRef]
  25. Pasquino, R.; Di Domenico, M.; Izzo, F.; Gaudino, D.; Vanzanella, V.; Grizzuti, N.; de Gennaro, B. Rheology-sensitive response of zeolite-supported anti-inflammatory drug systems. Colloids Surf. B Biointerfaces 2016, 146, 938–944. [Google Scholar] [CrossRef] [PubMed]
  26. Cappelletti, P.; Colella, A.; Langella, A.; Mercurio, M.; Catalanotti, L.; Monetti, V.; de Gennaro, B. Use of surface modified natural zeolite (SMNZ) in pharmaceutical preparations Part 1. Mineralogical and technological characterization of some industrial zeolite-rich rocks. Microporous Mesoporous Mater. 2017, 250, 232–244. [Google Scholar] [CrossRef]
  27. De Gennaro, B.; Izzo, F.; Catalanotti, L.; Langella, A.; Mercurio, M. Surface modified phillipsite as a potential carrier for NSAIDs release. Adv. Sci. Lett. 2017, 23, 5941–5943. [Google Scholar] [CrossRef]
  28. Mercurio, M.; Izzo, F.; Langella, A.; Grifa, C.; Germinario, C.; Daković, A.; Aprea, P.; Pasquino, R.; Cappelletti, P.; Graziano, F.S.; et al. Surface-modified phillipsite-rich tuff from the Campania region (southern Italy) as a promising drug carrier: An ibuprofen sodium salt trial. Am. Miner. 2018, 103, 700–710. [Google Scholar] [CrossRef]
  29. Izzo, F.; Mercurio, M.; de Gennaro, B.; Aprea, P.; Cappelletti, P.; Daković, A.; Germinario, C.; Grifa, C.; Smiljanic, D.; Langella, A. Surface modified natural zeolites (SMNZs) as nanocomposite versatile materials for health and environment. Colloids Surf. B Biointerfaces 2019, 182, 110380. [Google Scholar] [CrossRef]
  30. Callahan, J.C.; Cleary, G.W.; Elefant, M.; Kaplan, G.; Kensler, T.; Nash, R.A. Equilibrium moisture content of pharmaceutical excipients. Drug Dev. Ind. Pharm. 1982, 8, 355–369. [Google Scholar] [CrossRef]
  31. Gerhardt, A.H. Moisture effects on solid dosage forms-formulation, processing, and stability. J. GXP Compliance 2009, 13, 58–66. [Google Scholar]
  32. Shalini, Y.; Annapurneswari, T.S.; Sundari, C.B.T.; Rao, V.J.; Nath, A.R. Method development and validation for simultaneous estimation of propranolol hydrochloride and flunarizine dihydrochloride in bulk and pharmaceutical dosage form by RP-HPLCY. Int. Res. J. Pharm. Appl. Sci. 2012, 2, 143–148. [Google Scholar]
  33. Huertas, F.J.; Chou, L.; Wollast, R. Mechanism of kaolinite dissolution at room temperature and pressure. Part II: Kinetic study. Geochim. Cosmochim. Acta. 1999, 63, 3261–3275. [Google Scholar] [CrossRef]
  34. Rozalen, M.; Huertas, F.J.; Brady, P.V. Experimental study of the effect of pH and temperature on the kinetics of montmorillonite dissolution. Geochim. Cosmochim. Acta. 2009, 73, 3752–3766. [Google Scholar] [CrossRef]
  35. Sheth, A.R.; Grant, D.J.W. Relationship between the structure and properties of pharmaceutical crystals. KONA Powder Part. J. 2005, 23, 36–48. [Google Scholar] [CrossRef] [Green Version]
  36. Hlinak, A.J.; Kuriyan, K.; Morris, K.R.; Reklaitis, G.V.; Basu, P.K. Understanding critical material properties for solid dosage form design. J. Pharm. Innov. 2006, 1, 12–17. [Google Scholar] [CrossRef]
  37. Mirza, S.; Miroshnyk, I.; Heinämäki, J.; Antikainen, O.; Rantanen, J.; Vuorela, P.; Vuorela, H.; Yliruusi, J. Crystal morphology engineering of pharmaceutical solids: Tabletting performance enhancement. AAPS PharmSciTech 2009, 10, 113–119. [Google Scholar] [CrossRef] [Green Version]
  38. Awad, M.E.; López-Galindo, A.; El Rahmany, M.M.; El-Desoky, H.M.; Viseras, C. Characterization of Egyptian kaolins for health-care uses. Appl. Clay Sci. 2017, 135, 176–189. [Google Scholar] [CrossRef]
  39. Awad, M.E.; López-Galindo, A.; Sánchez-Espejo, R.; Sainz-Díaz, C.I.; El-Rahmany, M.M.; Viseras, C. Crystallite size as a function of kaolinite structural order-disorder and kaolin chemical variability: Sedimentological implication. Appl. Clay Sci. 2018, 162, 261–267. [Google Scholar] [CrossRef]
  40. Gamlen, M. An instrumental process: Tablet compaction. Innov. Pharm. Technol. 2013, 44, 54–58. [Google Scholar]
  41. Yendluri, R.; Otto, D.P.; De Villiers, M.M.; Vinokurov, V.; Lvov, Y.M. Application of halloysite clay nanotubes as a pharmaceutical excipient. Int. J. Pharm. 2017, 521, 267–273. [Google Scholar] [CrossRef]
  42. Osamura, T.; Takeuchi, Y.; Onodera, R.; Kitamura, M.; Takahashi, Y.; Tahara, K.; Takeuchi, H. Characterization of tableting properties measured with a multi-functional compaction instrument for several pharmaceutical excipients and actual tablet formulations. Int. J. Pharm. 2016, 510, 195–202. [Google Scholar] [CrossRef]
  43. Maynard, R.N. A method for removing titanium dioxide impurities from kaolin. Clays Clay Miner. 1969, 17, 59–62. [Google Scholar] [CrossRef]
  44. Conley, R.F. Practical Dispersion: A Guide to Understanding and Formulating Slurries; John Wiley & Sons: Hoboken, NJ, USA, 1996; p. 464. [Google Scholar]
  45. Hammouda, I.; Mihoubi, D. Thermodynamic and mechanical characterisation of kaolin clay. Pol. J. Chem. Technol. 2014, 16, 28–35. [Google Scholar] [CrossRef] [Green Version]
  46. Moore, D.M.; Reynolds, R.C. X-ray Diffraction and the Identification and Analysis of Clay Minerals; Oxford University Press: Oxford, UK, 1989; p. 332. [Google Scholar]
  47. López-Galindo, A.; Torres-Ruiz, J.; Gonzalez-López, J.M. Mineral quantification in sepiolite-palygorskite deposits using X-ray diffraction and chemical data. Clay Miner. 1996, 31, 217–224. [Google Scholar] [CrossRef]
  48. Hinckley, D.N. Mineralogical and chemical variations in the kaolin deposits of the coastal plain of Georgia and South Carolina. Am. Mineral. 1965, 50, 1865–1883. [Google Scholar]
  49. Martín-Ramos, J.D. X-Powder, a Software Package for Powder X-ray Diffraction Analysis. Legal Deposit GR. 1001/04. 2004. Available online: http://www.xpowder.com (accessed on 10 November 2019).
  50. Rodriguez-Navarro, C.; Ruiz-Agudo, E.; Ortega-Huertas, M.; Hansen, E. Nanostructure and irreversible colloidal behavior of Ca(OH)2: Implications in cultural heritage conservation. Langmuir 2005, 21, 10948–10957. [Google Scholar] [CrossRef]
  51. QAS/11-450. Bulk Density and Tapped Density of Powders. World Health Organization Monograph on Specifications for Pharmaceutical Preparations. 2012. Available online: https://www.who.int/medicines/publications/pharmacopoeia/Bulk-tapped-densityQAS11_450FINAL_MODIFIEDMarch2012.pdf (accessed on 21 November 2019).
  52. Djuris, J.; Medarevic, D.; Krstic, M.; Djuric, Z.; Ibric, S. Application of quality by design concepts in the development of fluidized bed granulation and tableting processes. J. Pharm. Sci. 2013, 102, 1869–1882. [Google Scholar] [CrossRef]
  53. Hausner, H.H. Friction conditions in a mass of metal powder. Int. J. Powder Metall. 1967, 3, 7–13. [Google Scholar]
  54. Carr, R.L. Evaluating flow properties of solids. Chem. Eng. J. 1965, 72, 163–168. [Google Scholar]
  55. Osamura, T.; Takeuchi, Y.; Onodera, R.; Kitamura, M.; Takahashi, Y.; Tahara, K.; Takeuchi, H. Formulation design of granules prepared by wet granulation method using a multi-functional single-punch tablet press to avoid tableting failures. Asian J. Pharm. Sci. 2018, 13, 113–119. [Google Scholar] [CrossRef]
  56. Kotłowska, H.; Sznitowska, M. Development of orodispersible minitablets with lorazepam using Gamlen Tablet Press. Int. J. Pharm. 2018, 536, 502. [Google Scholar] [CrossRef]
  57. Osamura, T.; Takeuchi, Y.; Onodera, R.; Kitamura, M.; Takahashi, Y.; Tahara, K.; Takeuchi, H. Prediction of effects of punch shapes on tableting failure by using a multi-functional single-punch tablet press. Asian J. Pharm. Sci. 2017, 12, 412–417. [Google Scholar] [CrossRef]
  58. Adamis, Z.; Williams, R.B. International Programme on Chemical Safety. Bentonite, Kaolin and Selected Clay Minerals. World Health Organization, 2005. Available online: https://apps.who.int/iris/handle/10665/43102 (accessed on 21 November 2019).
  59. ICH-Q3D. ICH Guideline Q3D on Elemental Impurities. European Medicines Agency, 2014. Available online: https://www.ema.europa.eu/en/documents/scientific-guideline/international-conference-harmonisation-technical-requirements-registration-pharmaceuticals-human-use_en-13.pdf (accessed on 21 November 2019).
  60. Kakali, G.; Perraki, T.; Tsivilis, S.; Badogiannis, E. Thermal treatment of kaolin: The effect of mineralogy on the pozzolanic activity. Appl. Clay Sci. 2001, 20, 73–80. [Google Scholar] [CrossRef]
  61. Wardhana, Y.W.; Hasanah, A.N.; Primandini, P. Deformation and adsorption capacity of kaolin that is influenced by temperature variation on calcination. Int. J. Pharm. Pharm. Sci. 2014, 6, 78–5867. [Google Scholar]
  62. York, P. Particle slippage and rearrangement during compression of pharmaceutical powders. J. Pharm. Pharmacol. 1978, 30, 6–10. [Google Scholar] [CrossRef] [PubMed]
  63. Goh, H.P.; Heng, P.W.S.; Liew, C.V. Comparative evaluation of powder flow parameters with reference to particle size and shape. Int. J. Pharm. 2018, 547, 133–141. [Google Scholar] [CrossRef]
  64. Rowe, R.C.; Sheskey, P.J.; Cook, W.G.; Fenton, M.E. (Eds.) Handbook of Pharmaceutical Excipients, 7th ed.; APhA/Pharmaceutical Press: London, UK, 2012; p. 1064. [Google Scholar]
  65. Chandrasekhar, S.; Ramaswamy, S. Influence of mineral impurities on the properties of kaolin and its thermally treated products. Appl. Clay Sci. 2002, 21, 133–142. [Google Scholar] [CrossRef]
  66. Bayor, M.T.; Tuffour, E.; Lambon, P.S. Evaluation of starch from new sweet potato genotypes for use as a pharmaceutical diluent, binder or disintegrant. J. Appl. Pharm. Sci. 2013, 3, S17–S23. [Google Scholar]
  67. Sun, C.C. True density of microcrystalline cellulose. J. Pharm. Sci. 2005, 94, 2132–2134. [Google Scholar] [CrossRef]
  68. Capece, M.; Silva, K.R.; Sunkara, D.; Strong, J.; Gao, P. On the relationship of inter-particle cohesiveness and bulk powder behavior: Flowability of pharmaceutical powders. Int. J. Pharm. 2016, 511, 178–189. [Google Scholar] [CrossRef]
  69. Neumann, B.S. The flow properties of powders. In Advances in Pharmaceutical Sciences; Bean, H.S., Beckett, A.H., Carless, J.E., Eds.; Academic Press: London, UK, 1967; Volume II, pp. 181–221. [Google Scholar]
  70. Sun, C.; Grant, D.J. Effects of initial particle size on the tableting properties of l-lysine monohydrochloride dihydrate powder. Int. J. Pharm. 2001, 215, 221–228. [Google Scholar] [CrossRef]
  71. Shah, U.V.; Karde, V.; Ghoroi, C.; Heng, J.Y.Y. Influence of particle properties on powder bulk behaviour and processability. Int. J. Pharm. 2017, 518, 138–154. [Google Scholar] [CrossRef] [PubMed]
  72. Rouquerol, J.; Avnir, D.; Fairbridge, C.W.; Everett, D.H.; Haynes, J.M.; Pernicone, N.; Ramsay, J.D.F.; Sing, K.S.W.; Unger, K.K. Recommendations for the characterization of porous solids. Pure Appl. Chem. 1994, 66, 1739–1758. [Google Scholar] [CrossRef]
  73. Keleṣ, Ö.; Barcenas, N.P.; Sprys, D.H.; Bowman, K.J. Effect of porosity on strength distribution of microcrystalline cellulose. AAPS PharmSciTech 2015, 16, 1455–1464. [Google Scholar] [CrossRef] [PubMed] [Green Version]
  74. Gong, X.; Chang, S.Y.; Osei-Yeboah, F.; Paul, S.; Perumalla, S.R.; Shi, L.; Sun, W.; Zhou, Q.; Sun, C.C. Dependence of tablet brittleness on tensile strength and porosity. Int. J. Pharm. 2015, 493, 208–213. [Google Scholar] [CrossRef] [PubMed]
  75. Ford, J. Thermal analysis of hydroxypropylmethylcellulose and methylcellulose: Powders, gels and matrix tablets. Int. J. Pharm. 1999, 179, 209–228. [Google Scholar] [CrossRef]
  76. Pirayavaraporn, C.; Rades, T.; Tucker, I.G. Determination of moisture content in relation to thermal behaviour and plasticization of Eudragit RLPO. Int. J. Pharm. 2012, 422, 68–74. [Google Scholar] [CrossRef]
  77. Krok, A.; Vitorino, N.; Zhang, J.; Frade, J.R.; Wu, C.Y. Thermal properties of compacted pharmaceutical excipients. Int. J. Pharm. 2017, 534, 119–127. [Google Scholar] [CrossRef]
  78. Mielenz, R.C.; Schieltz, N.C.; King, M.E. Thermogravimetric analysis of clay and clay-like minerals. Clays Clay Miner. 1953, 2, 285–314. [Google Scholar] [CrossRef]
  79. Koopman, D.E. Thermal analysis of kaolin clays: Correlation with X-ray crystallinity data. In Analytical Calorimetry; Porter, R.S., Johnson, J.F., Eds.; Springer: Berlin/Heidelberg, Germany, 1968; pp. 189–194. [Google Scholar]
  80. Tomasetta, I.; Barletta, D.; Poletto, M. The effect of temperature on flow properties of fine powders. Chem. Eng. Trans. 2011, 24, 655–660. [Google Scholar]
Figure 1. Representative average data of tableting profiles: (a) compression; (b) detachment and; (c) ejection processes.
Minerals 10 00023 g001
Figure 2. X-ray diffractograms showing kaolinite structural changes between the precursor (dried at 70 °C) and the dehydrated (heated up to 400 °C) kaolin powders.
Minerals 10 00023 g002
Figure 3. Relationship between kaolinite structural characteristics with observed shifting upon thermal changes.
Minerals 10 00023 g003
Figure 4. SEM and TEM (upper right views) images showing microtextural characteristics and particles micromorphology of the studied kaolin powder samples.
Minerals 10 00023 g004
Figure 5. Laser volume-based particle size distribution frequency and cumulative curves of the studied kaolin powder samples.
Minerals 10 00023 g005
Figure 6. BJH-measured pore size distribution cumulative curves of the studied kaolin powder samples.
Minerals 10 00023 g006
Figure 7. Dehydration-dehydroxylation thermograms (TG%) and differential thermal analysis (DTA) curves of the studied kaolin powder samples (25–400 °C).
Minerals 10 00023 g007
Figure 8. Dehydration thermal mass balance curves indicating moisture contents and mass loss rates (TG%) of the measured kaolin powder samples (25–400 °C).
Minerals 10 00023 g008
Figure 9. The relationship between the flow parameters HR versus CI of the studied kaolin powders, showing significant flowability improvements with the thermal effect.
Minerals 10 00023 g009
Figure 10. Mutual interrelationships of the tableting parameters (ER, ES, TFS) and against tablet hardness (H) of the studied compressed kaolin powder samples.
Minerals 10 00023 g010aMinerals 10 00023 g010b
Figure 11. Influence of kaolinite crystallinity (HI) and flowability (HR) on the tableting properties of the studied kaolin powder samples.
Minerals 10 00023 g011
Table 1. Chemical and mineralogical compositions of the purified kaolin powder samples.
SampleSiO2Al2O3TiO2Fe2O3MgOCaONa2OK2OLOIAl2O3/
SiO2
Kaolinite %Illite %Quartz %Anatase %
N-243.1136.821.10.600.130.040.260.0117.910.8599--1
K-343.1335.850.50.540.180.040.260.4418.990.8395311
F-243.0436.841.20.740.060.060.040.0117.920.8598-11
D-642.8636.411.120.710.060.040.080.0218.570.8598-11
LOI: loss on ignition.
Table 2. Kaolinite structural characteristics (crystallite size and order-disorder degree), bulk and tapped density values and flowability parameters of the studied dried (at 70 °C) and dehydrated (at 400 °C) kaolin powders.
Sample
Code
Heating ConditionsCrystallite Size D001 (nm)Hinckley IndexBulk Density (g/mL) ± 0.01Tapped Density (g/mL) ± 0.01Direct Flowability (g/s) ± 0.1Carr’s Index ± 0.01Hausner Ratio ± 0.01Flow Character
N-270 °C (2 h)441.500.550.812.6432.001.47Poor
400 °C
(10 °C/min)
370.910.660.763.7412.501.14Good
K-370 °C (2 h)391.330.510.812.0536.671.58Poor
400 °C
(10 °C/min)
340.830.660.712.568.001.09Excellent
F-270 °C (2 h)310.450.640.832.0622.501.29Very poor
400 °C
(10 °C/min)
260.590.640.753.5115.381.18Good
D-670 °C (2 h)300.270.540.672.0420.001.25Very poor
400 °C
(10 °C/min)
250.480.500.623.8519.171.24Fair
Table 3. Particle size distribution, porosity and moisture content by TG (mass loss % within the temperature range 25–400 °C) of the studied kaolin powder samples.
Sample CodeParticle Size DistributionCumulative Pore Volume
(BJH) cm3/g
Mass Loss
TG %
(at 400 °C)
<1 μm1–4 μm 4–10 μm >10 μmD10
μm
D50
μm
D90
μm
Span
N-255.22 35.874.464.450.420.873.673.740.1360−3.98
K-359.9335.113.181.780.420.832.502.510.0640−4.95
F-260.0835.452.232.240.420.842.252.180.0951−5.82
D-662.2434.011.891.860.420.812.152.140.1096−2.98
Table 4. Tableting parameters estimated to each seven tablets manufactured from the four representative kaolin powder samples.
Tableting and Tablet ParametersN-2K-3F-2D-6Commercial Kaolin
Elastic Recovery (%) “Compressibility”25.61 ± 0.1925.43 ± 0.1823.51 ± 0.1121.74 ± 0.2130.92 ± 0.21
Ejection Stress ES (MPa) “Manufacturability”8.28 ± 0.037.85 ± 0.178.67 ± 0.1611.45 ± 0.154.01 ± 0.17
Tensile Fracture Stress TFS (MPa) “Compactability”2.04 ± 0.021.85 ± 0.022.09 ± 0.022.32 ± 0.021.16 ± 0.04
Compression Energy Ec (N.m)1.88 ± 0.011.83 ± 0.011.81 ± 0.011.99 ± 0.041.58 ± 0.02
Detachment Stress DS (MPa)8.19 ± 0.027.61 ± 0.039.56 ± 0.048.65 ± 0.038.24 ± 0.07
Detachment Energy ED (N.m)1.80 ± 0.011.71 ± 0.021.93 ± 0.041.80 ± 0.030.76 ± 0.06
Ejection Energy (N.m)0.26 ± 0.010.23 ± 0.030.34 ± 0.030.43 ± 0.050.07 ± 0.01
Tablet Hardness H (N)36.67 ± 0.433.00 ± 0.738.33 ± 0.5844.00 ± 0.718.67 ± 0.58
Tablet Diameter (mm)6.02 ± 0.016.04 ± 0.036.04 ± 0.016.05 ± 0.026.03 ± 0.02
Tablet Thickness (mm)1.9 ± 0.011.88 ± 0.031.93 ± 0.062.00 ± 0.011.70 ± 0.01
Table 5. Correlation matrix showing all the interrelated structural, micrometric, moisture, flowability and tableting parameters of the studied kaolin powder samples.
ParametersERESTFSHEcHRCI D50SpanPSD < 1 μ %HID001TG%BJH
ER1.00
ES−0.921.00
TFS−0.890.931.00
H−0.920.951.001.00
Ec−0.650.890.800.801.00
HR−0.930.920.990.990.711.00
CI−0.900.880.980.980.680.991.00
D500.75−0.68−0.42−0.49−0.47−0.48−0.401.00
Span0.72−0.47−0.32−0.38−0.09−0.44−0.390.881.00
PSD < 1 μ %−0.790.630.430.500.330.510.45−0.97−0.961.00
HI0.98−0.82−0.79−0.83−0.47−0.86−0.840.770.83−0.841.00
D0010.93−0.72−0.71−0.75−0.33−0.80−0.780.730.86−0.840.991.00
TG%0.39−0.72−0.61−0.61−0.95−0.50−0.460.27−0.17−0.090.190.031.00
BJH−0.080.280.520.460.440.430.490.520.62−0.550.070.15−0.501.00
ER: elastic recovery (%); ES: ejection stress (MPa); TFS: tensile fracture stress (MPa); H: tablet hardness (N); Ec: compression energy (N.m); HR: Hausner Ratio; CI: Carr’s Index; D50: the median particle size; Span: particle size homogeneity assessment parameter [span = (D90D10)/D50]; PDS < 1 μ %: contents of the finer nanosized particle fractions; HI: Hinckley Index; D001: crystallite size; TG %: thermogravimetric mass loss % within temperature range 25–400 °C; BJH: cumulative pore volumes (cm3/g) determined by Barrett, Joyner and Halenda method.

