Activation of General Control Nonderepressible-2 Kinase Ameliorates Glucotoxicity in Human Peritoneal Mesothelial Cells, Preserves Their Integrity, and Prevents Mesothelial to Mesenchymal Transition

 ,
, 
 and
and 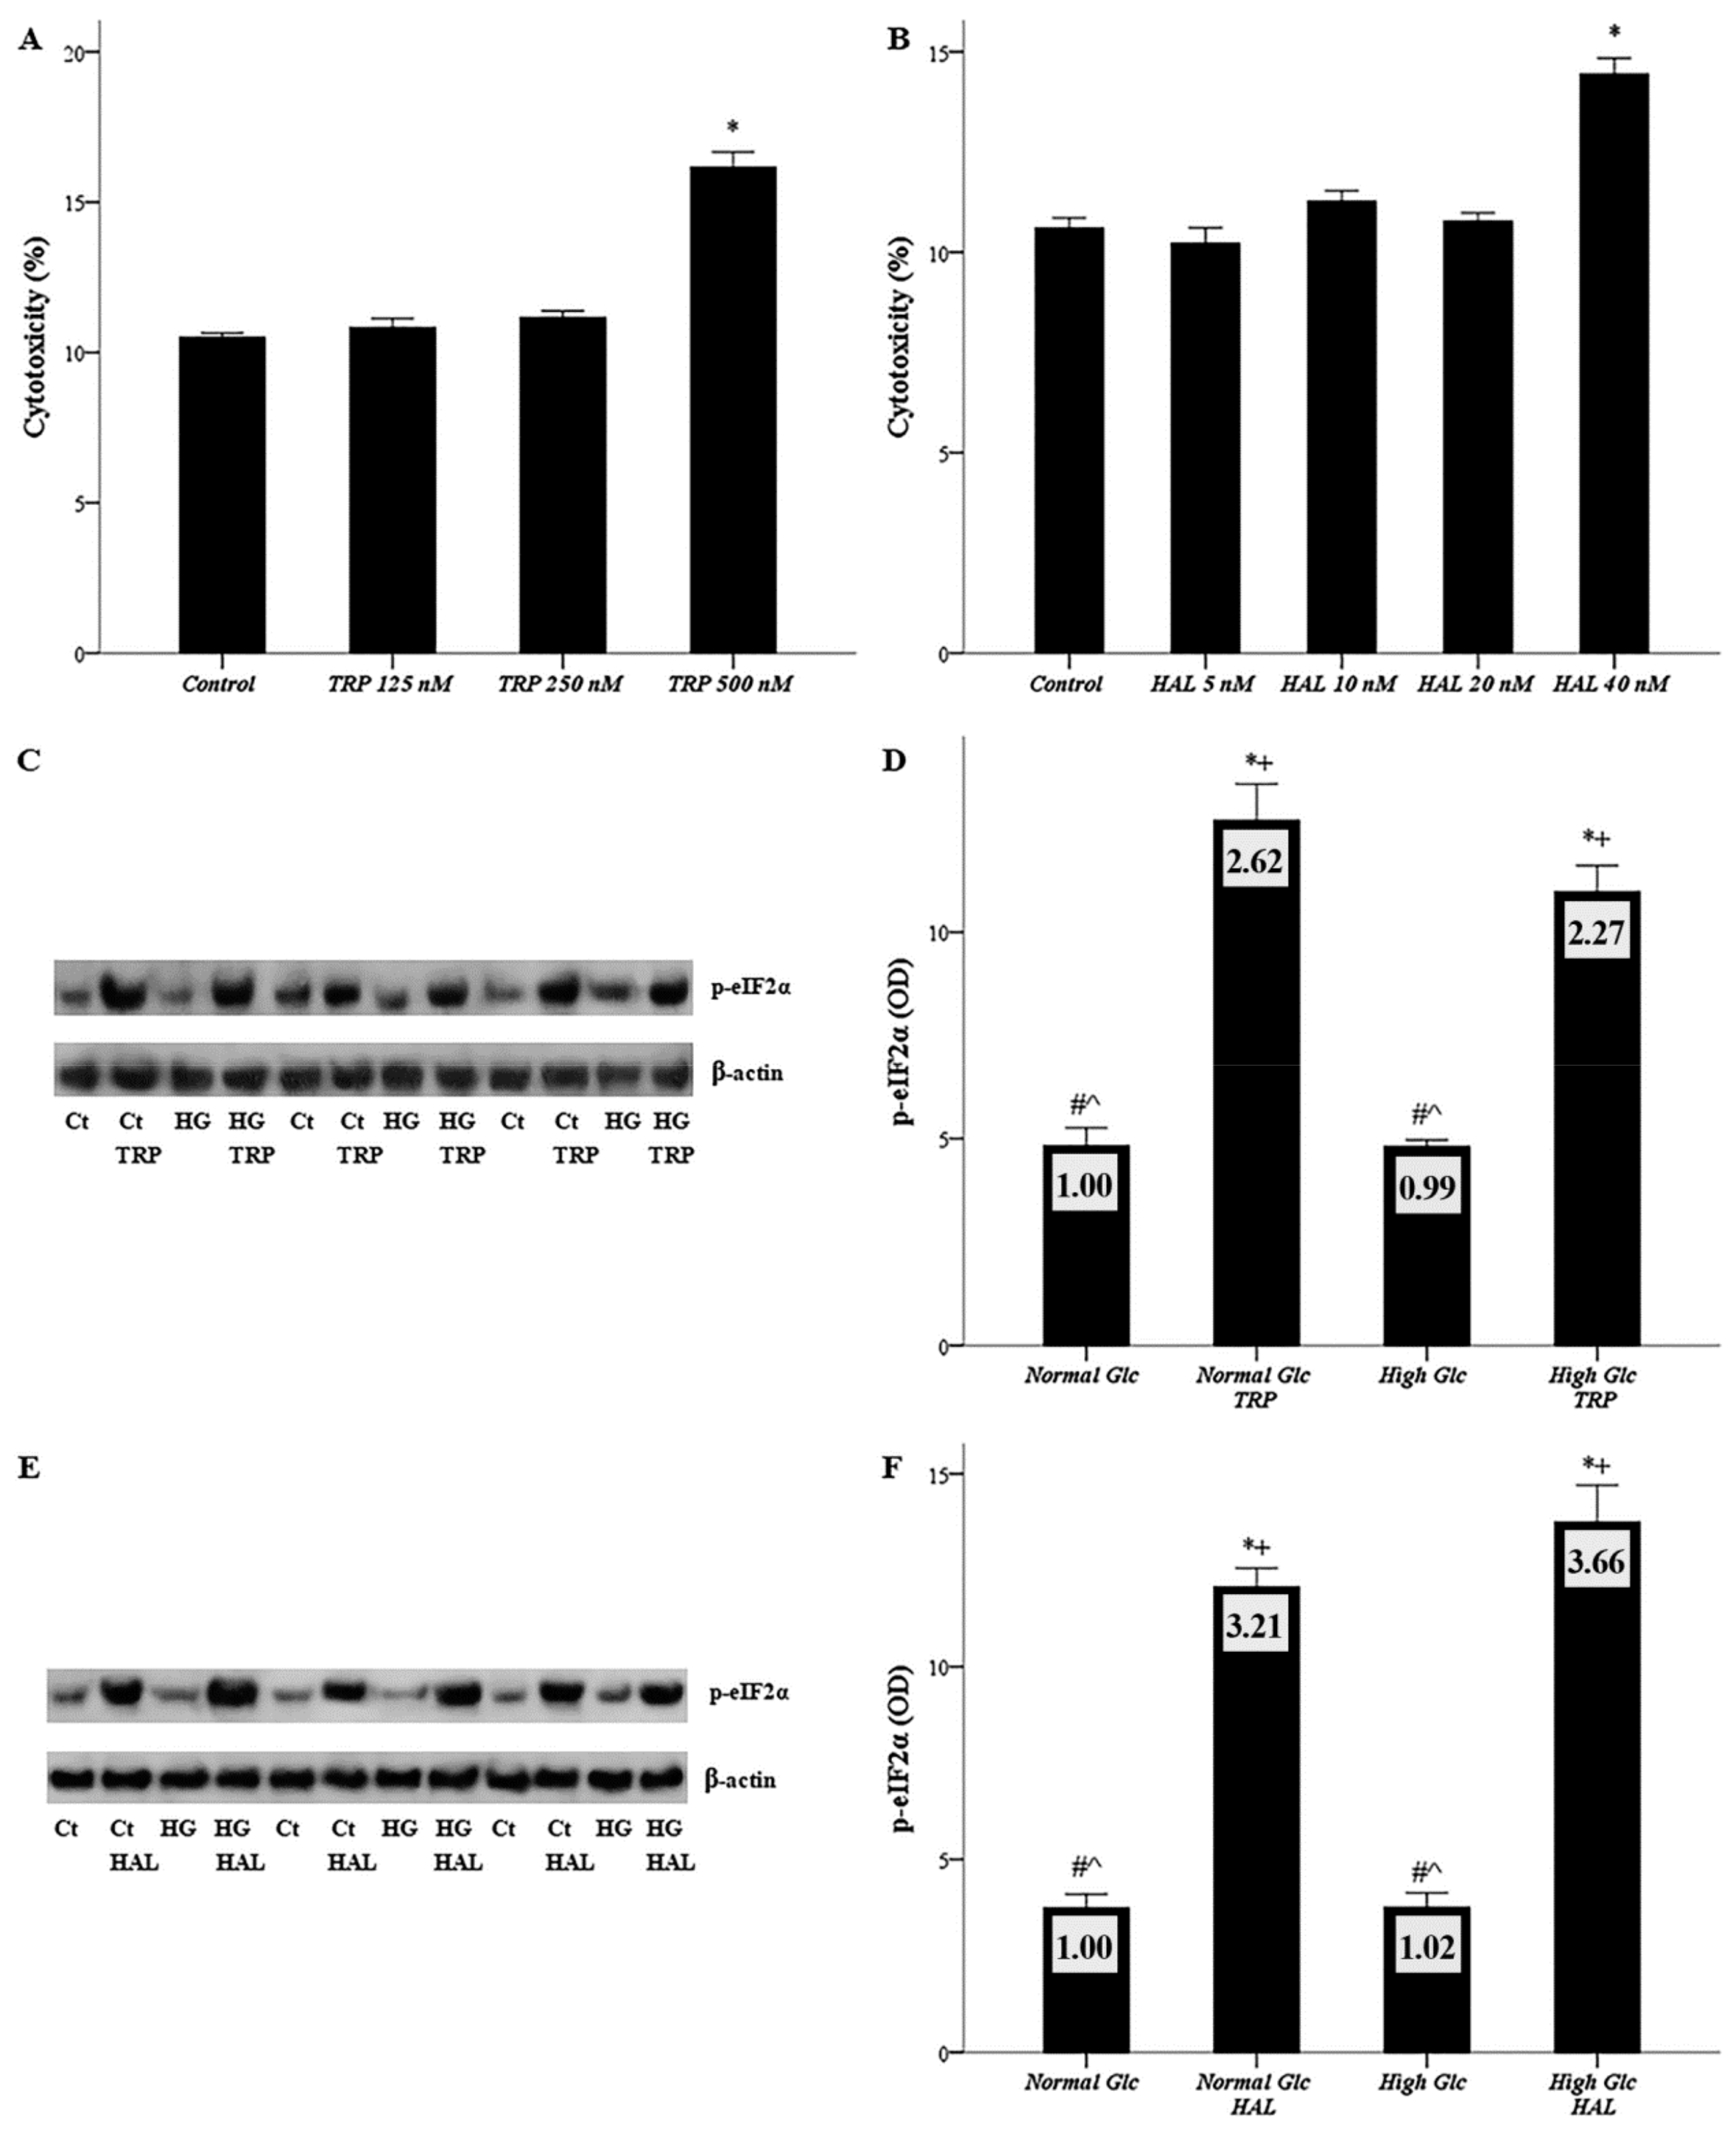
Abstract
1. Introduction
2. Materials and Methods
2.1. Cell Culture Conditions
2.2. Assessment of Halofuginone and Tryptophanol Cytotoxicity
2.3. Assessment of the Proteins of Interest
2.4. Assessment of D-Glucose Consumption and ROS Production
2.5. Assessment of GAPDH and PKC Activity
2.6. Assessment of D-Sorbitol and MGO Cellular Content
2.7. Assessment of TGF-β1 and IL-8 Production
2.8. Statistical Analysis
3. Results
3.1. Both Halofuginone and Tryptophanol, at Nontoxic Concentrations, Activate GCN2 Kinase
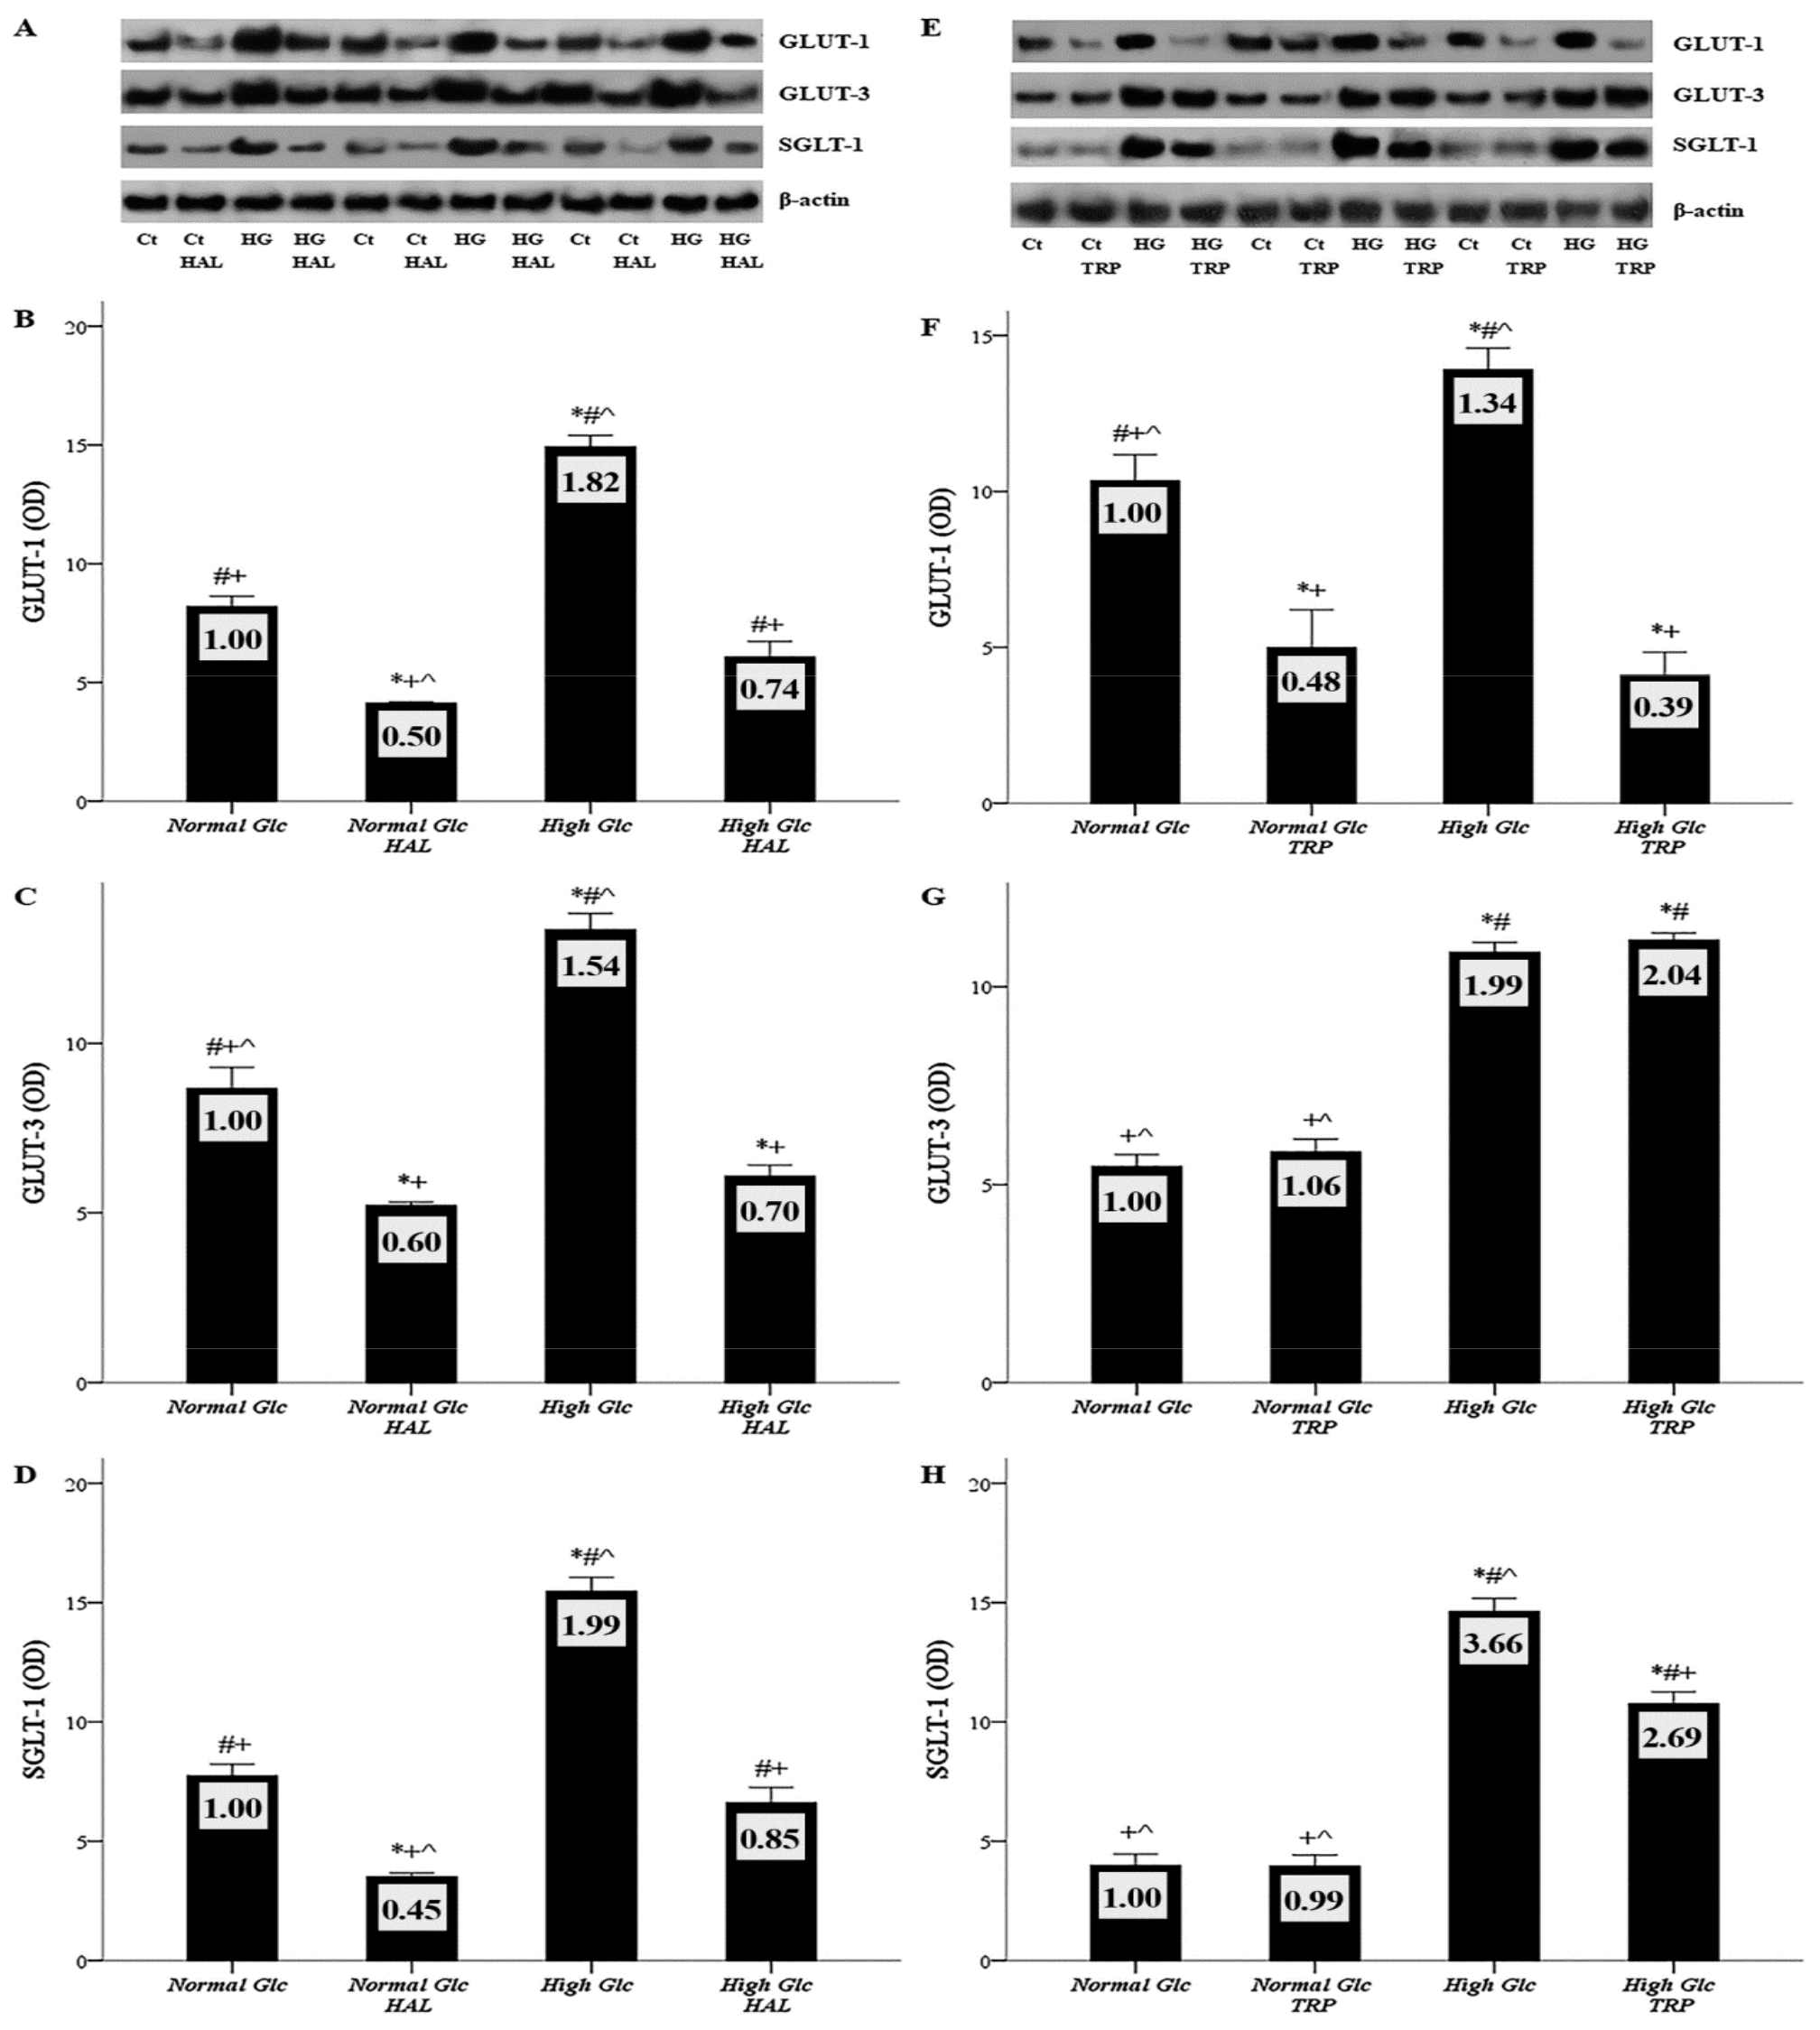
3.2. In Mesothelial Cells Cultured under High-Glucose Conditions, Halofuginone Reduces the Degree of GLUT-1, GLUT-3 and SGLT-1 Increment, and Tryptophanol Exerts a Similar Effect with the Exception of GLUT-3
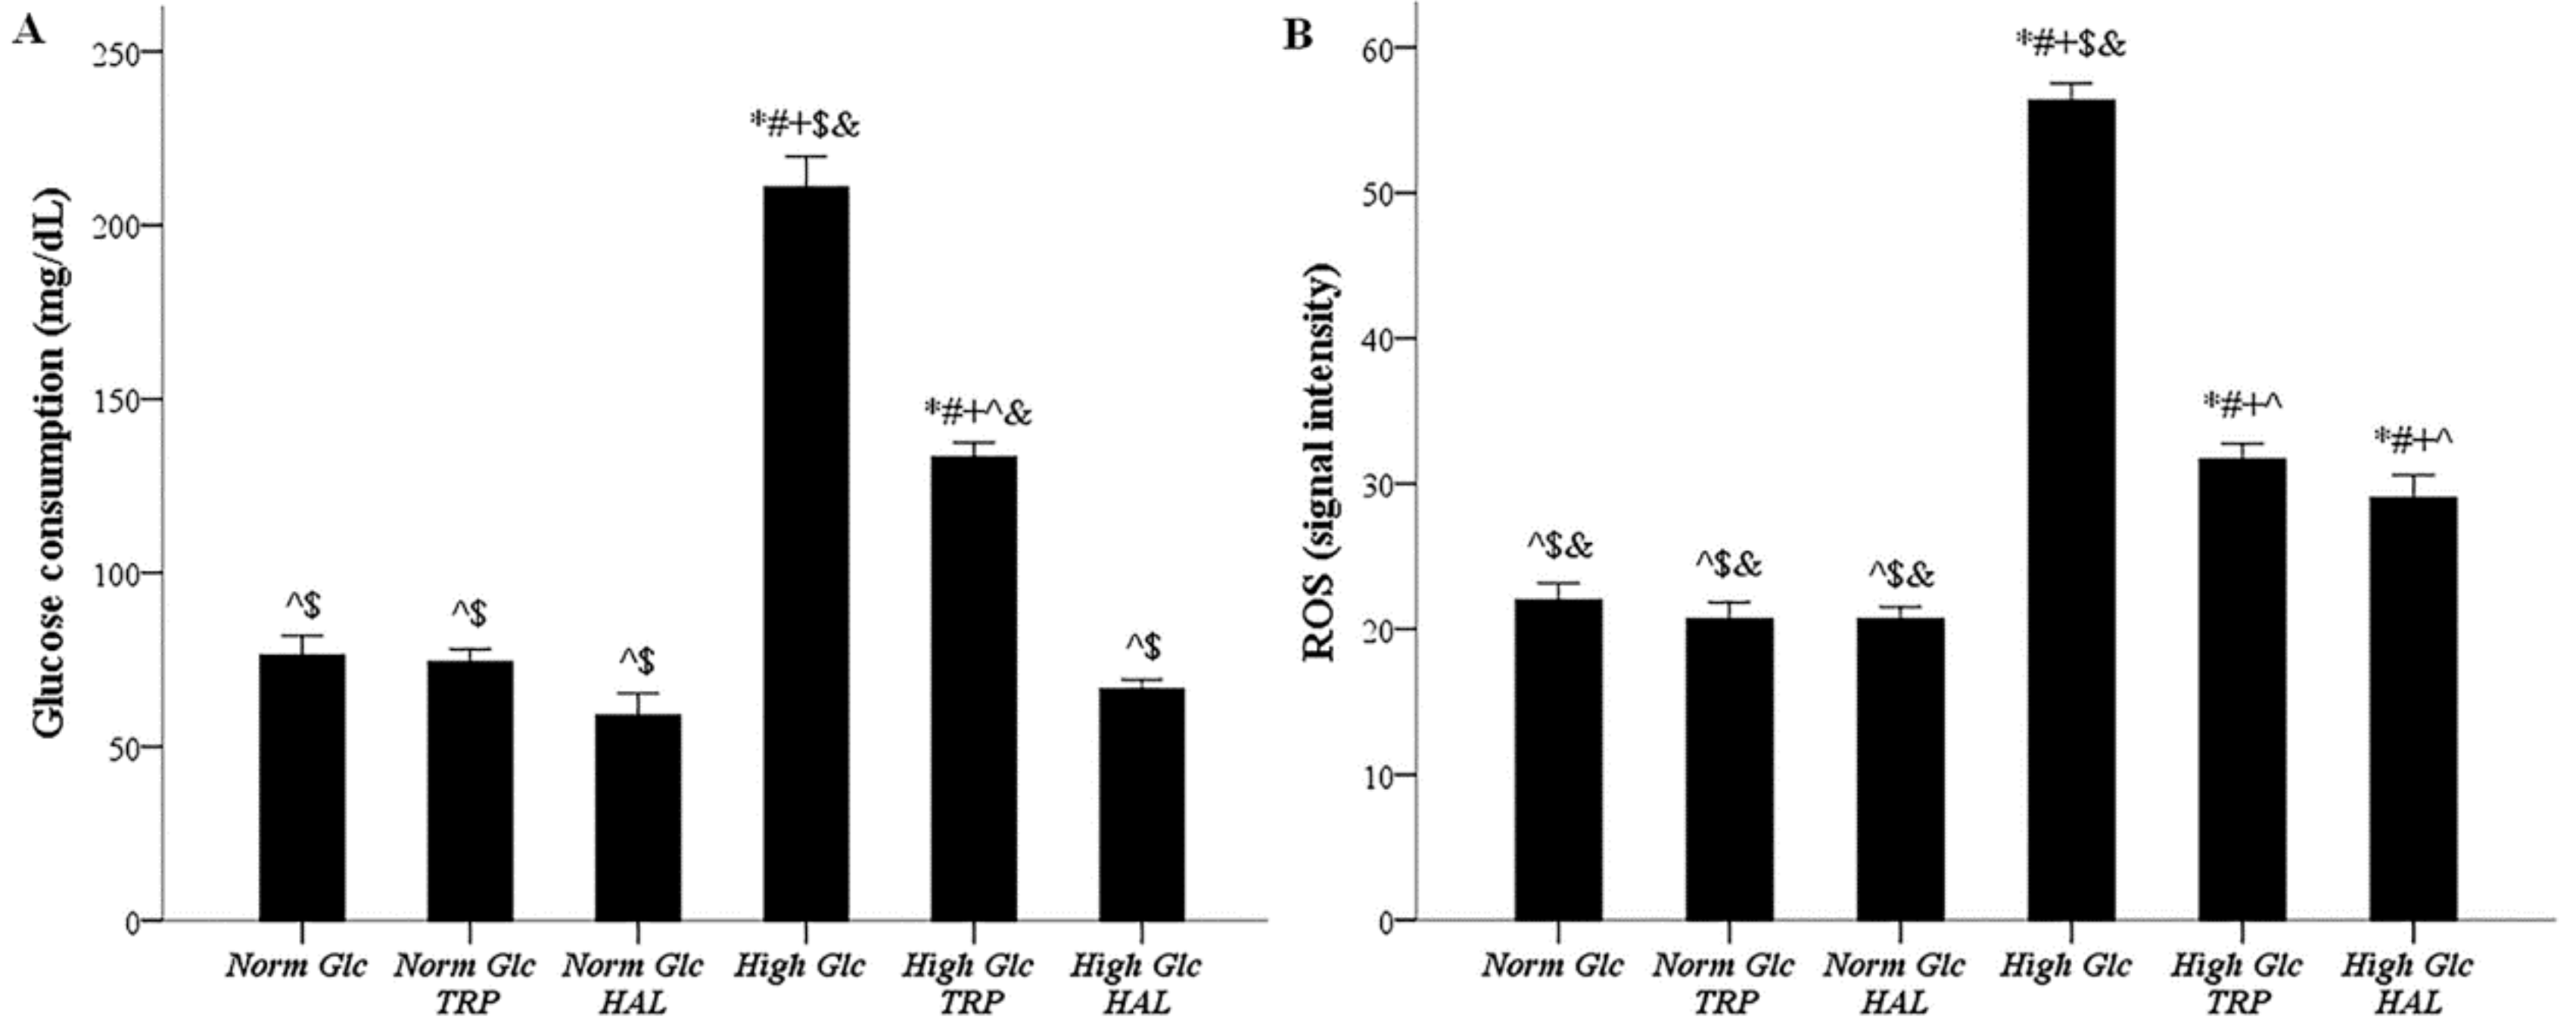
3.3. In Mesothelial Cells Cultured under High-Glucose Conditions, Both Tryptophanol and Halofuginone Decrease the Degree of Enhanced Glucose Consumption and ROS Production
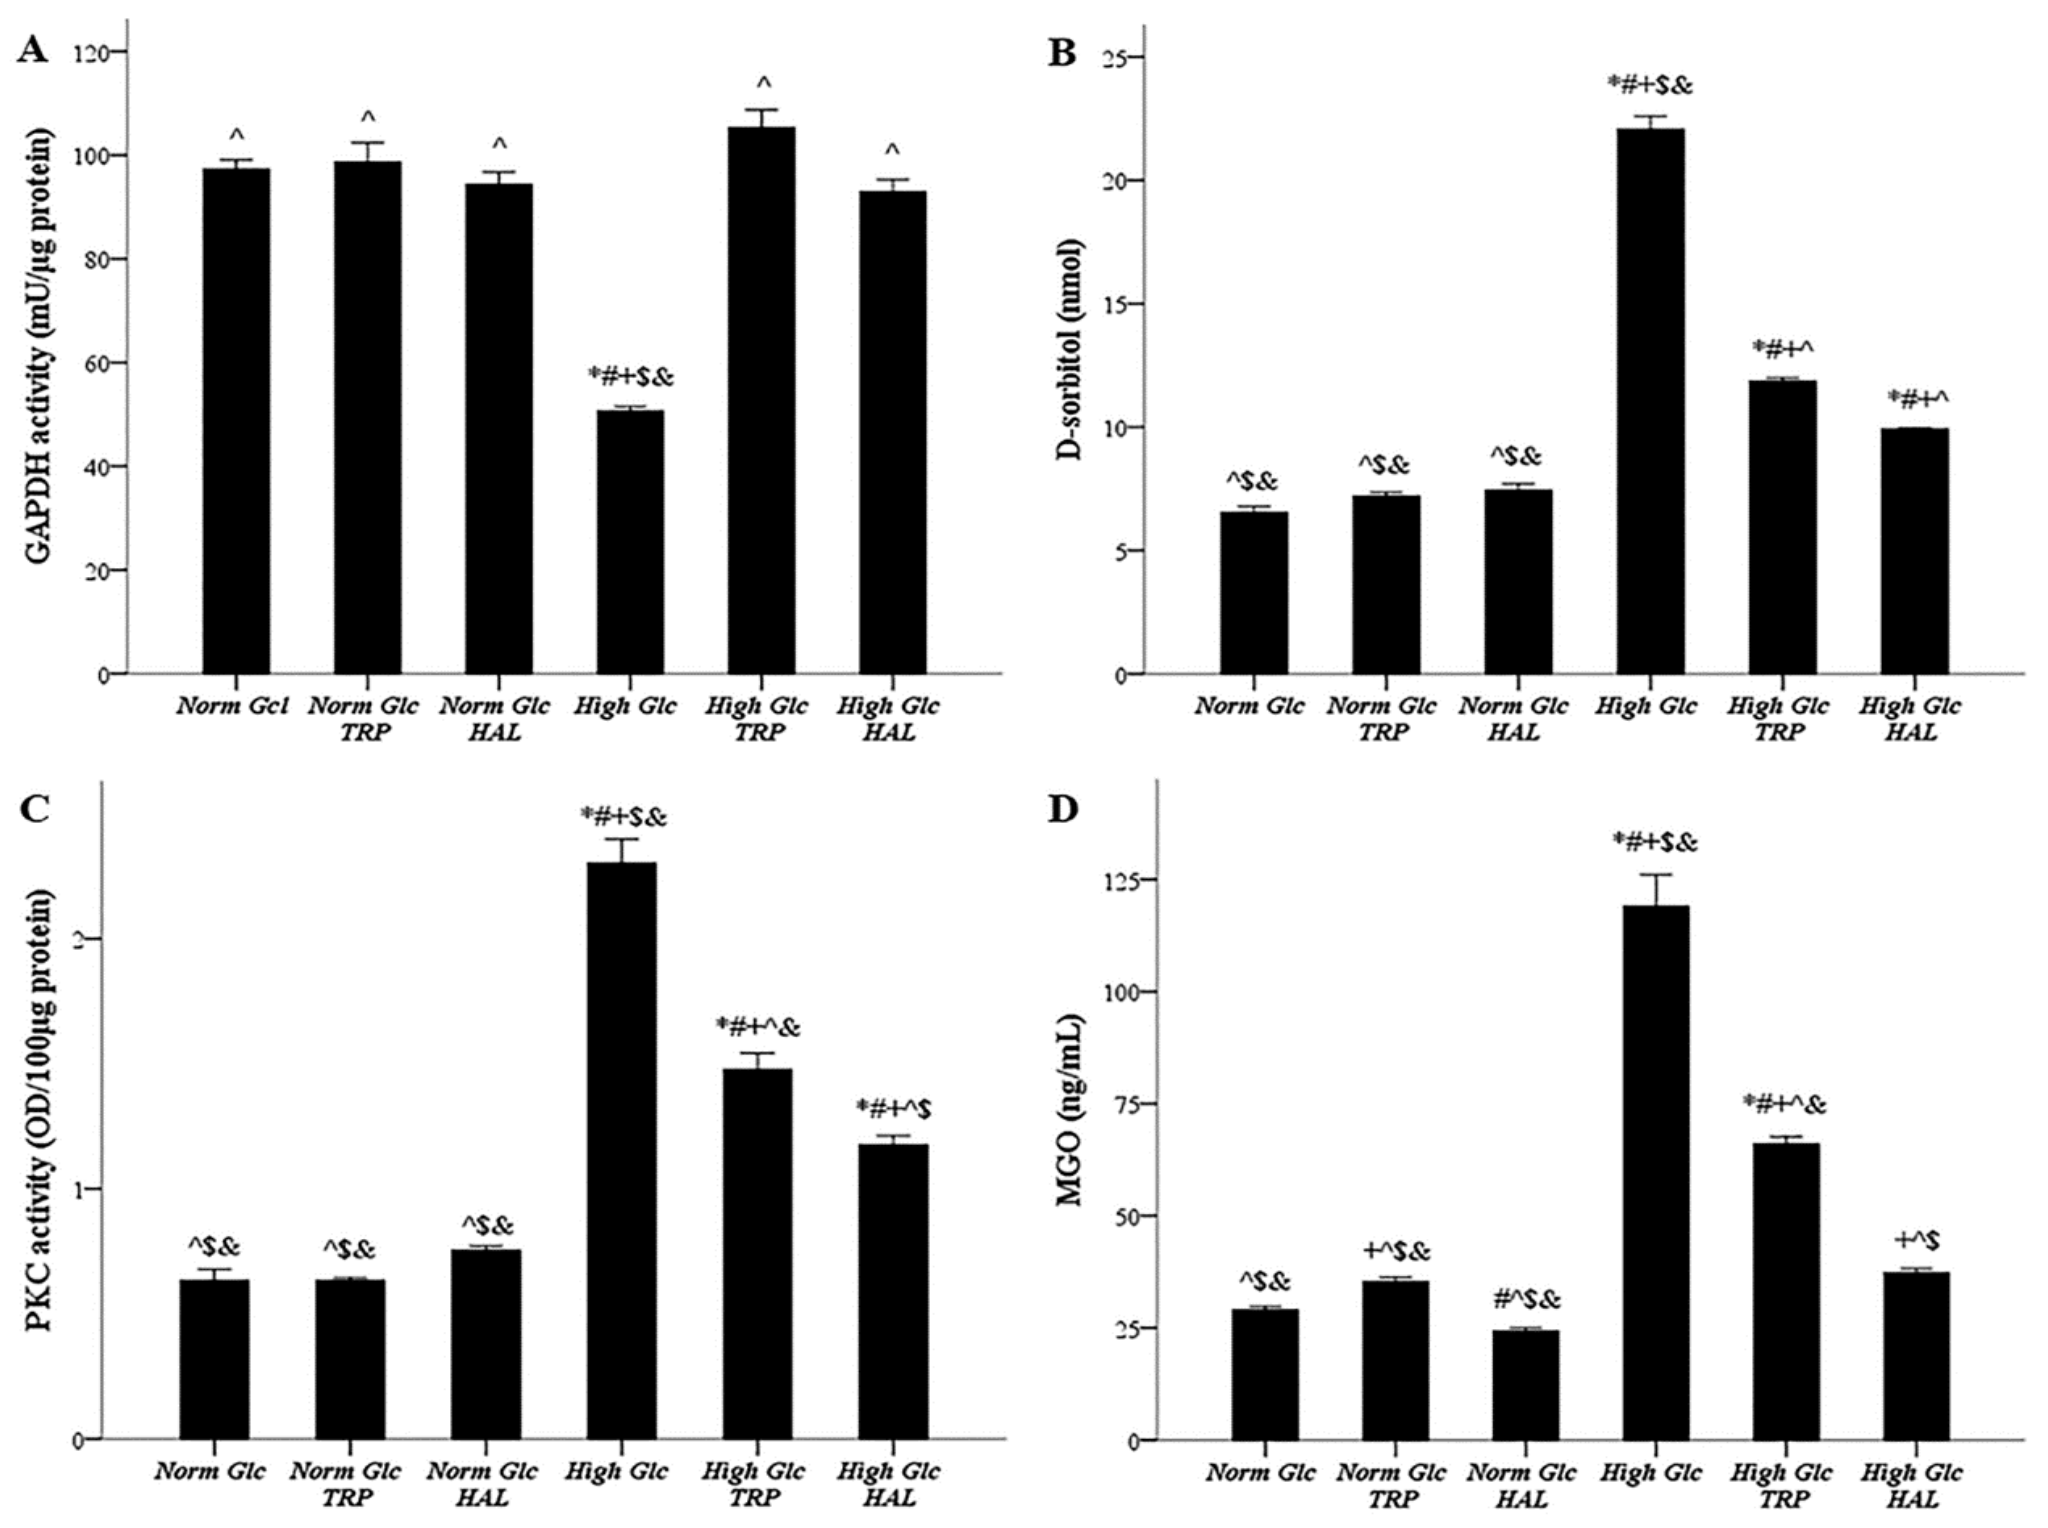
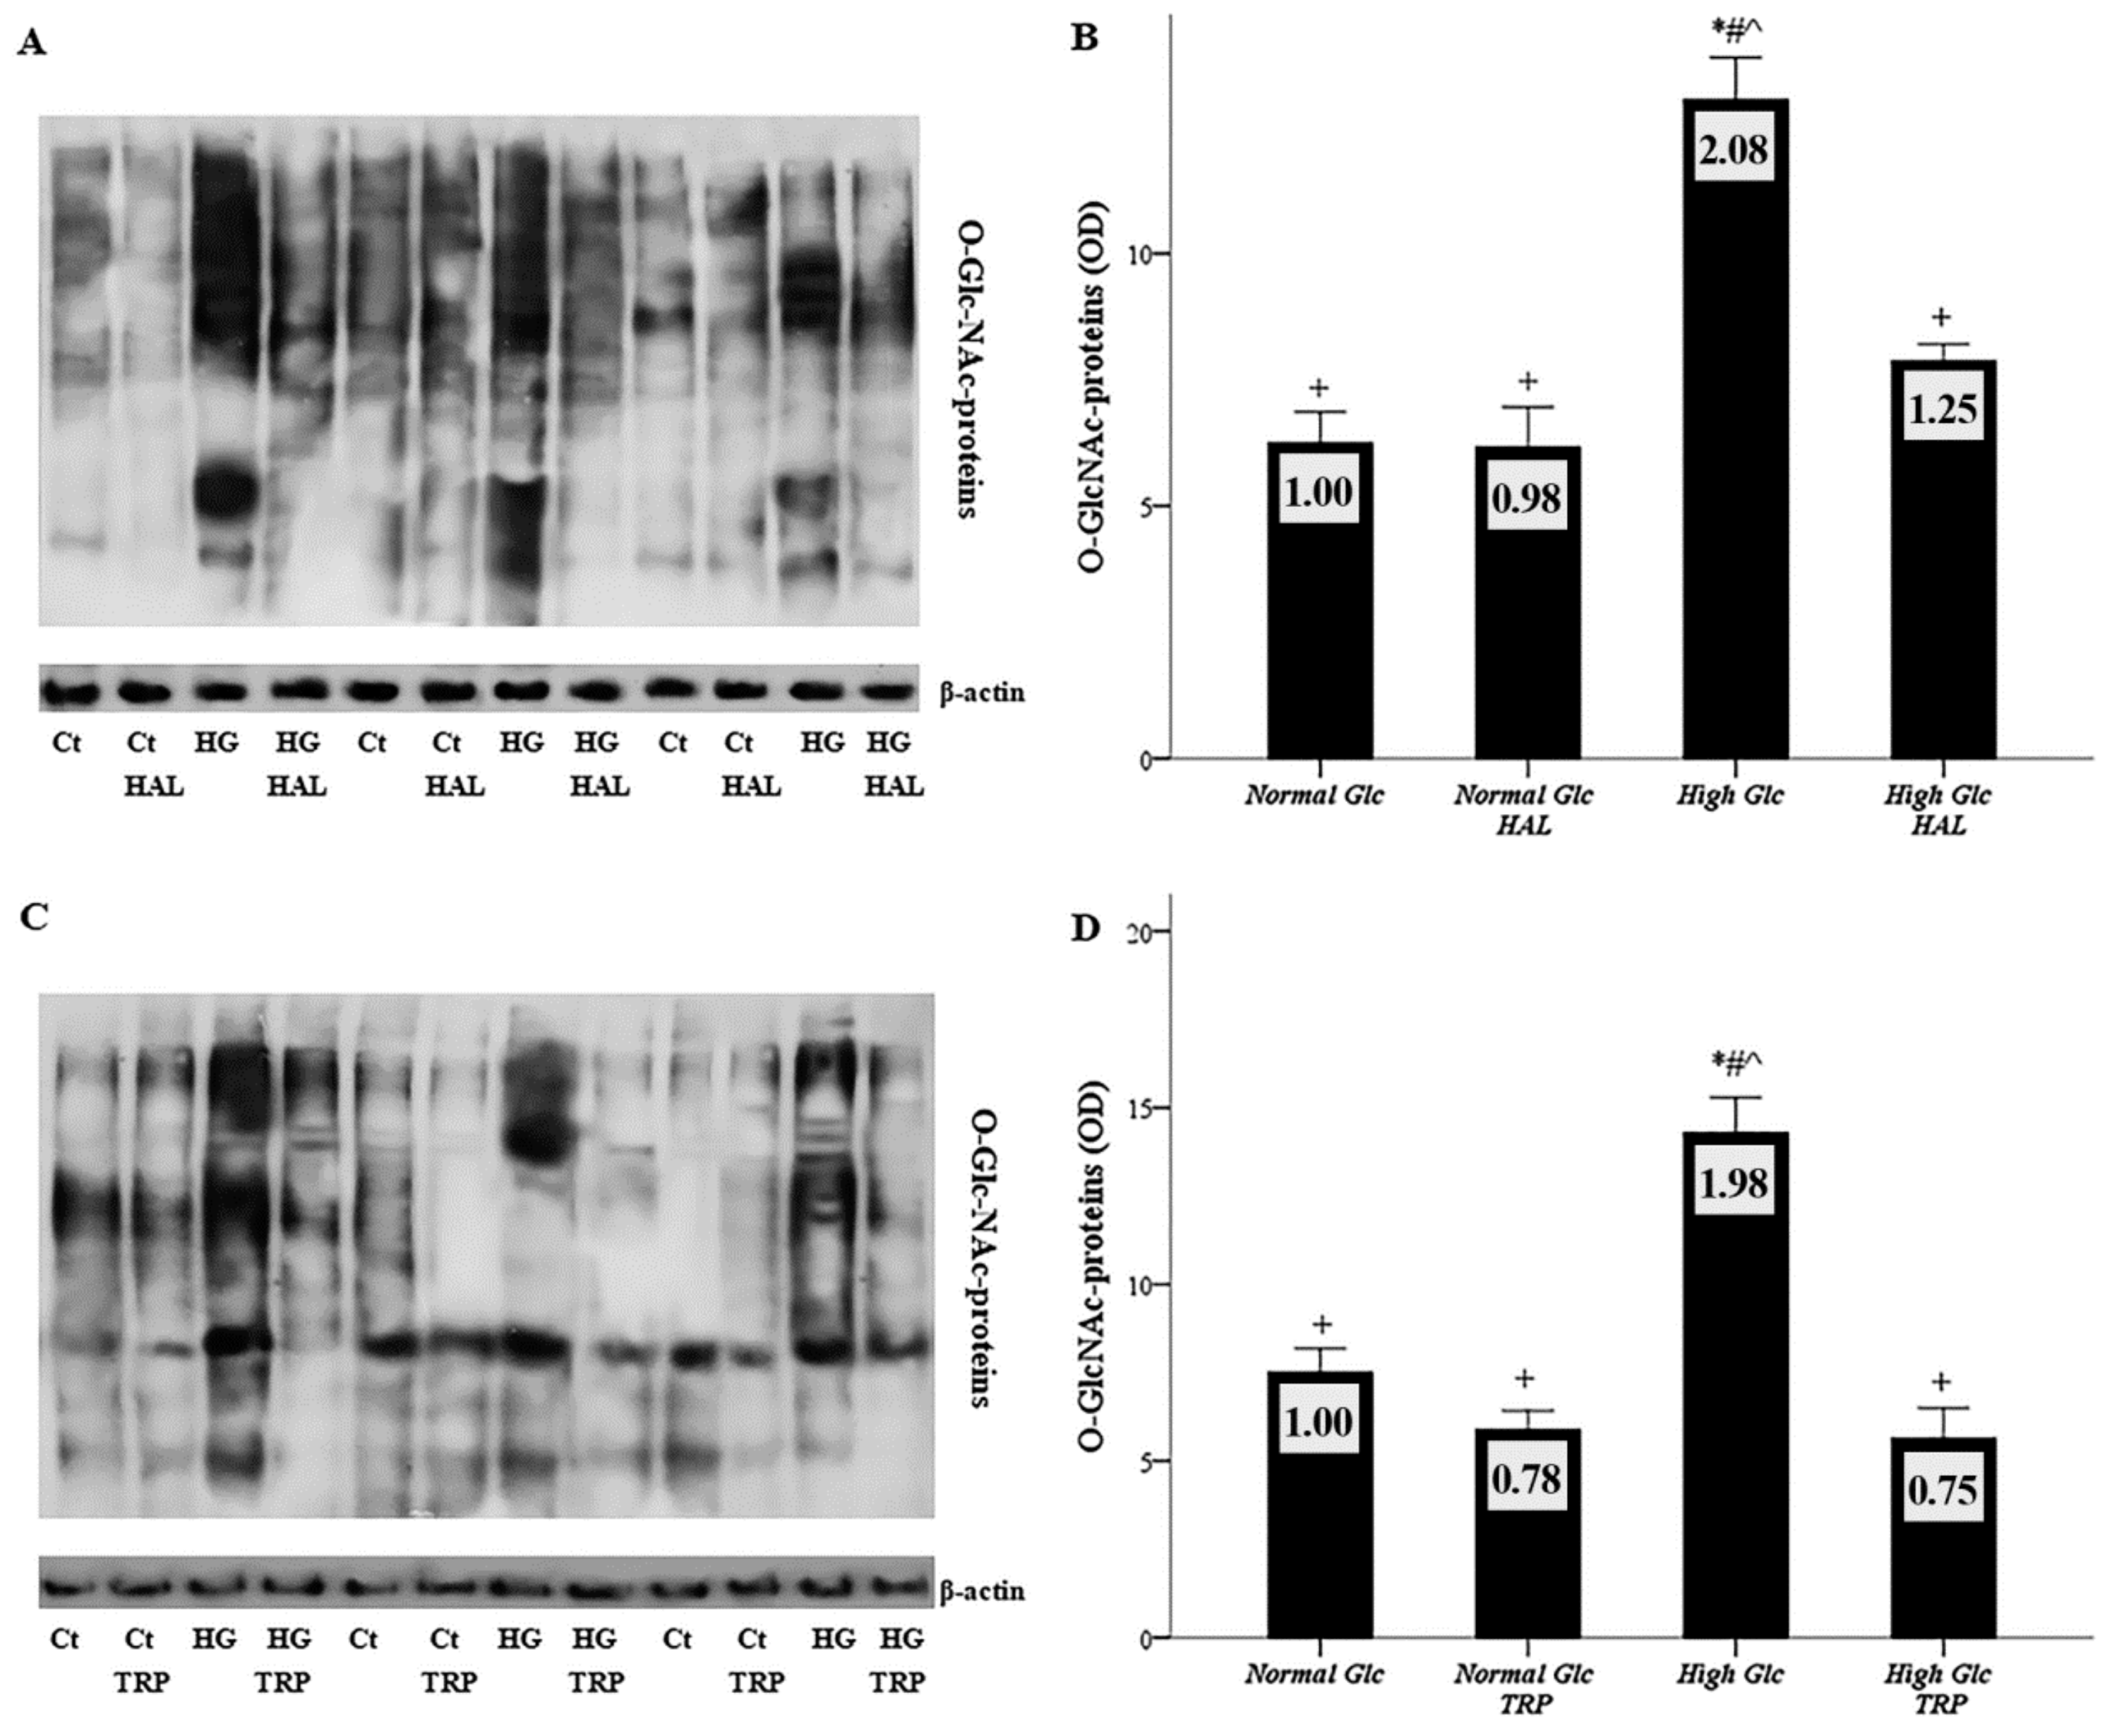
3.4. In Mesothelial Cells Cultured under High-Glucose Conditions, Both Tryptophanol and Halofuginone Prevent GAPDH Inhibition and Ameliorate the High-Glucose-Induced Noxious Pathways
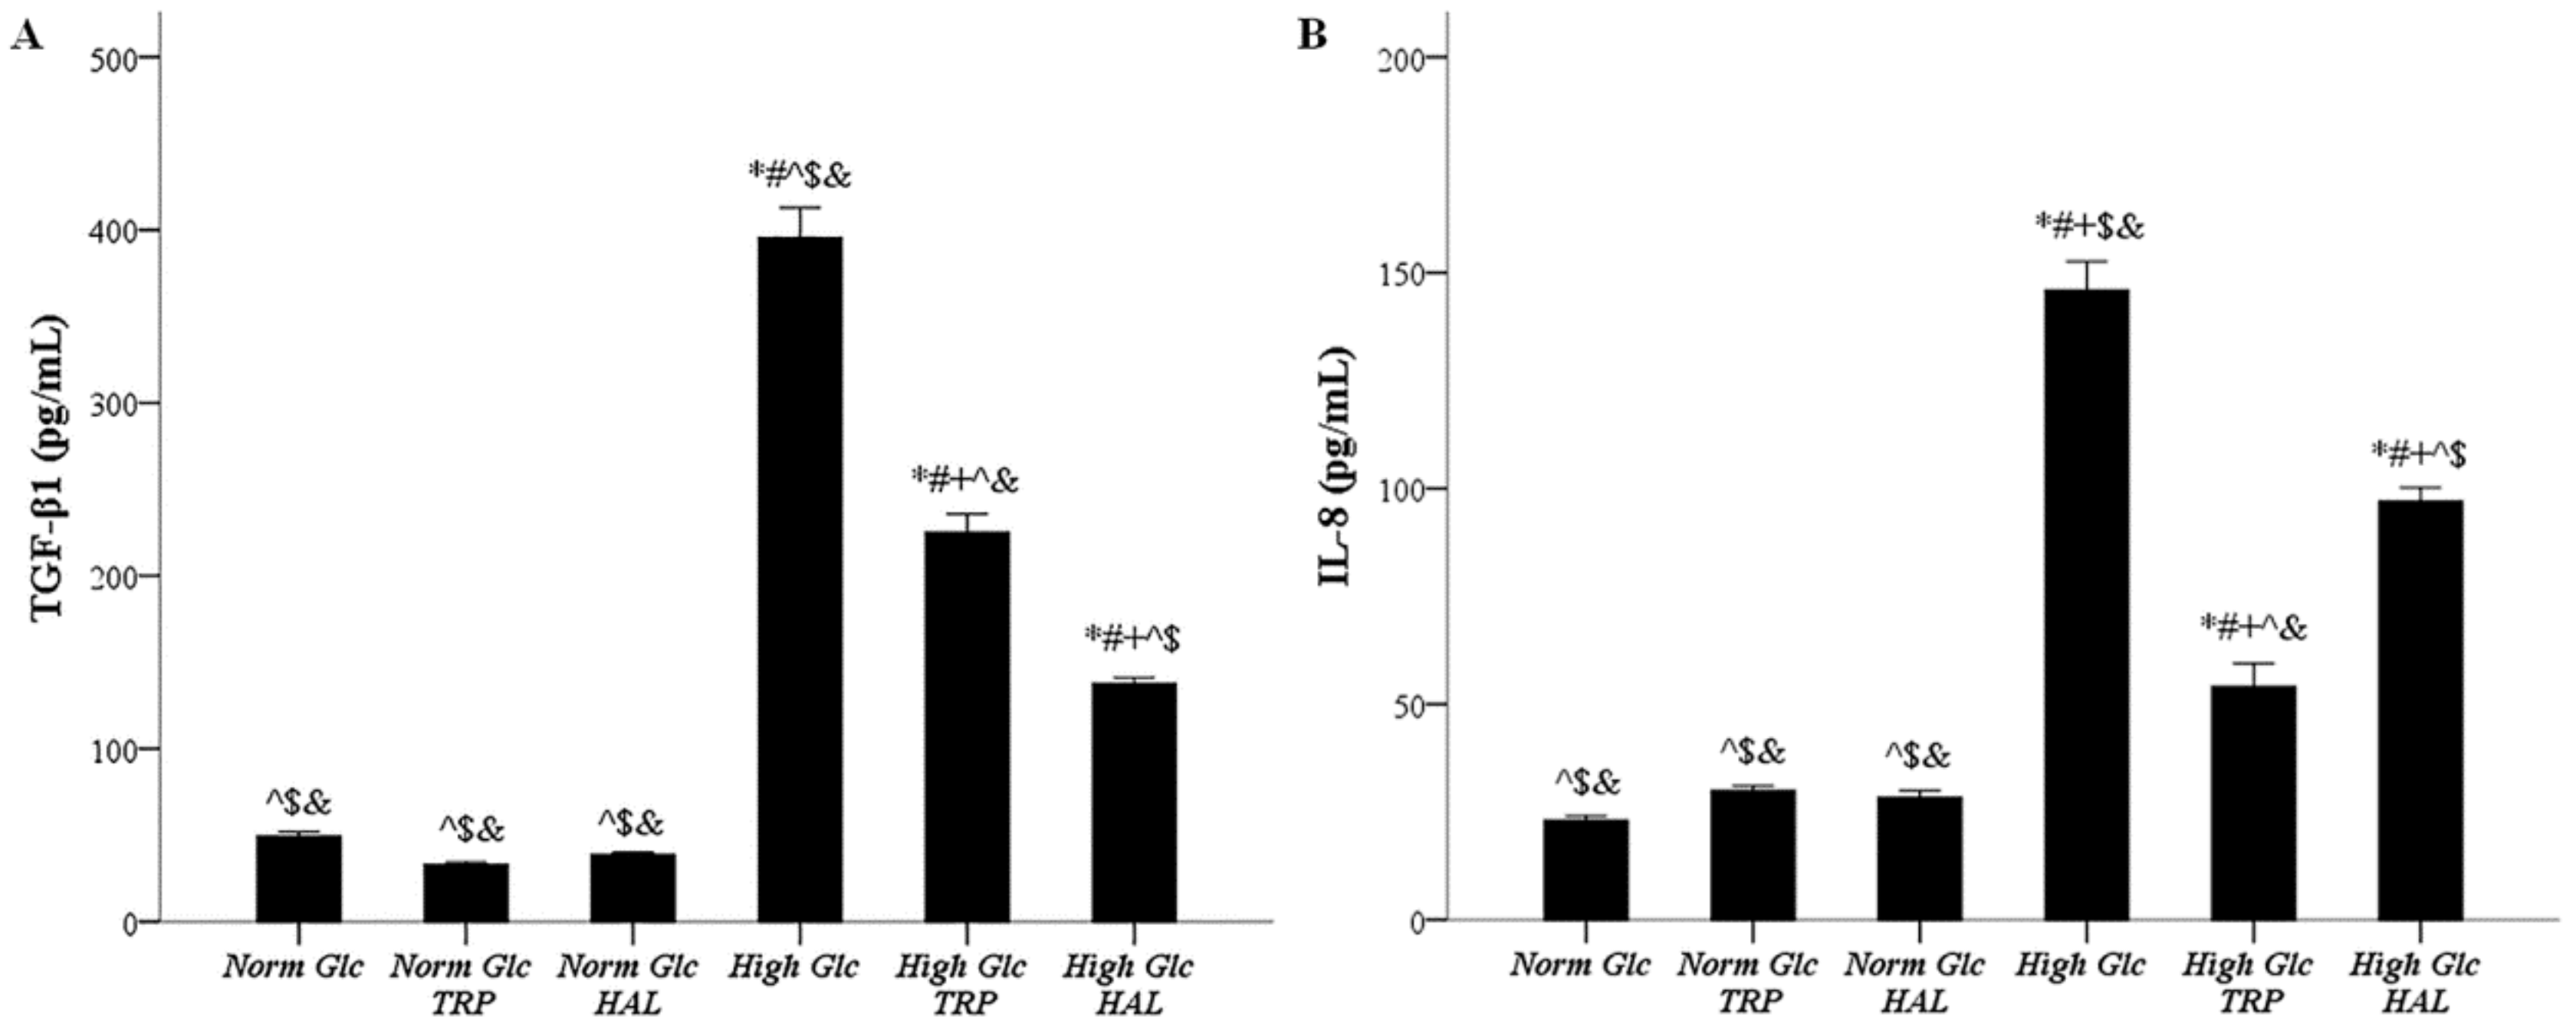
3.5. In Mesothelial Cells Cultured under High-Glucose Conditions, Both Tryptophanol and Halofuginone Reduce the Degree of the TGF-β1 and IL-8 Increment
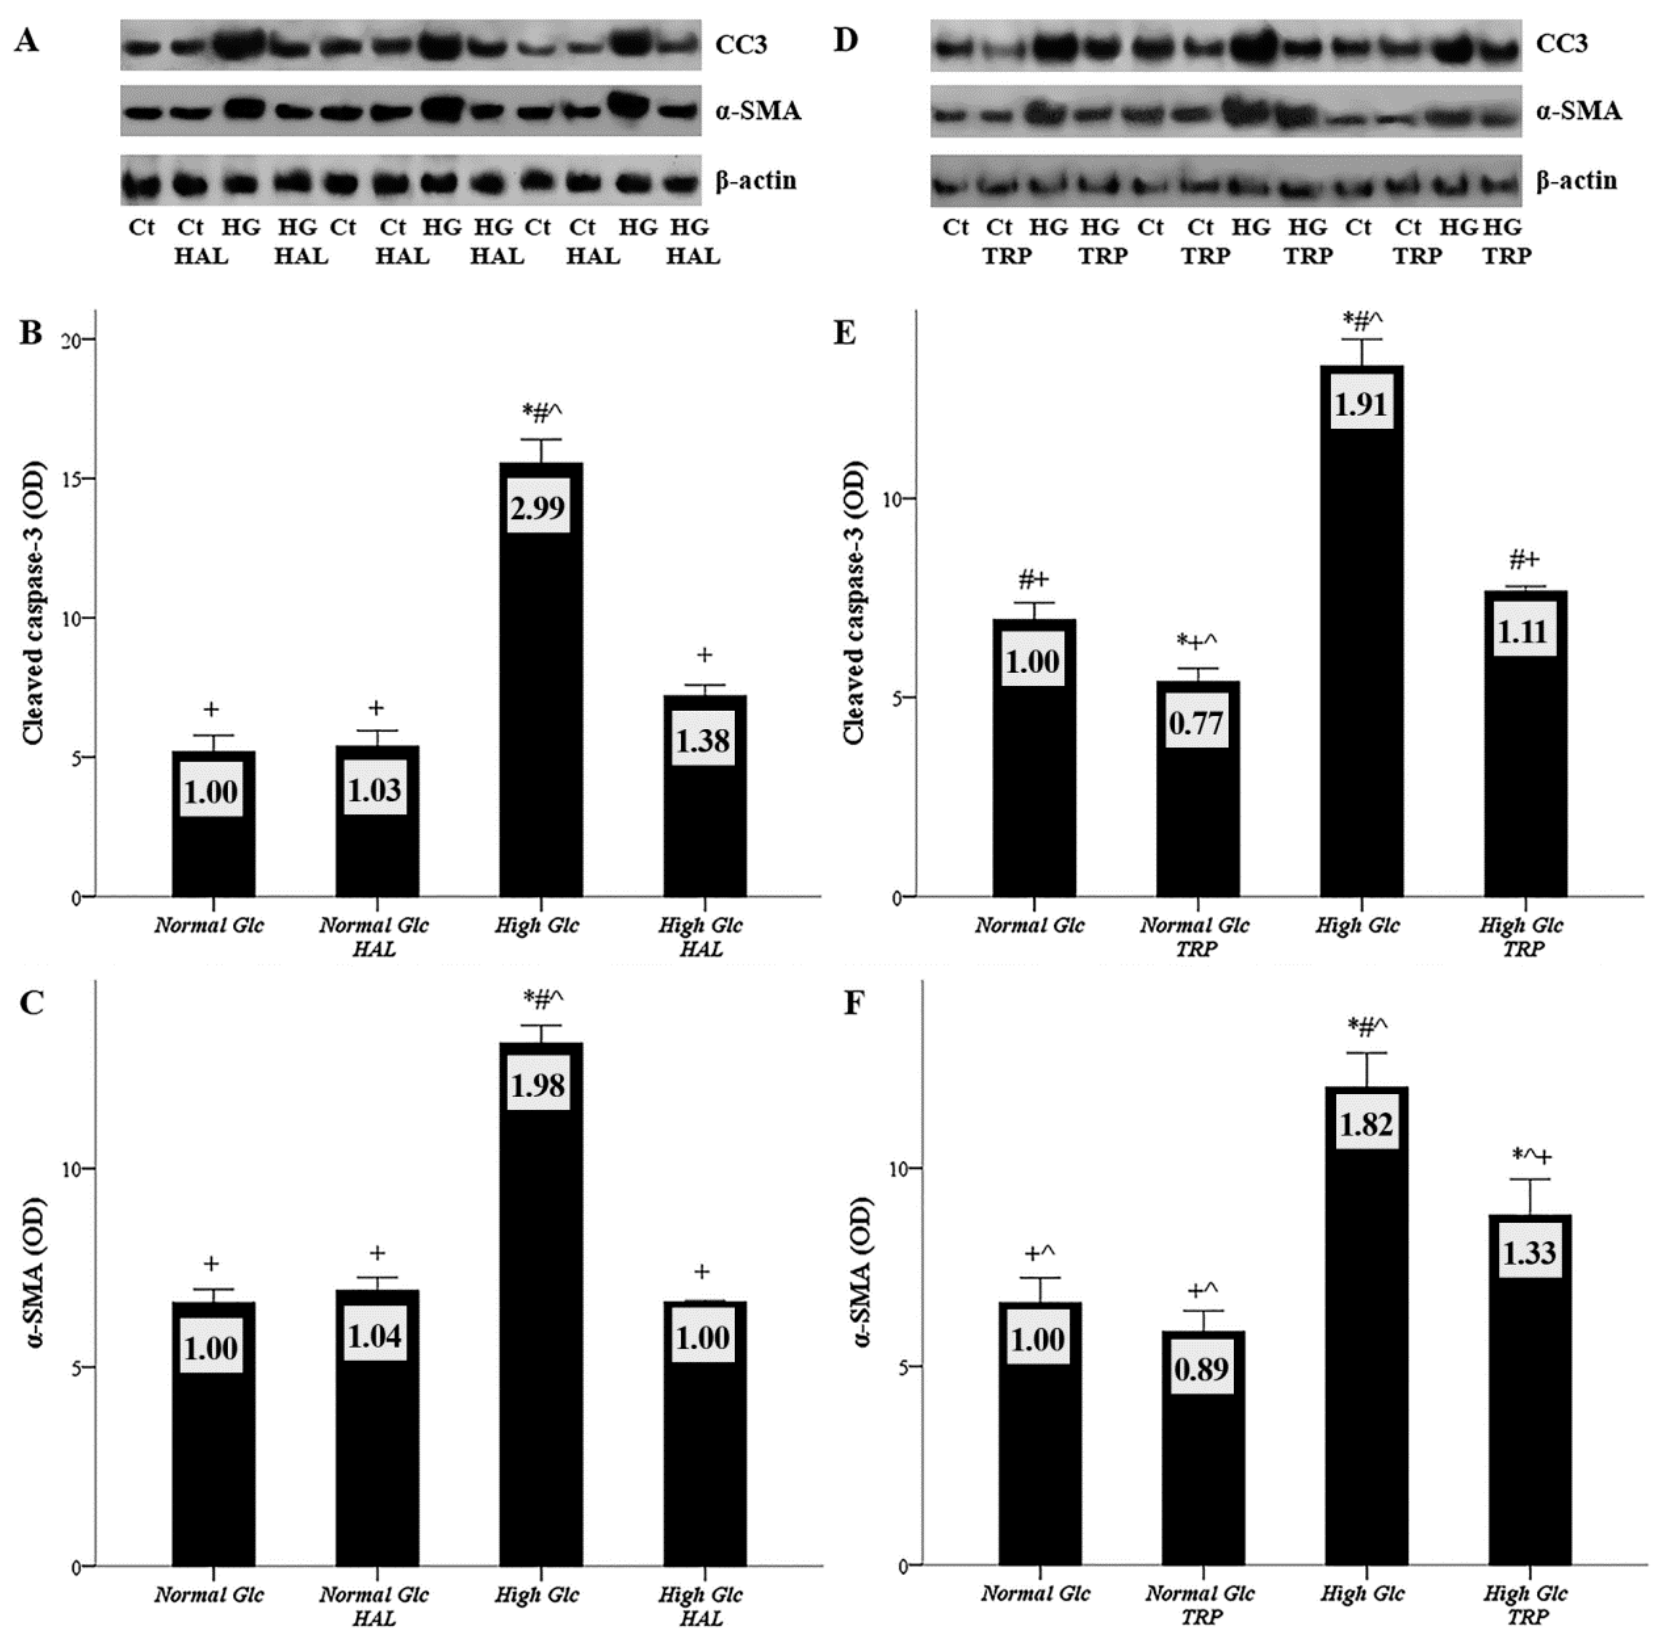
3.6. Both Tryptophanol and Halofuginone Prevent High-Glucose-Induced Cellular Apoptosis and the Mesothelial to Mesenchymal Transition
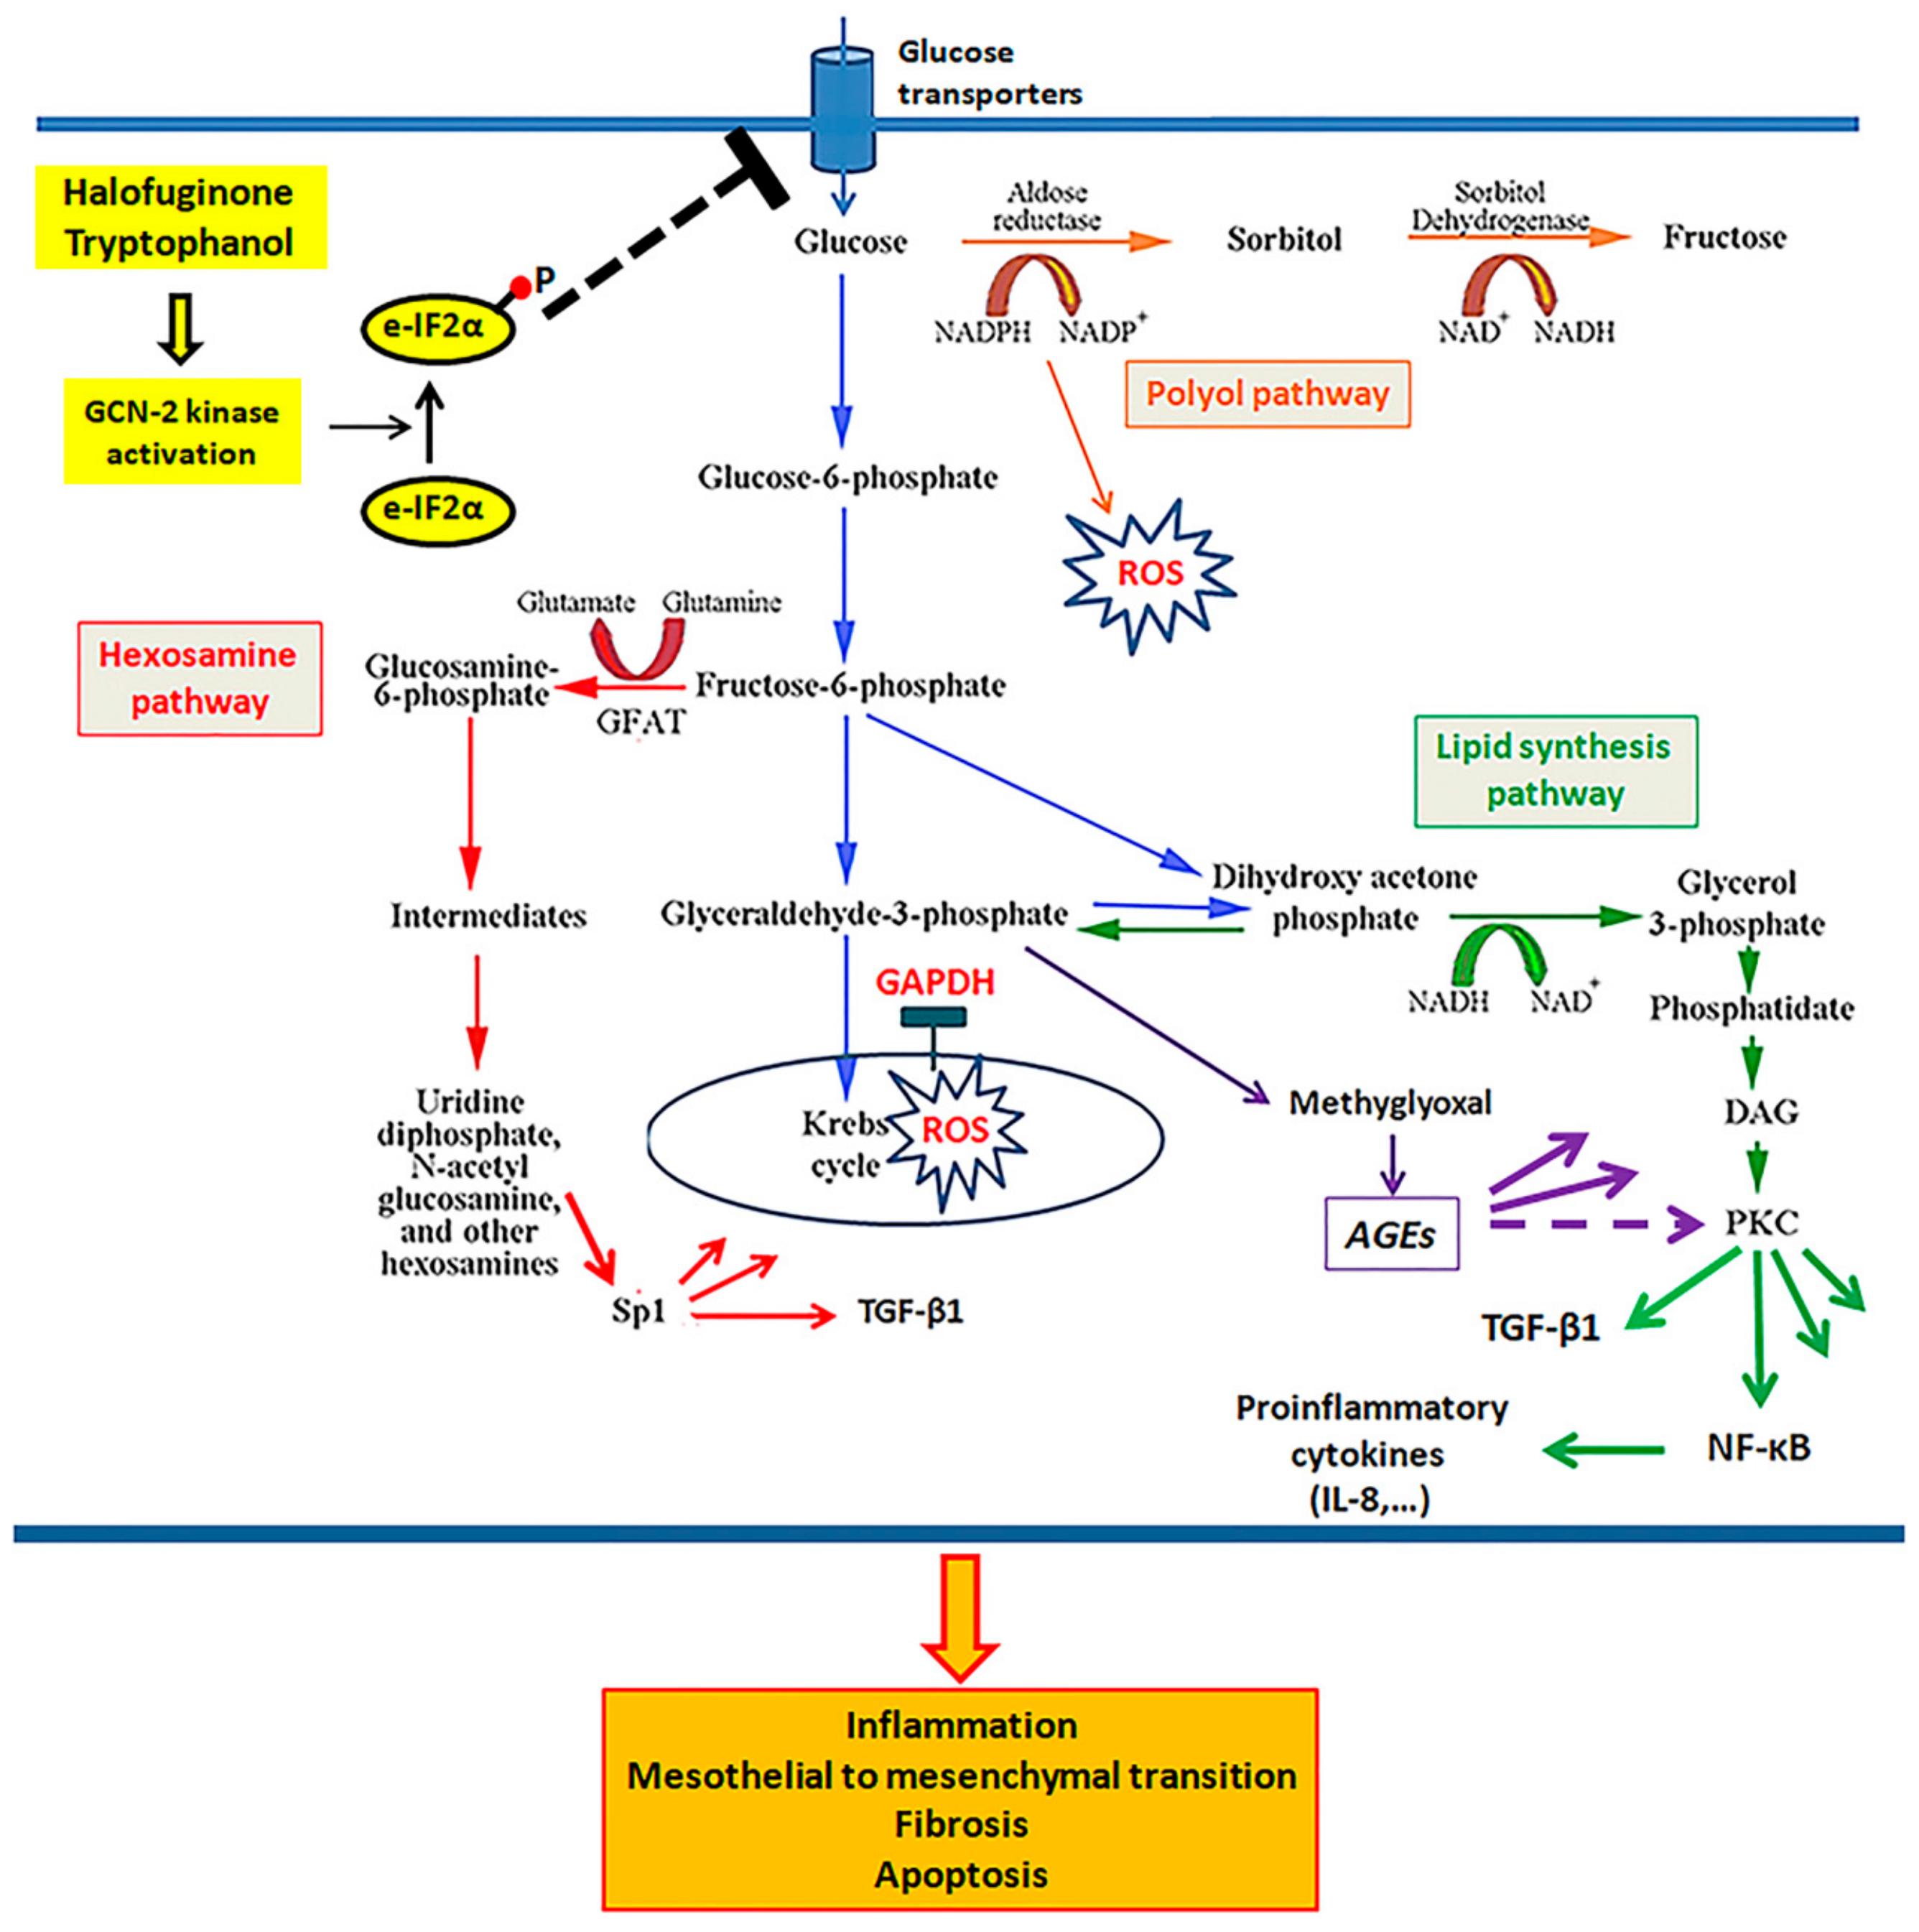
4. Discussion
Author Contributions
Funding
Conflicts of Interest
References
- Wong, B.; Ravani, P.; Oliver, M.J.; Holroyd-Leduc, J.; Venturato, L.; Garg, A.X.; Quinn, R.R. Comparison of Patient Survival Between Hemodialysis and Peritoneal Dialysis Among Patients Eligible for Both Modalities. Am. J. Kidney Dis. 2018, 71, 344–351. [Google Scholar] [CrossRef] [PubMed]
- Kawaguchi, Y.; Hasegawa, T.; Nakayama, M.; Kubo, H.; Shigematu, T. Issues affecting the longevity of the continuous peritoneal dialysis therapy. Kidney Int. Suppl. 1997, 62, S105–S107. [Google Scholar] [PubMed]
- Jager, K.J.; Merkus, M.P.; Dekker, F.W.; Boeschoten, E.W.; Tijssen, J.G.; Stevens, P.; Bos, W.J.; Krediet, R.T. Mortality and technique failure in patients starting chronic peritoneal dialysis: Results of The Netherlands Cooperative Study on the Adequacy of Dialysis. NECOSAD Study Group. Kidney Int. 1999, 55, 1476–1485. [Google Scholar] [CrossRef] [PubMed]
- Davies, S.J.; Bryan, J.; Phillips, L.; Russell, G.I. Longitudinal changes in peritoneal kinetics: The effects of peritoneal dialysis and peritonitis. Nephrol. Dial. Transplant. 1996, 11, 498–506. [Google Scholar] [CrossRef]
- López-Cabrera, M. Mesenchymal Conversion of Mesothelial Cells Is a Key Event in the Pathophysiology of the Peritoneum during Peritoneal Dialysis. Adv. Med. 2014, 2014, 1–17. [Google Scholar] [CrossRef]
- Strippoli, R.; Moreno-Vicente, R.; Battistelli, C.; Cicchini, C.; Noce, V.; Amicone, L.; Marchetti, A.; del Pozo, M.A.; Tripodi, M. Molecular Mechanisms Underlying Peritoneal EMT and Fibrosis. Stem Cells Int. 2016, 2016, 1–11. [Google Scholar] [CrossRef]
- Zhou, Q.; Bajo, M.A.; del Peso, G.; Yu, X.; Selgas, R. Preventing peritoneal membrane fibrosis in peritoneal dialysis patients. Kidney Int. 2016, 90, 515–524. [Google Scholar] [CrossRef]
- Radunz, V.; Pecoits-Filho, R.; Figueiredo, A.E.; Barretti, P.; de Moraes, T.P. Impact of Glucose Exposure on Outcomes of a Nation-Wide Peritoneal Dialysis Cohort–Results of the BRAZPD II Cohort. Front. Physiol. 2019, 10. [Google Scholar] [CrossRef]
- Williams, J.D.; Craig, K.J.; Topley, N.; Von Ruhland, C.; Fallon, M.; Newman, G.R.; Mackenzie, R.K.; Williams, G.T.; Peritoneal Biopsy Study, G. Morphologic changes in the peritoneal membrane of patients with renal disease. J. Am. Soc. Nephrol. 2002, 13, 470–479. [Google Scholar]
- Williams, J.D.; Craig, K.J.; Topley, N.; Williams, G.T. Peritoneal dialysis: Changes to the structure of the peritoneal membrane and potential for biocompatible solutions. Kidney Int. Suppl. 2003, S158–S161. [Google Scholar] [CrossRef]
- Aroeira, L.S.; Aguilera, A.; Selgas, R.; Ramirez-Huesca, M.; Perez-Lozano, M.L.; Cirugeda, A.; Bajo, M.A.; del Peso, G.; Sanchez-Tomero, J.A.; Jimenez-Heffernan, J.A.; et al. Mesenchymal conversion of mesothelial cells as a mechanism responsible for high solute transport rate in peritoneal dialysis: Role of vascular endothelial growth factor. Am. J. Kidney Dis. 2005, 46, 938–948. [Google Scholar] [CrossRef]
- Perez-Lozano, M.L.; Sandoval, P.; Rynne-Vidal, A.; Aguilera, A.; Jimenez-Heffernan, J.A.; Albar-Vizcaino, P.; Majano, P.L.; Sanchez-Tomero, J.A.; Selgas, R.; Lopez-Cabrera, M. Functional relevance of the switch of VEGF receptors/co-receptors during peritoneal dialysis-induced mesothelial to mesenchymal transition. PLoS ONE 2013, 8, e60776. [Google Scholar] [CrossRef] [PubMed]
- Schaefer, B.; Bartosova, M.; Macher-Goeppinger, S.; Sallay, P.; Vörös, P.; Ranchin, B.; Vondrak, K.; Ariceta, G.; Zaloszyc, A.; Bayazit, A.K.; et al. Neutral pH and low–glucose degradation product dialysis fluids induce major early alterations of the peritoneal membrane in children on peritoneal dialysis. Kidney Int. 2018, 94, 419–429. [Google Scholar] [CrossRef] [PubMed]
- Bartosova, M.; Schaefer, B.; Vondrak, K.; Sallay, P.; Taylan, C.; Cerkauskiene, R.; Dzierzega, M.; Milosevski-Lomic, G.; Büscher, R.; Zaloszyc, A.; et al. Peritoneal Dialysis Vintage and Glucose Exposure but Not Peritonitis Episodes Drive Peritoneal Membrane Transformation During the First Years of PD. Front. Physiol. 2019, 10. [Google Scholar] [CrossRef] [PubMed]
- Szeto, C.C.; Johnson, D.W. Low GDP Solution and Glucose-Sparing Strategies for Peritoneal Dialysis. Semin. Nephrol. 2017, 37, 30–42. [Google Scholar] [CrossRef] [PubMed]
- Davies, S.J.; Brown, E.A.; Frandsen, N.E.; Rodrigues, A.S.; Rodriguez-Carmona, A.; Vychytil, A.; Macnamara, E.; Ekstrand, A.; Tranaeus, A.; Filho, J.C.; et al. Longitudinal membrane function in functionally anuric patients treated with APD: Data from EAPOS on the effects of glucose and icodextrin prescription. Kidney Int. 2005, 67, 1609–1615. [Google Scholar] [CrossRef] [PubMed]
- Cho, Y.; Johnson, D.W.; Badve, S.; Craig, J.C.; Strippoli, G.F.K.; Wiggins, K.J. Impact of icodextrin on clinical outcomes in peritoneal dialysis: A systematic review of randomized controlled trials. Nephrol. Dial. Transplant. 2013, 28, 1899–1907. [Google Scholar] [CrossRef]
- Moriishi, M.; Kawanishi, H. Icodextrin and intraperitoneal inflammation. Perit. Dial. Int. 2008, 28 (Suppl. S3), S96–S100. [Google Scholar]
- Tjiong, H.L.; Rietveld, T.; Wattimena, J.L.; van den Berg, J.W.; Kahriman, D.; van der Steen, J.; Hop, W.C.; Swart, R.; Fieren, M.W. Peritoneal Dialysis with Solutions Containing Amino Acids Plus Glucose Promotes Protein Synthesis during Oral Feeding. Clin. J. Am. Soc. Nephrol. 2007, 2, 74–80. [Google Scholar] [CrossRef]
- Bartosova, M.; Schmitt, C.P. Biocompatible Peritoneal Dialysis: The Target Is Still Way Off. Front. Physiol. 2019, 9. [Google Scholar] [CrossRef]
- Eleftheriadis, T.; Pissas, G.; Yiannaki, E.; Markala, D.; Arampatzis, S.; Antoniadi, G.; Liakopoulos, V.; Stefanidis, I. Inhibition of indoleamine 2,3-dioxygenase in mixed lymphocyte reaction affects glucose influx and enzymes involved in aerobic glycolysis and glutaminolysis in alloreactive T-cells. Hum. Immunol. 2013, 74, 1501–1509. [Google Scholar] [CrossRef] [PubMed]
- Eleftheriadis, T.; Tsogka, K.; Pissas, G.; Antoniadi, G.; Liakopoulos, V.; Stefanidis, I. Activation of general control nonderepressible 2 kinase protects human glomerular endothelial cells from harmful high-glucose-induced molecular pathways. Int. Urol. Nephrol. 2016, 48, 1731–1739. [Google Scholar] [CrossRef] [PubMed]
- Du, X.; Matsumura, T.; Edelstein, D.; Rossetti, L.; Zsengellér, Z.; Szabó, C.; Brownlee, M. Inhibition of GAPDH activity by poly(ADP-ribose) polymerase activates three major pathways of hyperglycemic damage in endothelial cells. J. Clin. Investig. 2003, 112, 1049–1057. [Google Scholar] [CrossRef] [PubMed]
- Nishikawa, T.; Edelstein, D.; Du, X.L.; Yamagishi, S.-I.; Matsumura, T.; Kaneda, Y.; Yorek, M.A.; Beebe, D.; Oates, P.J.; Hammes, H.-P.; et al. Normalizing mitochondrial superoxide production blocks three pathways of hyperglycaemic damage. Nature 2000, 404, 787–790. [Google Scholar] [CrossRef] [PubMed]
- Giacco, F.; Du, X.; D’Agati, V.D.; Milne, R.; Sui, G.; Geoffrion, M.; Brownlee, M. Knockdown of Glyoxalase 1 Mimics Diabetic Nephropathy in Nondiabetic Mice. Diabetes 2013, 63, 291–299. [Google Scholar] [CrossRef] [PubMed]
- Wells, L.; Hart, G.W. O-GlcNAc turns twenty: Functional implications for post-translational modification of nuclear and cytosolic proteins with a sugar. FEBS Lett. 2003, 546, 154–158. [Google Scholar] [CrossRef]
- Brownlee, M. The pathobiology of diabetic complications: A unifying mechanism. Diabetes 2005, 54, 1615–1625. [Google Scholar] [CrossRef]
- Giacco, F.; Brownlee, M.; Schmidt, A.M. Oxidative Stress and Diabetic Complications. Circ. Res. 2010, 107, 1058–1070. [Google Scholar] [CrossRef]
- Fischereder, M.; Schroppel, B.; Wiese, P.; Fink, M.; Banas, B.; Schmidbauer, S.; Schlondorff, D. Regulation of glucose transporters in human peritoneal mesothelial cells. J. Nephrol. 2003, 16, 103–109. [Google Scholar]
- Schroppel, B.; Fischereder, M.; Wiese, P.; Segerer, S.; Huber, S.; Kretzler, M.; Heiss, P.; Sitter, T.; Schlondorff, D. Expression of glucose transporters in human peritoneal mesothelial cells. Kidney Int. 1998, 53, 1278–1287. [Google Scholar] [CrossRef]
- Pines, M.; Spector, I. Halofuginone-the multifaceted molecule. Molecules 2015, 20, 573–594. [Google Scholar] [CrossRef] [PubMed]
- Castilho, B.A.; Shanmugam, R.; Silva, R.C.; Ramesh, R.; Himme, B.M.; Sattlegger, E. Keeping the eIF2 alpha kinase Gcn2 in check. Biochim. Biophys. Acta (BBA) Mol. Cell Res. 2014, 1843, 1948–1968. [Google Scholar] [CrossRef] [PubMed]
- Lowe, G.; Tansley, G. An investigation of the mechanism of activation of tryptophan by tryptophanyl-tRNA synthetase from beef pancreas. Eur. J. Biochem. 1984, 138, 597–602. [Google Scholar] [CrossRef] [PubMed]
- Kolm-Litty, V.; Sauer, U.; Nerlich, A.; Lehmann, R.; Schleicher, E.D. High glucose-induced transforming growth factor beta1 production is mediated by the hexosamine pathway in porcine glomerular mesangial cells. J. Clin. Investig. 1998, 101, 160–169. [Google Scholar] [CrossRef] [PubMed]
- Du, X.L.; Edelstein, D.; Rossetti, L.; Fantus, I.G.; Goldberg, H.; Ziyadeh, F.; Wu, J.; Brownlee, M. Hyperglycemia-induced mitochondrial superoxide overproduction activates the hexosamine pathway and induces plasminogen activator inhibitor-1 expression by increasing Sp1 glycosylation. Proc. Natl. Acad. Sci. USA 2000, 97, 12222–12226. [Google Scholar] [CrossRef]
- Moynagh, P.N. The NF-kappaB pathway. J. Cell Sci. 2005, 118, 4589–4592. [Google Scholar] [CrossRef]
- Koya, D.; Jirousek, M.R.; Lin, Y.W.; Ishii, H.; Kuboki, K.; King, G.L. Characterization of protein kinase C beta isoform activation on the gene expression of transforming growth factor-beta, extracellular matrix components, and prostanoids in the glomeruli of diabetic rats. J. Clin. Investig. 1997, 100, 115–126. [Google Scholar] [CrossRef]
- Suryavanshi, S.V.; Kulkarni, Y.A. NF-κβ: A Potential Target in the Management of Vascular Complications of Diabetes. Front. Pharmacol. 2017, 8. [Google Scholar] [CrossRef]
- Ha, H.; Yu, M.R.; Lee, H.B. High glucose–induced PKC activation mediates TGF-β1 and fibronectin synthesis by peritoneal mesothelial cells. Kidney Int. 2001, 59, 463–470. [Google Scholar] [CrossRef]
- Wang, L.; Balzer, M.S.; Rong, S.; Menne, J.; von Vietinghoff, S.; Dong, L.; Gueler, F.; Jang, M.-S.; Xu, G.; Timrott, K.; et al. Protein kinase C α inhibition prevents peritoneal damage in a mouse model of chronic peritoneal exposure to high-glucose dialysate. Kidney Int. 2016, 89, 1253–1267. [Google Scholar] [CrossRef]
- Sanajou, D.; Ghorbani Haghjo, A.; Argani, H.; Aslani, S. AGE-RAGE axis blockade in diabetic nephropathy: Current status and future directions. Eur. J. Pharmacol. 2018, 833, 158–164. [Google Scholar] [CrossRef] [PubMed]
- Thallas-Bonke, V.; Lindschau, C.; Rizkalla, B.; Bach, L.A.; Boner, G.; Meier, M.; Haller, H.; Cooper, M.E.; Forbes, J.M. Attenuation of extracellular matrix accumulation in diabetic nephropathy by the advanced glycation end product cross-link breaker ALT-711 via a protein kinase C-alpha-dependent pathway. Diabetes 2004, 53, 2921–2930. [Google Scholar] [CrossRef] [PubMed]
- Yan, X.; Xiong, X.; Chen, Y.-G. Feedback regulation of TGF-β signaling. Acta Biochim. Biophys. Sin. 2018, 50, 37–50. [Google Scholar] [CrossRef] [PubMed]
- Lai, K.N.; Tang, S.C.; Leung, J.C. Mediators of inflammation and fibrosis. Perit. Dial. Int. 2007, 27 (Suppl. S2), S65–S71. [Google Scholar]
- Riesenhuber, A.; Kratochwill, K.; Bender, T.O.; Vargha, R.; Kasper, D.C.; Herzog, R.; Salzer, E.; Aufricht, C. Peritoneal dialysis fluid induces p38-dependent inflammation in human mesothelial cells. Perit. Dial. Int. 2010, 31, 332–339. [Google Scholar] [CrossRef]
- Fernandez-Perpen, A.; Perez-Lozano, M.L.; Bajo, M.A.; Albar-Vizcaino, P.; Correa, P.S.; del Peso, G.; Castro, M.J.; Aguilera, A.; Ossorio, M.; Peter, M.E.; et al. Influence of Bicarbonate/Low-GDP Peritoneal Dialysis Fluid (Bicavera) on In Vitro and Ex Vivo Epithelial-to-Mesenchymal Transition of Mesothelial Cells. Perit. Dial. Int. 2012, 32, 292–304. [Google Scholar] [CrossRef]
- Elliott, C.L. Nuclear factor-kappa B is essential for up-regulation of interleukin-8 expression in human amnion and cervical epithelial cells. Mol. Hum. Reprod. 2001, 7, 787–790. [Google Scholar] [CrossRef]
- Palena, C.; Hamilton, D.H.; Fernando, R.I. Influence of IL-8 on the epithelial–mesenchymal transition and the tumor microenvironment. Future Oncol. 2012, 8, 713–722. [Google Scholar] [CrossRef]
- Fadeel, B.; Orrenius, S. Apoptosis: A basic biological phenomenon with wide-ranging implications in human disease. J. Intern. Med. 2005, 258, 479–517. [Google Scholar] [CrossRef]
- Sappino, A.P.; Schurch, W.; Gabbiani, G. Differentiation repertoire of fibroblastic cells: Expression of cytoskeletal proteins as marker of phenotypic modulations. Lab. Investig. 1990, 63, 144–161. [Google Scholar]


© 2019 by the authors. Licensee MDPI, Basel, Switzerland. This article is an open access article distributed under the terms and conditions of the Creative Commons Attribution (CC BY) license (http://creativecommons.org/licenses/by/4.0/).
Share and Cite
Eleftheriadis, T.; Pissas, G.; Antoniadi, G.; Nikolaou, E.; Golfinopoulos, S.; Liakopoulos, V.; Stefanidis, I. Activation of General Control Nonderepressible-2 Kinase Ameliorates Glucotoxicity in Human Peritoneal Mesothelial Cells, Preserves Their Integrity, and Prevents Mesothelial to Mesenchymal Transition. Biomolecules 2019, 9, 832. https://doi.org/10.3390/biom9120832
Eleftheriadis T, Pissas G, Antoniadi G, Nikolaou E, Golfinopoulos S, Liakopoulos V, Stefanidis I. Activation of General Control Nonderepressible-2 Kinase Ameliorates Glucotoxicity in Human Peritoneal Mesothelial Cells, Preserves Their Integrity, and Prevents Mesothelial to Mesenchymal Transition. Biomolecules. 2019; 9(12):832. https://doi.org/10.3390/biom9120832
Chicago/Turabian StyleEleftheriadis, Theodoros, Georgios Pissas, Georgia Antoniadi, Evdokia Nikolaou, Spyridon Golfinopoulos, Vassilios Liakopoulos, and Ioannis Stefanidis. 2019. "Activation of General Control Nonderepressible-2 Kinase Ameliorates Glucotoxicity in Human Peritoneal Mesothelial Cells, Preserves Their Integrity, and Prevents Mesothelial to Mesenchymal Transition" Biomolecules 9, no. 12: 832. https://doi.org/10.3390/biom9120832
APA StyleEleftheriadis, T., Pissas, G., Antoniadi, G., Nikolaou, E., Golfinopoulos, S., Liakopoulos, V., & Stefanidis, I. (2019). Activation of General Control Nonderepressible-2 Kinase Ameliorates Glucotoxicity in Human Peritoneal Mesothelial Cells, Preserves Their Integrity, and Prevents Mesothelial to Mesenchymal Transition. Biomolecules, 9(12), 832. https://doi.org/10.3390/biom9120832