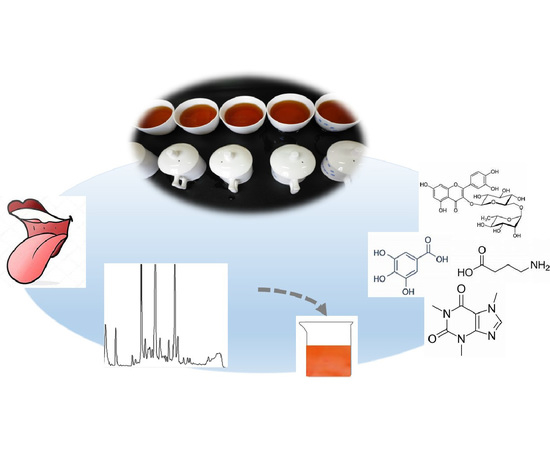
Rutin, γ-Aminobutyric Acid, Gallic Acid, and Caffeine Negatively Affect the Sweet-Mellow Taste of Congou Black Tea Infusions


Abstract
:
1. Introduction
2. Results and Discussion
2.1. Taste Evaluation
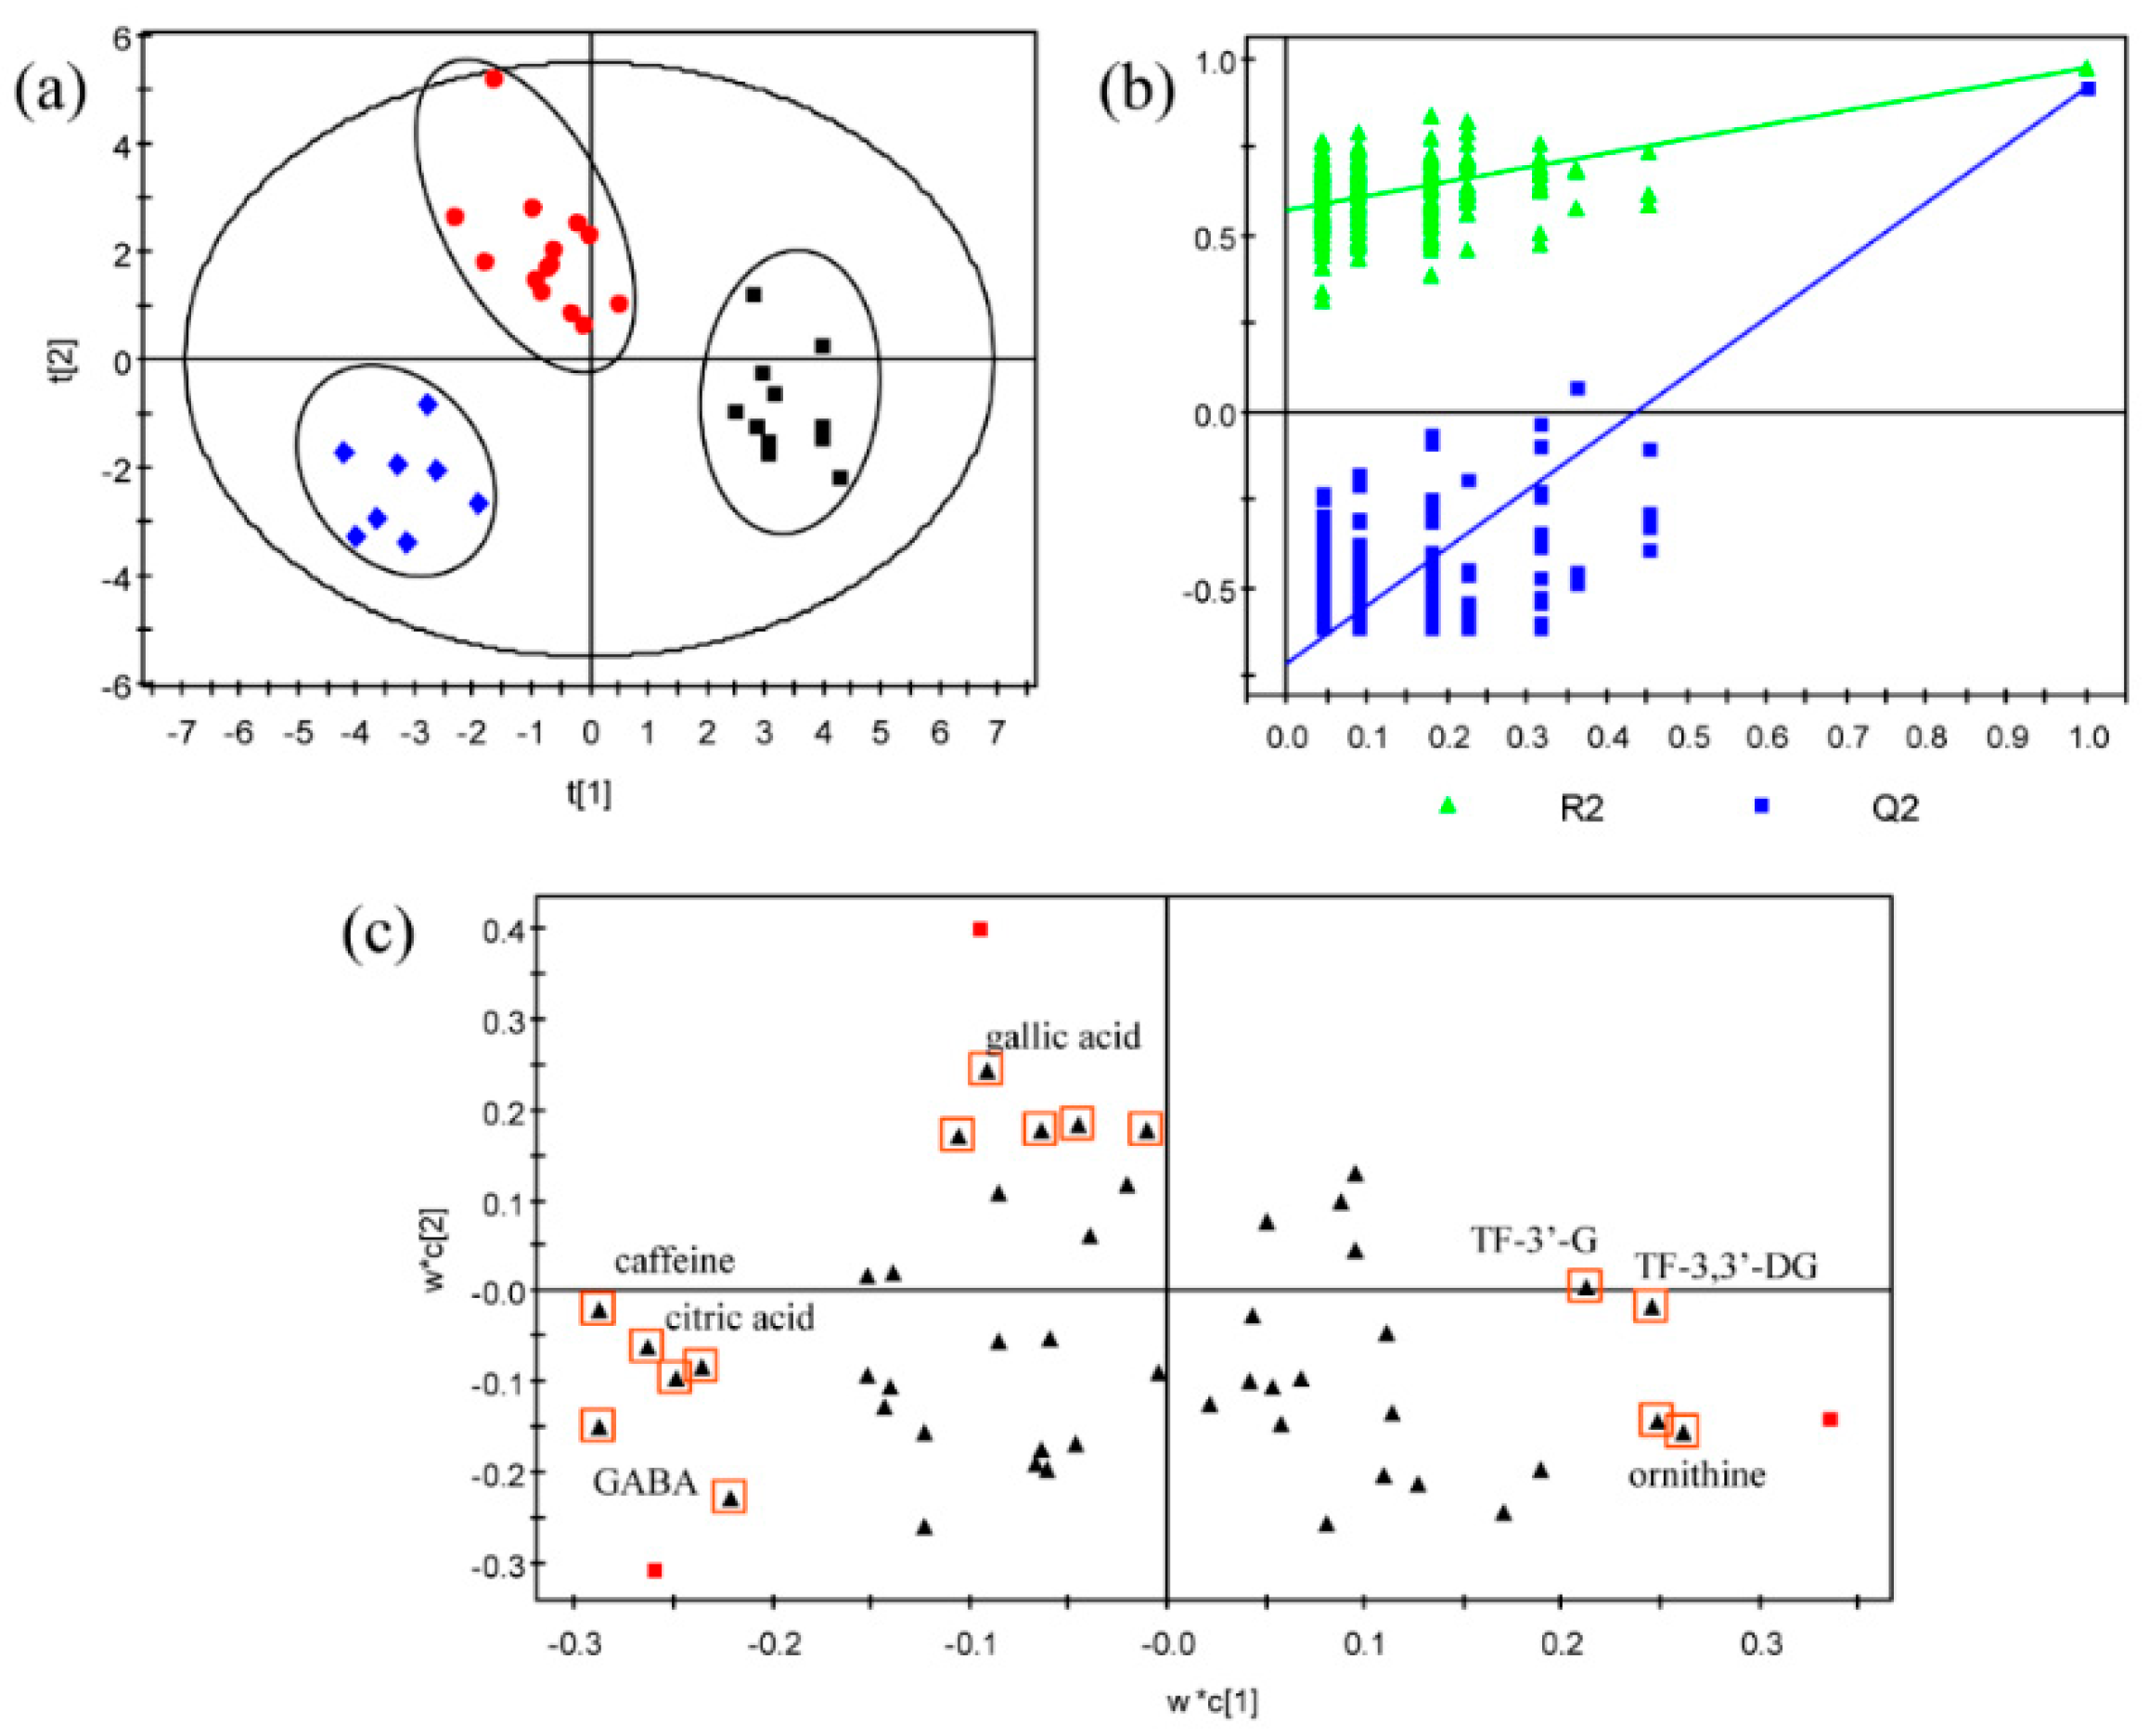
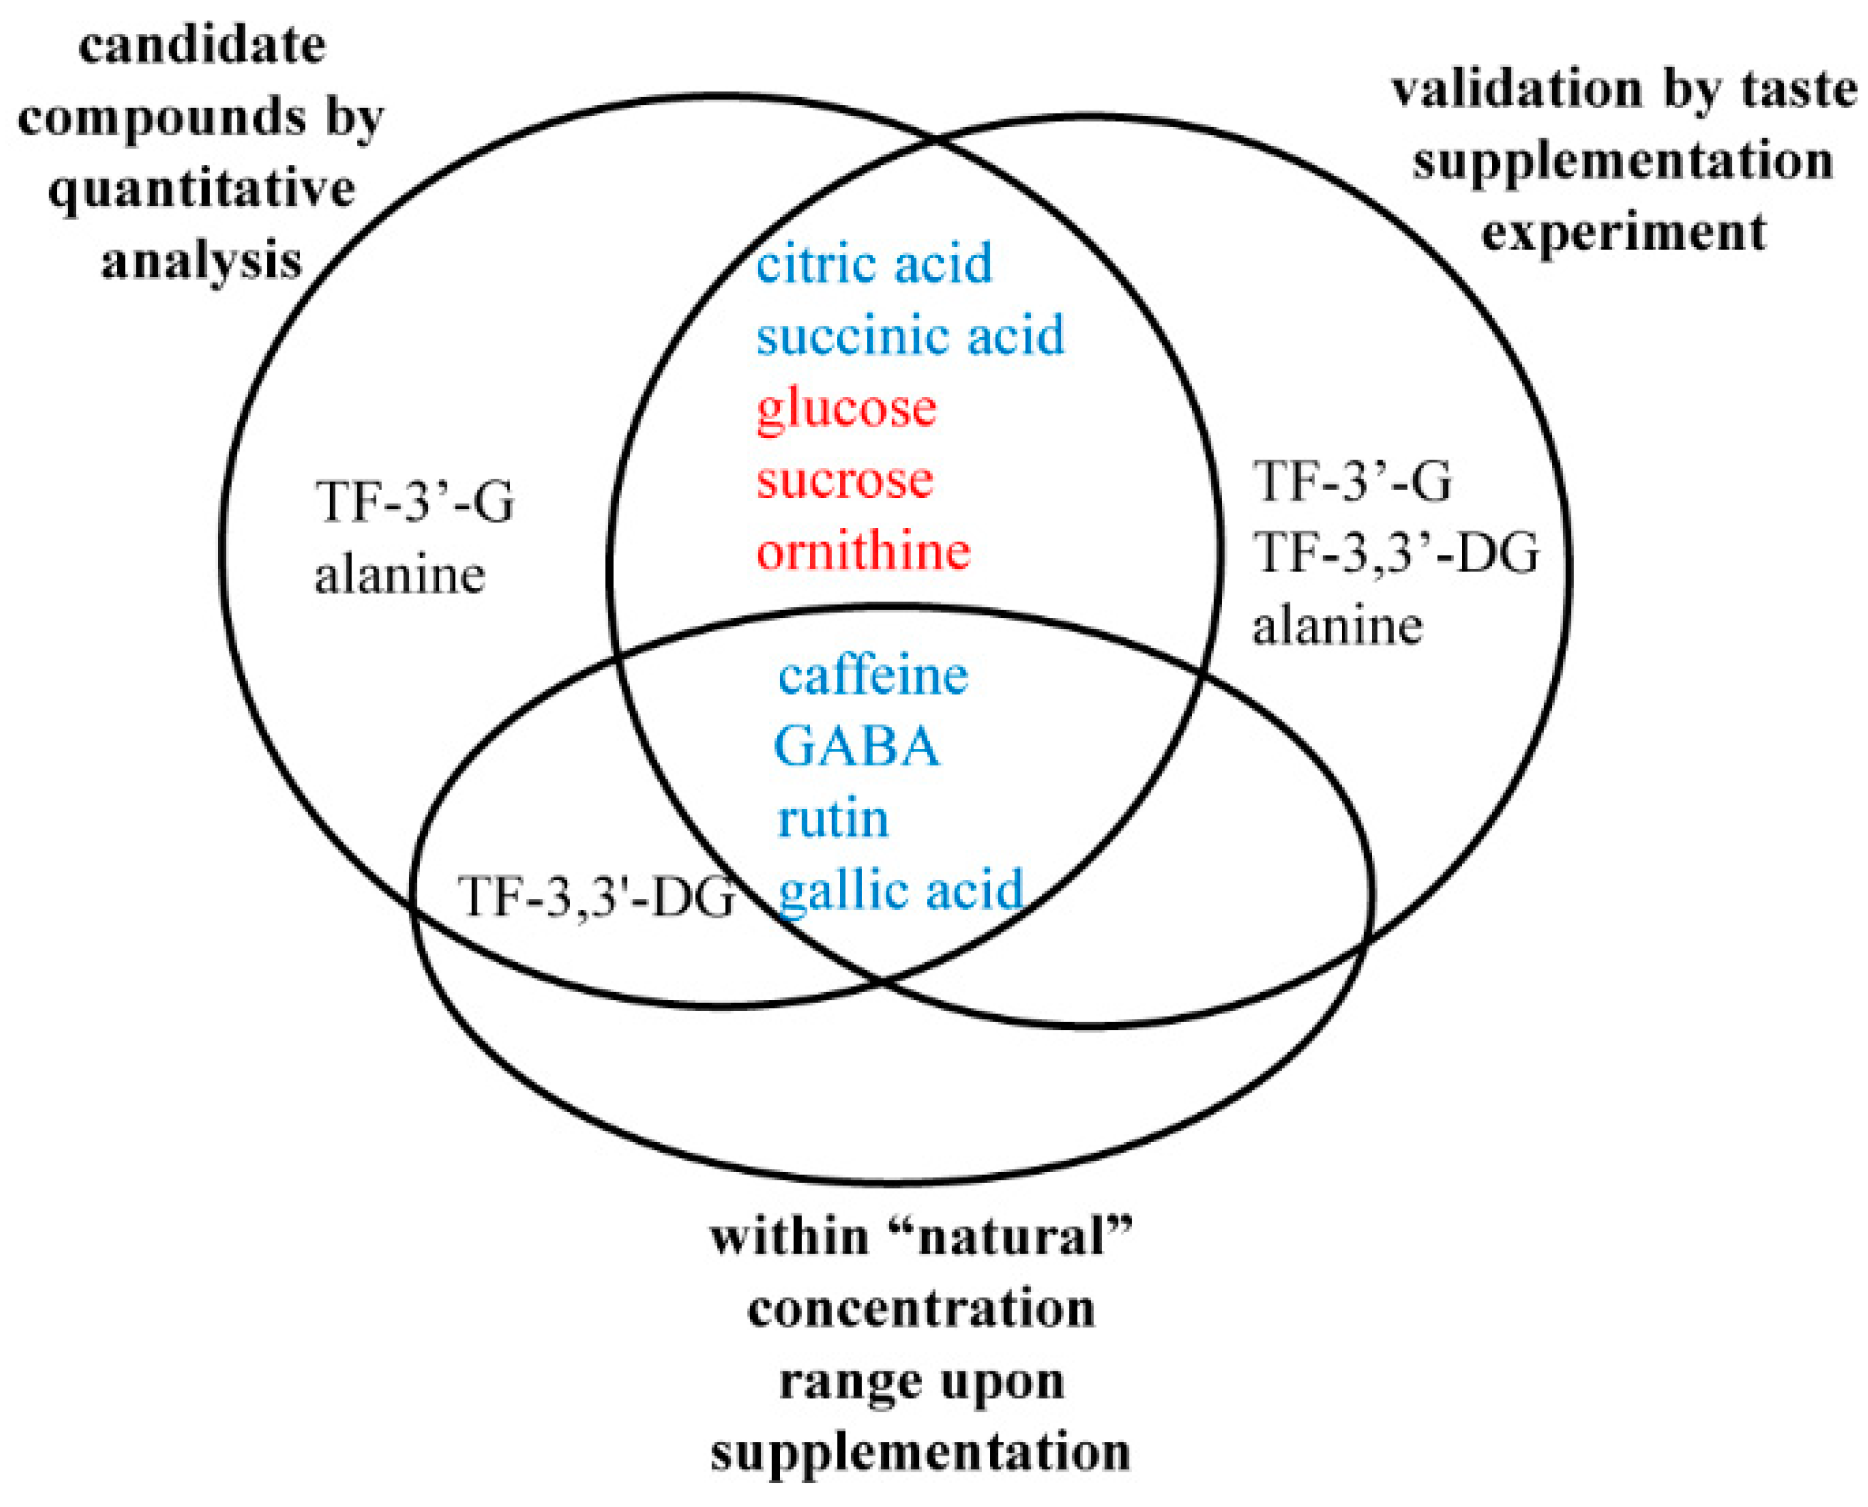
2.2. Quantitative Analysis and Screening of Candidate Compounds
2.3. Taste Contribution Analysis
2.4. Validation by Taste Supplementation Experiments
3. Materials and Methods
3.1. Chemicals and Reagents
3.2. Collection of Congou Black Tea Samples
3.3. Preparation of Tea Infusions
3.4. Human Sensory Evaluation
3.4.1. Tea Sensory Evaluation
3.4.2. Taste Supplementation Experiments
3.5. Analysis of Chemical Compositions
3.5.1. Catechins, Gallic Acid, Caffeine, and Theaflavins
3.5.2. Flavonol Glycosides
3.5.3. Free Amino Acids
3.5.4. Free Sugars and Organic Acids
3.6. Data Processing and Statistics
4. Conclusions
Supplementary Materials
Author Contributions
Funding
Conflicts of Interest
References
- Harbowy, M.E.; Balentine, D.A. Tea chemistry. Crit. Rev. Plant Sci. 1997, 16, 415–480. [Google Scholar] [CrossRef]
- Vuong, Q.V. Epidemiological Evidence Linking Tea Consumption to Human Health: A Review. Crit. Rev. Food Sci. Nutr. 2014, 54, 523–536. [Google Scholar] [CrossRef] [PubMed]
- Li, S.M.; Lo, C.Y.; Pan, M.H.; Lai, C.S.; Ho, C.T. Black tea: Chemical analysis and stability. Food Funct. 2013, 4, 10–18. [Google Scholar] [CrossRef] [PubMed]
- Chen, C. Manufacture of Tea, 2nd ed.; China Agriculture Press: Beijing, China, 2013; pp. 307–329. [Google Scholar]
- Shi, Z.; Huang, J. Tea Tasting and Inspection, 4th ed.; China Agriculture Press: Beijing, China, 2015; pp. 111–113. [Google Scholar]
- Scharbert, S.; Hofmann, T. Molecular definition of black tea taste by means of quantitative studies, taste reconstitution, and omission experiments. J. Agric. Food Chem. 2005, 53, 5377–5384. [Google Scholar] [CrossRef] [PubMed]
- Yao, Y.; Wang, J.; Hua, J.; Xu, Q.; Zhang, M.; Jiang, Y.; Yuan, H.; Dong, C.; Li, J. Application of Electronic Tongue in the Evaluation of Sweet Taste Quality of Congou Black Tea. Food Sci. 2019, 40, 236–241. [Google Scholar]
- Scharbert, S.; Jezussek, M.; Hofmann, T. Evaluation of the taste contribution of theaflavins in black tea infusions using the taste activity concept. Eur. Food Res. Technol. 2004, 218, 442–447. [Google Scholar] [CrossRef]
- Scharbert, S.; Holzmann, N.; Hofmann, T. Identification of the astringent taste compounds in black tea infusions by combining instrumental analysis and human bioresponse. J. Agric. Food Chem. 2004, 52, 3498–3508. [Google Scholar] [CrossRef]
- Wang, K.; Chen, Q.; Lin, Y.; Li, S.; Lin, H.; Huang, J.; Liu, Z. Comparison of Phenolic Compounds and Taste of Chinese Black Tea. Food Sci. Technol. Res. 2014, 20, 639–645. [Google Scholar] [CrossRef]
- Alasalvar, C.; Topal, B.; Serpen, A.; Bahar, B.; Pelvan, E.; Gokmen, V. Flavor Characteristics of Seven Grades of Black Tea Produced in Turkey. J. Agric. Food Chem. 2012, 60, 6323–6332. [Google Scholar] [CrossRef]
- Yu, P.; Yeo, A.S.-L.; Low, M.-Y.; Zhou, W. Identifying key non-volatile compounds in ready-to-drink green tea and their impact on taste profile. Food Chem. 2014, 155, 9–16. [Google Scholar] [CrossRef]
- Kaneko, S.; Kumazawa, K.; Masuda, H.; Henze, A.; Hofmann, T. Molecular and sensory studies on the umami taste of Japanese green tea. J. Agric. Food Chem. 2006, 54, 2688–2694. [Google Scholar] [CrossRef] [PubMed]
- Zhang, Y.-N.; Yin, J.-F.; Chen, J.-X.; Wang, F.; Du, Q.-Z.; Jiang, Y.-W.; Xu, Y.-Q. Improving the sweet aftertaste of green tea infusion with tannase. Food Chem. 2016, 192, 470–476. [Google Scholar] [CrossRef] [PubMed]
- Cao, Q.Q.; Zou, C.; Zhang, Y.H.; Du, Q.Z.; Yin, J.F.; Shi, J.; Xue, S.; Xu, Y.Q. Improving the taste of autumn green tea with tannase. Food Chem. 2019, 277, 432–437. [Google Scholar] [CrossRef] [PubMed]
- Liu, P.-P.; Yin, J.-F.; Chen, G.-S.; Wang, F.; Xu, Y.-Q. Flavor characteristics and chemical compositions of oolong tea processed using different semi-fermentation times. J. Food Sci. Technol.-Mysore 2018, 55, 1185–1195. [Google Scholar] [CrossRef]
- Ahmed, S.; Unachukwu, U.; Stepp, J.R.; Peters, C.M.; Long, C.; Kennelly, E. Pu-erh tea tasting in Yunnan, China: Correlation of drinkers’ perceptions to phytochemistry. J. Ethnopharmacol. 2010, 132, 176–185. [Google Scholar] [CrossRef]
- Muthumani, T.; Kumar, R.S.S. Influence of fermentation time on the development of compounds responsible for quality in black tea. Food Chem. 2007, 101, 98–102. [Google Scholar] [CrossRef]
- Tanaka, T.; Matsuo, Y.; Kouno, I. Chemistry of Secondary Polyphenols Produced during Processing of Tea and Selected Foods. Int. J. Mol. Sci. 2010, 11, 14–40. [Google Scholar] [CrossRef]
- Ho, C.-T.; Sang, S.; Jhoo, J.W. Chemistry of Theaflavins: The Astringent Taste Compounds of Black Tea. In Challenges in Taste Chemistry and Biology; American Chemical Society: Washington, DC, USA, 2003; Volume 867, pp. 125–138. [Google Scholar]
- Trygg, J.; Holmes, E.; Lundstedt, T. Chemometrics in metabonomics. J. Proteome Res. 2007, 6, 469–479. [Google Scholar] [CrossRef]
- Senthil Kumar, R.S.; Murugesan, S.; Kottur, G.; Gyamfi, D. Chapter 4-Black Tea: The Plants, Processing/Manufacturing and Production. In Tea in Health and Disease Prevention; Preedy, V.R., Ed.; Academic Press: Waltham, MA, USA, 2013; pp. 41–57. [Google Scholar]
- Juneja, L.R.; Chu, D.-C.; Okubo, T.; Nagato, Y.; Yokogoshi, H. l-theanine—A unique amino acid of green tea and its relaxation effect in humans. Trends Food Sci. Technol. 1999, 10, 199–204. [Google Scholar] [CrossRef]
- Wang, L.; Xu, R.; Hu, B.; Li, W.; Sun, Y.; Tu, Y.; Zeng, X. Analysis of free amino acids in Chinese teas and flower of tea plant by high performance liquid chromatography combined with solid-phase extraction. Food Chem. 2010, 123, 1259–1266. [Google Scholar] [CrossRef]
- Schieberle, P.; Hofmann, T. Mapping the Combinatorial Code of Food Flavors by Means of Molecular Sensory Science Approach. In Food Flavors-Chemical, Sensory and Technological Properties, 1st ed.; Jelen, H., Ed.; CRC Press (Taylor & Francis Group): Boca Raton, FL, USA, 2011; pp. 411–437. [Google Scholar]
- Hufnagel, J.C.; Hofmann, T. Quantitative reconstruction of the nonvolatile sensometabolome of a red wine. J. Agric. Food Chem. 2008, 56, 9190–9199. [Google Scholar] [CrossRef] [PubMed]
- Li, J.; Wang, J.; Yao, Y.; Hua, J.; Zhou, Q.; Jiang, Y.; Deng, Y.; Yang, Y.; Wang, J.; Yuan, H.; et al. Phytochemical comparison of different tea (Camellia sinensis) cultivars and its association with sensory quality of finished tea. LWT 2020, 117, 108595. [Google Scholar] [CrossRef]
- Tan, J.; Dai, W.; Lu, M.; Lv, H.; Guo, L.; Zhang, Y.; Zhu, Y.; Peng, Q.; Lin, Z. Study of the dynamic changes in the non-volatile chemical constituents of black tea during fermentation processing by a non-targeted metabolomics approach. Food Res. Int. 2016, 79, 106–113. [Google Scholar] [CrossRef]
- Gong, S.; Lu, C.; Liu, X.; Zhao, Y.; Shen, H.; Guo, Y.; Wu, J.; Zhao, L.; Gu, Z. Methodology of Sensory Evaluation of Tea (GB/T 23776-2009); Standards Press of China: Beijing, China, 2009. [Google Scholar]
- He, S.; Mao, X.; Liu, P.; Lin, H.; Du, Z.; Lv, N.; Han, J.; Qiu, C. Research into the functional components and antioxidant activities of North China rice wine (Ji Mo Lao Jiu). Food Sci. Nutr. 2013, 1, 307–314. [Google Scholar] [CrossRef]
- Hua, J.J.; Yuan, H.B.; Deng, Y.L.; Jiang, Y.W.; Wang, J.J.; Dong, C.W.; Li, J. Far-Infrared Optimization of the Fragrance-Improving Process with Temperature and Humidity Control for Green Tea. J. Food Sci. 2018, 83, 1668–1675. [Google Scholar] [CrossRef]
Sample Availability: Samples of the compounds may be available from the authors. |


| Group | Taste Description | Sample Number | Producing Area | Taste Score |
|---|---|---|---|---|
| Group I: sweet-mellow | sweet, mellow, some with a fruity or brisk sensation | 11 | Zhejiang (5), Hubei (3), Yunnan (2), Anhui (1) | 88.1 ± 2.9a |
| Group II: mellow-pure | mellow, mild, some with a brisk or thick sensation | 14 | Hubei (9), Zhejiang (2), Sichuan (2), Anhui (1) | 84.6 ± 3.1b |
| Group III: less-mellow | with unpleasant tastes including ripe, stale, or sour sensation | 8 | Hubei (3), Anhui (2), Yunnan (2), Sichuan (1) | 82.3 ± 2.7b |
| Components in Tea Infusion | Sweet-Mellow (I) | Mellow-Pure (II) | Less-Mellow (III) | p Values | ||
|---|---|---|---|---|---|---|
| Mean ± SD (µmol/L) | Mean ± SD (µmol/L) | Mean ± SD (µmol/L) | I vs. II | I vs. III | II vs. III | |
| Flavan-3-ols | ||||||
| epigallocatechin, EGC | 0.0 ± 0.0 | 4.2 ± 9.2 | 0.0 ± 0.0 | n.s. | n.s. | n.s. |
| catechin, C | 2.8 ± 9.3 | 2.9 ± 5.0 | 0.0 ± 0.0 | n.s. | n.s. | n.s. |
| epigallocatechin gallate, EGCG | 7.1 ± 7.8 | 17.9 ± 39.6 | 5.6 ± 8.8 | n.s. | n.s. | n.s. |
| epicatechin, EC | 84.8 ± 53.6 | 83.8 ± 54.1 | 52 ± 16.4 | n.s. | n.s. | n.s. |
| gallocatechin gallate, GCG | 5.9 ± 4.6 | 4.9 ± 2.5 | 8.6 ± 4.3 | n.s. | n.s. | 0.037 |
| epicatechin gallate, ECG | 72.5 ± 48.4 | 107.0 ± 79.3 | 58.4 ± 43.0 | n.s. | n.s. | n.s. |
| Theaflavins | ||||||
| theaflavin, TF | 2.0 ± 0.7 | 1.8 ± 0.8 | 1.5 ± 1.0 | n.s. | n.s. | n.s. |
| theaflavin-3-gallate, TF-3-G | 4.8 ± 2.1 | 3.5 ± 1.1 | 4.0 ± 2.8 | n.s. | n.s. | n.s. |
| theaflavin-3′-gallate, TF-3′-G | 1.3 ± 0.5 | 1.0 ± 0.4 | 0.8 ± 0.4 | n.s. | 0.019 | n.s. |
| theaflavin-3,3′-digallate, TF-3,3′-DG | 16.1 ± 8.4 | 11.4 ± 3.6 | 9.0 ± 5.1 | n.s. | 0.016 | n.s. |
| Amino acids | ||||||
| phospho-l-serine | 11.8 ± 3.1 | 12.5 ± 4.3 | 14.7 ± 4.5 | n.s. | n.s. | n.s. |
| l-aspartic acid | 40.8 ± 16.1 | 47.6 ± 19.8 | 50.5 ± 13.2 | n.s. | n.s. | n.s. |
| l-threonine | 16.7 ± 8.9 | 17.8 ± 11.1 | 24.1 ± 8.1 | n.s. | n.s. | n.s. |
| l-serine | 51.9 ± 31.2 | 49.5 ± 30.2 | 65.0 ± 16.8 | n.s. | n.s. | n.s. |
| l-asparagine | 286.2 ± 223.2 | 171.9 ± 168.3 | 206.2 ± 145.1 | n.s. | n.s. | n.s. |
| l-glutamic acid | 97.6 ± 52.4 | 90.1 ± 58.3 | 120.1 ± 37.7 | n.s. | n.s. | n.s. |
| l-theanine | 339.6 ± 154.3 | 345.8 ± 167.7 | 442.3 ± 182.3 | n.s. | n.s. | n.s. |
| l-proline | 26.0 ± 17.1 | 24.6 ± 16.0 | 24.7 ± 8.7 | n.s. | n.s. | n.s. |
| l-glycine | 3.7 ± 3.3 | 2.4 ± 3.4 | 3.2 ± 3.8 | n.s. | n.s. | n.s. |
| l-alanine | 27.2 ± 12.9 | 42.0 ± 22.1 | 53.1 ± 16.3 | n.s. | 0.005 | n.s. |
| α-aminobutyric acid | 1.8 ± 3.7 | 3.1 ± 5.0 | 6.0 ± 6.9 | n.s. | n.s. | n.s. |
| l-valine | 35.9 ± 20.1 | 32.0 ± 18.3 | 35.1 ± 13.9 | n.s. | n.s. | n.s. |
| l-cystine | 18.6 ± 10.7 | 17.0 ± 9.7 | 18.8 ± 8.9 | n.s. | n.s. | n.s. |
| l-methionine | 19.9 ± 11.4 | 23.3 ± 13.1 | 28.0 ± 11.7 | n.s. | n.s. | n.s. |
| l-isoleucine | 3.3 ± 6.4 | 9.2 ± 9.8 | 6.7 ± 10.9 | n.s. | n.s. | n.s. |
| l-leucine | 7.9 ± 7.3 | 5.5 ± 8.0 | 7.3 ± 6.7 | n.s. | n.s. | n.s. |
| l-tyrosine | 35.4 ± 18.1 | 27.7 ± 14.2 | 32.0 ± 11.6 | n.s. | n.s. | n.s. |
| γ-aminobutyric acid, GABA | 17.3 ± 12.4 | 26.2 ± 17.8 | 42.9 ± 20.7 | n.s. | 0.003 | 0.034 |
| l-histidine | 3.9 ± 2.4 | 2.8 ± 2.3 | 3.3 ± 1.3 | n.s. | n.s. | n.s. |
| l-tryptophan | 16.7 ± 9.2 | 11.5 ± 6.4 | 11.6 ± 5.2 | n.s. | n.s. | n.s. |
| l-ornithine | 1.1 ± 1.6 | 0.0 ± 0.0 | 0.0 ± 0.0 | 0.005 | 0.013 | n.s. |
| l-lysine | 17.7 ± 12.1 | 14.5 ± 9.3 | 17.3 ± 8.2 | n.s. | n.s. | n.s. |
| l-arginine | 19.2 ± 12.3 | 15.8 ± 12.5 | 27.1 ± 25.4 | n.s. | n.s. | n.s. |
| Flavonol glycosides | ||||||
| vitexin-4”-O-glucoside | 1.7 ± 0.6 | 1.8 ± 0.6 | 2.0 ± 0.7 | n.s. | n.s. | n.s. |
| myricetin 3-O-galactoside | 4.8 ± 2.8 | 5.9 ± 3.9 | 5.4 ± 4.7 | n.s. | n.s. | n.s. |
| vitexin-2-O-rhamnoside | 2.4 ± 1.5 | 2.1 ± 0.8 | 2.7 ± 2.3 | n.s. | n.s. | n.s. |
| quercetin-3-O-rutinoside, rutin | 5.7 ± 3.8 | 6.5 ± 2.7 | 9.9 ± 4.4 | n.s. | 0.015 | 0.037 |
| quercetin-3-O-glucoside | 6.7 ± 2.3 | 9.0 ± 3.5 | 10.1 ± 4.8 | n.s. | n.s. | n.s. |
| kaempferol-3-O-rutinoside | 5.1 ± 3.9 | 7.3 ± 4.5 | 5.4 ± 2.7 | n.s. | n.s. | n.s. |
| kaempferol-3-O-glucoside | 3.7 ± 3.4 | 6.4 ± 4.7 | 4.9 ± 2.9 | n.s. | n.s. | n.s. |
| Organic acid | ||||||
| succinic acid | 21.1 ± 6.8 | 22.2 ± 3.6 | 24.9 ± 3.5 | n.s. | 0.02 | n.s. |
| oxalic acid | 629.9 ± 147.9 | 593.6 ± 82.5 | 600.0 ± 60.0 | n.s. | n.s. | n.s. |
| malic acid | 104.1 ± 29.9 | 99.2 ± 12.8 | 116.9 ± 12.2 | n.s. | n.s. | 0.026 |
| citric acid | 122.5 ± 24.4 | 143.8 ± 17.3 | 168.5 ± 11.0 | 0.001 | <0.001 | <0.001 |
| Soluble sugars | ||||||
| glucose | 263.6 ± 73.4 | 197.3 ± 40.3 | 231.2 ± 64.6 | 0.002 | n.s. | n.s. |
| sucrose | 6.7 ± 9.2 | 3.2 ± 2.1 | 2.7 ± 0.7 | n.s. | 0.04 | n.s. |
| total of soluble sugars* | 879.5 ± 626.2 | 845.7 ± 605.0 | 573.3 ± 111.3 | n.s. | n.s. | n.s. |
| Others | ||||||
| gallic acid | 295.0 ± 141.1 | 453.8 ± 157.8 | 326.3 ± 146.9 | 0.013 | n.s. | n.s. |
| caffeine | 1337.1 ± 79.9 | 1441.8 ± 153.1 | 1581.2 ± 194.9 | n.s. | 0.001 | 0.039 |
| Tastant | Dot Values | Threshold | ||
|---|---|---|---|---|
| Sweet-Mellow (I) | Mellow-Pure (II) | Less-Mellow (III) | (µmol/L) | |
| Group 1: Compounds Imparting Puckering Astringency and Rough Oral Sensation | ||||
| epigallocatechin, EGC | 0.000 | 0.008 | 0.000 | 520a |
| catechin, C | 0.007 | 0.007 | 0.000 | 410a |
| epigallocatechin gallate, EGCG | 0.037 | 0.094 | 0.029 | 190a |
| epicatechin, EC | 0.091 | 0.090 | 0.056 | 930a |
| gallocatechin gallate, GCG | 0.015 | 0.013 | 0.022 | 390a |
| epicatechin gallate, ECG | 0.279 | 0.412 | 0.225 | 260a |
| theaflavin, TF | 0.125 | 0.113 | 0.093 | 16a |
| theaflavin-3-gallate, TF-3-G | 0.322 | 0.234 | 0.266 | 15a |
| theaflavin-3′-gallate, TF-3′-G* | 0.087 | 0.068 | 0.055 | 15a |
| theaflavin-3,3′-digallate, TF-3,3′-DG*# | 1.236 | 0.877 | 0.692 | 13a |
| gallic acid*# | 1.010 | 1.554 | 1.117 | 292b |
| Group 2: Compounds Imparting Mouth-Drying and Velvet-like Astringency | ||||
| γ-aminobutyric acid*# | 0.864 | 1.311 | 2.146 | 20a |
| myricetin 3-O-galactoside# | 1.787 | 2.197 | 1.982 | 2.7a |
| vitexin-2-O-rhamnoside | 0.871 | 0.765 | 0.949 | 2.8a |
| quercetin-3-O-rutinoside, rutin*# | 4974.214 | 5668.570 | 8635.034 | 0.00115a |
| quercetin-3-O-glucoside # | 10.276 | 13.913 | 15.563 | 0.65a |
| kaempferol-3-O-rutinoside # | 20.234 | 29.248 | 21.743 | 0.25a |
| vitexin-4″-O-glucoside # | 8.917 | 8.917 | 10.701 | 0.11e |
| kaempferol-3-O-glucoside # | 5.460 | 9.534 | 7.338 | 0.67a |
| theanine | 0.057 | 0.058 | 0.074 | 6000a |
| Group 3: Bitter-tasting compounds | ||||
| caffeine*# | 2.674 | 2.884 | 3.162 | 500a |
| valine | 0.002 | 0.002 | 0.002 | 21,000a |
| isoleucine | 0.000 | 0.001 | 0.001 | 11,000a |
| leucine | 0.001 | 0.000 | 0.001 | 12,000a |
| tyrosine | 0.007 | 0.006 | 0.006 | 5000a |
| histidine | 0.000 | 0.000 | 0.000 | 45,000b |
| tryptophan | 0.004 | 0.003 | 0.003 | 4400c |
| lysine | 0.000 | 0.000 | 0.000 | 80,000b |
| arginine | 0.000 | 0.000 | 0.000 | 75,000b |
| epigallocatechin gallate, EGCG | 0.019 | 0.047 | 0.015 | 380a |
| epicatechin, EC | 0.091 | 0.090 | 0.056 | 930a |
| gallocatechin gallate, GCG | 0.015 | 0.013 | 0.022 | 390a |
| Group 4: Umami-like taste compounds | ||||
| glutamic acid | 0.033 | 0.030 | 0.040 | 3000a |
| aspartic acid | 0.010 | 0.012 | 0.013 | 4000a |
| theanine | 0.014 | 0.014 | 0.018 | 24,000d |
| asparagine | 0.006 | 0.003 | 0.004 | 50,000b |
| Group 5: Sweet-like taste compounds | ||||
| glucose* | 0.003 | 0.002 | 0.003 | 90,000a |
| sucrose* | 0.000 | 0.000 | 0.000 | 24,000a |
| threonine | 0.000 | 0.000 | 0.001 | 40,000a |
| serine | 0.002 | 0.002 | 0.002 | 30,000a |
| proline | 0.001 | 0.001 | 0.001 | 26,000a |
| glycine | 0.000 | 0.000 | 0.000 | 30,000a |
| alanine* | 0.003 | 0.005 | 0.007 | 8000a |
| methionine | 0.004 | 0.005 | 0.006 | 5000a |
| ornithine* | 0.000 | 0.000 | 0.000 | 3500a |
| theanine | 0.014 | 0.014 | 0.018 | 24,000d |
| Group 6: Sour taste compounds | ||||
| succinic acid* | 0.023 | 0.025 | 0.028 | 900a |
| oxalic acid | 0.112 | 0.106 | 0.107 | 5600a |
| malic acid | 0.028 | 0.027 | 0.032 | 3700a |
| citric acid* | 0.047 | 0.055 | 0.065 | 2600a |
| Compound Supplemented | Taste Quality of Background Tea Infusion | Concentration of the Tested Compound in Background Tea Infusion (µmol/L) | Supplementation concentration for Taste Transformation (µmol/L) | Recognition Rate | Taste Transformation after Supplementation | Whether Consistent in Quantitative Difference | “Natural” Concentration (µmol/L) | Whether Final Concentration Is within the Range of “Natural” Concentration |
|---|---|---|---|---|---|---|---|---|
| caffeine | sweet-mellow | 1220.8 | 515.0 | 100% | sweetness-, bitterness+ | Yes | 1152–1861.7 | Yes |
| TF-3′-G | mellow-pure | 0.7 | 7.0 | 71% | sweetness-, astringency+ | No | 0.3–1.9 | No |
| TF-3,3′-DG | mellow-pure | 6.0 | 12.6 | 83% | sweetness-, astringency+ | No | 2.6–27.9 | Yes |
| γ-aminobutyric acid, GABA | sweet-mellow | 18.8 | 19.0 | 80% | sweetness-, astringency+, bitterness+ | Yes | 2.6–70.1 | Yes |
| quercetin-3-O-rutinoside, rutin | sweet-mellow | 1.3 | 0.0023 | 100% | sweetness-, astringency+, bitterness+ | Yes | 1.3–16.9 | Yes |
| succinic acid | sweet-mellow | 19.6 | 450.0 | 100% | sweetness-, sour+ | Yes | 14.1–38.8 | No |
| citric acid | sweet-mellow | 119.5 | 325.0 | 86% | sweetness-, sour+ | Yes | 89.5–186.7 | No |
| gallic acid | sweet-mellow | 93.7 | 200.0 | 71% | sweetness-, sour+, astringency+ | Yes | 93.7–830.9 | Yes |
| glucose | mellow-pure | 144.9 | 45,000.0 | 86% | sweetness+ | Yes | 82.0–372.8 | No |
| sucrose | mellow-pure | 1.8 | 24,000.0 | 100% | sweetness+ | Yes | 0.93–34.7 | No |
| alanine | mellow-pure | 11.6 | 23,546.0 | 78% | sweetness+ | No | 8.5–75.1 | No |
| ornithine | mellow-pure | n.d. | 11,346.0 | 100% | sweetness+ | Yes | 0–3.9 | No |
© 2019 by the authors. Licensee MDPI, Basel, Switzerland. This article is an open access article distributed under the terms and conditions of the Creative Commons Attribution (CC BY) license (http://creativecommons.org/licenses/by/4.0/).
Share and Cite
Li, J.; Yao, Y.; Wang, J.; Hua, J.; Wang, J.; Yang, Y.; Dong, C.; Zhou, Q.; Jiang, Y.; Deng, Y.; et al. Rutin, γ-Aminobutyric Acid, Gallic Acid, and Caffeine Negatively Affect the Sweet-Mellow Taste of Congou Black Tea Infusions. Molecules 2019, 24, 4221. https://doi.org/10.3390/molecules24234221
Li J, Yao Y, Wang J, Hua J, Wang J, Yang Y, Dong C, Zhou Q, Jiang Y, Deng Y, et al. Rutin, γ-Aminobutyric Acid, Gallic Acid, and Caffeine Negatively Affect the Sweet-Mellow Taste of Congou Black Tea Infusions. Molecules. 2019; 24(23):4221. https://doi.org/10.3390/molecules24234221
Chicago/Turabian StyleLi, Jia, Yuefeng Yao, Jiaqin Wang, Jinjie Hua, Jinjin Wang, Yanqin Yang, Chunwang Dong, Qinghua Zhou, Yongwen Jiang, Yuliang Deng, and et al. 2019. "Rutin, γ-Aminobutyric Acid, Gallic Acid, and Caffeine Negatively Affect the Sweet-Mellow Taste of Congou Black Tea Infusions" Molecules 24, no. 23: 4221. https://doi.org/10.3390/molecules24234221
APA StyleLi, J., Yao, Y., Wang, J., Hua, J., Wang, J., Yang, Y., Dong, C., Zhou, Q., Jiang, Y., Deng, Y., & Yuan, H. (2019). Rutin, γ-Aminobutyric Acid, Gallic Acid, and Caffeine Negatively Affect the Sweet-Mellow Taste of Congou Black Tea Infusions. Molecules, 24(23), 4221. https://doi.org/10.3390/molecules24234221