2.1. Intrinsic Protein Fluorescence
The emission spectrum of the intrinsic fluorescence of Sa-MVs in Tris buffer freshly isolated from the cell suspensions is presented in
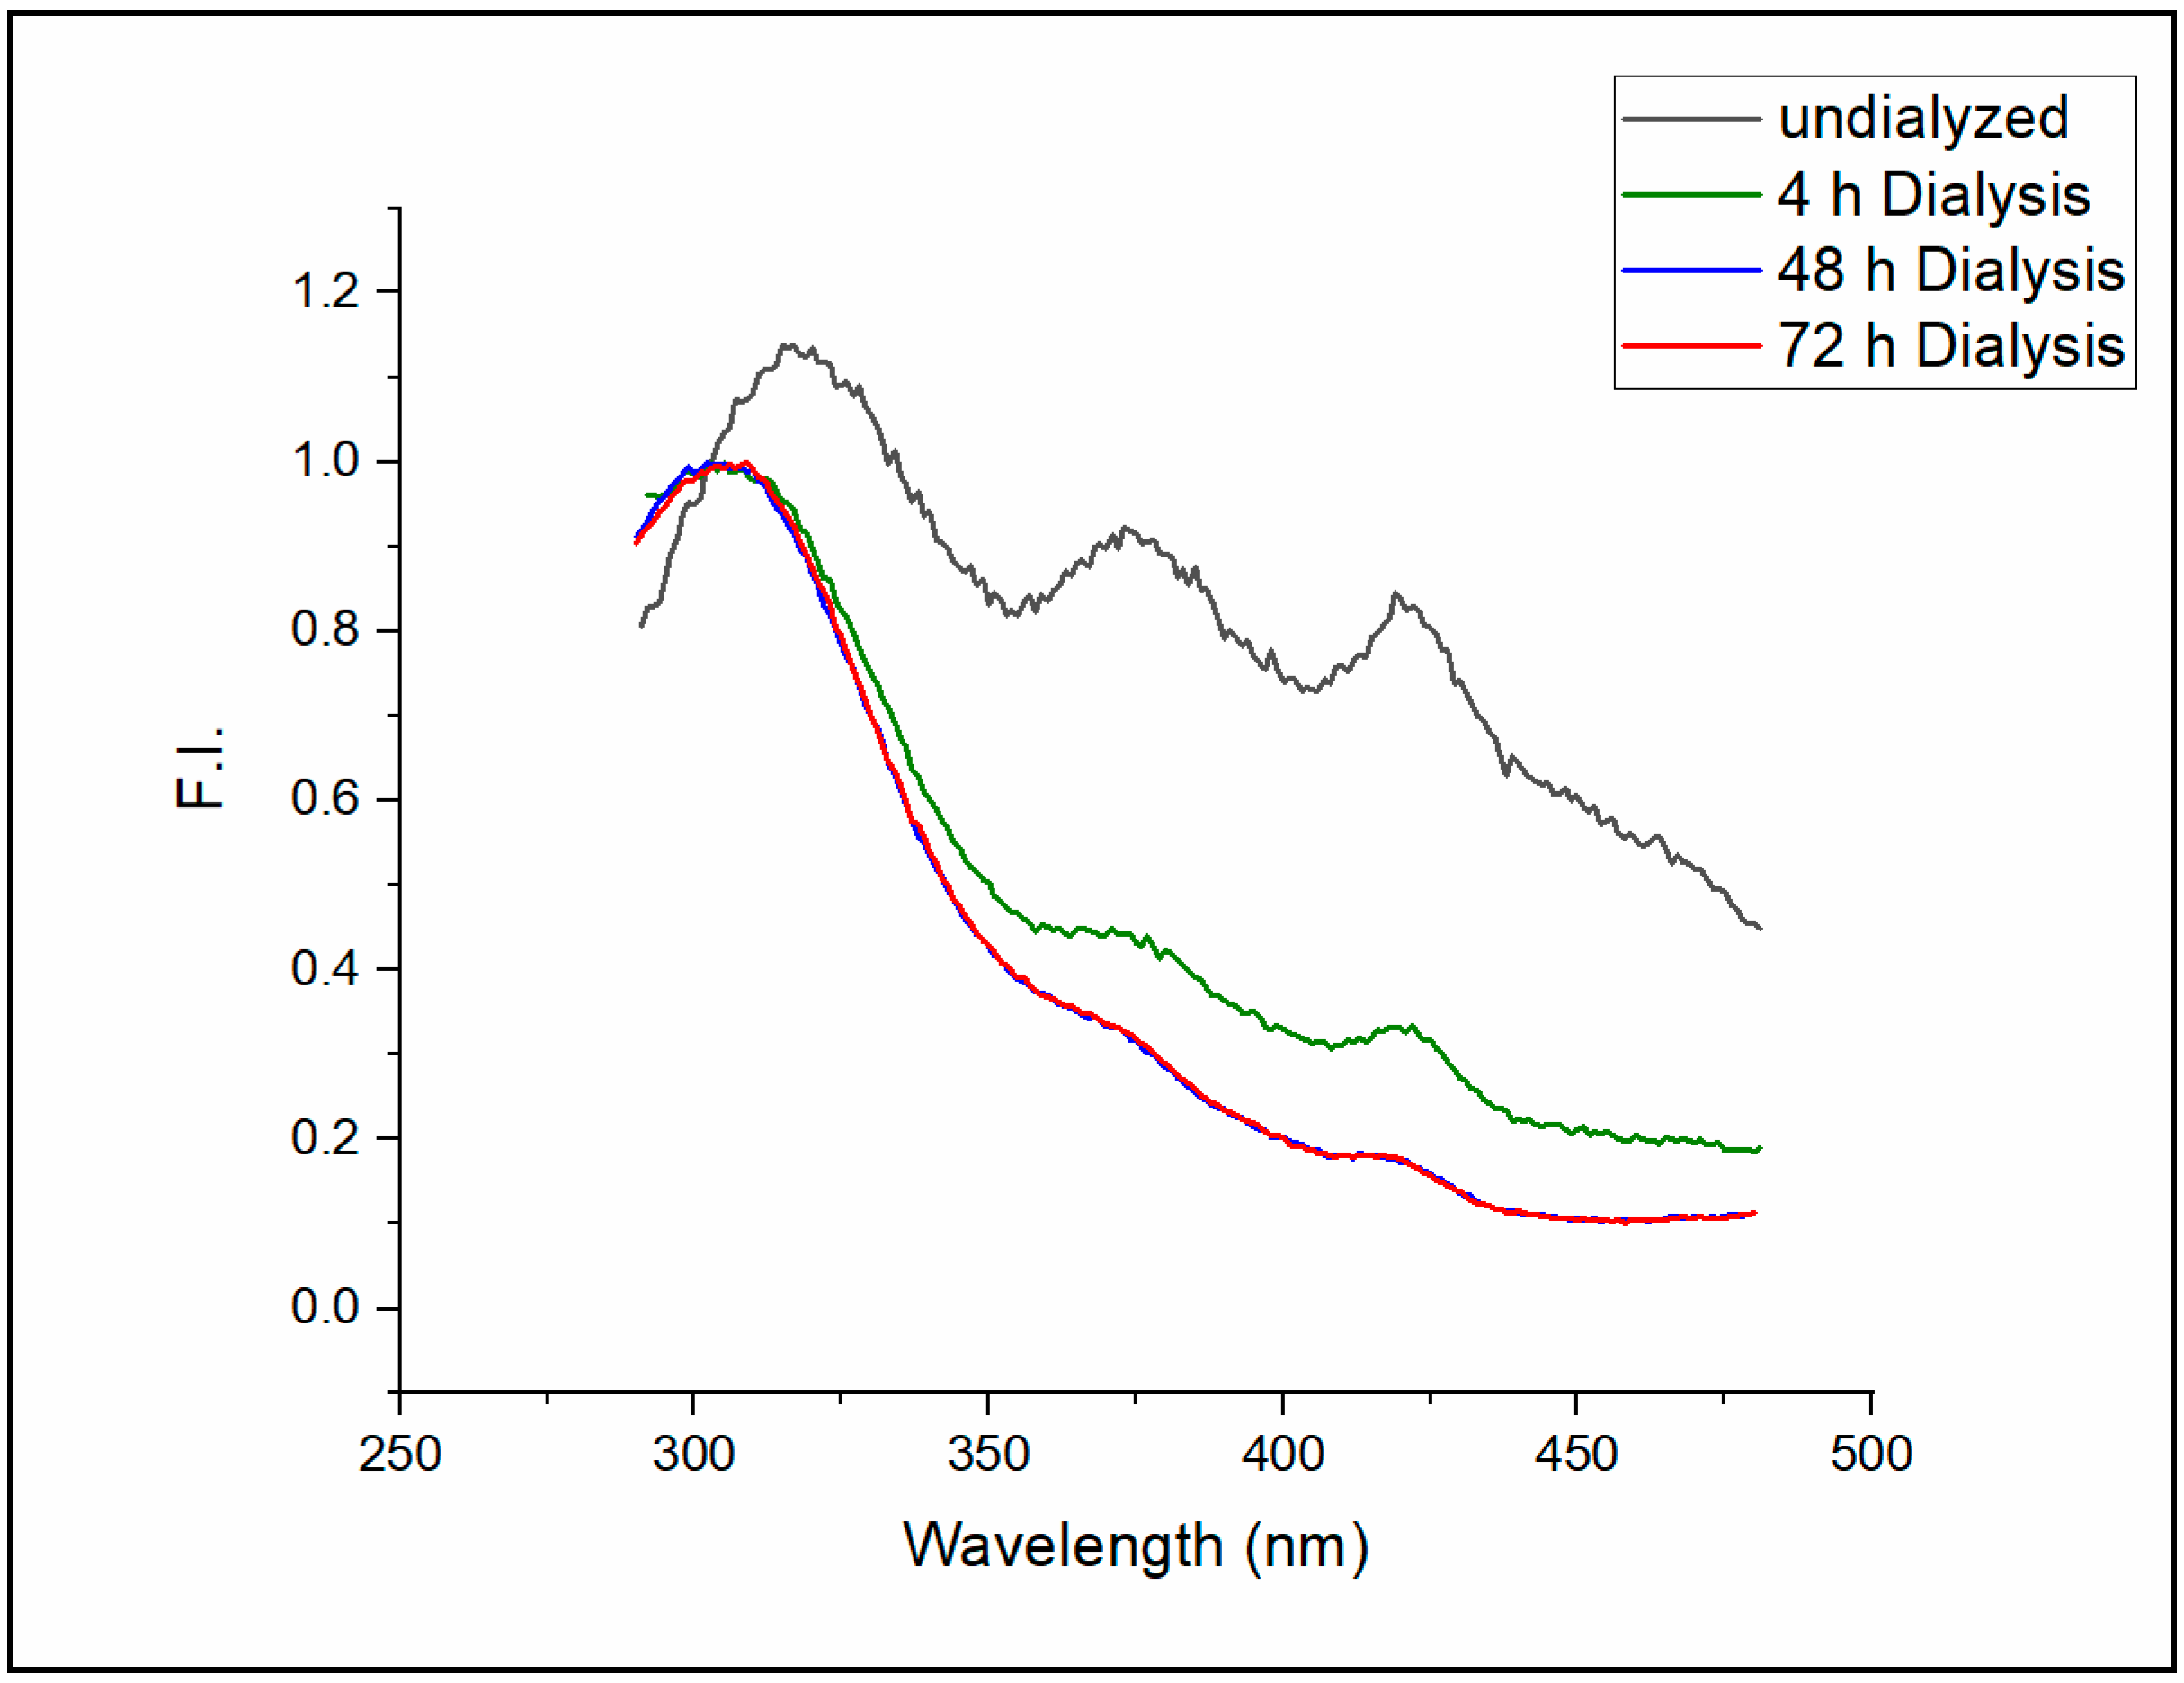
Figure 2 (black curve, labeled as “undialyzed”). Three emission peaks (Peaks I, II and III) were detected at 316, 373, and 420 nm, respectively, when excited at 275 nm. After the dialysis (MWCO 25 kDa, Spectra/Por membrane, Spectrum, Houston, TX) of Sa-MVs against the same Tris buffer (1 mL sample versus 2 L buffer) for 4 h, the intensities of Peaks II and III were reduced significantly, while the emission wavelengths of these two peaks did not shift (
Figure 2, green curve). Additional dialysis against 2 L buffer with the buffer changed every four hours for 48 h further reduced the fluorescence intensities of Peak II and Peak III while Peak I remained as the dominating fluorescence peak of Sa-MVs (
Figure 2, blue curve). The emission spectrum of the intrinsic Sa-MV fluorescence is virtually unchanged after 48 h of dialysis (
Figure 2, red curve for 72 h dialysis).
Light at 275 nm excites both tryptophans and tyrosines in Sa-MVs. Based on the emission wavelengths at the peaks, it can be suggested that Peaks II and III in
Figure 2 do not originate from tryptophans nor tyrosines in Sa-MV proteins. Since Peaks II and III can be significantly reduced to a minimal level by dialysis, these two fluorescence peaks most likely come from some small molecules, either originally produced by the cells or inherited from the cell growth environment, that are loosely bound to Sa-MVs. Extensive dialysis can reduce but cannot completely eliminate these two fluorescent peaks, suggesting that these small molecules also have tight binding to Sa-MV membranes or some Sa-MV proteins. The particle size and the PDI value of Sa-MVs do not change with dialysis (
Table S2, Supplemental Materials), indicating that those small molecules that are removed by dialysis are not S-layer proteins nor membrane lipids. A thorough investigation of the chemical identifies of Peaks II and III will be undertaken in the future and is beyond the scope of the current study. In the present study, we focus on Peak 1 (
Figure 2) because we believe it originates from protein intrinsic fluorescence, which would bear more biological interests such as the structures and dynamics of protein folding and association.
Extensive dialysis caused the apparent emission maximum of Peak I to shift from 316 nm to 303 nm (
Figure 2, measured at room temperature, ~23 °C). Intrinsic protein fluorescence peaked around 303 nm is rare, which requires some discussion. Intrinsic protein fluorescence mainly comes from tryptophans and tyrosines. Since tyrosine has an extinction coefficient four times lower than tryptophan and since tyrosine fluorescence is often quenched in the protein by a variety of mechanisms including energy transfer to tryptophans, tryptophan usually dominates intrinsic protein fluorescence [
11]. A prominent example is bovine serum albumin (BSA), which has 18 tyrosines and 2 tryptophans. While tryptophan takes up only 10% of the fluorescent aromatic amino acids (disregarding phenylalanine due to its low extinction coefficient and fluorescence quantum yield), the emission spectrum of BSA in solution is dominated by tryptophans, showing a maximum fluorescence intensity at 345 nm [
12].
The fluorescence emission spectrum of dialyzed Sa-MVs shown in
Figure 2 could be an exception, in addition to the case of the bacterial elongation factor Tu [
13], to the general trend that tryptophan dominates intrinsic fluorescence of proteins that contain both tryptophans and tyrosines. Sa-MVs have 29 distinct proteins and most, if not all, Sa-MV proteins contain multiple tryptophans and tyrosines [
1]. The most abundant protein species in Sa-MVs are the S-layer proteins [
1], namely, SlaA and SlaB [
4]. SlaA from
S. acidocaldarius contains 96 tyrosines and 6 tryptophans [
14]. To our knowledge, the amino acid composition of SlaB from
S. acidocaldarius has not been reported yet, however, SlaB from a similar thermoacidophilic archaeon
Sulfolobus solfataricus contains 16 tyrosines and one tryptophan [
15]. Since about 95% of the fluorescent aromatic amino acids in the S-layer proteins are tyrosines and since the fluorescence of free tyrosine in solution at neutral pH has an emission maximum at 303 nm [
16], it is not unreasonable to observe that the emission maximum of dialyzed Sa-MVs occurs at 303 nm when excited at 275 nm (
Figure 2). It is possible that, unlike the case of BSA [
12], tyrosine fluorescence in Sa-MVs is not quenched and tryptophan fluorescence is not dominating.
A tightly packed protein matrix in Sa-MVs near tyrosine and tryptophan residues could be another plausible explanation for the observation of the emission maximum at the low wavelength 303 nm. One precedent is the fluorescence of
Pseudomonas fluorescens azurin, which has an emission maximum at 305–308 nm when excited at 275 nm [
17].
Pseudomonas fluorescens azurin is a single tryptophan protein, and its low wavelength for emission maximum has been attributed to the apolar environment surrounding the tryptophan residue, which is almost completely shielded from water [
18]. Another precedent is the fluorescence of the mutant dI component of transhydrogenases from
Rhodospir illum rubrum, which gives an emission maximum at 303.5 nm due to the tryptophan residues embedded in a very rigid microenvironment [
19]. It is possible that, like azurin and the dI mutant, most of the fluorescent amino acid residues in Sa-MVs are also in a tightly packed, water-shielded protein matrix, thus giving such an extreme low wavelength for the emission maximum. However, unlike azurin, which is molecularly dispersed in solution, S-layer proteins, the most dominant proteins in Sa-MVs, aggregate at the particle surface and are supposed to from regular crystalline lattices as they do on the surface of the archaea cells. In addition, some other proteins in Sa-MVs are also anchored in the tightly packed tetraether lipid membrane located under the S-layer. Thus, it is of interest to test if there is spectroscopic evidence for the chromophores of the fluorescent aromatic amino acid residues in Sa-MV proteins (mainly S-layer proteins) to from H- or J-aggregates [
20].
We have used the surfactant n-tetradecyl-β-
d-maltoside (TDM) as a tool to investigate the spectral difference in intrinsic protein fluorescence between native Sa-MVs (aggregation of S-layer proteins) and microvesicles completely disrupted by TDM (dis-aggregation of S-layer proteins). The critical micelle concentration (CMC) of TDM is 0.015 mM at 20 °C [
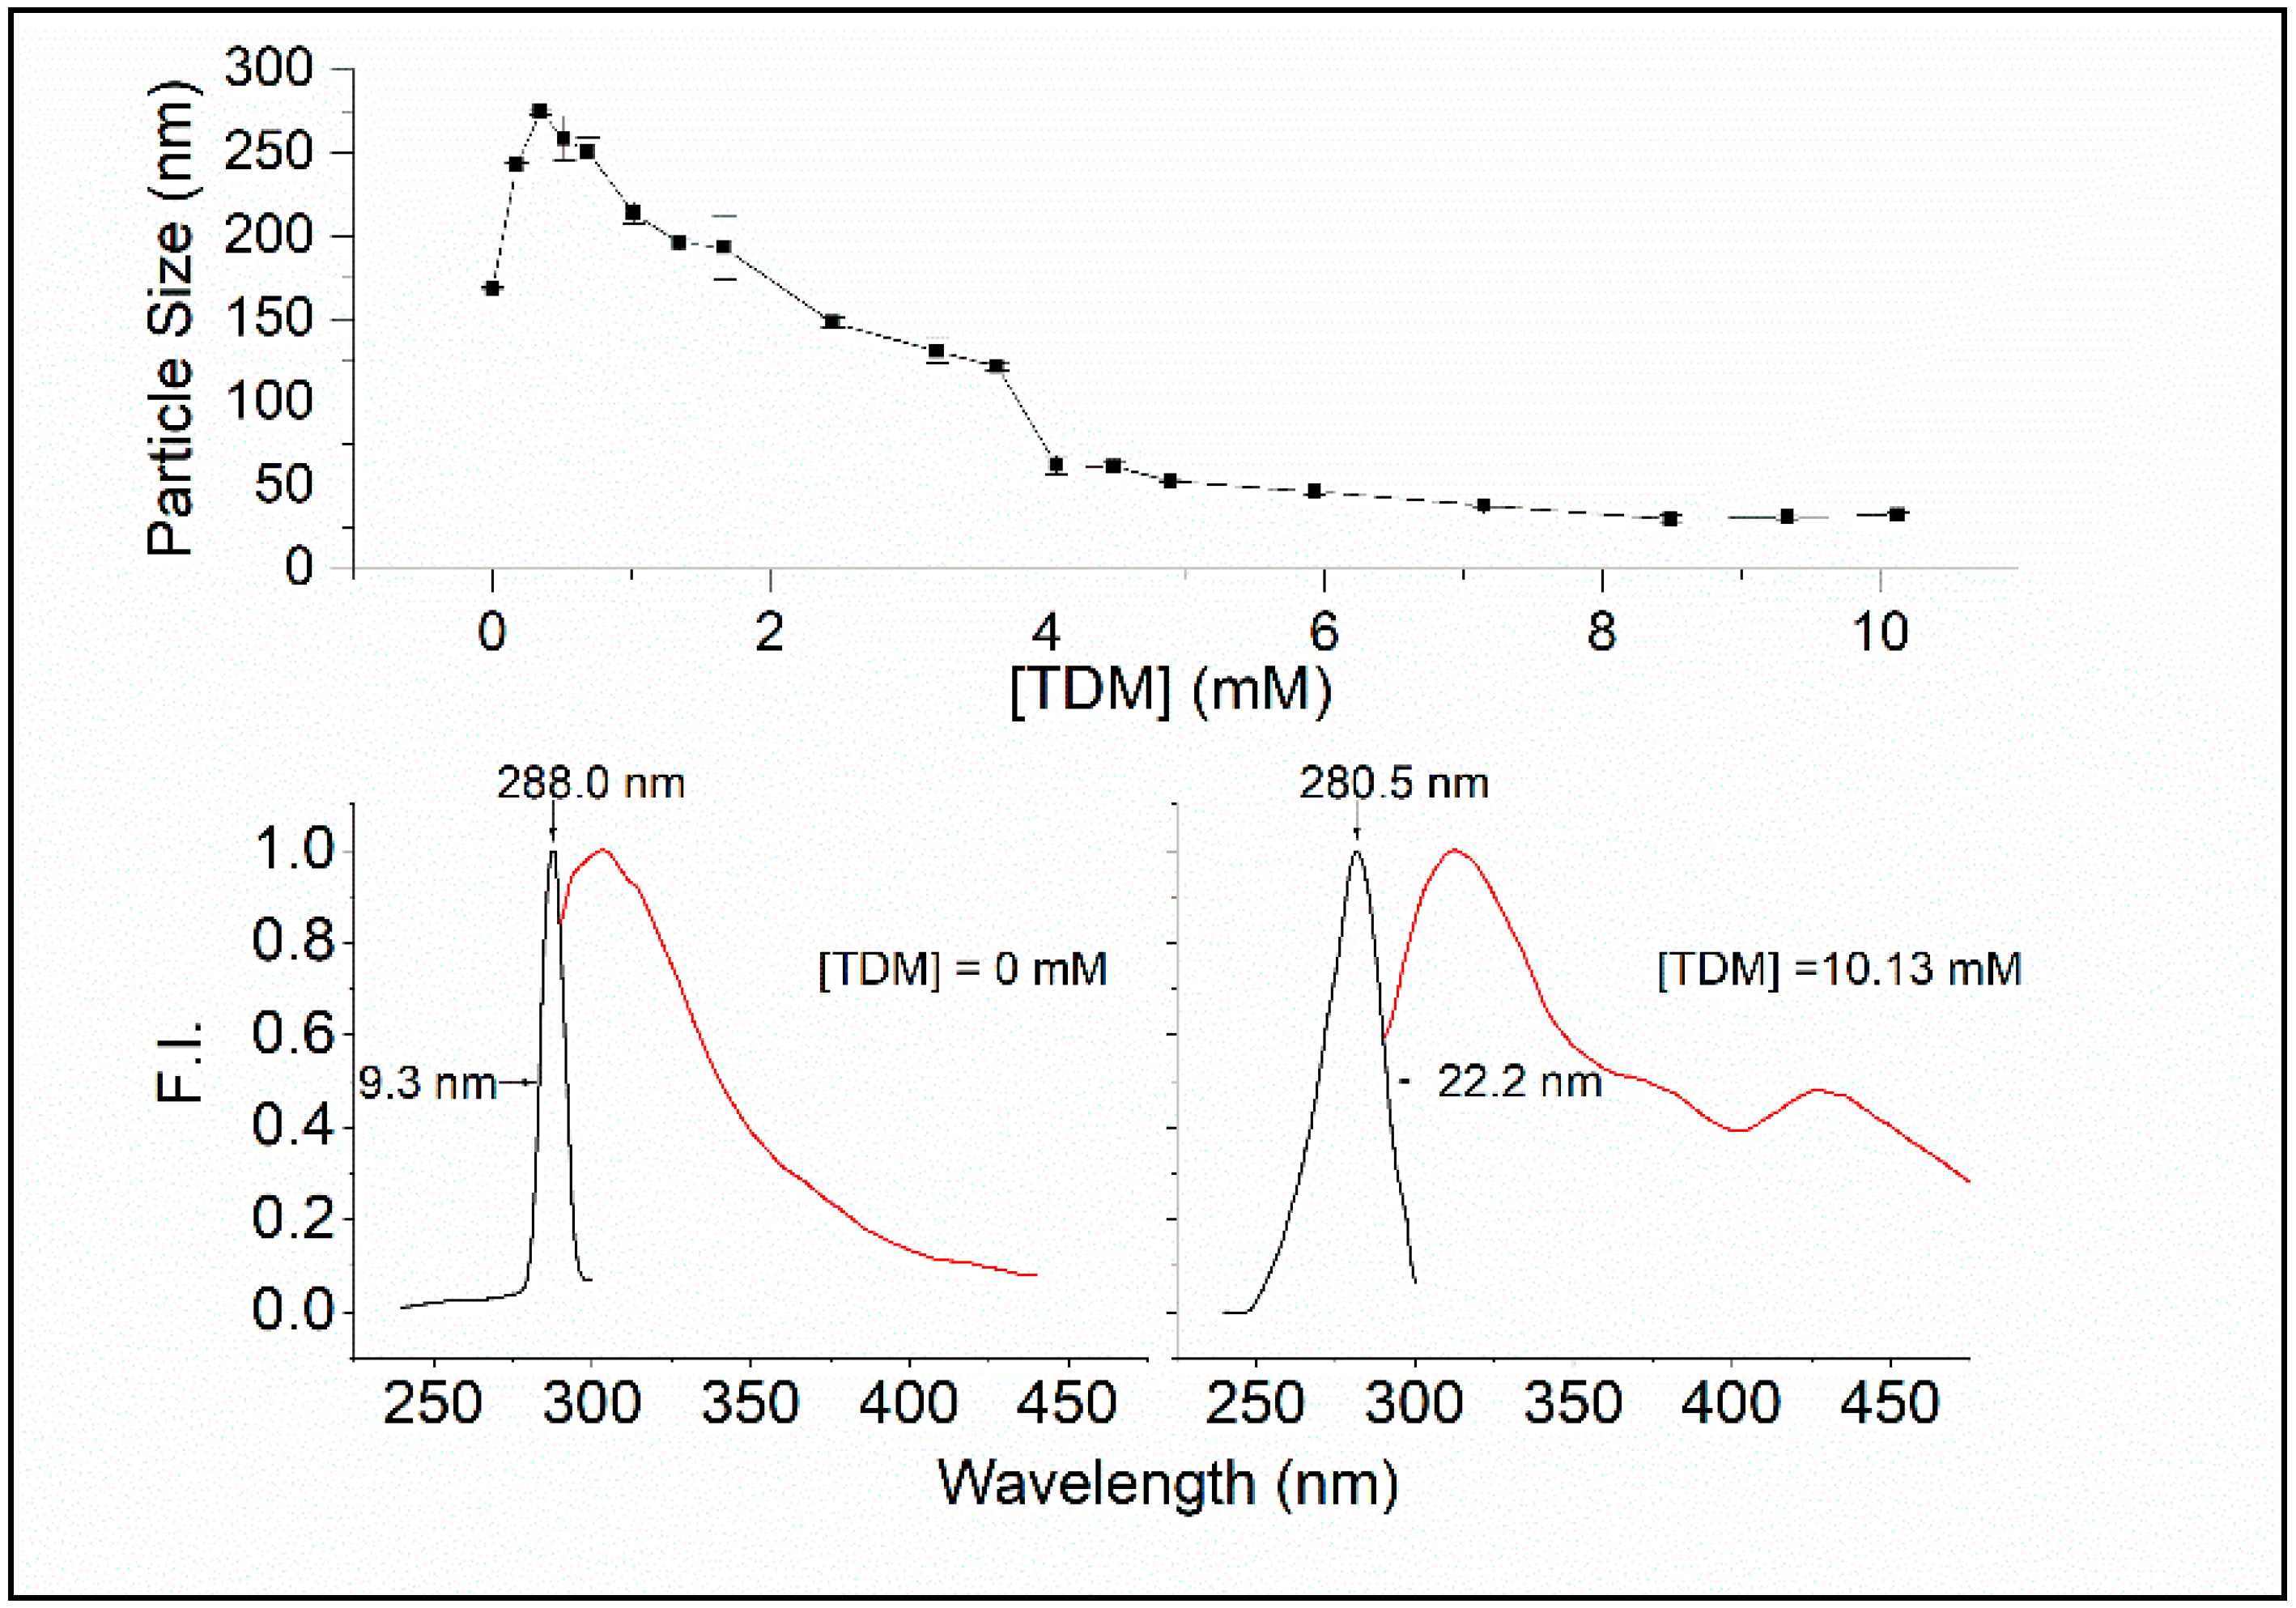
21]. As shown in
Figure 3 (top), the particle size of dialyzed Sa-MVs increases by ~100 nm from 0 to ~0.2 mM TDM, which probably reflects the insertion of the surfactant into the vesicle membrane, according to the three-stage model of the surfactant–membrane interactions [
22,
23]. At ~0.2 mM, TDM insertion reaches the limit. Thereafter, mixed micelles are formed, and vesicle disruption occurs, eventually leading to small fragments of 20–30 nm at high [TDM] (
Figure 3, top). A similar trend was seen in our previous study of Sa-MVs against the surfactant Triton X-100 [
8].
The bottom panel of
Figure 3 shows that there are significant differences in spectral properties between Sa-MVs in the absence of TDM and presence of 10.13 mM TDM. In the absence of TDM, the emission maximum of Sa-MVs appears at 303.5 nm and the excitation maximum is at 288 nm. At (TDM) = 10.13 mM, the emission max appears at 312 nm and the excitation maximum is at 280.5 nm. There is a red shift by 7.5 nm in the excitation spectrum and an increase in excitation band sharpness, with the width of half maximum changed from 22.2 nm to 9.3 nm, when S-layer proteins are changed from the dis-aggregated state ((TDM) = 10.13 mM) to the aggregated state ((TDM) = 0) (
Figure 3).
The red shift, in conjunction with an increase in excitation band sharpness, is indicative of the occurrence of J-aggregates [
20,
24,
25]. In J-aggregates, molecules are aligned parallel, with the transition dipole moments of the chromophore coherently coupled, head-to-tail, resulting in delocalization of electronically excited states over many (typically 3–50) monomeric chromophores [
25,
26]. When forming J-aggregates, the excitation energy level is lowered and as a result the excitation/absorption band undergoes a red shift.
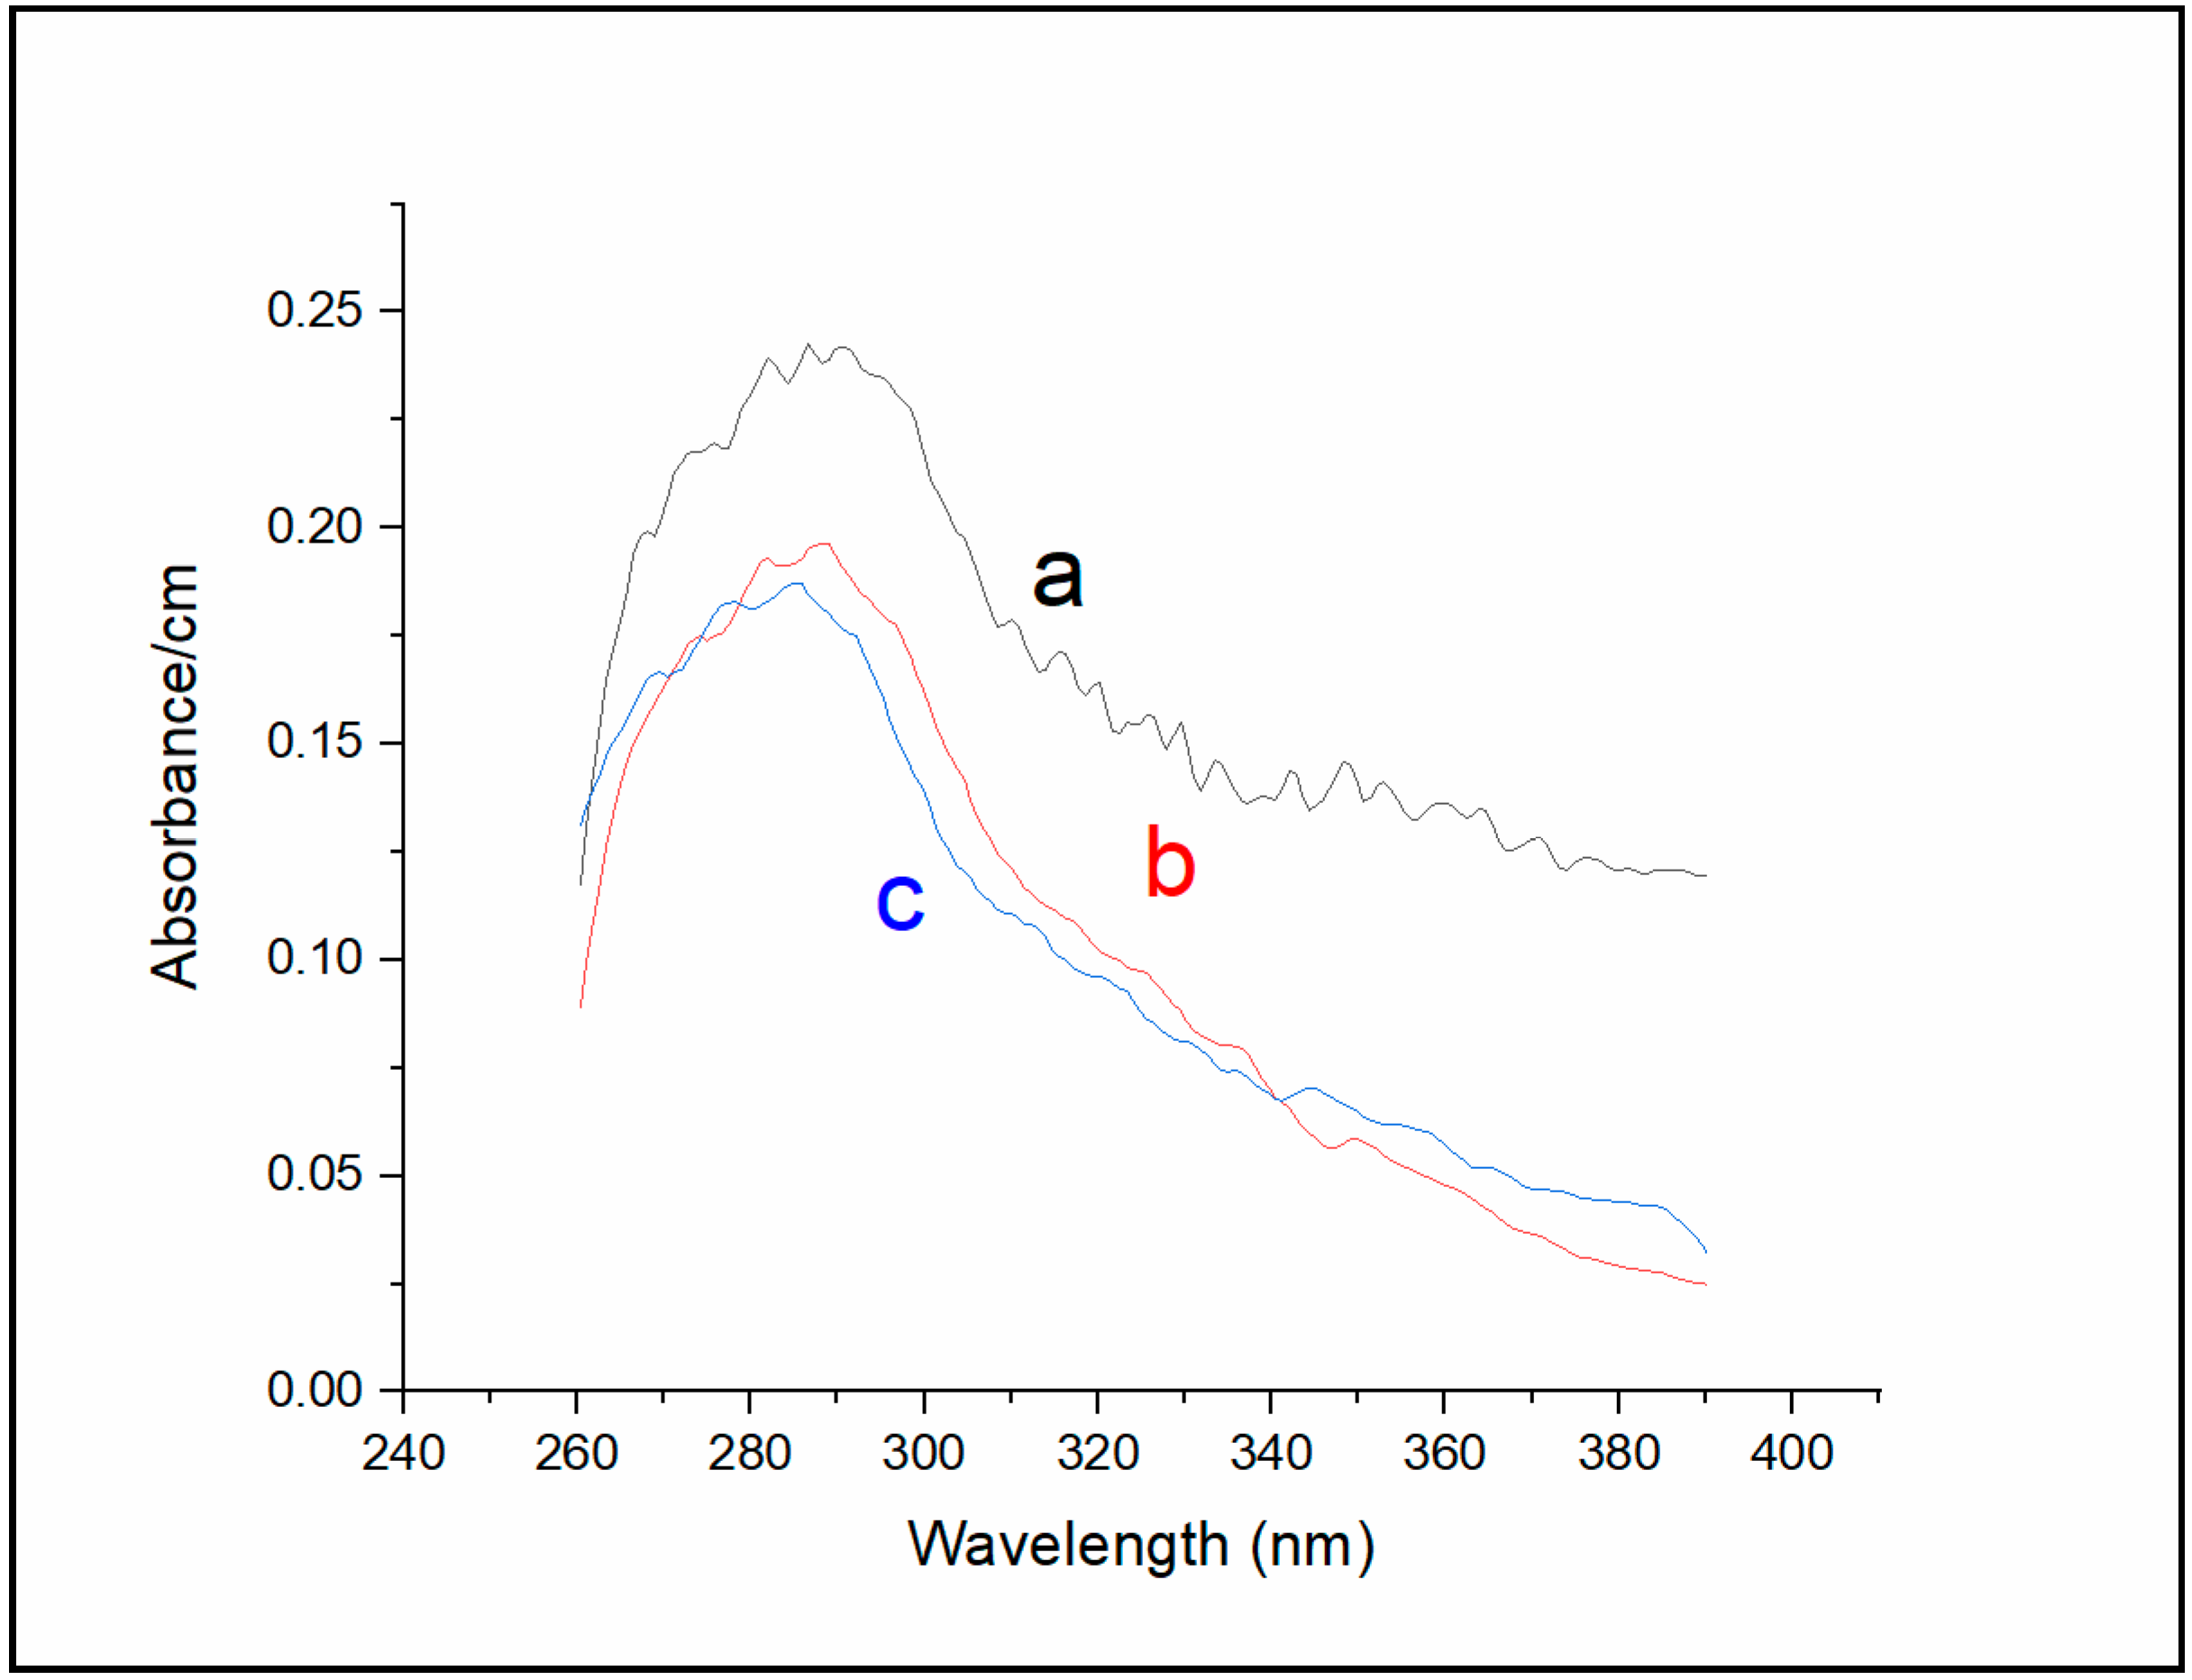
Absorption measurements of Sa-MVs (
Figure 4) yielded the results consistent with those obtained from fluorescence measurements (
Figure 2 and
Figure 3).
Figure 4 (curve a) shows that the major absorption band of un-dialyzed Sa-MVs peaked at 287 nm, with a broad shoulder in the region 310–390 nm. This broad shoulder is significantly reduced after 72 h of dialysis against buffer (curve b,
Figure 4). The dialyzed Sa-MVs in the absence of TDM exhibit an absorbance maximum at 288 nm (curve b,
Figure 4). In the presence of 11 mM TDM, when the S-layer proteins are dis-aggregated, the absorption maximum of dialyzed Sa-MVs is shifted to a shorter wavelength, 285 nm (curve c,
Figure 4), similar to the trend observed in
Figure 3. The excitation spectra shown in
Figure 3 are sharp because they were determined by measuring the fluorescence intensity at 315 ± 8 nm, which monitored only the intrinsic protein fluorescence. In contrast, the protein absorption spectra shown in
Figure 4 were relatively broad due to the presence of non-protein “impurities” (i.e., those responsible for Peaks 1 and 2 in
Figure 2).
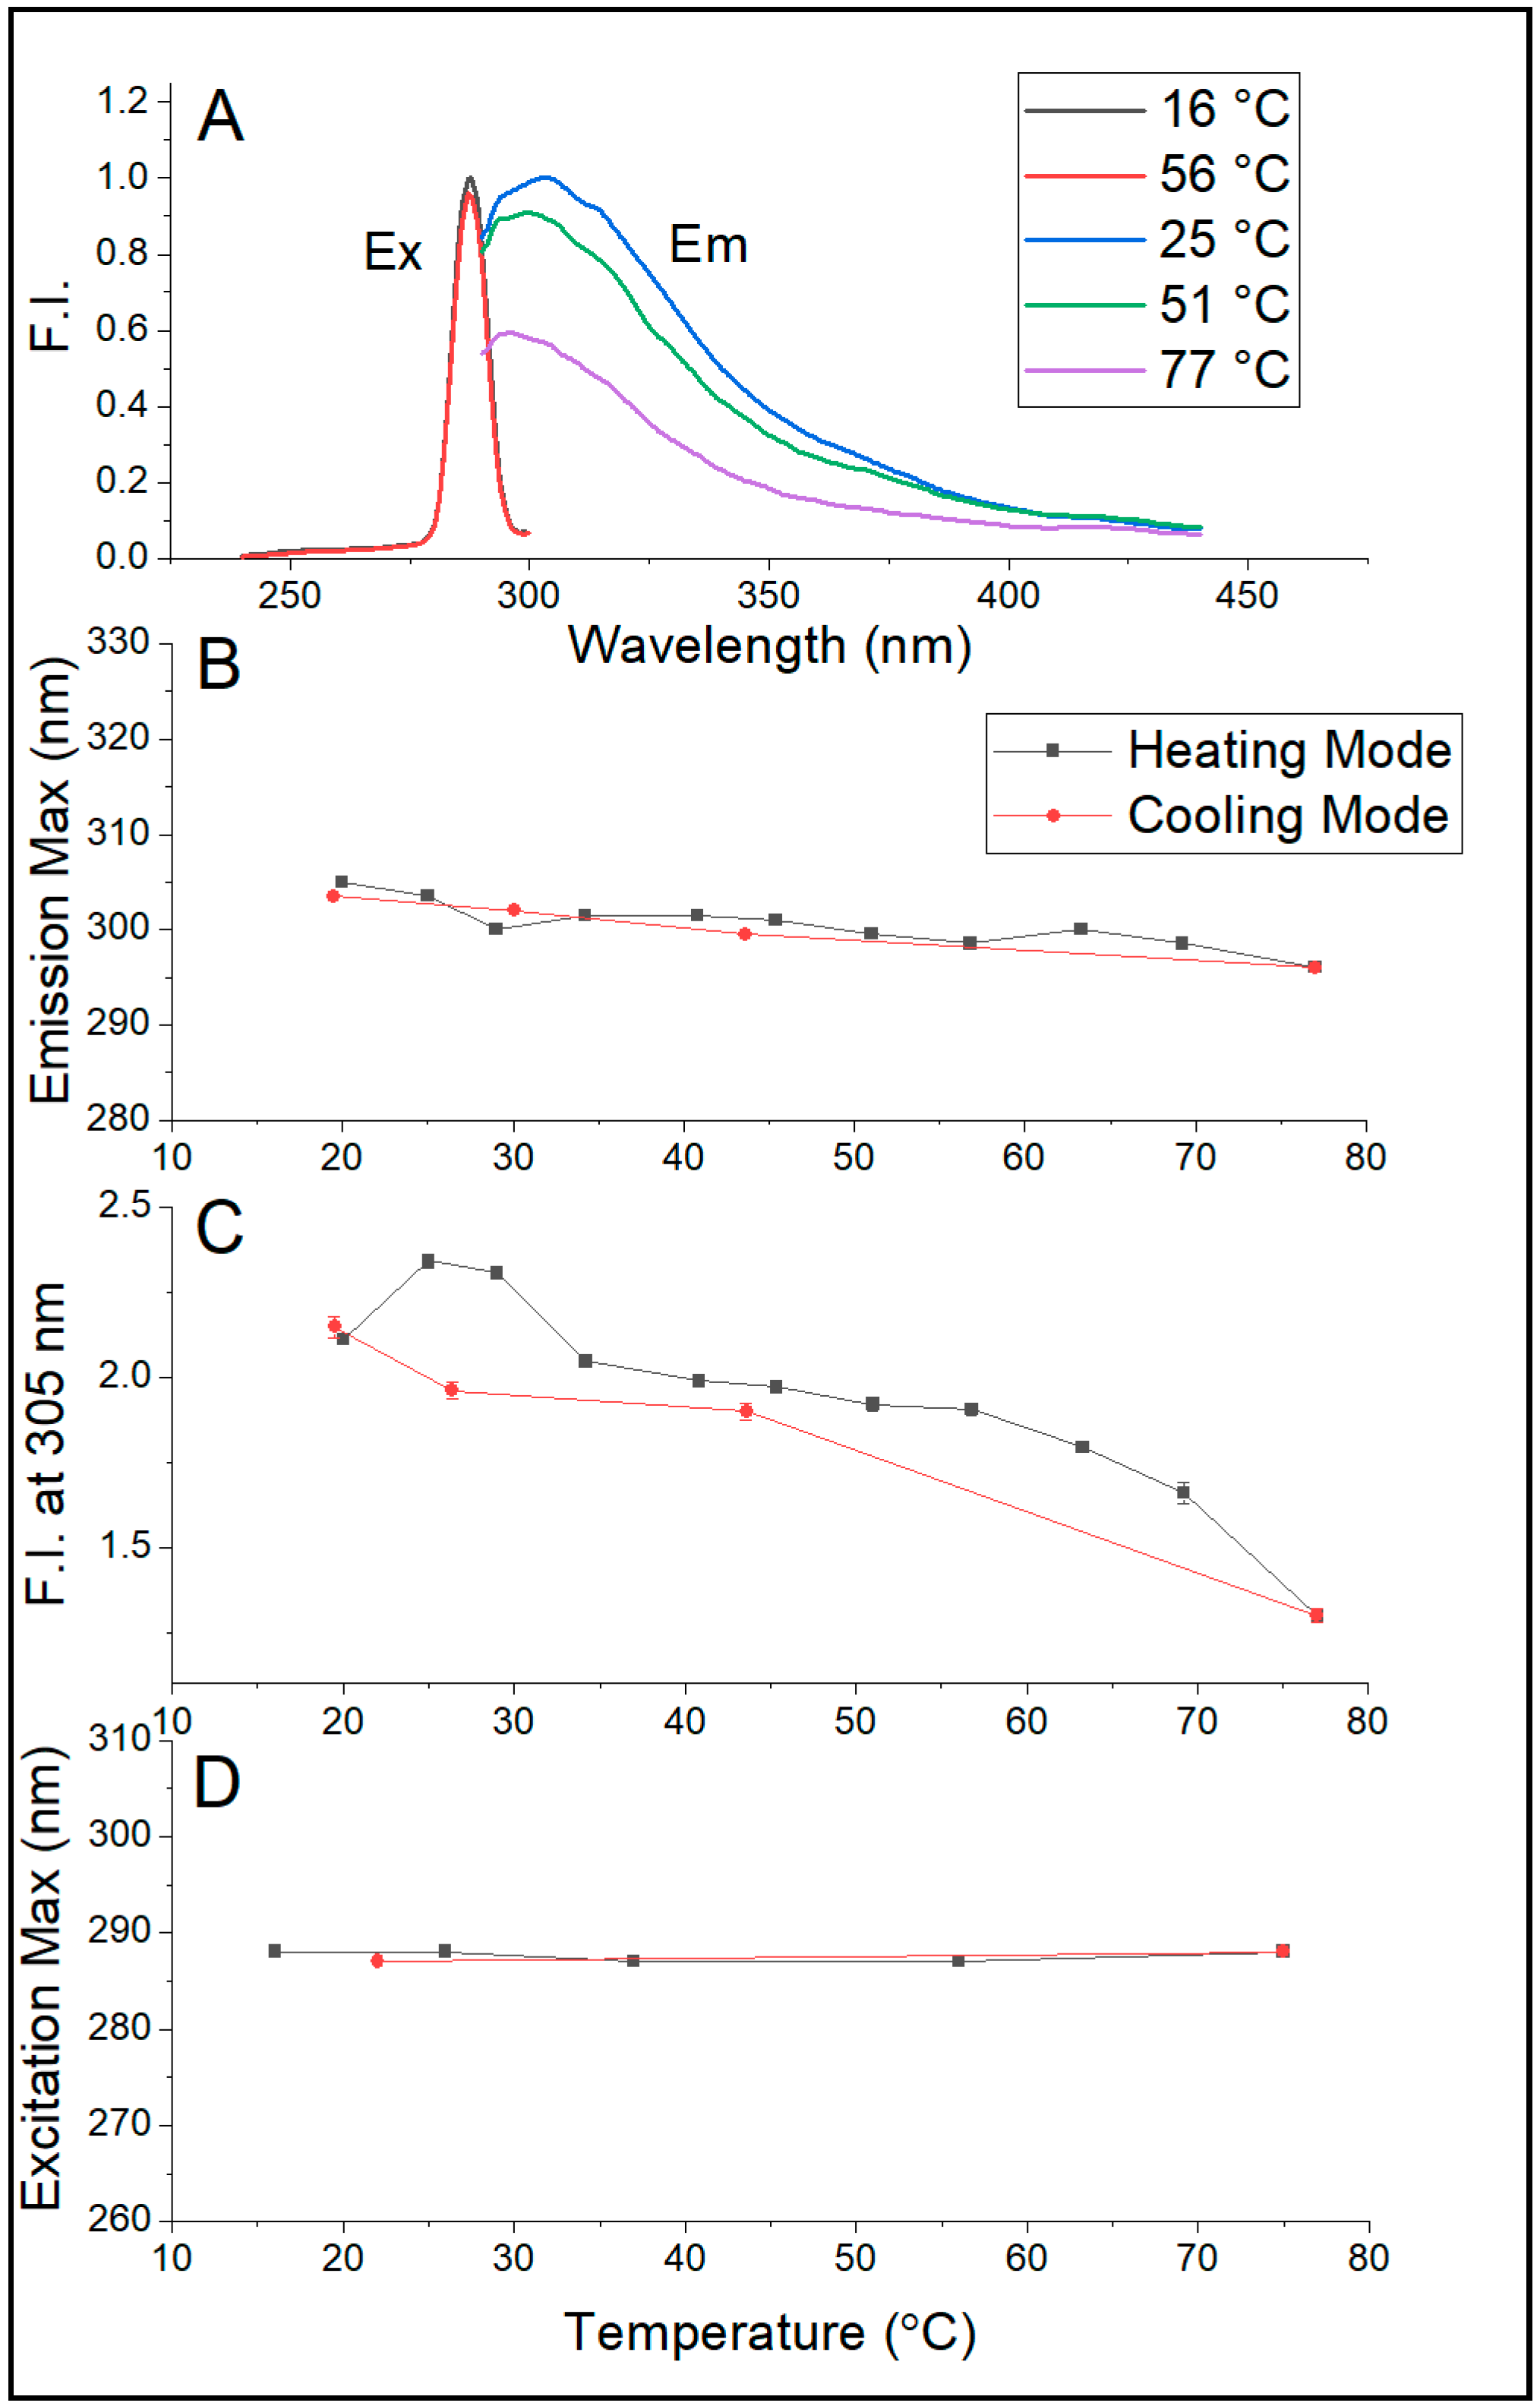
Figure 5A,B show that the emission maximum of Sa-MVs in Tris buffer decreases monotonically and significantly with increasing temperature, changing from 303–305 nm at 20 °C to 296 nm at 75.4 °C. This temperature-induced blue shift is reversible upon cooling. A similar blue shift in λ
em,max was observed (
Table S3, Supplemental Materials) when Sa-MVs were dispersed in 50 mM pyrophosphate buffer (pH 7.2). This test excludes the possibility that the blue shift in λ
em,max shown in
Figure 5B comes from the pH change due to the use of Tris buffer as the temperature dependence of pH is much less in pyrophosphate buffer than in Tris buffer.
This 7–9 nm blue shift in emission maximum (
Figure 5B) is an interesting observation because elevated temperature usually unfolds the proteins, increases protein volume fluctuations, and makes aromatic amino acid residues more exposed to aqueous phase, which would lead to a red shift in emission maximum. Apparently, these did not happen to proteins in Sa-MVs. It is likely that the majority of the proteins in Sa-MVs (i.e., S-layer proteins) are retained in a very tightly packed situation over the entire temperature range examined (20–75 °C). This assertion is reasonable as liposomal membranes made of bipolar tetraether lipids have been shown to exhibit relatively low temperature dependence of solute permeation and volume fluctuation [
27,
28] and as S-layer proteins and many other proteins in Sa-MVs are membrane bound [
1]. The observed blue shift in emission maximum with increasing temperature may simply arise from (i) thermal agitation that disorders the orientation of solvent dipoles with respect to the excited state dipole moments of protein chromophores and (ii) the thermal-induced increase in distance between solvent dipoles and the excited state dipole moments of protein chromophores, as described by Macgregor and Weber [
29]. Unlike the emission maximum, the excitation maximum of dialyzed Sa-MVs does not vary with temperature (
Figure 5D), probably due to the low strength of the ground state dipole moment of tryptophans and tyrosines. The steady decrease of the intensity of intrinsic protein fluorescence with increasing temperature (
Figure 5C) is expected, as a result of increased dynamic quenching.
2.2. Laurdan Fluorescence
Laurdan and 6-propionyl-2-dimethylaminonaphthalene (Prodan) have the same chromophore, and the fluorescence of both probes is extremely sensitive to environmental polarity changes mainly due to the large change in the probe’s dipole moment when the probes are excited [
30]. The high polarizability of the probes triggers varying degrees of solvent reorientation around each of the probe’s excited state “monopoles” [
29]. In membrane studies, the term “solvent” mentioned above is referring to the bulk water molecules and the water molecules bound to the lipid polar headgroups as well as the polar residues of the lipids near the probe’s chromophore. Solvent relaxation in the bulk aqueous water is on the picosecond timescale whereas solvent relaxation due to bound water and nearby lipid polar headgroups occurs in nanoseconds [
31]. Thus, when interpreting the fluorescence data of these two probes (fluorescence lifetime ~3 ns) from membrane studies, bound water and lipid polar headgroups around the chromophore are more important factors than bulk water.
In proteoliposomes, Prodan, which carries a 3-C propionyl tail, can insert into lipid membranes or bind non-covalently to proteins [
32], whereas Laurdan, which carries a 12-C lauroyl chain, would only insert into lipid membranes. Thus, in this study, we chose to use Laurdan as an environmentally sensitive probe to explore the organization and dynamics in the interfacial regions between the lipid hydrophobic core and the lipid polar headgroups in Sa-MV membranes. The results are compared with various LUVs. LUV
DPPC and LUV
POPC are composed of the diester lipids DPPC and POPC, respectively, whereas lipids in Sa-MVs, LUV
MV, and LUV
PLFE are exclusively tetraethers as mentioned earlier.
Laurdan can insert into diester lipid membranes with its chromophore located near the polar headgroup regions [
33,
34,
35] and with its chromophore’s dipole moment aligned in parallel with the membrane normal [
36]. When the membrane packing in diester lipid membranes is tight and the water content near the chromophore is low, the generalized polarization (GP) value of Laurdan fluorescence is high, and vice versa [
37]. Our GP data on LUV
DPPC and LUV
POPC shown in
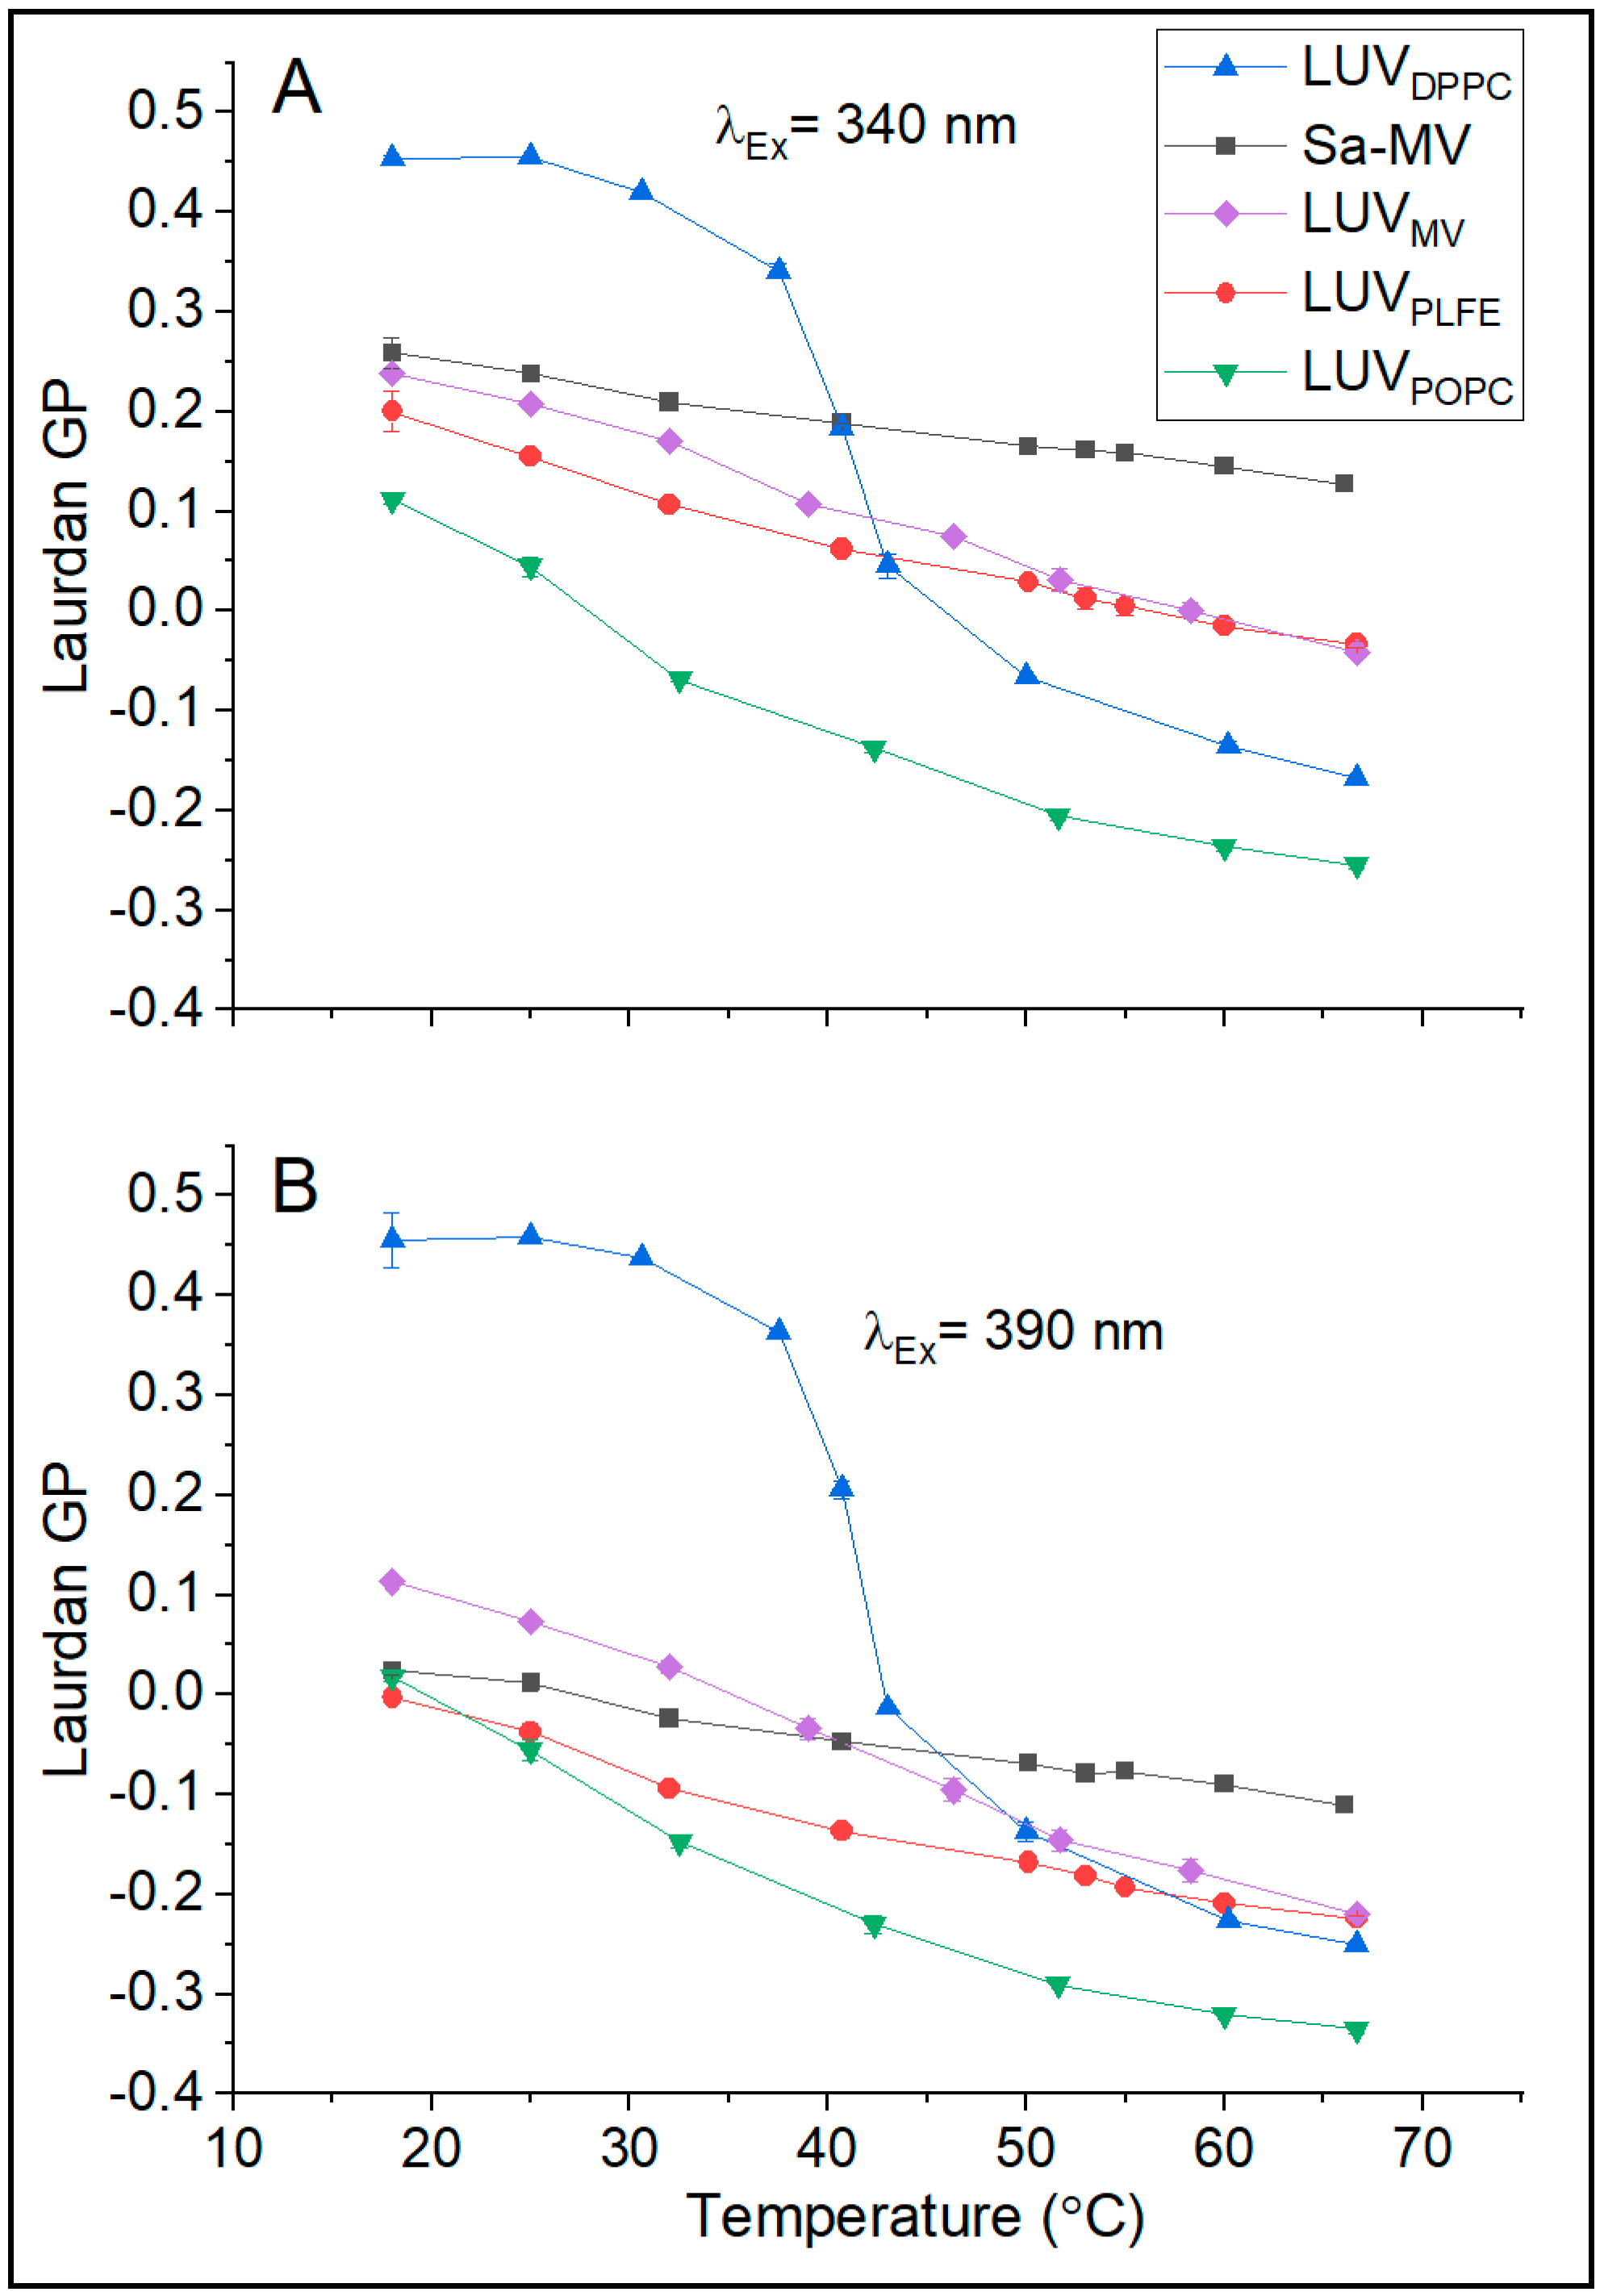
Figure 6 are fully consistent with this well-established trend. Below the main phase transition temperature of DPPC (41 °C), the GP value is high (0.45 at 20 °C); above the transition temperature, GP becomes low (e.g., −0.1 at 50 °C) (
Figure 6). The abrupt change in GP is centered around 41 °C (
Figure 6), which reflects the DPPC main phase transition. In the temperature range examined, LUV
POPC is entirely in the liquid crystalline state; thus, as expected, there is no abrupt change in GP with temperature and the GP values are low compared to those in LUV
DPPC (
Figure 6).
The disposition of Laurdan in tetraether lipid membranes is very different from that in diester lipid membranes, as revealed by our previous fluorescence microscopy study on PLFE and DPPC giant unilamellar vesicles (GUVs) [
38]. The photoselection experiment showed that the dipole moment of Laurdan’s chromophore in GUV
PLFE is aligned in parallel with the membrane surface, whereas, in sharp contrast, the dipole moment of Laurdan’s chromophore in GUV
DPPC is aligned perpendicular to the membrane surface [
38]. The most plausible configuration for Laurdan in GUV
PLFE is that the lauroyl tail of Laurdan inserts into the hydrocarbon core in parallel with the dibiphytanyl chains while the chromophore resides in the lipid polar headgroup regions with the long molecular axis of the chromophore aligned in parallel with the membrane surface [
38]. This unusual L-shape disposition for Laurdan in PLFE liposomes is presumably caused by the rigid/tight packing in PLFE liposomes and by the steric hindrance of the branched methyl group in PLFE lipids [
38]. In this disposition, the chromophore of Laurdan in GUV
PLFE is in close proximity to the bound water molecules at the polar headgroups and close to the lipid headgroup polar moieties (e.g., phosphoinositol and other sugar moieties,
Figure 1), and as a result, the degree of “solvent” relaxation is always extensive—hence the low GPs (near zero) at all of the temperatures examined in our previous GUV study (12–66 °C) [
38]. Because the chromophore disposition is different, Laurdan’s GP values obtained from tetraether lipid membranes cannot be directly compared with those obtained from diester lipid membranes.
Figure 6B shows that, when excited at 390 nm over the entire temperature range examined (18–68 °C), the GP values of LUV
PLFE are low (from 0 to −0.2). These data are in good agreement with the GP values (from 0 to −0.3 in the temperature range 12–66 °C) previously measured from GUV
PLFE using the same excitation wavelength (two photon excitation at 780 nm, which is equivalent to one photon excitation at 390 nm) [
38]. When excited at 340 nm, similar results on the temperature dependence of Laurdan’s GP were obtained from LUV
PLFE (
Figure 6A). In this case, the GP values are slightly higher (
Figure 6A) due to the excitation of probe molecules in the less solvent relaxed state. Regardless of the excitation wavelength, the GP values of LUV
PLFE are much lower than the GP values of gel state DPPC at any given temperature (
Figure 6). It would be totally wrong if these GP data were interpreted as membrane packing in LUV
PLFE being more loose than that in LUV
DPPC as our previous volume fluctuation measurements clearly showed that membrane packing in PLFE liposomes is much tighter than that in DPPC liposomes at any given temperature in the range 16–80 °C [
28]. Thus, our present data (
Figure 6) echo the previous finding that the GP values from tetraether lipid membranes cannot be directly compared with the GP values from diester lipid membranes. This point applies to GUVs as well as LUVs.
It is, however, meaningful to compare Laurdan’s GP values in Sa-MVs, LUV
MV, and LUV
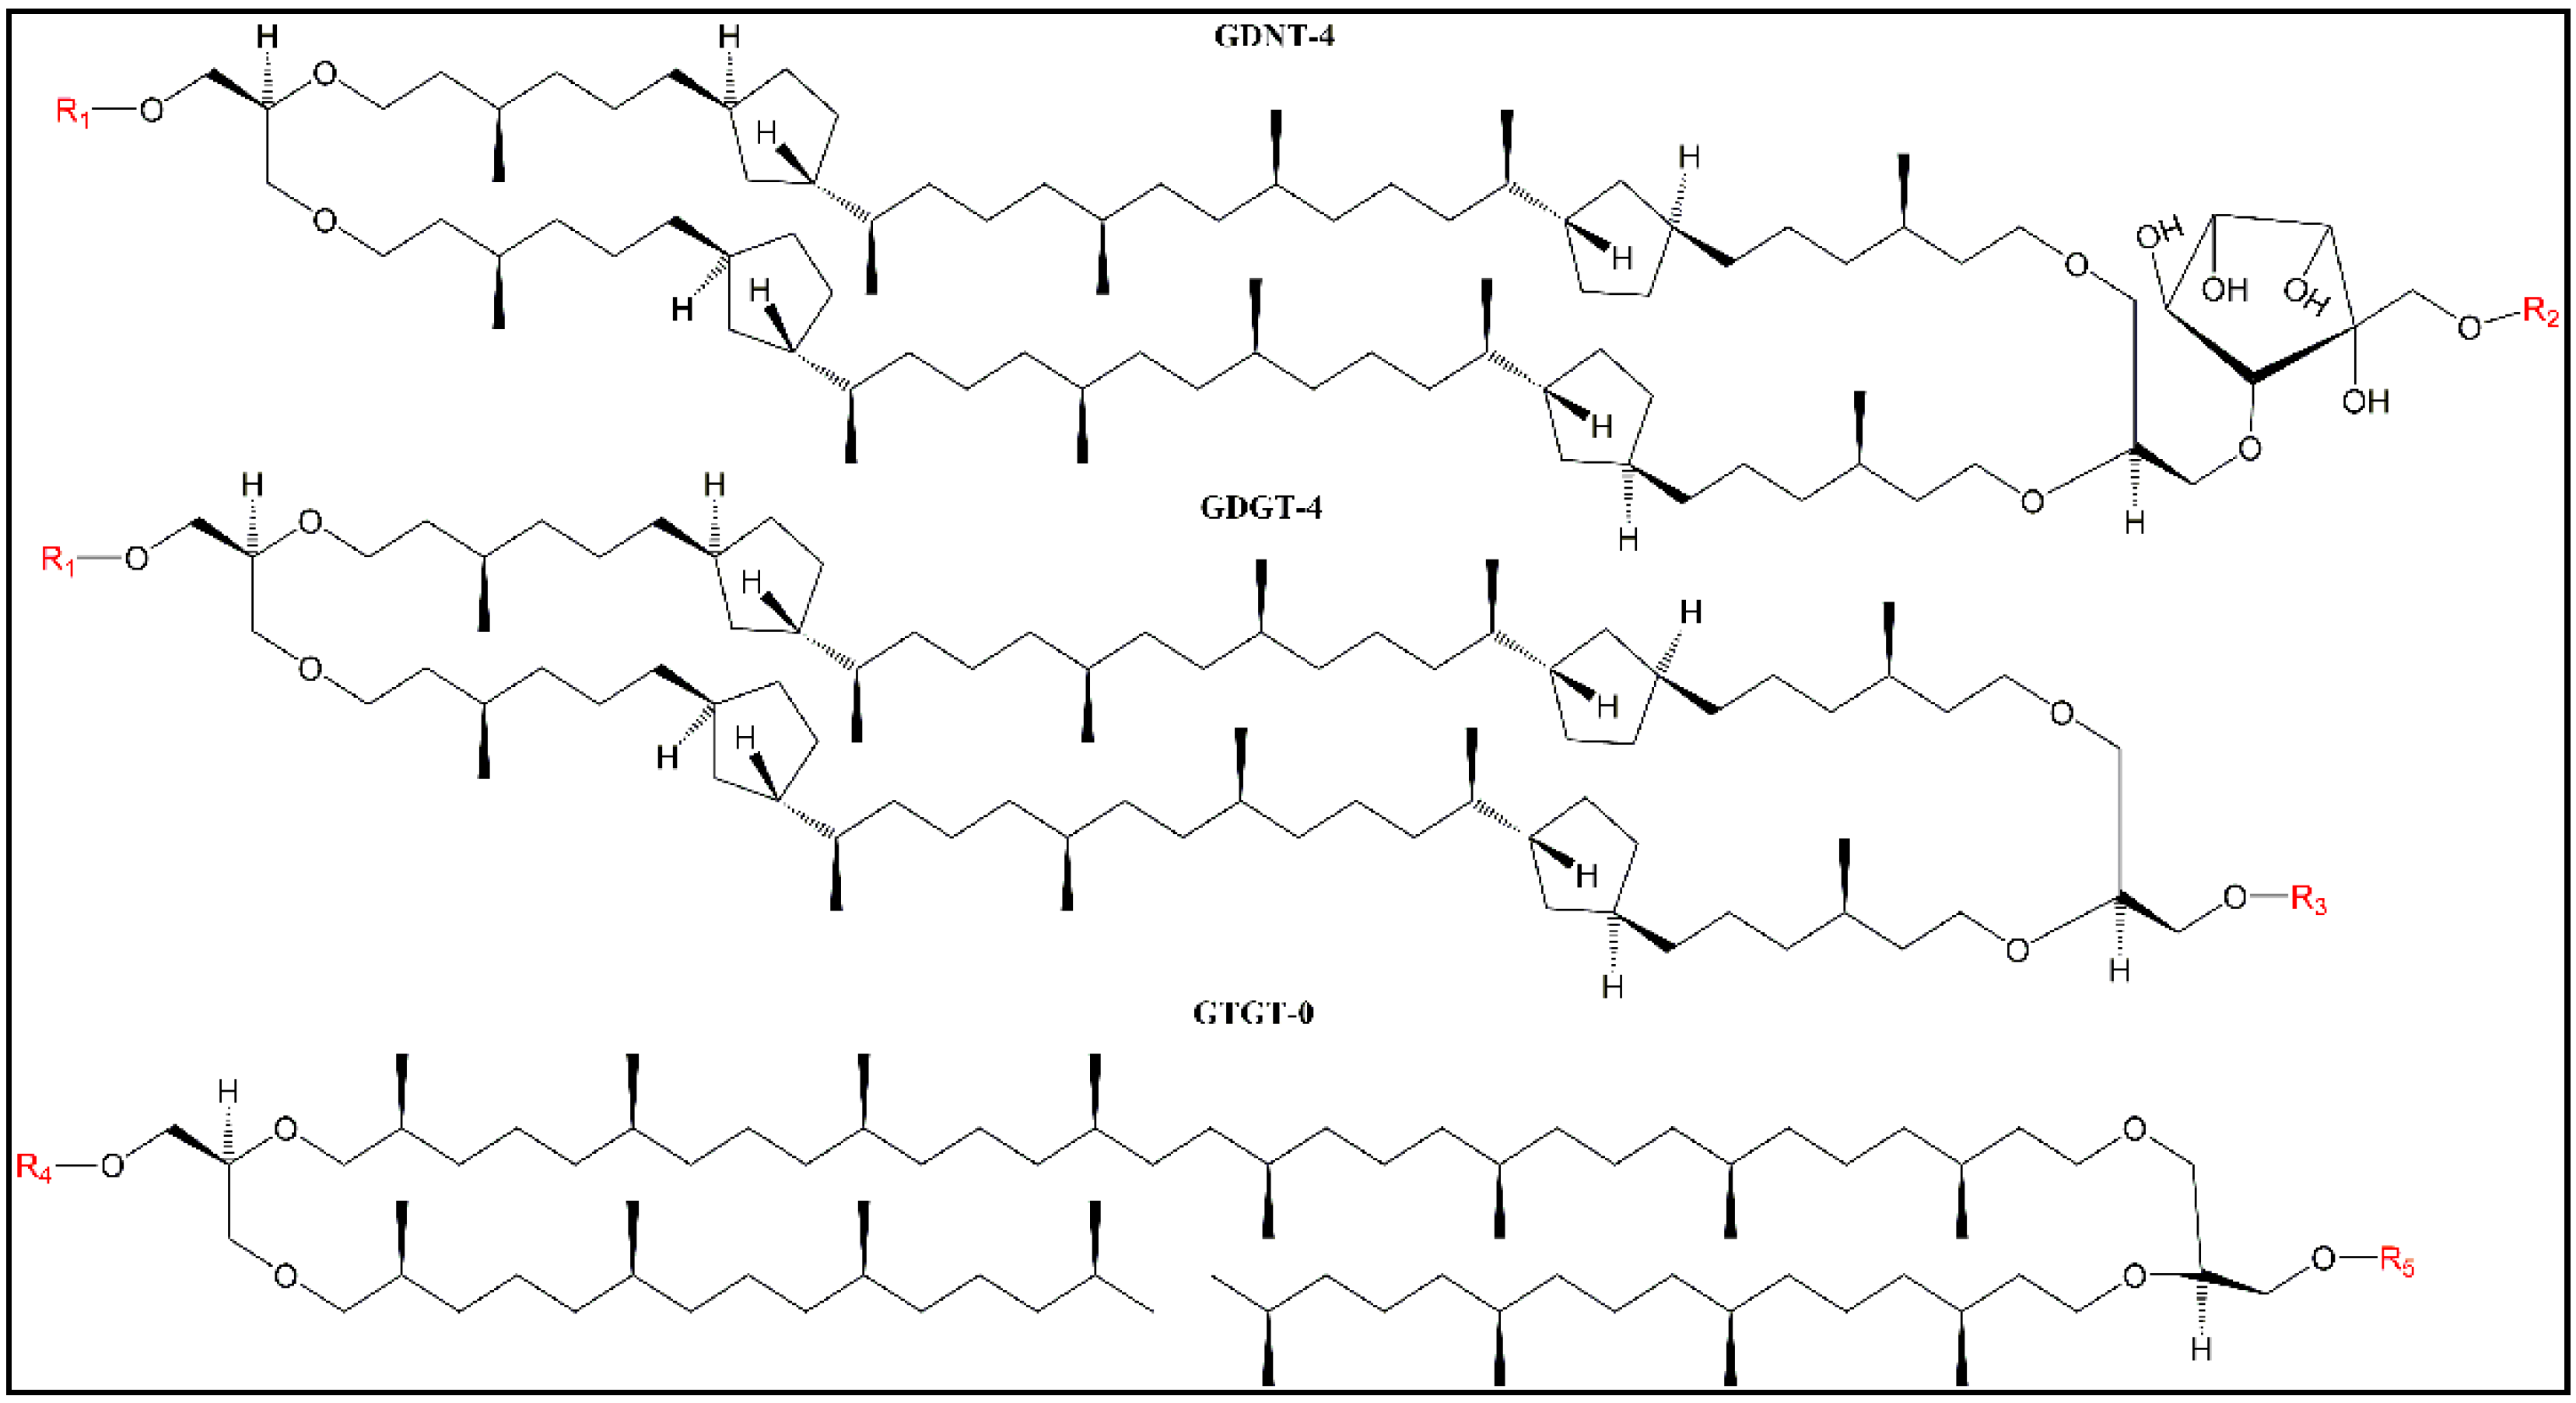
PLFE because lipids in these three membranes are exclusively tetraethers. The compositional differences among these three systems are: (1) Sa-MVs and LUV
MV have GDGT and GTGT as the hydrophobic cores whereas LUV
PLFE have GDNT and GDGT as the core structures (
Figure 1); (2) the chemical structures of the polar headgroups in PLFE are known (see
Figure 1), however, the structures of the polar headgroups in Sa-MV lipids have not been determined yet. There is a high possibility that the polar headgroups in Sa-MV lipids are very different from those in PLFE lipids; and (3) Sa-MV membrane is covered by an S-layer and contains membrane-bound proteins whereas LUV
MV and LUV
PLFE are protein free.
In these three tetraether lipid-based membrane systems, Laurdan’s GP decreases with increasing temperature monotonically without any abrupt changes. This result indicates that there is a continuous reduction in membrane packing tightness as the temperature increases and that there is no sign for lipid phase transitions. This is a piece of new information about Sa-MVs and the LUVs reconstituted from Sa-MV lipids, but a bit surprising with regards to lipid phase transitions in PLFE liposomes. GUV
PLFE (~10 μm) have previously been shown to exhibit a small phase transition at ~50 °C by using Laurdan’s GP [
38]. The lack of an abrupt change in GP with temperature in LUV
PLFE (~200 nm) (
Figure 6) may be attributed to subtle changes in membrane packing due to the increase in vesicle curvature.
To further assess membrane packing tightness and gain knowledge about the dynamic structure (e.g., solvent reorientation) near the probe’s chromophore, we have also calculated the red edge excitation shift (REES) of Laurdan fluorescence in Sa-MVs and various liposomes. The REES values are the differences in the wavelength of emission maximum when comparing the emission spectra excited at 340 nm (near the excitation maximum) with those excited at 390 nm (the red edge excitation) (see Materials and Methods). The interactions between a fluorophore and its surroundings in membranes could be quite complex, which would result in a series of microscopically inhomogeneous sub-states [
39]. When excited at the red edge, only a small population of the sub-states will be excited. Those would be the ones that interact most strongly with the environment in the excited state and least strongly in the ground state [
39]. If the interaction of fluorophore with its surroundings remains unchanged or changes little (e.g., solvent reorientation does not occur or it is extremely slow) during the fluorescence lifetime, the emission spectra when excited at the red edge will be shifted significantly to longer wavelengths (i.e., REES), compared to those excited at the absorption band maximum [
39]. Therefore, generally speaking, probe in a motionally more restricted environment will exhibit a higher REES value.
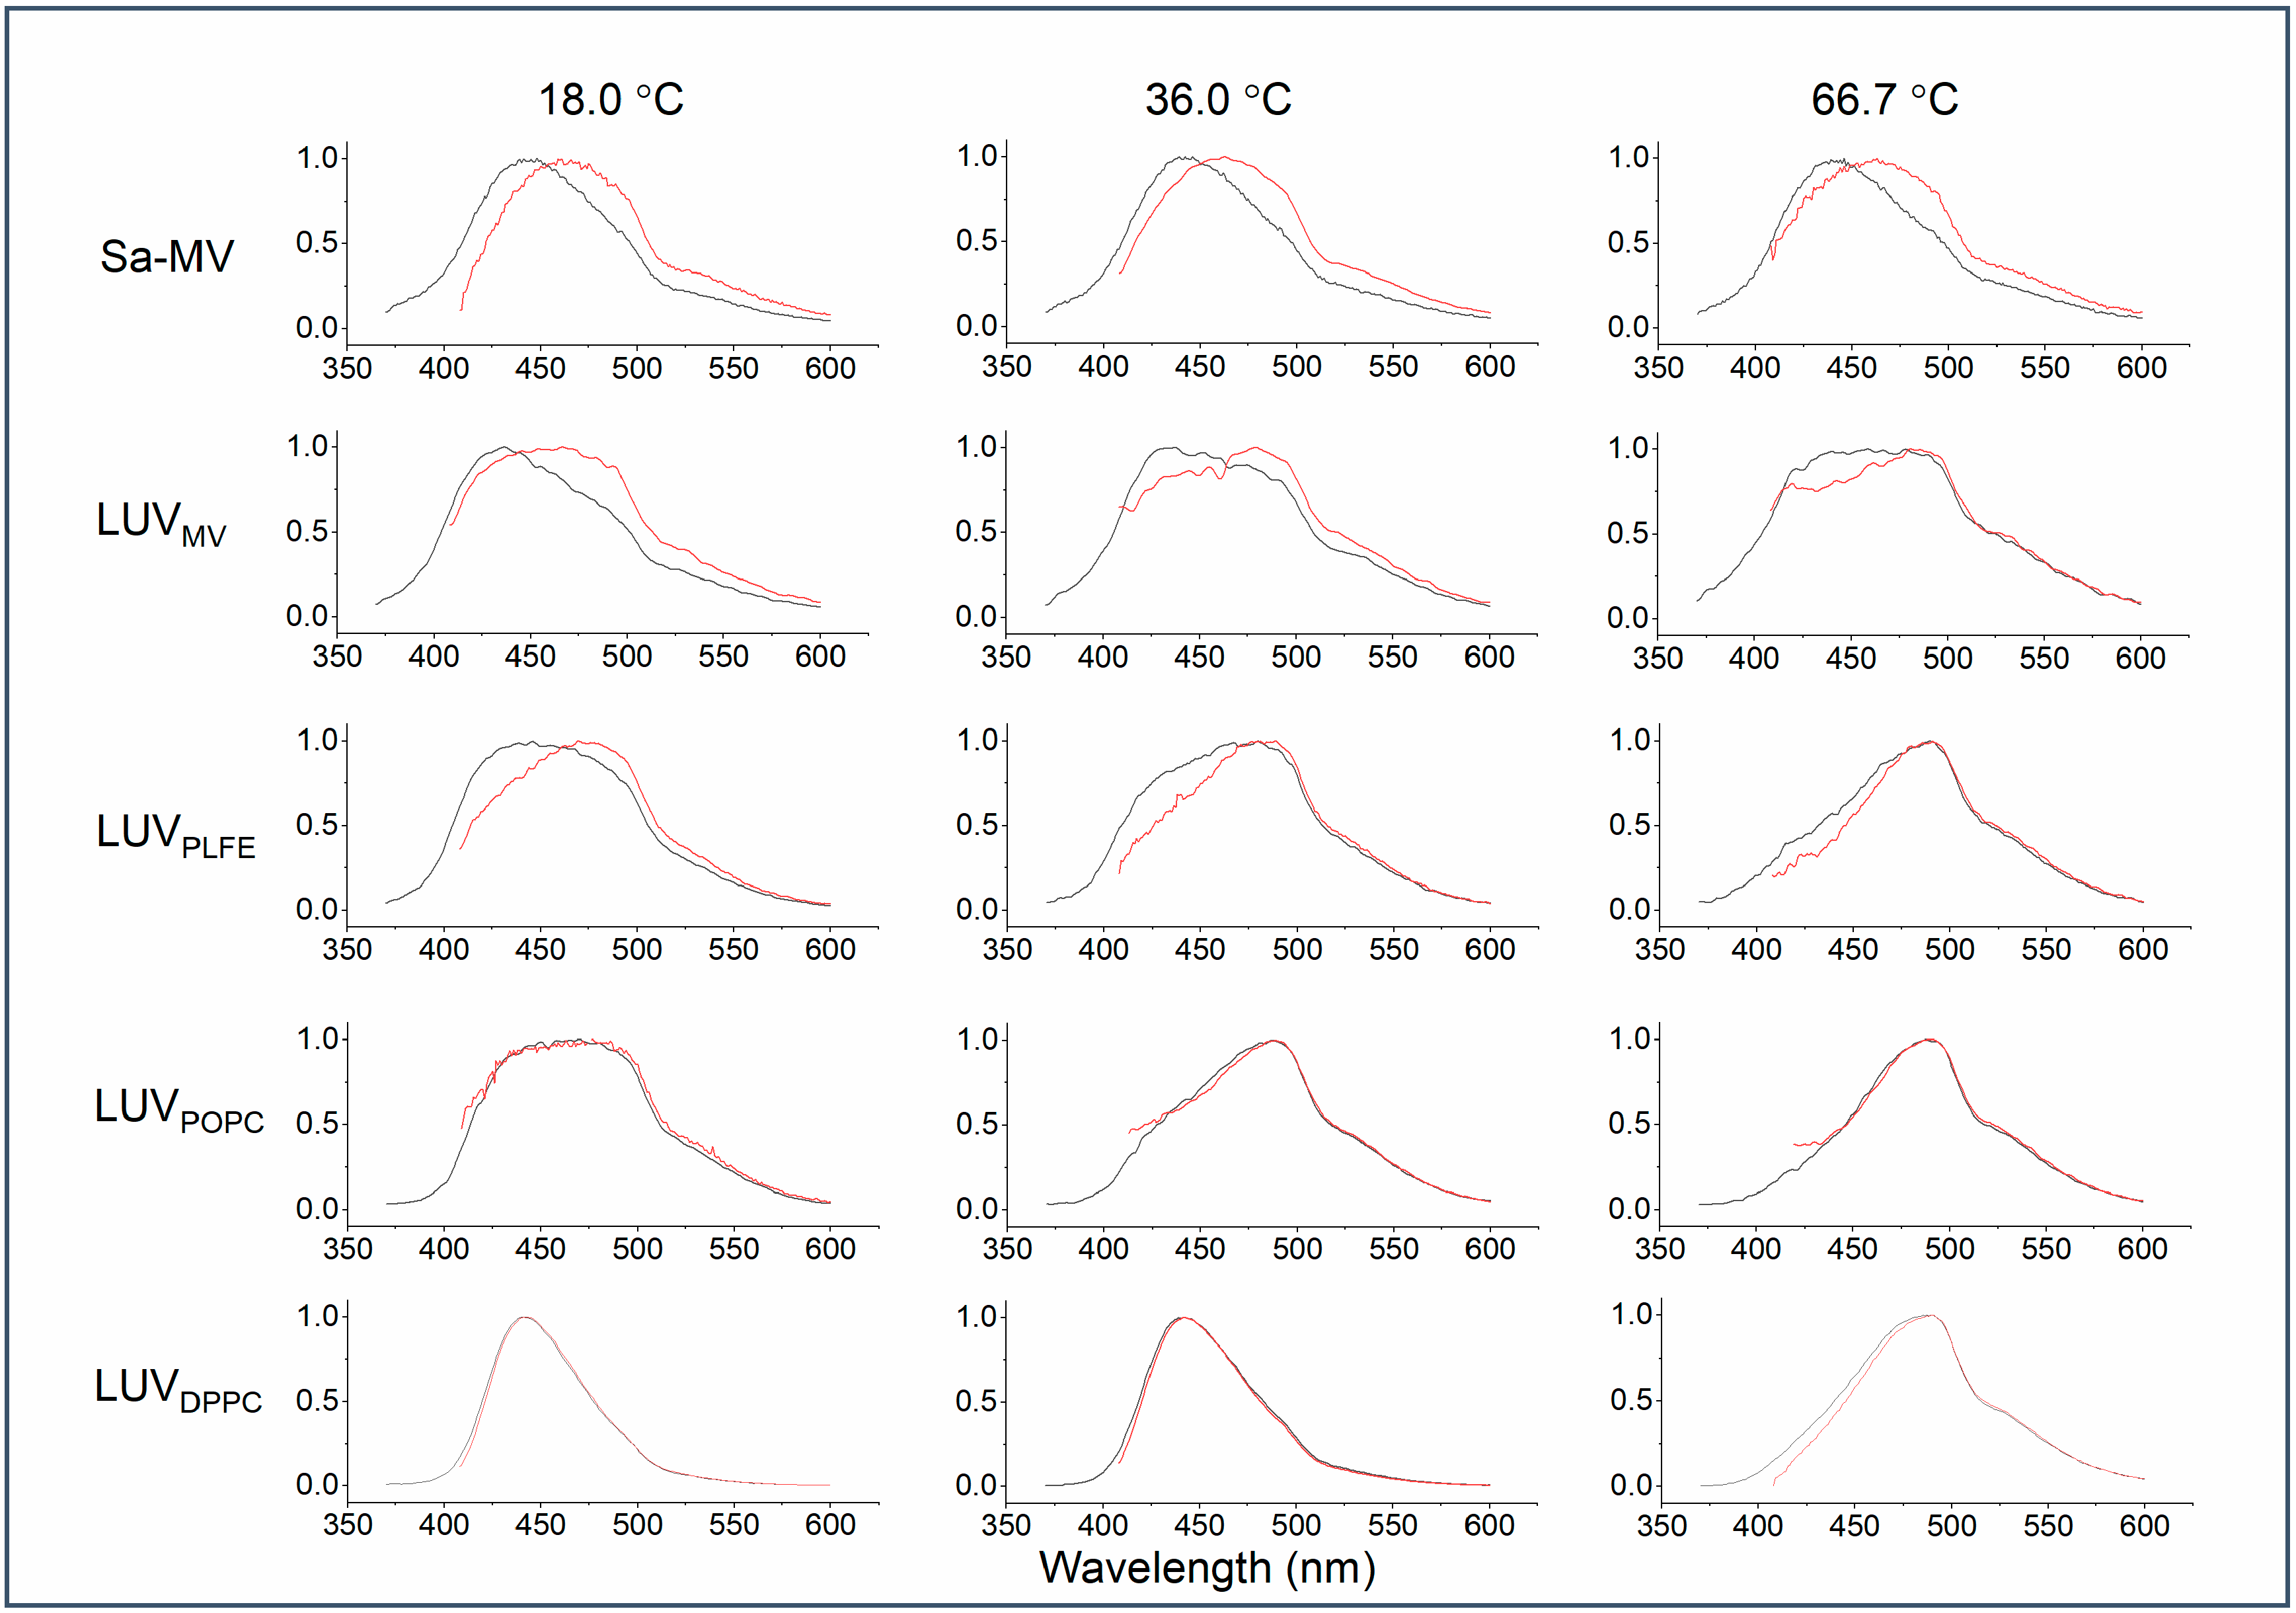
Figure 7 illustrates how the emission spectrum of Laurdan in the membrane systems examined changes upon the red edge excitation at different temperatures. It is clear from
Figure 7 that there is a large red shift in the emission spectrum of Laurdan in Sa-MVs, LUV
MV, and LUV
PLFE when excited at 390 nm (a red edge excitation). These three membrane systems contain exclusively tetraether lipids. In contrast, a red shift is not immediately obvious for diester liposomes, i.e., LUV
DPPC and LUV
POPC, by simple visual examination of the emission spectra (
Figure 7).
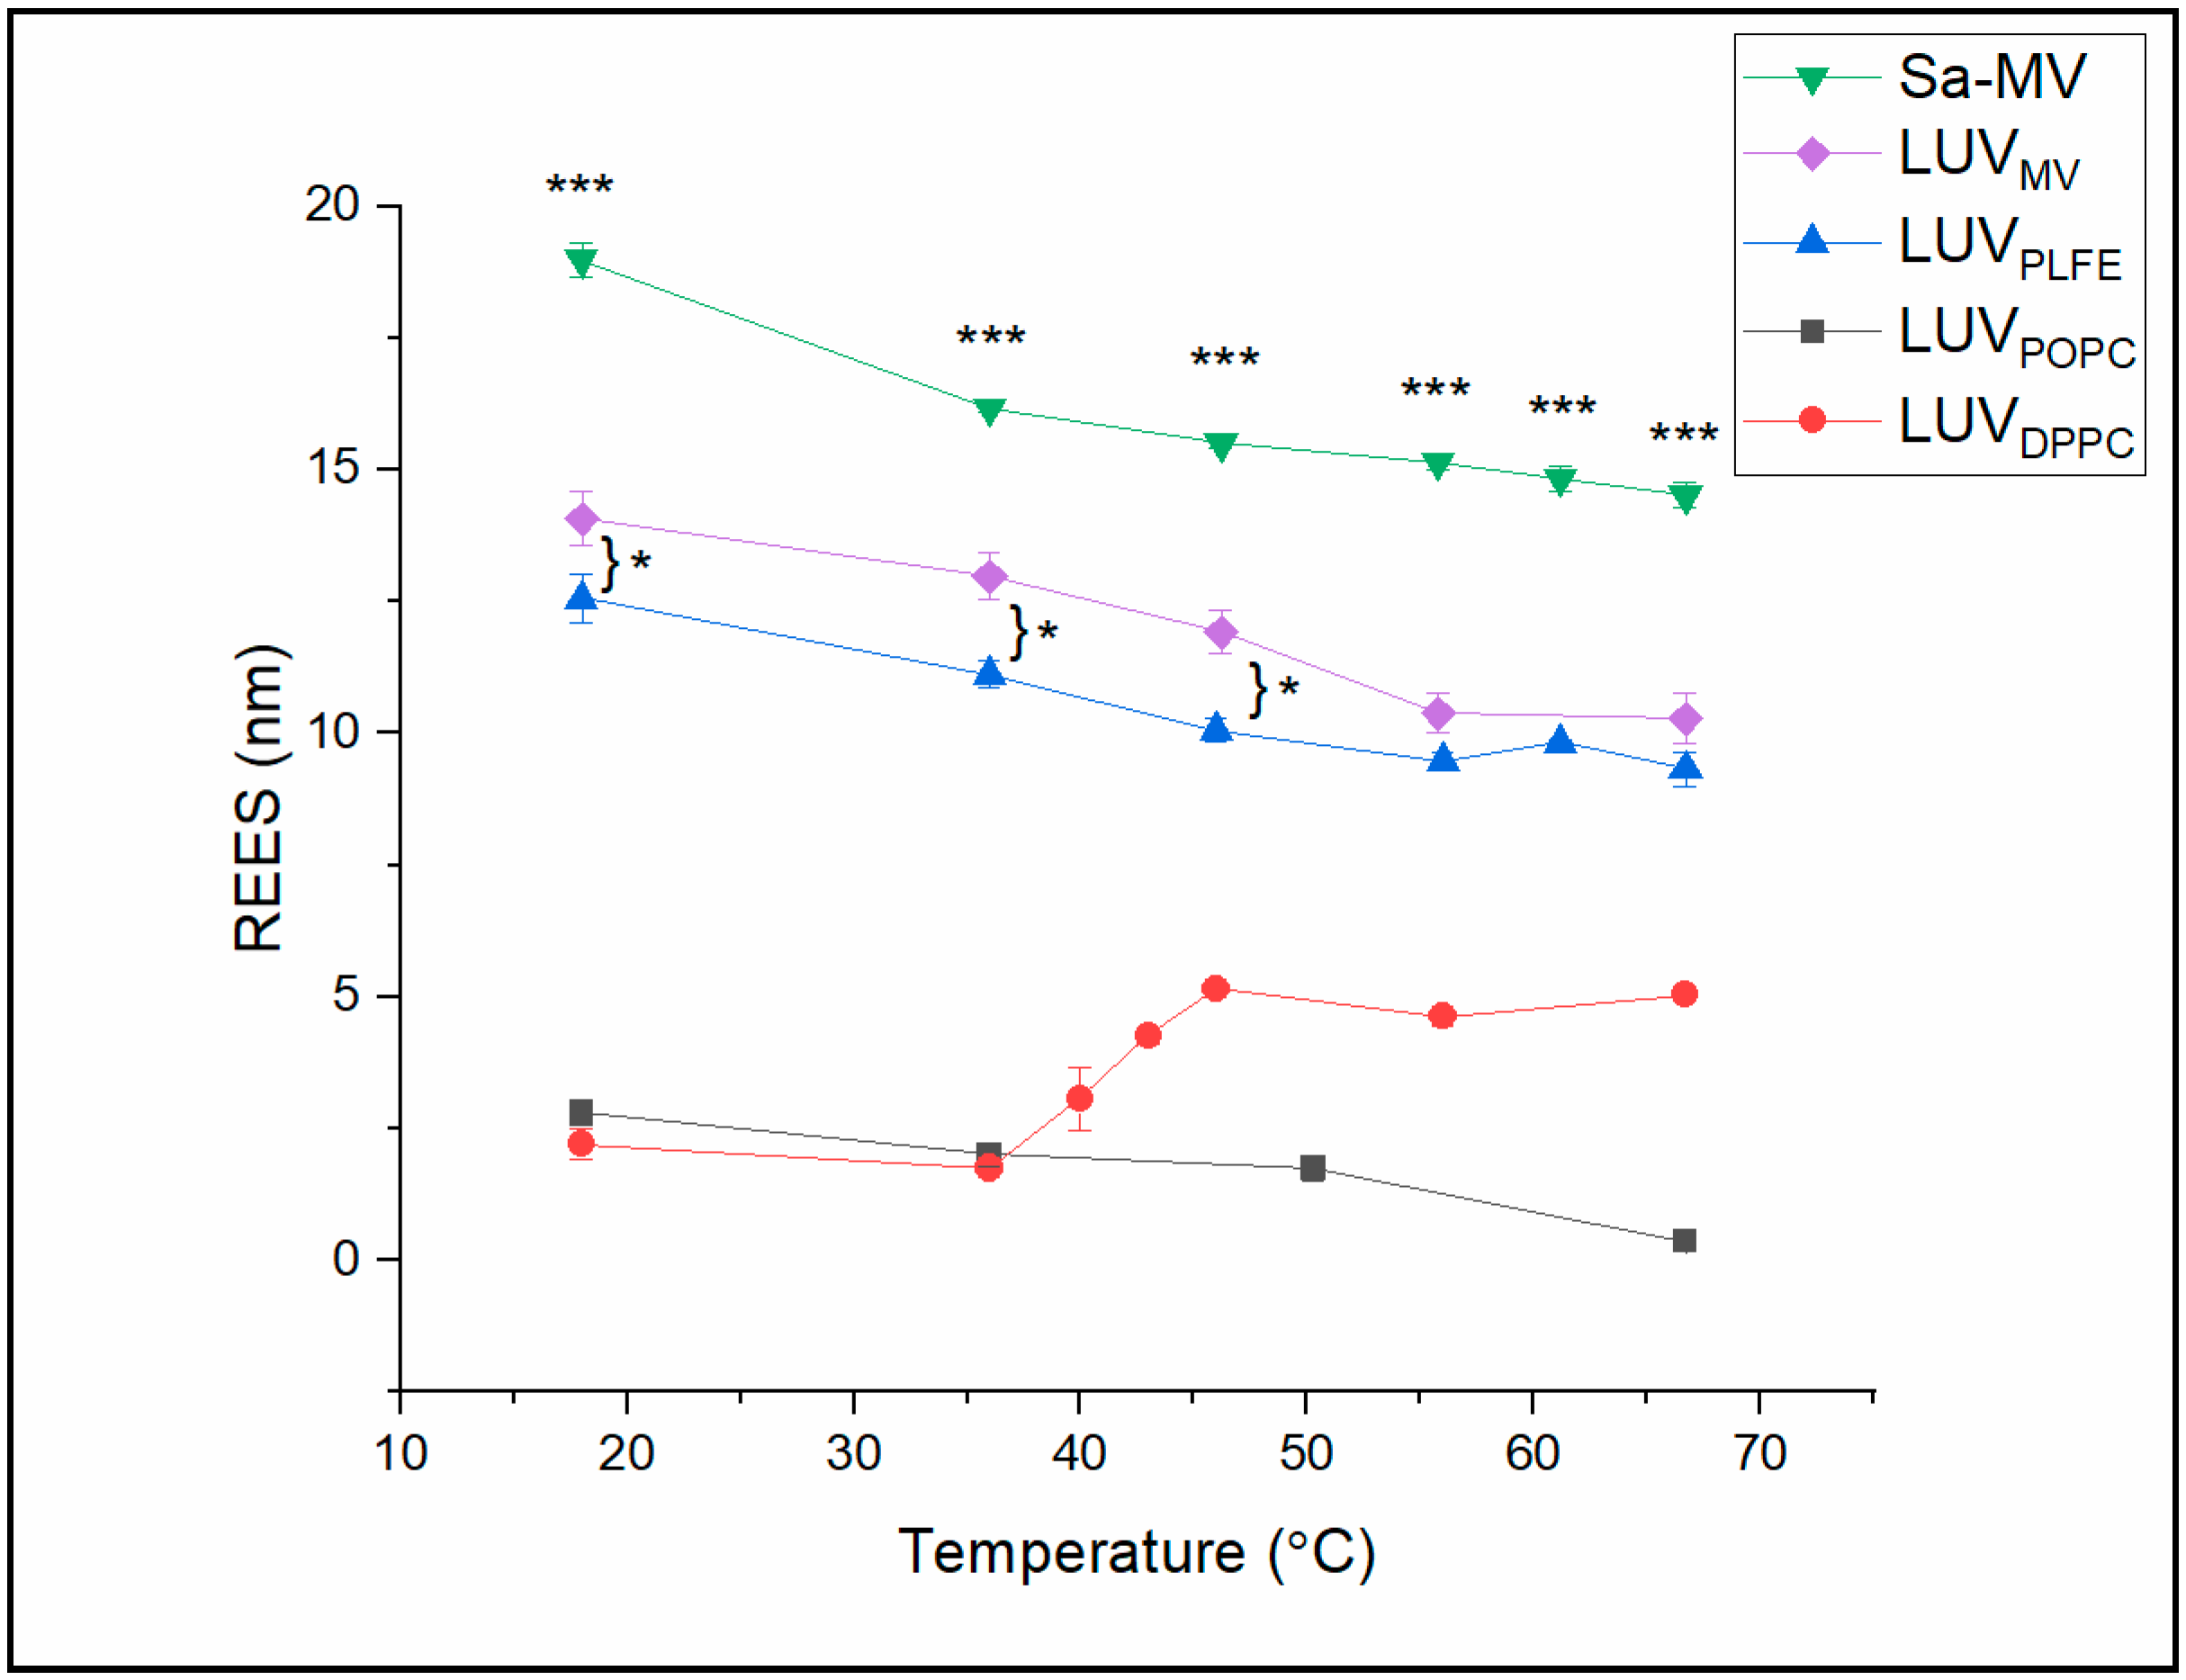
In
Figure 8, the calculated REES values are plotted against temperature for all the membrane systems examined (see
Table S5 (Supplemental Materials) for the actual REES values). The data indicate that the REES values can be divided into two groups. In the tetraether lipid membrane systems (i.e., Sa-MVs, LUV
MV and LUV
PLFE), the REES values are high (9.3–18.9 nm). In diester lipid membranes (i.e., LUV
POPC and LUV
DPPC), the REES values are relatively low (0.4–5.0 nm). These data suggest that Laurdan in tetraether lipid membranes is in a motionally much more restricted environment than Laurdan in diester liposomes at any given temperature examined [
40,
41]. The high REES (
Figure 8) and low GP (
Figure 6) values of Laurdan fluorescence in tetraether lipid-based membrane systems suggest that the bound water molecules and the polar lipid moieties in the polar headgroup regions of tetraether lipid membranes, where the chromophore of Laurdan resides, strongly interact with Laurdan’s excited-state dipole moment [
29] and that the solvent reorientation around the chromophore occurs very slowly compared to Laurdan’s fluorescence lifetime [
42].
Among these three tetraether membrane systems examined, the REES values of Sa-MVs (14.9–18.9 nm) are significantly higher than those in LUV
MV (10.2–14.0 nm) and LUV
PLFE (9.3–12.6 nm) (
Table S5), with a
p value less than 0.003 comparing Sa-MVs to LUV
PLFE. A plausible explanation is that the crystalline array of the S-layer proteins on top of the tetraether lipid membrane in Sa-MVs provides additional motional restriction to Laurdan’s chromophore.
It is also worthy of noting that REES in LUV
MV is higher than that in LUV
PLFE, especially at low temperatures (<50 °C,
p < 0.03 (
n = 3)) (
Figure 8) and that Sa-MVs and LUV
MV have higher GP values than LUV
PLFE (
Figure 6). These data suggest that Laurdan’s chromophore experiences tighter membrane packing when Laurdan is in Sa-MVs and LUV
MV than in LUV
PLFE. This packing difference may originate from the subtle difference in lipid composition. As discussed earlier, PLFE has GDNT and GDGT as the hydrophobic cores whereas Sa-MV lipids have GDGT and GTGT (
Figure 1). All these three lipids are bipolar tetraether macrocyclic or semi-macrocyclic molecules. GDNT has calditol on one side and glycerol on the other side of the hydrocarbon core whereas GDGT and GTGT have glycerol at both polar ends. In addition, the polar headgroups on Sa-MV lipids, which are not yet known, may be very different from those seen in PLFE. These differences in chemical structure may lead to changes in hydrogen bonding between Laurdan and lipids and among lipids themselves, all of which can affect membrane packing and solvent reorientation.
Figure 8 shows that there is no abrupt change in REES with temperature in Sa-MVs, LUV
MV LUV
PLFE and LUV
POPC, which indicates that there is no major phase transition in those membrane systems in the temperature range examined. These results are consistent with the GP data (
Figure 6). In these membranes, the slight decrease in REES with increasing temperature (
Figure 8) likely results from the thermal-induced increase in volume fluctuations and consequently a slight increase in the rate of solvent reorientation.
REES in LUV
DPPC undergoes an abrupt change at 41 °C (
Figure 8), which reflects the main phase transition of DPPC. This result is in excellent agreement with the GP data (
Figure 6). However, it is surprising that the REES value is high in DPPC liquid crystalline (fluid) state and low in gel state (
Figure 8). Intuitively, this trend would be the other way around. One possible explanation is that REES not only depends on the rate of solvent reorientation around the probe, but also changes with probe location and orientation in the membrane. A recent quantum mechanical and molecular dynamics study [
35] showed that the location and orientation of Laurdan’s chromophore in DPPC bilayers have a heterogeneous distribution, rather than a single fixed value, and that the fluorescence properties of Laurdan in lipid bilayers are influenced by the chromophore’s orientation and depth of membrane penetration. It is possible that, through the DPPC gel-to-fluid phase transition, the Laurdan’s depth penetration and orientation are changed resulting in an increase in REES, despite that solvent reorientation increases somewhat with increasing temperature.

