Abstract
In Mexico, 3 of 10 children are overweight. Fructose intake and relative abundance (RA) of Lactobacillus reuteri (L. reuteri) in the intestinal microbiota are associated with obesity and diabetes in adults, but studies in children are limited. This study evaluates the association between fructose intake and L. reuteri RA with adiposity and cardiometabolic risk markers in Mexican children dietary information, microbiota profiles, adiposity indicators (Body Mass Index, BMI and Waste Circumference, WC), and cardiometabolic markers were analyzed in 1087 children aged 6–12 years. Linear regression and path analysis models were used. High-tertile fructose intake and L. reuteri RA were positively associated with BMI (βTertil 3 vs. Tertil 1 = 0.24 (95% CI, 0.04; 0.44) and βT3 vs. T1 = 0.52 (95% CI, 0.32; 0.72)) and WC (βT3 vs. T1 = 2.40 (95% CI, 0.93; 3.83) and βT3 vs. T1 = 3.40 (95% CI, 1.95; 4.90)), respectively. Also, these factors mediated by adiposity were positively correlated with high triglycerides and insulin concentrations and HOMA-IR (p ≤ 0.03) and negatively associated with HDL-C concentration (p < 0.01). High-tertile fructose intake and L. reuteri RA were directly associated with adiposity and indirectly associated though adiposity with metabolic disorders in children. In conclusion, fructose intake and L. reuteri RA were directly associated with adiposity and indirectly associated with metabolic disorders in children, mediated by adiposity.
Keywords:
adiposity; cardiometabolic markers; children; cholesterol; fructose; Lactobacillus reuteri 1. Introduction
Worldwide, overweightness (OW) and obesity (OB) affect 340 million children and adolescents aged 5–19 [1]. Mexico has the fourth highest prevalence of OB in children according to the Organization for Economic Cooperation and Development [2]. OB results from a positive energy balance (energy intake exceeds expenditure), and genetic and environmental factors, like diet and microbiota, play important roles in modulating this balance. Nowadays, fructose, a component from diet, is added to a great proportion of industrialized food and beverages [3,4]. Systematic reviews of clinical assays in adults have shown that an excessive intake of fructose can increase triglyceride levels and corporal weight [5,6,7]. Sweetened soda intake has been positively associated with body weight gain, particularly in children [8,9,10]. Furthermore, high-tertile fructose intake has been associated with insulin resistance and type 2 diabetes [11]. On the other hand, differences in gut microbiota composition determine an individual’s capacity to obtain energy from food, contributing to predisposition to metabolic disorders such as OB and diabetes [12]. Gut microbiota composition is associated with these diseases due to its role in insulin signaling, inflammation, and fat storage modulation [13]. The microbiota regulates the lipid metabolism of the host by secondary bile acids and the metabolism of glucose through the farnesoid X and G-protein-coupled receptors [14]. Recently, some authors have reported that a relative abundance (RA) of L. reuteri from gut microbiota is positively correlated with corporal weight gain in adults [15,16]. Moreover, some studies have documented that L. reuteri may take advantage of fructose molecules by obtaining energy generated from electron exchange in order to increase its growth rate [17,18,19]. This mechanism contributes to blood absorption of high amounts of fructose, increasing the synthesis of intermediary molecules to produce triglycerides [20,21,22]. Although L. reuteri cannot catabolize fructose due to the lack of enzymes capable of degrading monosaccharides, intestinal microbiota contributes to the assimilation and adipose storage of ingested calories, helping their own proliferation. So far, the associations between fructose intake or L. reuteri RA with obesity have been studied separately in adults or animals but not in children. The relationships of these associations with cardiometabolic markers have also not been reported. Therefore, this study aimed to evaluate the associations between fructose intake and L. reuteri RA with adiposity. Furthermore, we analyzed whether fructose intake and L. reuteri RA are associated with cardiometabolic markers in children and whether adiposity mediates these relationships.
2. Materials and Methods
2.1. Study Design and Participants
We analyzed dietary information, microbiota profiles, and OW and OB statuses of children aged 6 to 12 years who participated in a cross-sectional study between June 2011 and July 2013. The study sample was selected from four regions of Mexico City (north, south, east, and west) through a non-probability simple sampling method. A more detailed description of the methodology used in the study is presented in another manuscript [23].
The selected participants were children with no history of diabetes, hypertension, or cardiovascular disease and with no physical limitation to the performance of the anthropometric measurements. We excluded children with an infectious disease or gastrointestinal disorder and children who had been taking antibiotics for two months prior to the study at the time of the interview.
All subjects gave their informed consent and assent for inclusion prior to participation in the study (Figure 1). The study was conducted in accordance with the Declaration of Helsinki, and the protocol was approved by Ethics Committee of the National Institute of Public Health of Mexico (INSP) CI 1129 and the Social Security Mexican Institute (IMSS) 006-785-072.
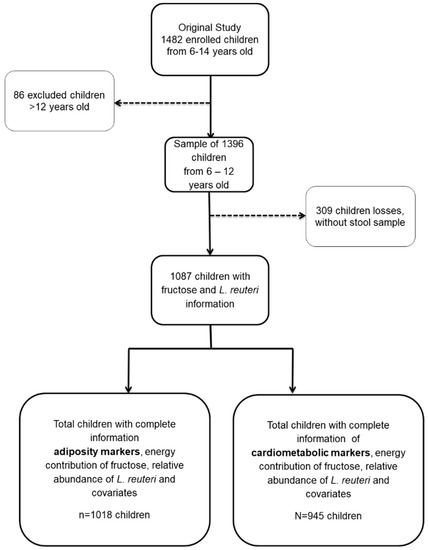
Figure 1.
Children from México City study sample.
2.2. Outcome Variables
2.2.1. Adiposity
Trained personnel, previously standardized according to the Habicht method [24], carried out the anthropometric measurements. Scales with a precision of 0.1 kg, as well as a stadiometer and metric tape, both with precision of 1 mm (Seca GmbH. & Co., Hamburg, Germany), were used.
The weight (kg), height (cm), waist circumference (WC; cm), and hip circumference (cm) of participants were measured without shoes on and with the least amount of clothing possible, following the Lohman procedure [25]. Adiposity was evaluated by body mass index (BMI) Z score (kg/m2), calculated from the macro created by the World Health Organization, as well as WC (cm). The normal weight group was classified as −2 to 1 standard deviations (SD), the OW group had >1 to 2 SD, and the OB group had >2 SD from the normal value [26].
2.2.2. Cardiometabolic Risk Markers
Lipid, glucose, and insulin concentrations were determined under fasting conditions (at least 12 h) from serum samples. Glucose (mg/dL), total cholesterol, low-density lipoprotein cholesterol (LDL-C, mg/dL), high-density lipoprotein cholesterol (HDL-C, mg/dL), and triglyceride (mg/dL) concentrations were determined by standard methods and measured with the Clinical Chemistry System ILab 300 Plus® equipment. Insulin (μU/mL) concentration was measured using a chemiluminescent method in the IMMULITE® immunoassay analyzer. The homeostasis model assessment of insulin resistance (HOMA-IR) was estimated using the Hosker and Matthews model [27]. All of these variables were considered continuous.
2.3. Independent Variables
2.3.1. Fructose Intake from Dietary Information
Expressed as a percentage of the caloric contribution from fructose to total dietary energy, the dietary intakes of children were collected through a short-term Semi-quantitative Food Frequency Questionnaire (SFFQ) involving 107 foods. The SFFQ was designed based on Willet’s methodology [28]. Interviewers asked participants to recall all foods (and portions) consumed in the month prior to the interview. The portion sizes specified by the interviewers were based on the average weight value assigned to each food item for this population. We constructed a specific food-composition database to estimate the energy, macronutrient, and micronutrient intake data collected from the SFFQ. It was based on the Mexican Food Database (BAM, Spanish acronym) with 1721 foods, which was compiled and updated in 2016 by the Center for Nutrition and Health Research of the INSP [29]. To construct our specified database for the SFFQ, we used the following steps: (1) We selected the BAM foods that represented each food item on the SFFQ food list. For example, in the case of ‘mango’, we selected all BAM mango types (criollo, petacón, and manila). (2) We estimated the energy and nutrient content of the dish items per 100 g of preparation according to their raw ingredients (based on standardized Mexican recipes). Using the constructed food composition database and the weights of the portion sizes (from the SFFQ), we estimated the average daily intakes of energy and nutrients of the children. The quantity of consumed food (in net grams) was determined by considering the density factor for beverages and the edible portion factor for fruits, vegetables, and meats. The daily dietary intake (including fructose and energy) per person was calculated using Stata version 13 software. Finally, the percentage of fructose (from all food and beverage sources) consumed relative to the total energy intake was categorized into tertiles (low, medium, and high).
2.3.2. RA of L. reuteri
Genomic DNA was isolated from 200 mg of feces using the QIAamp® DNA Stool (Qiagen, Hilden, North Rhine-Westphalia, Germany) kit. DNA concentrations and purity were determined at an absorbance of 260/280 nm by the Thermo Scientific NanoDrop 1000 Lite spectrophotometer (Wilmington, DE, USA). DNA was stored at −20 °C until use. The RA of L. reuteri was determined by qPCR using previously reported primers [30] and universal primers as normalizers of abundance of L. reuteri [31]. The PCR mixture of 10 µL contained 1 µL of DNA (5 ng), 5 μL of 2X Maxima SYBR Green/ROX qPCR Master Mix (Thermo Fisher Scientific, Foster City, CA, USA), 1 µL of each primer at 5 pmol/µL, and 2 µL of DNAse/RNAse free water. The temperatures for L. reuteri gene amplification were as follows: 10 min at 95 °C, 40 cycles of 15 s at 95 °C, and 1 min at 56 °C. Those for universal primers were as follows: 10 min at 95 °C, 40 cycles of 15 s at 95 °C, and 1 min at 58 °C. Specific gene amplifications and the absence of primer dimers were determined by performing melting curve analyses in all cases. Duplicated sample reactions and a negative control were included in each plate. RA units of L. reuteri were obtained by the comparative method 2-ΔCt (L. reuteri Ct—universal Ct) [32]. This variable was analyzed as continuous and categorical in tertiles.
2.4. Covariates
We adjusted the models for the following characteristics: age, sex, first-degree family history of OB (FHO; one or both parents with OB), and leisure time physical activity (LTPA).
2.4.1. Leisure Time Physical Activity (LTPA)
The time spent by children in physical activity during the previous month was evaluated through a questionnaire adapted to this population [33]. Information regarding physical activity performed regularly in the last month was collected. The types and duration were converted to metabolic equivalents (MET/hour/week) by the software “Food Processor Nutrition and Fitness” version 10.12.0 (ESHA Research Inc., Salem, Oregon, OR, USA) [34].
2.4.2. Sociodemographic Information
Trained interviewers collected the socioeconomic, demographic, and personal pathological and hereditary information.
2.5. Statistical Analysis
We used χ2 tests for frequencies and one-way ANOVAs with Bonferroni post-test correction for continuous variables to assess the significance of differences in normal nutritional status versus OW and OB status according to selected characteristics. Multiple linear models were used to evaluate the direct association between fructose intake and L. reuteri RA. Path analysis was used to evaluate direct and indirect associations (to examine if adiposity acts as a mediator) between L. reuteri RA and fructose intake with cardiometabolic risk markers (glucose, insulin, HOMA-IR, triglycerides, total cholesterol, HDL-C, and LDL-C). Given the large number of outcome variables (eight) for the path models and covariates, we used principal components and factor analyses to identify variables greatly related to each other. We identified the internal patterns of association among outcome variables, reducing them to three groups in the first phase: group I included BMI and WC; group II included total cholesterol, HDL-C, LDL-C, and triglyceride concentrations; and group III included glucose and insulin concentrations. Finally, we also considered two models based on the conceptual map of the study. The first model incorporated all indicators of adiposity (BMI and WC, based on group I), and the second model incorporated all cardiometabolic risk markers (collapsed groups II and III for these indicators).
The final models included only the variables that influenced the explanations of the models. The goodness of fit of the data was evaluated for all models. All statistical analyses were performed using Stata software: Release 13 (College Station, TX, USA). Statistical significance was defined as a p-value < 0.05.
3. Results
Eligible children with complete information on adiposity (n = 1018) and cardiometabolic risk markers (n = 945) who had available data on fructose intake, L. reuteri RA, and adjusted covariates (age, sex, FHO, and LTPA) represented 93.65% and 87% of the total sample, respectively. We found that the sample of children included in our analysis had a smaller proportion of females (44.71 vs. 57.28, p < 0.0001), higher prevalence of FHO (54.97% vs. 47.73%, p = 0.008), and a higher proportion of children with a status of OW/OB (53.08% vs. 45.45%, p = 0.02) than the sample of children excluded from the study (Table S1).
Children with OB were mainly male, and a high proportion of these children had FHO (p < 0.05). Serum triglyceride, insulin, total cholesterol, and LDL-C concentrations and HOMA-IR were significantly higher, while the HDL-C concentration was significantly lower (p < 0.05) in children with OW and OB than in children of normal weight. Likewise, children with OB and OW had higher concentrations of L. reuteri RA than children of normal weight. However, children with OB had higher fructose intakes and higher percentage contributions of fructose to the diet than children of normal weight and children with OW (Table 1).

Table 1.
General characteristics by BMI status of children from Mexico City 1.
Sugar-sweetened beverages (industrialized and homemade) and sweetened lactic beverages were the beverages with the highest percentages of fructose consumed more frequently by children with OW/OB compared with those by children of normal weight (Figure 2). However, there were only marginally significant differences in consumption of homemade sweet beverages among children with obesity and those of normal weight, and there were no statistically significant differences for other beverages.
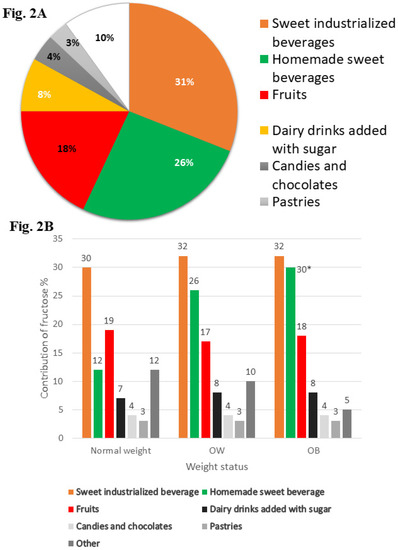
Figure 2.
Main food and beverage that provide fructose to diet of children. (A) Show the percentage of contribution from main foods and beverage to the diet of school-aged children. (B) Show the percentage of contribution from main foods and beverage to the diet of school-aged children by weight status. One-way ANOVA with Bonferroni posttest. Marginally significant difference * p < 0.10. OW, overweight; OB, Obesity
A high L. reuteri RA (p < 0.0001) (BMI for age Z score and WC) and high fructose contribution to the diet were directly and positively associated with greater adiposity (BMI for age Z score p < 0.02, and WC p < 0.001) (Table 2 and Figure S1A). However, we did not find any direct association between fructose and L. reuteri RA.
Table 2.
Direct and indirect effects of L. reuteri RA and diet fructose contribution on adiposity indicators and cardiometabolic markers in children of Mexico City 1.
The associations between a high L. reuteri RA and a high percentage of fructose contribution to the diet with elevated serum concentrations of cardiometabolic risk markers (such as glucose, insulin, triglycerides, total cholesterol, LDL-C, and HOMA-IR, p < 0.01) and a low serum concentration of HDL-C (p < 0.01), were all mediated by adiposity (Table 3 and Figure S1B). The results of the goodness-of-fit test for models are presented in Figure S1A (p > chi2 = 0.422, RMSEA = 0.005, GFI = 1.000, SRMR = 0.014) and Figure S1B (p > chi2 = 1.000, RMSEA ≤ 0.001, GFI = 1.000, SRMR = 0.004).
Table 3.
Direct and indirect effects of L. reuteri RA and diet fructose contribution on cardiometabolic markers in children of Mexico City 1.
4. Discussion
We reported that the presence of both high L. reuteri RA and high-tertile fructose intake in school-aged children were directly associated with adiposity indicators (BMI and WC) (p = 0.009 and p < 0.05) and indirectly with most of the cardiometabolic markers when standardized by waist circumference. Fructose has been associated with multiple deleterious effects on health when consumed excessively [35]. Rippe et al. showed an association between 10 weeks of fructose intake and an increase in the intra-abdominal fat volume in adults [36].
In children, there have only been a few studies on fructose consumption through sugary drinks. Ludwig et al. [9] found a 60% higher risk of OB for each additional serving of sweetened beverages consumed per day in American school-aged children (OR, 1.60; 95% CI, 1.14–2.24; p = 0.02). In a similar study, an increase in the risk of OW and OB after drinking sugar sweetened beverages was also reported (OR, 2.57; 95% CI, 1.06–3.38; p = 0.05) [10].
Recently, different types of foods besides sweetened beverages—known as discretionary foods—are the primary sources of added sugars and fructose in the diet. In the present study, we identified that the major types of discretionary food with a major fructose contribution consumed in this population were industrialized and homemade sweetened beverages and sweetened lactic beverages. Fruit had a low contribution to fructose intake. In spite of the carbohydrates contained in fruits, this group of food does not have the same effect as discretionary food (processed and ultraprocessed), due to the presence of fiber, minerals, antioxidants, vitamins, and phytochemicals [37], which counteract the deleterious effects of excessive fructose. Fructose is associated with the promotion of OB because it is a source of glycerol-3-phosphate and acetyl-CoA not regulated by important metabolic pathways (such as glycolysis, gluconeogenesis, and lipogenesis) [36]. Moreover, fructose may play a role in the development of OB because it is an orexigenic promoter, which leads to increased food intake [35,38]. Furthermore, human studies have documented that excessive consumption of fructose increases uric acid levels, promotes insulin resistance, alters endothelial dysfunction, and produces oxidative stress [39].
OB is associated with specific intestinal microbiota patterns. A high RA of the phylum Firmicutes and a low RA of Bacteroidetes are associated with OB in adults [40] and children [23]. Moreover, a higher concentration of the genus Lactobacillus was observed in patients with OB than in controls with anorexia (p = 0.03) of those of normal weight (p = 0.01) [41]. Particularly, the abundance of certain strains of L. reuteri is associated with body weight gain in animals and humans. In piglets and mice, an increase in body weight after the administration of specific strains of L. reuteri, such as L6798 and I5007, was noted [42,43,44]. In humans, the association of L. reuteri RA with body weight gain has only been evaluated in French adults. Million et al. found that a high L. reuteri RA was associated with OB (OR, 1.79; 95% CI, 1.03–3.10; p = 0.04) and positively correlated with BMI (r = 0.85; 95% CI, 0.12–0.58; p = 0.02) [21,22]. However, Fak et al. evaluated three different strains of L. reuteri with different effects on mice weight. L. reuteri ATCC PTA 4659 was associated with less weight gain, the 236 strain had an anti-OB effect, and L. reuteri L6798 was associated with high weight gain [44,45]. Regarding strain 263, Chen et al. reported an anti-OB effect of L. reuteri in rats fed a high-energy diet [46].
In the present study, we found an association between L. reuteri RA and OB in children. A probable explanation for this relation is the heterofermentative lactic acid capacity of some L. reuteri strains to grow in different types of sugars and to degrade nondigestible carbohydrates, generating short chain fatty acids (SCFA) like acetate, butyrate, and propionate. Although SCFAs are neither purely obesogenic nor antiobesogenic, acetate, for example, has the highest absorption in the colon and is transported to the liver, contributing to lipogenesis [17,47,48]. This mechanism is plausible; however, experimental studies have shown an opposite effect in organisms [49]. In contrast, these results on L. reuteri should be carefully examined because some strains of L. reuteri are known to prevent gastrointestinal disorders by inhibiting the growth of various pathogenic microorganisms such as Escherichia coli, Staphylococcus aureus, Salmonella typhimurium, Helicobacter pylori, and rotavirus [50].
Strains such as L. reuteri DSM17938 have been associated with the reduction of multi-organ inflammation and intestinal microbiota remodeling in mice [45]. Meanwhile, in humans undergoing insulin therapy for diabetes, this strain did not show effects on HbA1c [51], and L. reuteri NCIMB 30242 has been shown to have hypocholesterolemic effects [52,53]. In addition, in healthy volunteers, the L. reuteri SD5865 increased the secretion of insulin, C peptide, and intestinal peptides, without modifying glucose tolerance and insulin sensitivity [54]. More research on L. reuteri is needed to improve knowledge on its effect on health.
The proposed associations are biologically plausible because the production of pro-inflammatory cytokines and activation of the immune response are generated in hyperplasic and hypertrophic adipose tissue following the excessive accumulation of triglycerides. Both cytokine and immune response activation have been implicated in oxidative stress, and insulin resistance is associated with dyslipidemia [55,56].
Two studies on healthy adults reported that a high fructose intake increases the serum triglyceride concentration in the fasting and postprandial periods without any body weight or BMI changes [57,58]. On the contrary, fructose restriction for 9 days significantly decreased serum triglyceride, LDL-C, glucose, and insulin concentrations in Hispanic or African American adolescents and children. The authors concluded that the low concentration of fructose used may be the cause of the decrease in weight in patients after completion of the study [59].
We discarded the possibility of a potential selection bias despite including only 73.3% of the total study population, because we did not find differences between groups after comparing the mean contribution of fructose between children excluded and included from the study (4.18% vs. 4.19%, p = 0.87). (Table S1). A potential measurement error in the fructose intake may be due to some details not being obtained from diet in the SFFQ, and because this method is inadequate for quantifying consumption; however, SFFQ was used in the same way for all children (normal, OW, and OB), avoiding a differential measurement error. Despite the inherent underestimation associated with the SFFQ, the method allows the different categories of nutrient intake to be compared.
Another consideration is that we did not find any significant differences in energy intake between overweight or obese children in comparison with normal weight children. Under-reporting of energy intake has been previously documented both in overweight and obese adults as well as in children. A potential explication for this is due to the health image of specific food items; those with a negative health image are more likely to be under-reported in comparison to foods with a positive health image, such as vegetables, which tend to be reported in excess. However, the energy intake estimates in this study as well as those used in the National Health and Nutrition Survey 2012 (ENSANUT-2012, Spanish acronym) were obtained through SFFQ, and these both had a low prevalence of under-reporting (12.4% and 14%, respectively). On the other hand, the SFFQ measures the current diet (at last month), and given the overwhelming obesogenic food environment, this condition may affect the variation in consumption among normal weight versus overweight or obese children. Likewise, despite the small differences found between the percentages of energy contribution from fructose in foods, these differences are relevant if we consider that exposure at these levels is continuous (and for a long time). We found a difference in the energy contribution of fructose from industrialized sweetened beverages among normal weight versus obese children of 2% or more, and for sugary homemade beverages, the energy contribution from fructose ranged from 12% for normal weight children to 30% for those with obesity. In contrast, normal weight children had a higher fruit intake compared to obese children. On the other hand, we speculate that these values may be underestimated by the under-reporting of unhealthy foods in overweight or obese children in comparison with normal weight children. Therefore, the estimated differences in the percentages of energy contribution of fructose for some foods may be less than the real differences, and due to the obesogenic food environment, there may be a lower variability in food intake.
Also, another potential limitation of the SFFQ that must be considered is the effect of surrogate information for children aged 6 to 11 years. In this respect, the questionnaire was applied to the caregiver in the presence of the child so that the child could have the opportunity to add information. The above was done in order to decrease under-reporting [60,61].
5. Conclusions
Our results suggest a potential association between a high L. reuteri RA and fructose intake with greater adiposity and metabolic alterations in children. However, more research in this area is required to clarify and understand which L. reuteri strains may pose health risks for children. These findings contribute to the documentation of potential risk factors that may be associated with increased OB and metabolic alterations in school-aged children.
Supplementary Materials
The following are available online at https://www.mdpi.com/2072-6643/11/6/1207/s1, Figure S1: Path model of direct and indirect association between fructose intake tertiles and relative abundance of L. reuteri tertiles with adiposity and cardiometabolic markers in the cohort Mexican children. Table S1: Comparison of general characteristics of main analysis sample with information of the RA L. reuteri and Fructose intake and individuals without information.
Author Contributions
We thank the team of the Unit of Biochemistry IMSS for their technical assistance in the determination of cardiometabolic profile, as well as the group of Genetic Epidemiology of the National Institute of Public Health for their advice in determining the relative abundance of L. reuteri. The authors’ responsibilities were as follows: A.I.B.-G. conceptualization, funding acquisition, project administration, investigation, writing, review, and editing; E.E.H.-Á., I.R.-S., and M.C. investigation, writing original draft; E.E.H.-Á., Y.C.O.-O., and I.R.-S. formal analysis; A.L.-M. and C.E.D.-B. writing original draft, methodology, supervision; L.E.T.-S. and M.G.-P. data curation, formal analyses; M.F. writing, review, and editing. All authors read and approved the final manuscript.
Funding
The study was supported by the National Council of Sciences and Technology (CONACYT, grant no. SSA/IMSS/ISSSTE-CONACYT 2012-180808, CONACYT SSA/IMSS/ISSSTE-CONACYT 2015-262133).
Conflicts of Interest
Eira E. Huerta-Ávila, Ivonne Ramírez-Silva, Luisa E. Torres-Sánchez, Cinthya E. Díaz-Benítez, Yaneth C. Orbe-Orihuela, Alfredo Lagunas-Martínez, Marcia Galván-Portillo, Mario Flores, Miguel Cruz, and Ana I. Burguete have no conflicts of interest.
Abbreviations
| BMI | Body Mass Index |
| HDL-C | High Density Lipoprotein |
| FHO | Family History of Obesity |
| HOMA-IR | Homeostasis Model Assessment of insulin resistance |
| LDL-C | Low Density Lipoprotein |
| LTPA | Leisure Time Physical Activity |
| METs | Metabolic Equivalent of Task |
| OB | Obesity |
| OW | Overweight |
| RA | Relative Abundance |
| SFFQ | Semi-Quantitative Food Frequency Questionnaire |
| WC | Waist Circumference |
References
- World Health Organization. Obesity and overweight. Available online: https://www.who.int/news-room/fact-sheets/detail/obesity-and-overweight (accessed on 2 May 2018).
- Organization for Economic Cooperation and Development O. Obesity update. Available online: https://www.oecd.org/els/health-systems/Obesity-Update-2017 (accessed on 2 May 2018).
- Tappy, L.; Le, K.-A. Metabolic Effects of Fructose and the Worldwide Increase in Obesity. Physiol. Rev. 2010, 90, 23–46. [Google Scholar] [CrossRef] [PubMed]
- Dornas, W.C.; de Lima, W.G.; Pedrosa, M.L.; Silva, M.E. Health implications of high-fructose intake. Adv. Nutr. 2015, 1, 729–737. [Google Scholar] [CrossRef] [PubMed]
- Sievenpiper, J.L.; de Souza, R.J.; Mirrahimi, A.; Yu, M.E.; Carleton, A.J.; Beyene, J.; Chiavaroli, L.; di Buono, M.; Jenkins, A.L.; Leiter, L.A.; et al. Effect of fructose on body weight in controlled feeding trials: A systematic review and meta-analysis. Ann. Intern. Med. 2012, 156, 291–304. [Google Scholar] [CrossRef]
- Wang, D.D.; Sievenpiper, J.L.; de Souza, R.J.; Cozma, A.I.; Chiavaroli, L.; Ha, V.; Mirrahimi, A.; Carleton, A.J.; Di, M.; Jenkins, A.L.; et al. Effect of fructose on postprandial triglycerides: A systematic review and meta-analysis of controlled feeding trials. Atherosclerosis 2014, 232, 125–133. [Google Scholar] [CrossRef]
- Chiavaroli, L.; de Souza, R.J.; Ha, V.; Cozma, A.I.; Mirrahimi, A.; Wang, D.D.; Yu, M.; Carleton, A.J.; Di Buono, M.; Jenkins, A.L.; et al. Effect of fructose on established lipid targets: A systematic review and meta-analysis of controlled feeding trials. J. Am. Heart Assoc. 2015, 4, 1–23. [Google Scholar] [CrossRef]
- Vartanian, L.R.; Schwartz, M.B.; Brownell, K.D. Effects of soft drink consumption on nutrition and health: A systematic review and meta-analysis. Am. J. Public Health 2007, 97, 667–675. [Google Scholar] [CrossRef] [PubMed]
- Ludwig, D.S.; Peterson, K.E.; Gortmaker, S.L. Relation between consumption of sugar-sweetened drinks and childhood obesity: A prospective, observational analysis. Lancet 2001, 357, 505–508. [Google Scholar] [CrossRef]
- Papandreou, D.; Andreou, E.; Heraclides, A.; Rousso, I. Is beverage intake related to overweight and obesity in school children? Hippokratia 2013, 17, 42–46. [Google Scholar]
- Macdonald, I.A. A review of recent evidence relating to sugars, insulin resistance and diabetes. Eur. J. Nutr. 2016, 55, 17–23. [Google Scholar] [CrossRef]
- Nieuwdorp, M.; Gilijamse, P.W.; Pai, N.; Kaplan, L.M. Role of the microbiome in energy regulation and metabolism. Gastroenterology 2014, 146, 1525–1533. [Google Scholar] [CrossRef] [PubMed]
- Cani, P.D.; Amar, J.; Iglesias, M.A.; Poggi, M.; Knauf, C.; Bastelica, D.; Neyrinck, A.M.; Fava, F.; Tuohy, K.M.; Chabo, C.; et al. Metabolic endotoxemia initiates obesity and insulin resistance. Diabetes 2007, 56, 1761–1772. [Google Scholar] [CrossRef]
- Tang, W.H.W.; Kitai, T.; Hazen, S.L. Gut microbiota in cardiovascular health and disease. Circ. Res. 2017, 120, 1183–1196. [Google Scholar] [CrossRef]
- Million, M.; Maraninchi, M.; Henry, M.; Armougom, F.; Richet, H.; Carrieri, P.; Valero, R.; Raccah, D. Obesity-associated gut microbiota is enriched in Lactobacillus reuteri and depleted in Bifidobacterium animalis and Methanobrevibacter smithii. Int. J. Obes. 2011, 36, 817–825. [Google Scholar] [CrossRef] [PubMed]
- Million, M.; Angelakis, E.; Maraninchi, M.; Henry, M.; Giorgi, R.; Valero, R.; Vialettes, B.; Raoult, D. Correlation between body mass index and gut concentrations of Lactobacillus reuteri, Bifidobacterium animalis, Methanobrevibacter smithii and Escherichia coli. Int J Obes. 2013, 37, 1460–1466. [Google Scholar] [CrossRef]
- Gerez, C.L.; Cuezzo, S.; Rollán, G.; Font de Valdez, G. Lactobacillus reuteri CRL 1100 as starter culture for wheat dough fermentation. Food Microbiol. 2008, 25, 253–259. [Google Scholar] [CrossRef]
- Walter, J.; Britton, R.A.; Roos, S. Host-microbial symbiosis in the vertebrate gastrointestinal tract and the Lactobacillus reuteri paradigm. Proc. Natl. Acad. Sci. USA 2011, 108, 4645–4652. [Google Scholar] [CrossRef] [PubMed]
- Årsköld, E.; Lohmeier-Vogel, E.; Cao, R.; Roos, S.; Rådström, P.; Van Niel, E.W.J. Phosphoketolase pathway dominates in Lactobacillus reuteri ATCC 55730 containing dual pathways for glycolysis. J. Bacteriol. 2008, 190, 206–212. [Google Scholar] [CrossRef] [PubMed]
- Sanmiguel, C.; Gupta, A.; Mayer, E.A. Gut Microbiome and Obesity: A Plausible Explanation for Obesity. Curr. Obes. Rep. 2015, 4, 250–261. [Google Scholar] [CrossRef]
- Drissi, F.; Merhej, V.; Angelakis, E.; El Kaoutari, A.; Carrière, F.; Henrissat, B.; Raoult, D. Comparative genomics analysis of Lactobacillus species associated with weight gain or weight protection. Nutr. Diabetes 2014, 4, e109. [Google Scholar] [CrossRef]
- Hou, C.; Zeng, X.; Yang, F.; Liu, H.; Qiao, S. Study and use of the probiotic Lactobacillus reuteri in pigs: A review. J. Anim. Sci. Biotechnol. 2015, 6, 14. [Google Scholar] [CrossRef]
- Estrada-Velasco, B.I.; Cruz, M.; García-Mena, J.; Salgado, A.V.; Romero, J.P.; Guna Serrano, M.D.L.R.; Madrid-Marina, V.; Orihuela, C.O.; López Islas, C.; Burguete-García, A.I. Childhood obesity is associated to the interaction between firmicutes and high energy food consumption. Nutr. Hosp. 2015, 31, 1074–1081. [Google Scholar]
- Habich, J. Standardization of quantitative epidemiological methods in the field. Oficina Sanit. Panam. 1974, 75, 375–384. [Google Scholar]
- Lohman, T.G.; Roche, A.F. Anthropometric Standardization Reference Manual; Human Kinetics Books: Champaign, IL, USA, 1988; pp. 39–70. [Google Scholar]
- Rivera, J.Á.; de Cossío, T.G.; Pedraza, L.S.; Aburto, T.C.; Sánchez, T.G.; Martorell, R. Childhood and adolescent overweight and obesity in Latin America: A systematic review. Lancet Diabetes Endocrinol. 2014, 2, 321–332. [Google Scholar] [CrossRef]
- Hosker, J.P.; Matthews, D.R.; Rudenski, A.S.; Burnett, M.A.; Darling, P.; Bown, E.G.; Turner, R.C. Continuous infusion of glucose with model assessment: measurement of insulin resistance and beta-cell function in man. Diabetologia 1985, 28, 401–411. [Google Scholar] [CrossRef]
- Willet, W. Nutritional Epidemiology; Oxford University Press: Oxford, UK, 1990. [Google Scholar]
- INSP. Databases of the nutritional value of foods. Compilation of the National Institute of Public Health. 2012. Available online: http://kin.insp.mx/aplicaciones/Redpidieta (accessed on 2 May 2018).
- Haarman, M.; Knol, J. Quantitative Real-Time PCR Analysis of Fecal Lactobacillus Species in Infants Receiving a Prebiotic Infant Formula Quantitative Real-Time PCR Analysis of Fecal Lactobacillus Species in Infants Receiving a Prebiotic Infant Formula. Appl. Environ. Microbiol. 2006, 72, 2359–2365. [Google Scholar] [CrossRef]
- Bacchetti De Gregoris, T.; Aldred, N.; Clare, A.S.; Burgess, J.G. Improvement of phylum- and class-specific primers for real-time PCR quantification of bacterial taxa. J. Microbiol. Methods 2011, 86, 351–356. [Google Scholar] [CrossRef] [PubMed]
- Schmittgen, T.D.; Livak, K.J. Analyzing real-time PCR data by the comparative C T method. Nat. Protoc. 2008, 3, 1101–1108. [Google Scholar] [CrossRef]
- Hernández, B.; Gortmaker, S.L.; Laird, N.M.; Colditz, G.A.; Parra-Cabrera, S.P.K. Validity and reproducibility of a questionnaire on physical activity and non-activity for school children in Mexico City. Salud Publica Mex. 2000, 42, 315–323. [Google Scholar] [CrossRef]
- Cárdenas-Cárdenas, L.M.; Burguete-Garcia, A.I.; Estrada-Velasco, B.I.; López-Islas, C.; Peralta-Romero, J.; Cruz, M.; Galván-Portillo, M. Leisure-time physical activity and cardiometabolic risk among children and adolescents. J. Pediatr. (Rio J.) 2015, 91, 136–142. [Google Scholar] [CrossRef] [PubMed]
- Johnson, R.J.; Andrews, P.; Lanaspa, M.A. Perspective: A Historical and Scienti fi c Perspective of Sugar and Its Relation with Obesity and Diabetes. Adv. Nutr. 2017, 8, 412–422. [Google Scholar]
- Rippe, J.M.; Angelopoulos, T.J. Sucrose, High-Fructose Corn Syrup, and Fructose, Their Metabolism and Potential Health Effects: What Do We Really Know? Adv. Nutr. 2013, 4, 236–245. [Google Scholar] [CrossRef] [PubMed]
- Duthie, S.J.; Duthie, G.G.; Russell, W.R.; Kyle, J.A.M.; Macdiarmid, J.I.; Rungapamestry, V.; Stephen, S.; Megias-Baeza, C.; Kaniewska, J.J.; Shaw, L.; et al. Effect of increasing fruit and vegetable intake by dietary intervention on nutritional biomarkers and attitudes to dietary change: A randomised trial. Eur. J. Nutr. 2018, 57, 1855–1872. [Google Scholar] [CrossRef]
- Hun, S.; Wolfgang, M.; Tokutake, Y.; Chohnan, S.; Lane, M.D. Differential effects of central fructose and glucose on hypothalamic malonyl—CoA and food intake. Proc. Natl. Acad. Sci. USA 2008, 105, 16871–16875. [Google Scholar]
- Basaranoglu, M.; Basaranoglu, G.; Sabuncu, T.; Sentürk, H. Fructose as a key player in the development of fatty liver disease. World J. Gastroenterol. 2013, 19, 1166–1172. [Google Scholar] [CrossRef]
- Ley, R.E.; Turnbaugh, P.J.; Klein, S.; Gordon, J.I. Microbial ecology: Human gut microbes associated with obesity. Nature 2006, 444, 1022–1023. [Google Scholar] [CrossRef]
- Armougom, F.; Henry, M.; Vialettes, B.; Raccah, D.; Raoult, D. Monitoring bacterial community of human gut microbiota reveals an increase in Lactobacillus in obese patients and Methanogens in anorexic patients. PLoS ONE 2009, 4, 1–8. [Google Scholar] [CrossRef]
- Liu, H.; Zhang, J.; Zhang, S.; Yang, F.; Thacker, P.A.; Zhang, G.; Qiao, S.; Ma, X. Oral administration of lactobacillus fermentum I5007 favors intestinal development and alters the intestinal microbiota in formula-fed piglets. J. Agric. Food Chem. 2014, 62, 860–866. [Google Scholar] [CrossRef]
- Wang, A.; Yu, H.; Gao, X.; Li, X.; Qiao, S. Influence of Lactobacillus fermentum I5007 on the intestinal and systemic immune responses of healthy and E. coli challenged piglets. Antonie van Leeuwenhoek. Int. J. Gen. Mol. Microbiol. 2009, 96, 89–98. [Google Scholar]
- Fåk, F.; Bäckhed, F. Lactobacillus reuteri Prevents Diet-Induced Obesity, but not Atherosclerosis, in a Strain Dependent Fashion in Apoe-/- Mice. PLoS ONE 2012, 7, 1–8. [Google Scholar] [CrossRef]
- Mu, Q.; Tavella, V.J.; Luo, X.M. Role of Lactobacillus reuteri in human health and diseases. Front. Microbiol. 2018, 9, 757. [Google Scholar] [CrossRef]
- Chen, L.; Chen, Y.; Cheng, K.; Chien, T.; Chan, C. Antiobesity effect of Lactobacillus reuteri 263 associated with energy metabolism remodeling of white adipose tissue in high-energy-diet-fed rats. J. Nutr. Biochem. 2018, 54, 87–94. [Google Scholar] [CrossRef]
- Blaut, M. Gut microbiota and energy balance: Role in obesity. Proc. Nutr. Soc. 2015, 74, 227–234. [Google Scholar] [CrossRef] [PubMed]
- Ma, L.; Robinson, L.N.; Towle, H.C. ChREBP·Mlx is the principal mediator of glucose-induced gene expression in the liver. J. Biol. Chem. 2006, 281, 28721–28730. [Google Scholar] [CrossRef]
- Canfora, E.E.; Blaak, E.E. Acetate: A diet-derived key metabolite in energy metabolism: Good or bad in context of obesity and glucose homeostasis? Curr. Opin. Clin. Nutr. Metab. Care 2017, 20, 477–483. [Google Scholar]
- Orita, H.M.; Oh, H.T.; Ukuda, S.F.; Orikawa, H.H.; Shima, K.O.; Uzuki, T.S.; Urakami, M.M.; Isamatsu, S.H.; Ato, Y.K.; Akizawa, T.T.; et al. Comparative Genome Analysis of Lactobacillus reuteri and Lactobacillus fermentum Reveal a Genomic Island for Reuterin and Cobalamin Production. DNA Res. 2008, 15, 151–161. [Google Scholar]
- Mobini, R.; Tremaroli, V.; Ståhlman, M.; Karlsson, F.; Levin, M.; Ljungberg, M.; Sohlin, M.; Bertéus Forslund, H.; Perkins, R.; Bäckhed, F.; et al. Metabolic effects of Lactobacillus reuteri DSM 17938 in people with type 2 diabetes: A randomized controlled trial. Diabetes Obes. Metab. 2017, 19, 579–589. [Google Scholar] [CrossRef] [PubMed]
- Jones, M.L.; Martoni, C.J.; Parent, M.; Prakash, S. Cholesterol-lowering efficacy of a microencapsulated bile salt hydrolase-active Lactobacillus reuteri NCIMB 30242 yoghurt formulation in hypercholesterolaemic adults. Br. J. Nutr. 2012, 107, 1505–1513. [Google Scholar] [CrossRef] [PubMed]
- Jones, M.L.; Martoni, C.J.; Prakash, S. Cholesterol lowering and inhibition of sterol absorption by Lactobacillus reuteri NCIMB 30242: A randomized controlled trial. Eur. J. Clin. Nutr. 2012, 66, 1234–1241. [Google Scholar] [CrossRef]
- Simon, M.C.; Strassburger, K.; Nowotny, B.; Kolb, H.; Nowotny, P.; Burkart, V.; Zivehe, F.; Hwang, J.H.; Stehle, P.; Pacini, G.; et al. Intake of lactobacillus reuteri improves incretin and insulin secretion in Glucose-Tolerant humans: A proof of concept. Diabetes Care 2015, 38, 1827–1834. [Google Scholar] [CrossRef]
- Holvoet, P. Stress in obesity and associated metabolic and cardiovascular disorders. Scientifica (Cairo) 2012, 2012, 1–19. [Google Scholar] [CrossRef]
- Bastarrachea, R.A.; López-Alvarenga, J.C.; Bolado-García, V.E.; Téllez-Mendoza, J.; Laviada-Molina, H.C.A. Macrophages, inflammation, adipose tissue, obesity and insulin resistance. Gac. Med. Mex. 2007, 143, 505–512. [Google Scholar]
- Faeh, D.; Minehira, K.; Schwarz, J.M.; Periasami, R.; Seongsu, P.; Tappy, L. Effect of fructose overfeeding and fish oil administration on hepatic de novo lipogenesis and insulin sensitivity in healthy men. Diabetes 2005, 54, 1907–1913. [Google Scholar] [CrossRef] [PubMed]
- Schwarz, J.M.; Noworolski, S.M.; Wen, M.J.; Dyachenko, A.; Prior, J.L.; Weinberg, M.E.; Herraiz, L.A.; Tai, V.W.; Bergeron, N.; Bersot, T.P.; et al. Effect of a high-fructose weight-maintaining diet on lipogenesis and liver fat. J. Clin. Endocrinol. Metab. 2015, 100, 2434–2442. [Google Scholar] [CrossRef]
- Lustig, R.H.; Mulligan, K.; Noworolski, S.M.; Tai, V.W.; Wen, M.J.; Erkin-cakmak, A.; Gugliucci, A.; Schwarz, J.; Francisco, S.; Francisco, S.; et al. Isocaloric fructose restriction and metabolic improvement in children with obesity and metabolic syndrome. Obesity 2017, 24, 453–460. [Google Scholar] [CrossRef]
- Macdiarmid, J.; Blundell, J. Assessing dietary intake. Who, what and why of under-reporting. Nutr. Res. Rev. 1998, 11, 231–253. [Google Scholar] [CrossRef] [PubMed]
- Eck, L.H.; Klesges, R.C.; Hanson, C.L. Recall of a child’s intake from one meal: Are parents accurate? J. Am. Diet. Assoc. 1989, 89, 784–789. [Google Scholar] [PubMed]
© 2019 by the authors. Licensee MDPI, Basel, Switzerland. This article is an open access article distributed under the terms and conditions of the Creative Commons Attribution (CC BY) license (http://creativecommons.org/licenses/by/4.0/).