Abstract
This paper presents an experimental study of the behavior of a steel-composite hollow reinforced concrete (RC) column under concentric loading. The effects of important variables, such as concrete strength, inner tube thickness, hollow ratio, column diameter, and transverse reinforcement space, are presented in this study. The failure of composite hollow RC columns is characterized by the formation of an inclined shear sliding plane. When the column had a highly confined effect, the inclination of the shear sliding plane was 45°. This study shows that the required performance is achieved when the splice providing transverse reinforcement is fully bonded. Furthermore, the inner tube experiences buckling failure after reaching its maximum strength. The steel-composite hollow RC column with high-strength concrete (HSC) has lower ductility and toughness compared to a column with normal-strength concrete (NSC).
1. Introduction
Recently, the use of high-strength concrete (HSC) in composite structures has greatly improved. The HSC has higher compressive strength, greater elastic modulus, and smaller size compared to normal-strength concrete (Cusson and Paultre [1]). Miarka et al. [2] undertook a comparison of the fracture resistance of normal- and high-strength concrete, which was evaluated in an experimental study. Dong et al. [3] studied the fire resistance of recycled aggregate concrete columns with different concrete compressive strengths.
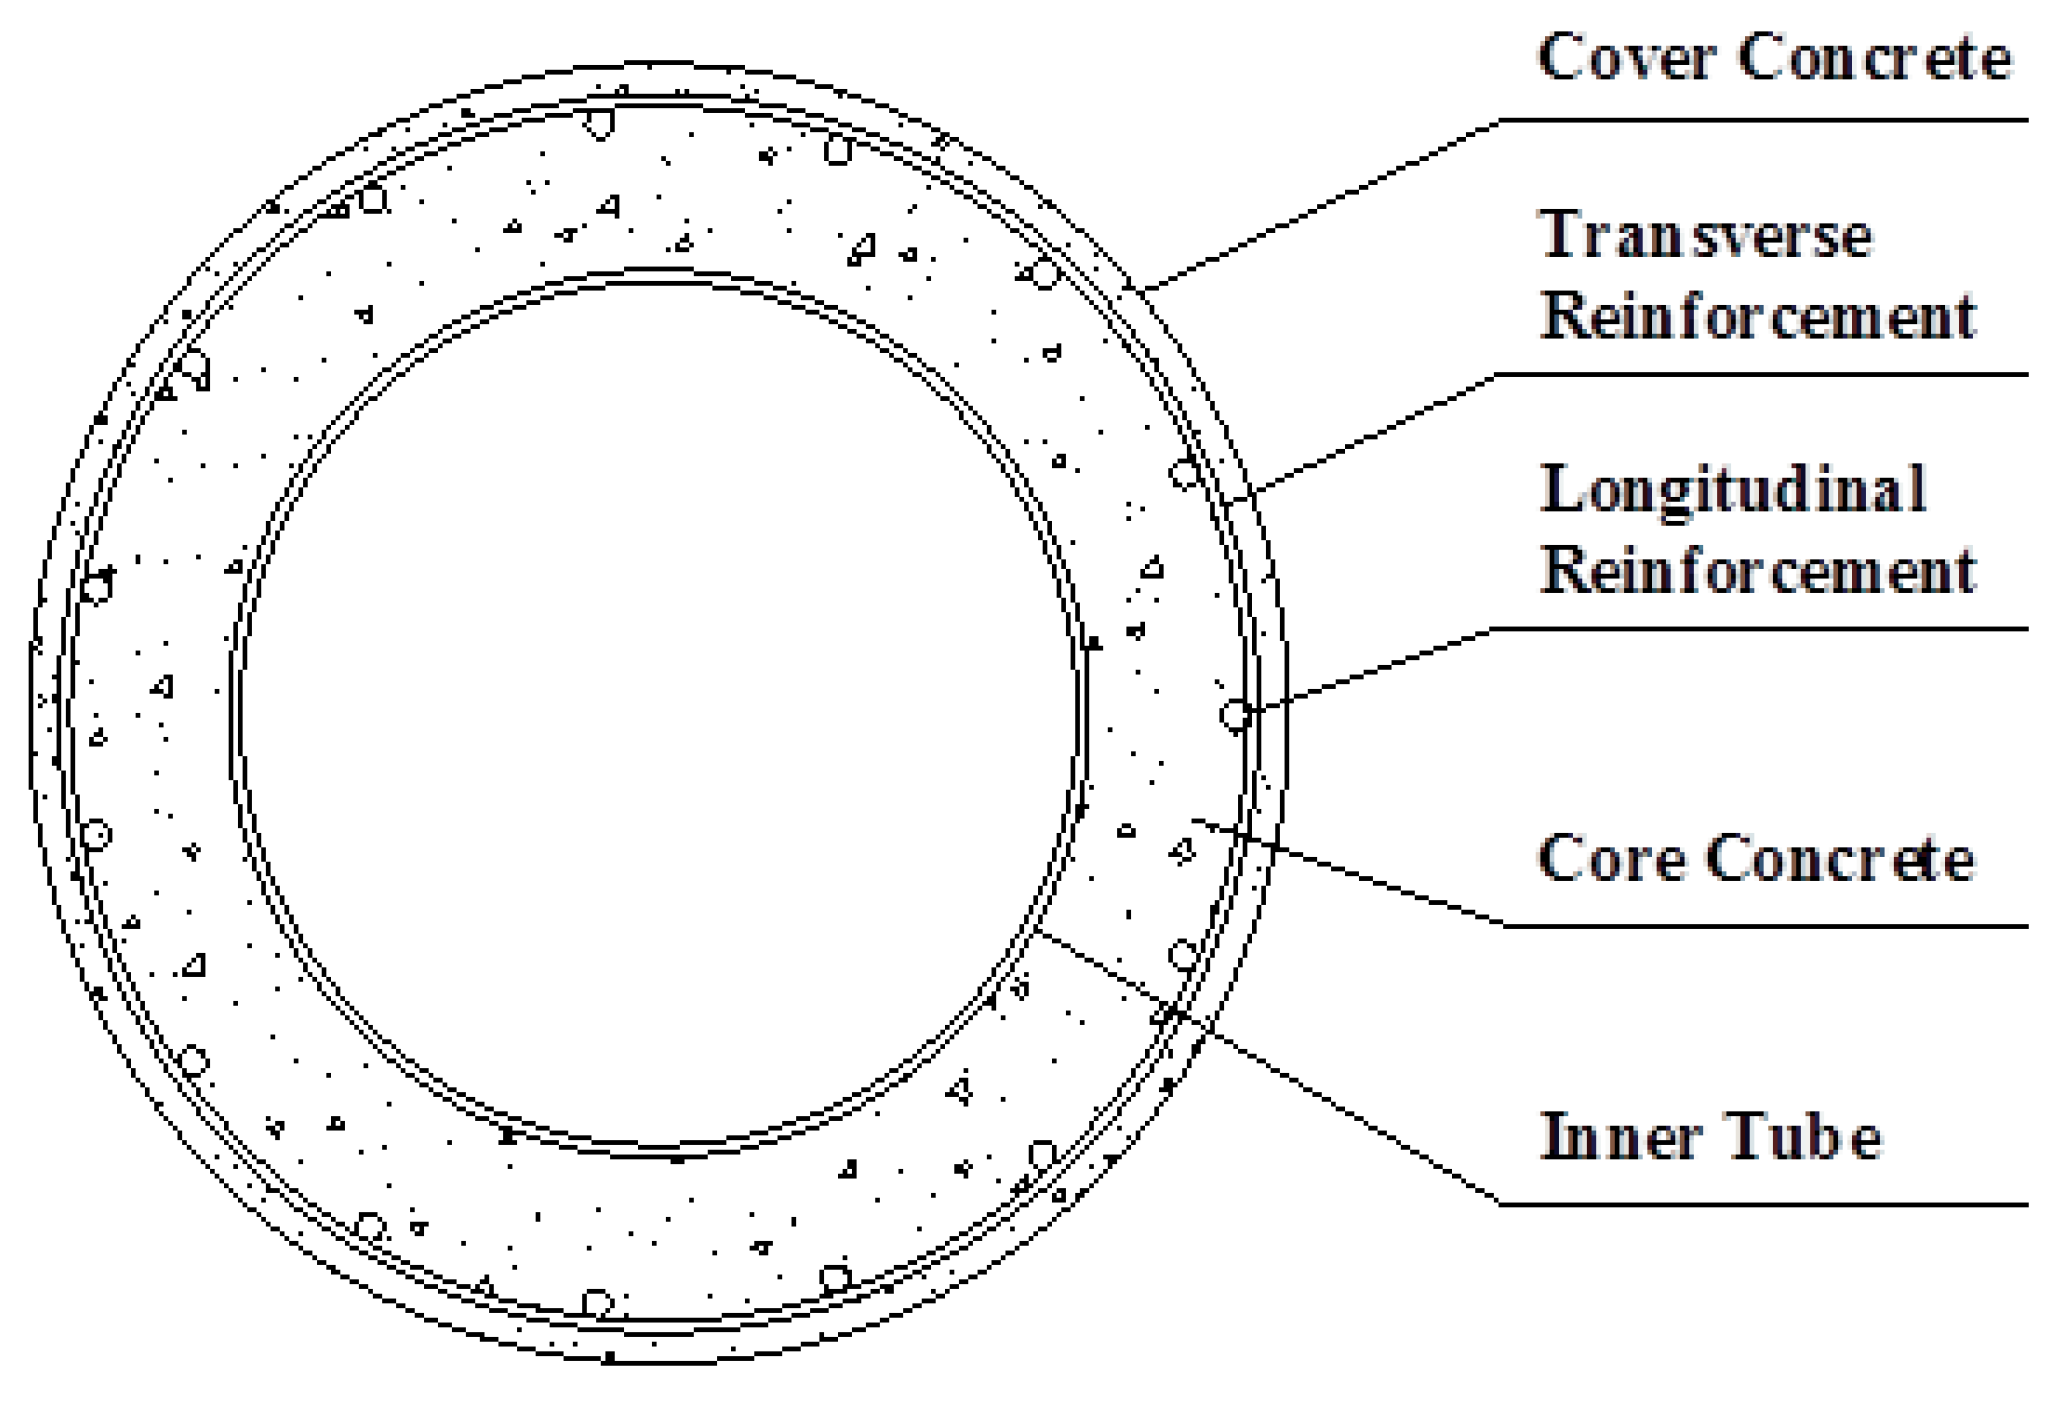
The steel-composite hollow reinforced concrete (RC) column was proposed by Han et al. [4]. That study aimed to prevent the occurrence of brittle failure in a hollow RC column. It featured an inner tube that reinforced the inner face of the hollow RC column, which is shown in Figure 1. This offered strong and durable confinement, because of the reinforcement provided by the inner tube. The column’s strength and ductility were enhanced, because of the continuous confinement stress provided by the inner tube. This column had cover concrete on its outside but the hollow section don’t has cover concrete by the inner tube. The strength and ductility of the columns were enhanced by the continuous confining stress provided by the inner tube. The confinement of normal-strength concrete (NSC) for steel-composite hollow RC columns has been studied in the last few years [4,5,6,7]. Stress–strain models for confined concrete have been proposed based on the material model created by Mander [8] (Han et al. [4]). A nonlinear concrete model and a compressive strength model with normal-strength concrete were studied in experiments evaluating its column [6,7]. Won et al. [5] studied the optimal confining stress on the core concrete through finite element analysis. Based on Mander’s material model [8], these studies proposed a material model and applied it in evaluating composite hollow RC columns. However, if the strength of the concrete is increased, the proposed material model and analysis method may not be suitable, because Mander’s material model [8] was proposed for a column with normal-strength concrete.
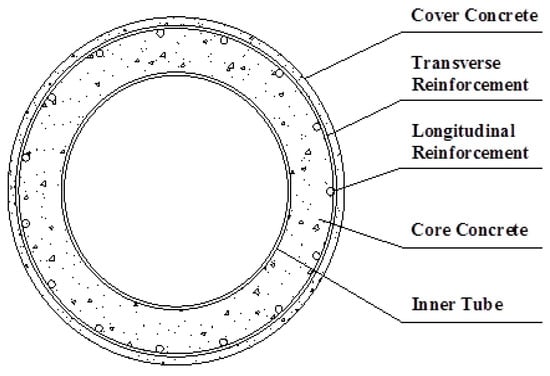
Figure 1.
Cross-section of a steel-composite hollow reinforced concrete (RC) column.
The main objective of this paper was to investigate the compressive behavior of a steel-composite hollow RC column with an HSC of 50 MPa. This paper presents an experimental study of the compressive behavior of steel-composite hollow RC columns with HSC confined by circular reinforcement, which was tested under axial loading. There were 22 columns used as samples for this test. Test variables included inner tube thickness, hollow ratio, diameter of column, transverse reinforcement space, and normal-strength concrete (20 MPa).
2. Test Program
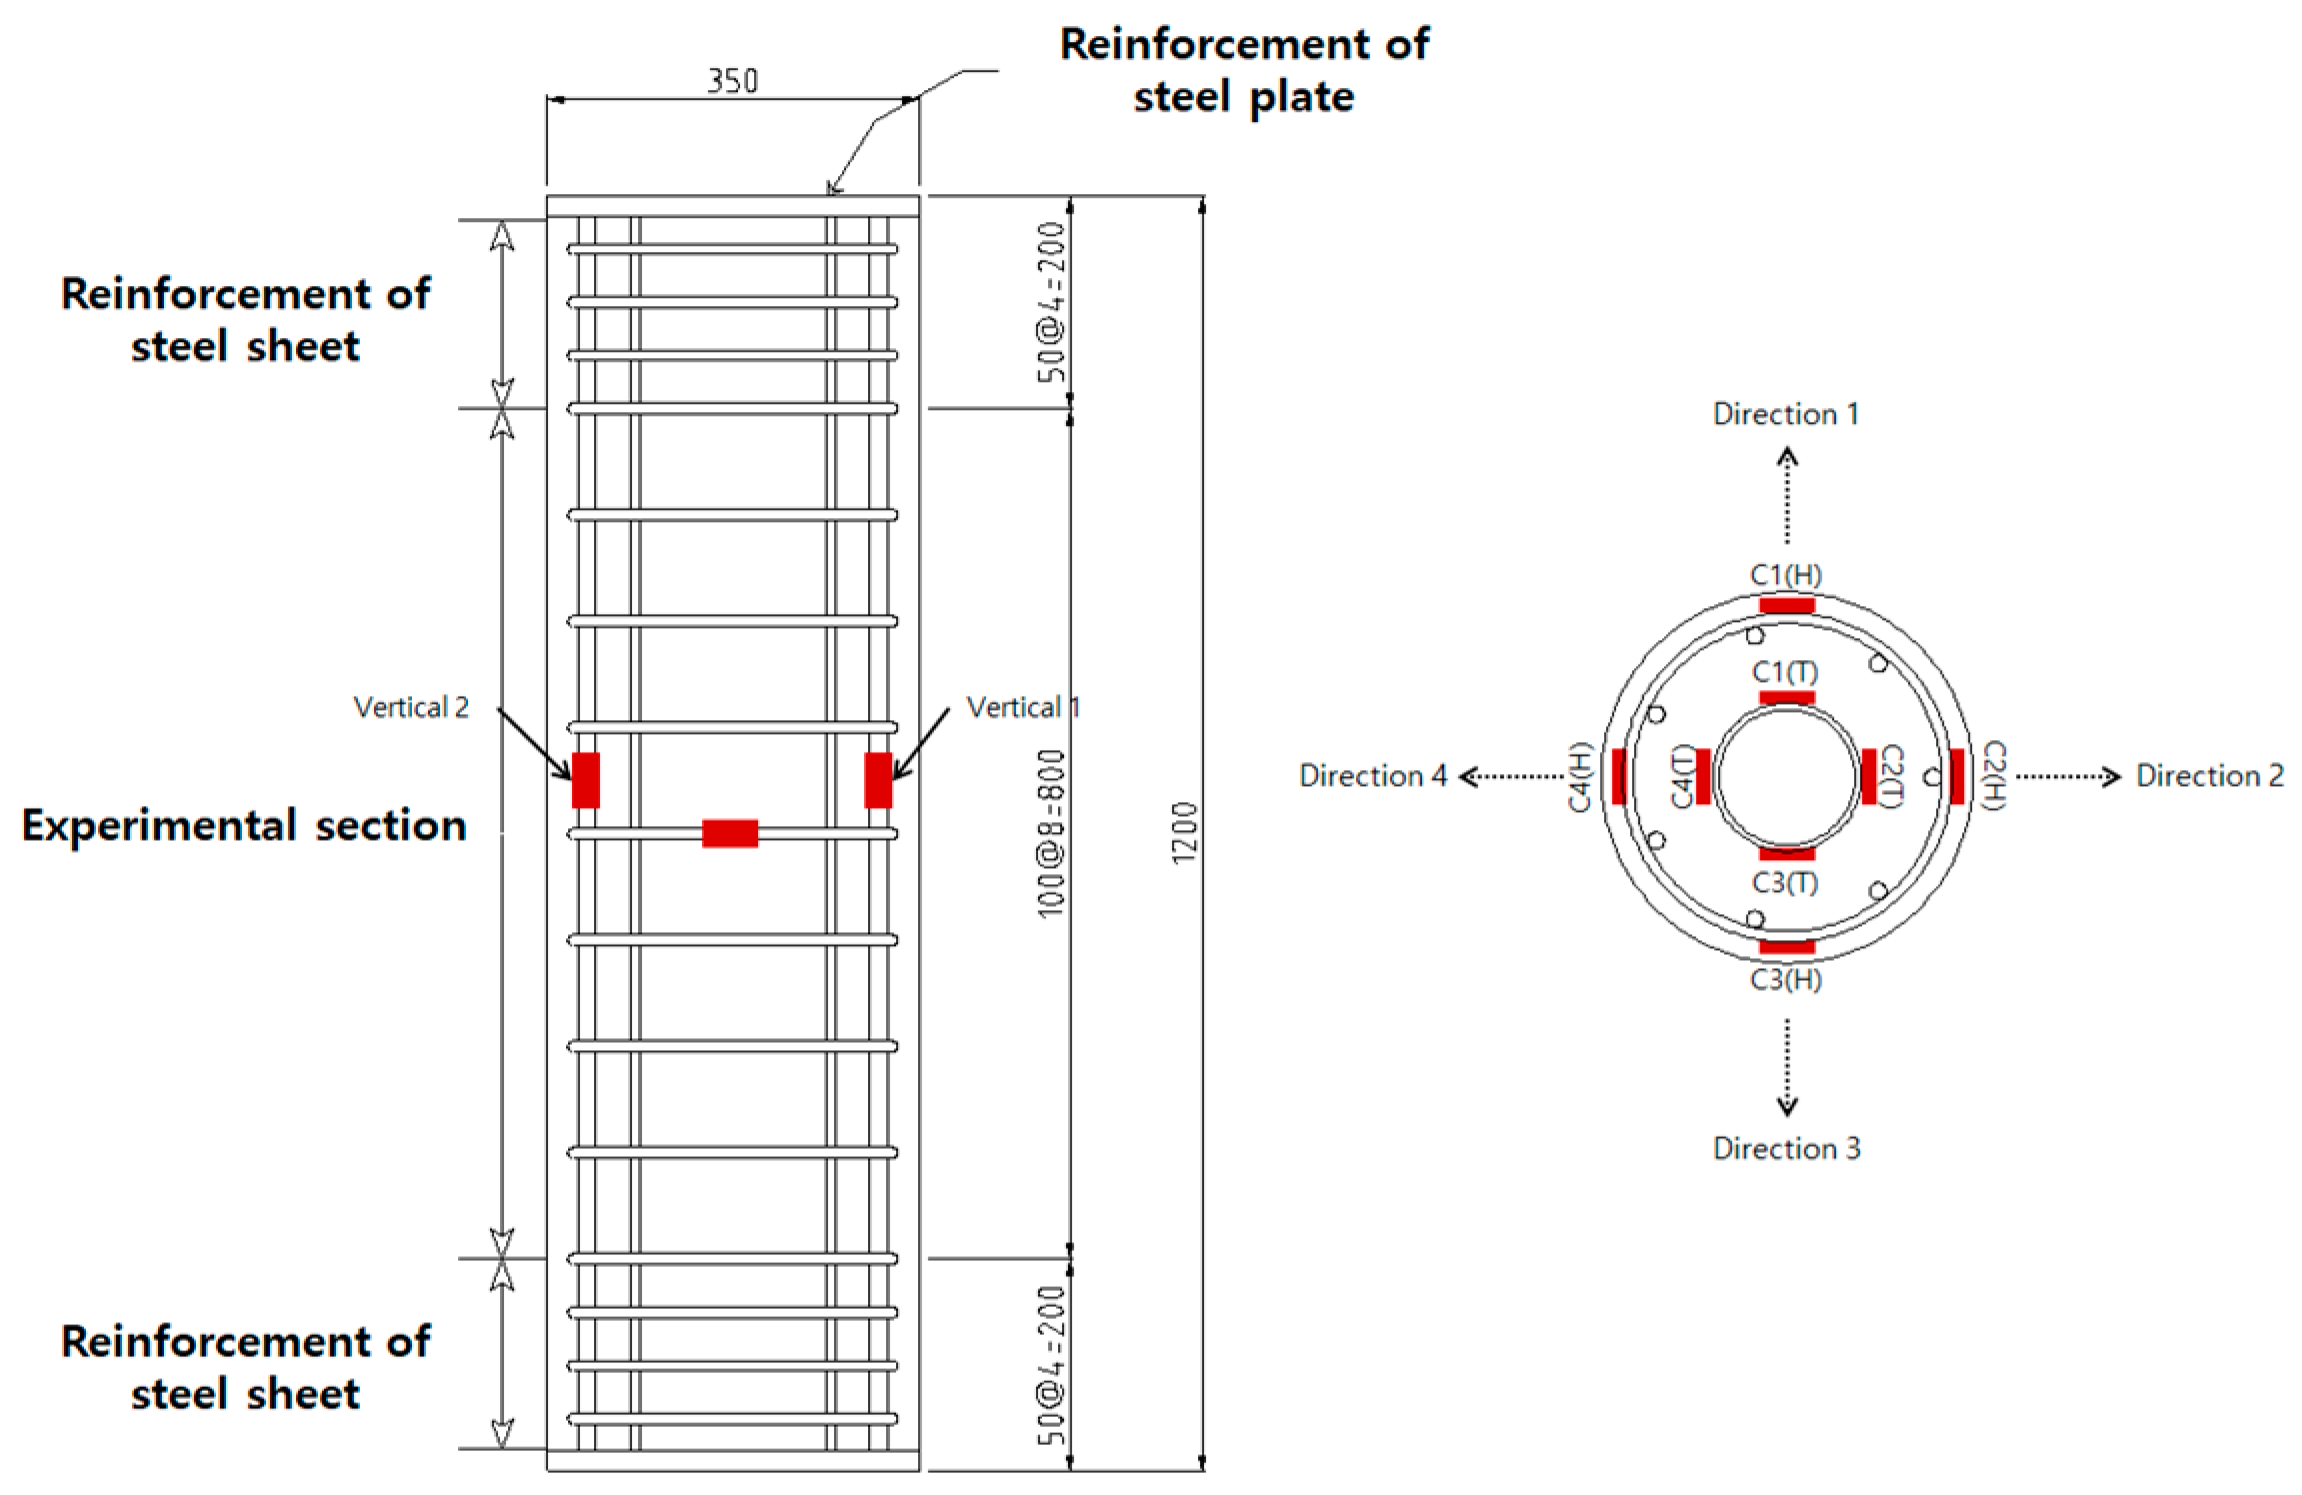
The steel-composite hollow RC columns with HSC were tested under compressive axial concentric loading. Figure 2 shows the design of the test columns in detail. The following variables were studied in the test program: (1) concrete strength (design normal-strength concrete: 20 MPa, design high-strength concrete: 50 MPa), (2) inner tube thickness, (3) hollow ratio (ratio between the inside diameter of the column and the outside diameter of the column), (4) column diameter, and (5) transverse reinforcement space.
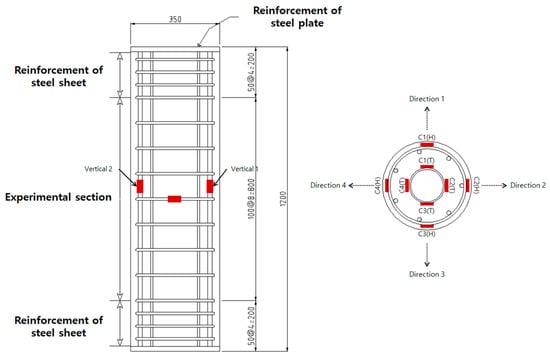
Figure 2.
Dimensions of test specimens (red color: strain gauges).
The specimens in groups 2–5 were made of concrete with a specified strength of 50 MPa. Normal-strength concrete was applied to the inner tube of group 1, which was subsequently compared to HSC specimens. To ensure that failure would occur in the region at the center of the column, both sides of the columns were reinforced with a bolted steel sheet made from a steel plate of 20 mm. Figure 2 shows the dimensions of the test specimens and strain gauges. The height of the specimens was 1200 mm and the experimental region at the column had a length of 800 mm. The diameter of the column was 350 mm. The strain gauges were attached at the transverse and longitudinal reinforcements in the inner tube.
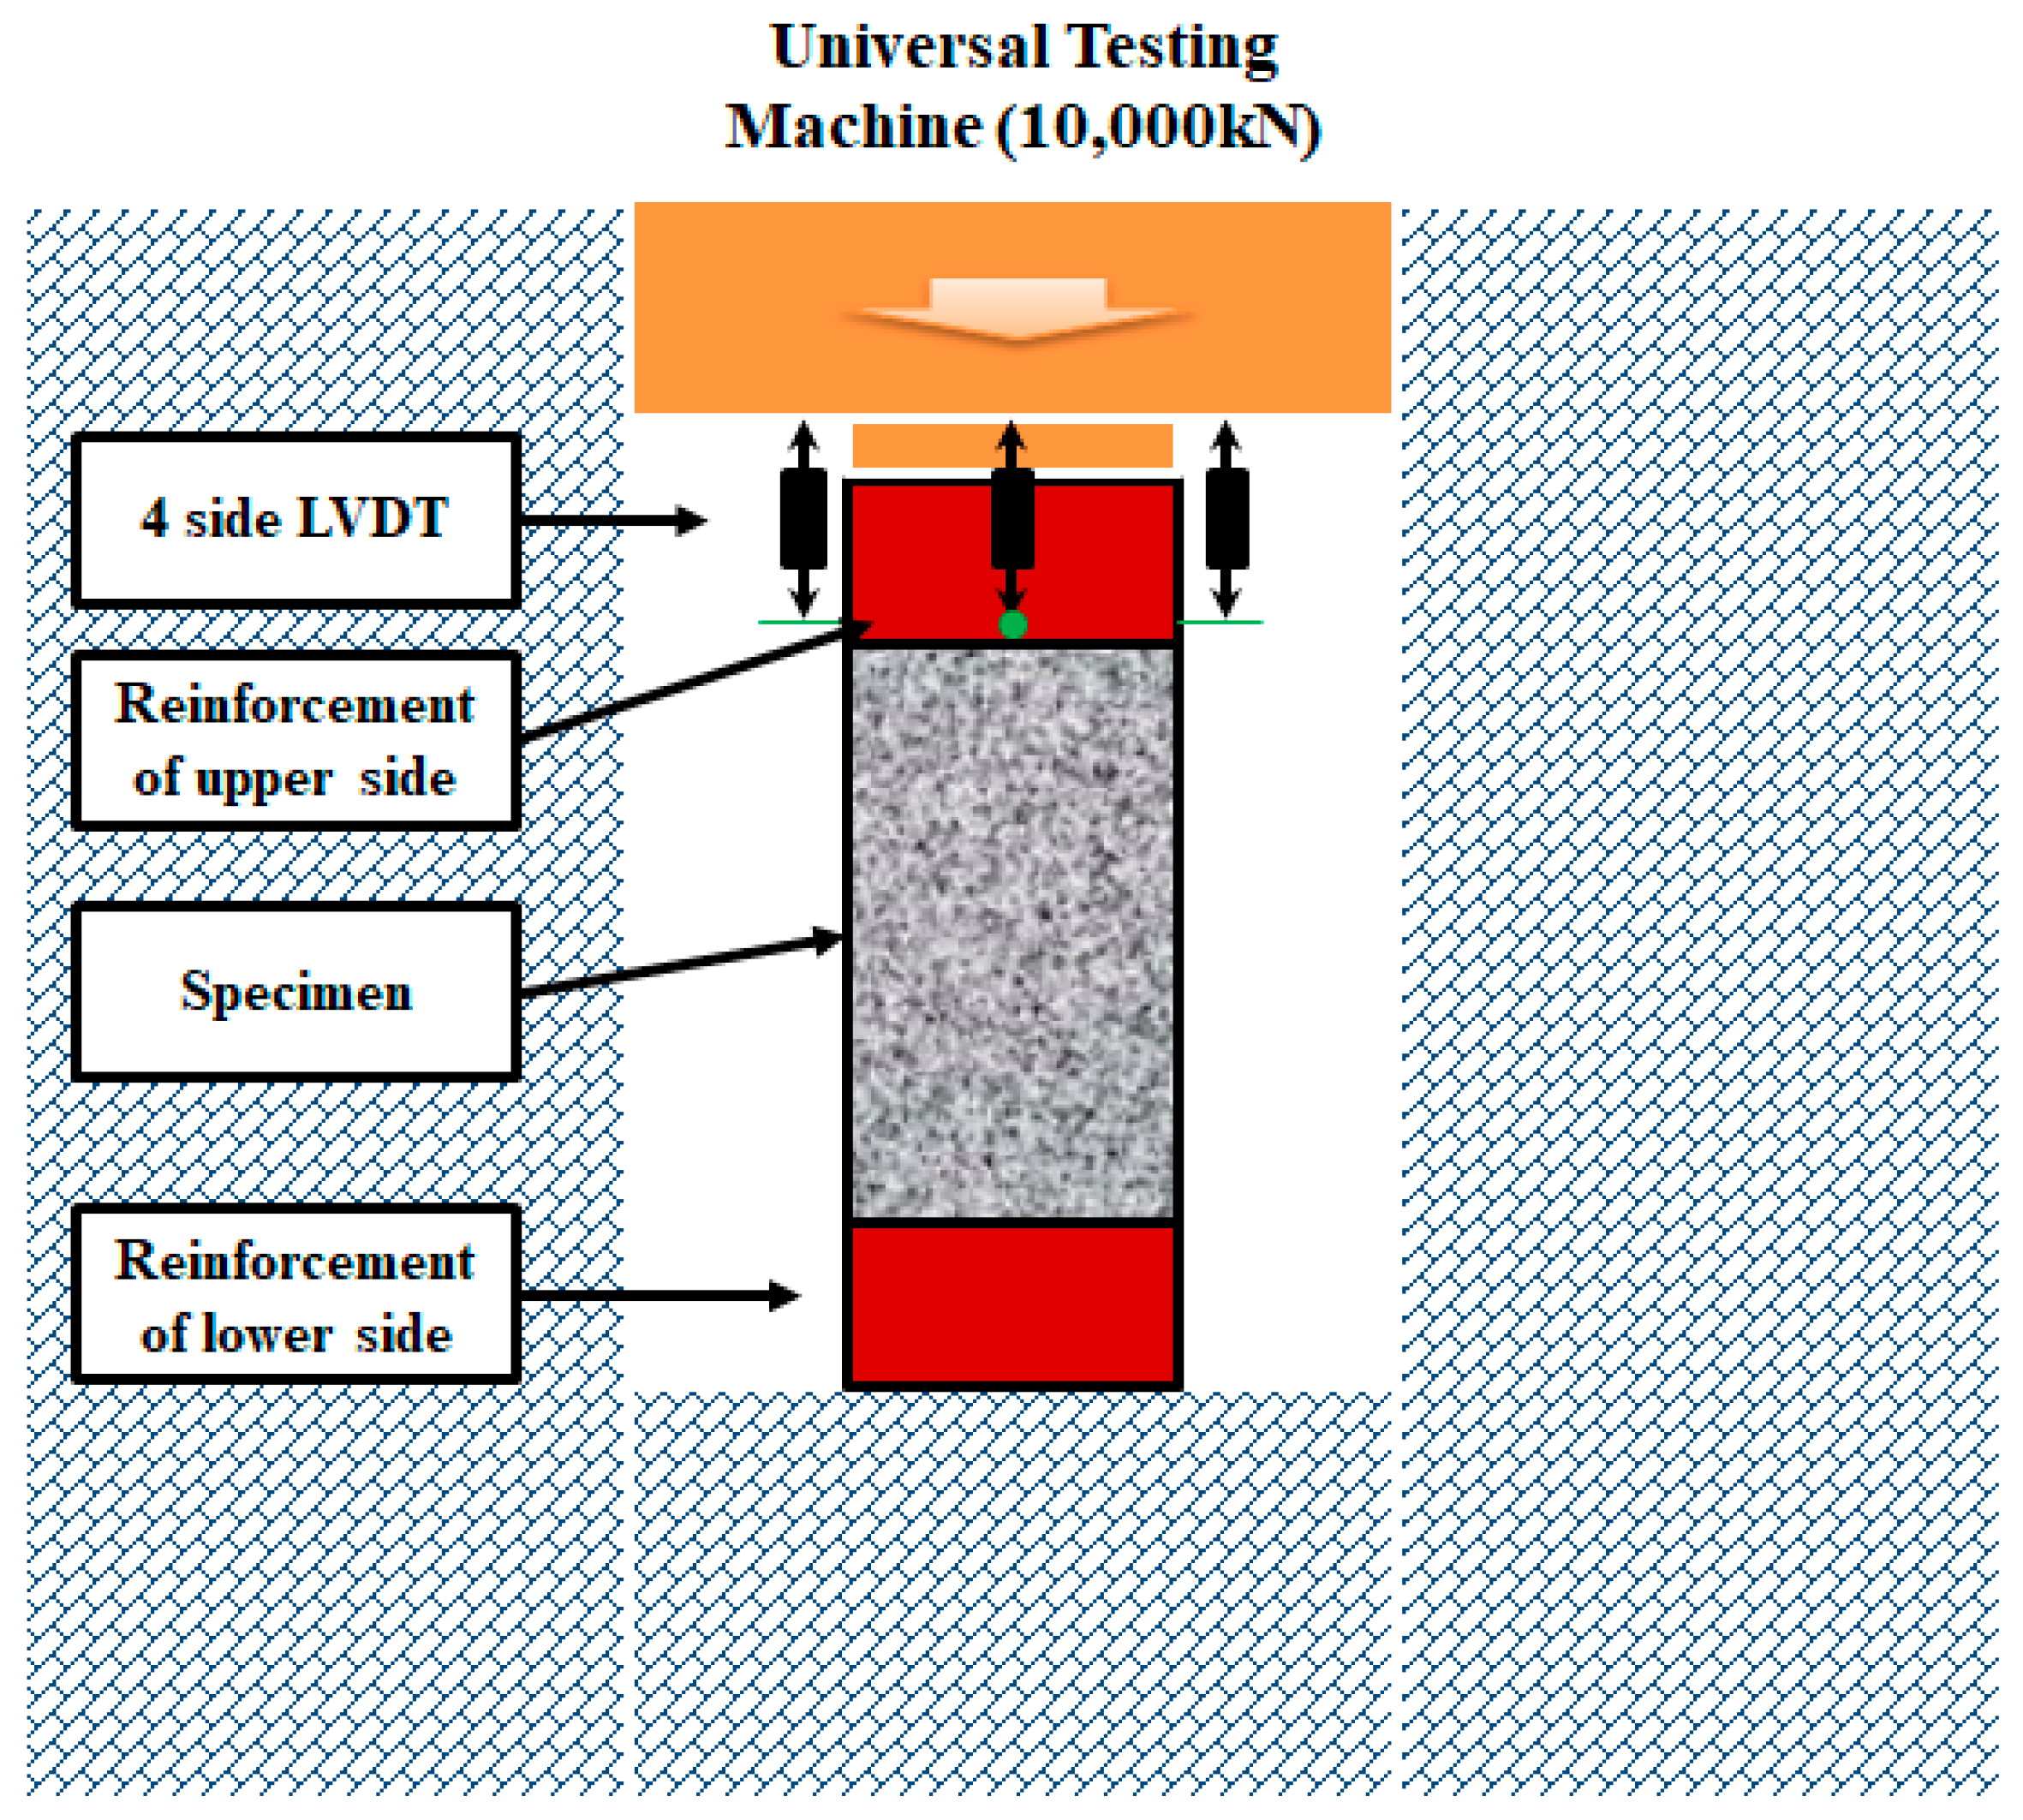
Figure 3 shows a diagram of the experimental setup. The test specimens were loaded on a rigid hydraulic press with load control capabilities at a maximum compressive load of 10,000 kN. The axial displacement was measured using four linear variable differential transformers (LVDTs) located at the four corners of the columns and attached to the top, which is shown in Figure 3.
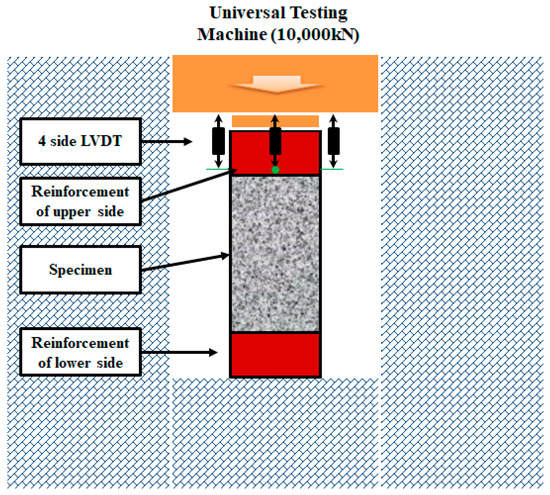
Figure 3.
Diagram of experimental setup.
Table 1 shows the characteristics of the test specimens. To study the concrete strength, two different concrete mixes designed with a 28-day strength of 50 MPa and 20 MPa were produced. The cured cylinder of concrete had an average strength of 43.5 MPa for HSC and 17.2 MPa for NSC. To measure the material properties of the reinforcement and steel tube, a tensile test was performed. The average tensile strength of steel reinforcement was 401 MPa, whereas that of the steel tube was 395 MPa.

Table 1.
Details of test specimens (unit: MPa, mm).
The test variables included the inner tube thickness (including normal-strength concrete), hollow ratio, column diameter, and transverse reinforcement space. Range of the inner tube thickness was from 0 to 6 mm. Furthermore, Specimen Nos. 5 and 22 had transverse and longitudinal reinforcements instead of inner tube reinforcements in the inner side of the concrete. The hollow ratio, which is defined as the ratio between the outside and inside diameters of the column, ranged from 0.36 to 0.58. The diameter of the column ranged from 300 to 450 mm. The transverse reinforcement space increased from 80 to 150 mm, which is shown in Table 1.
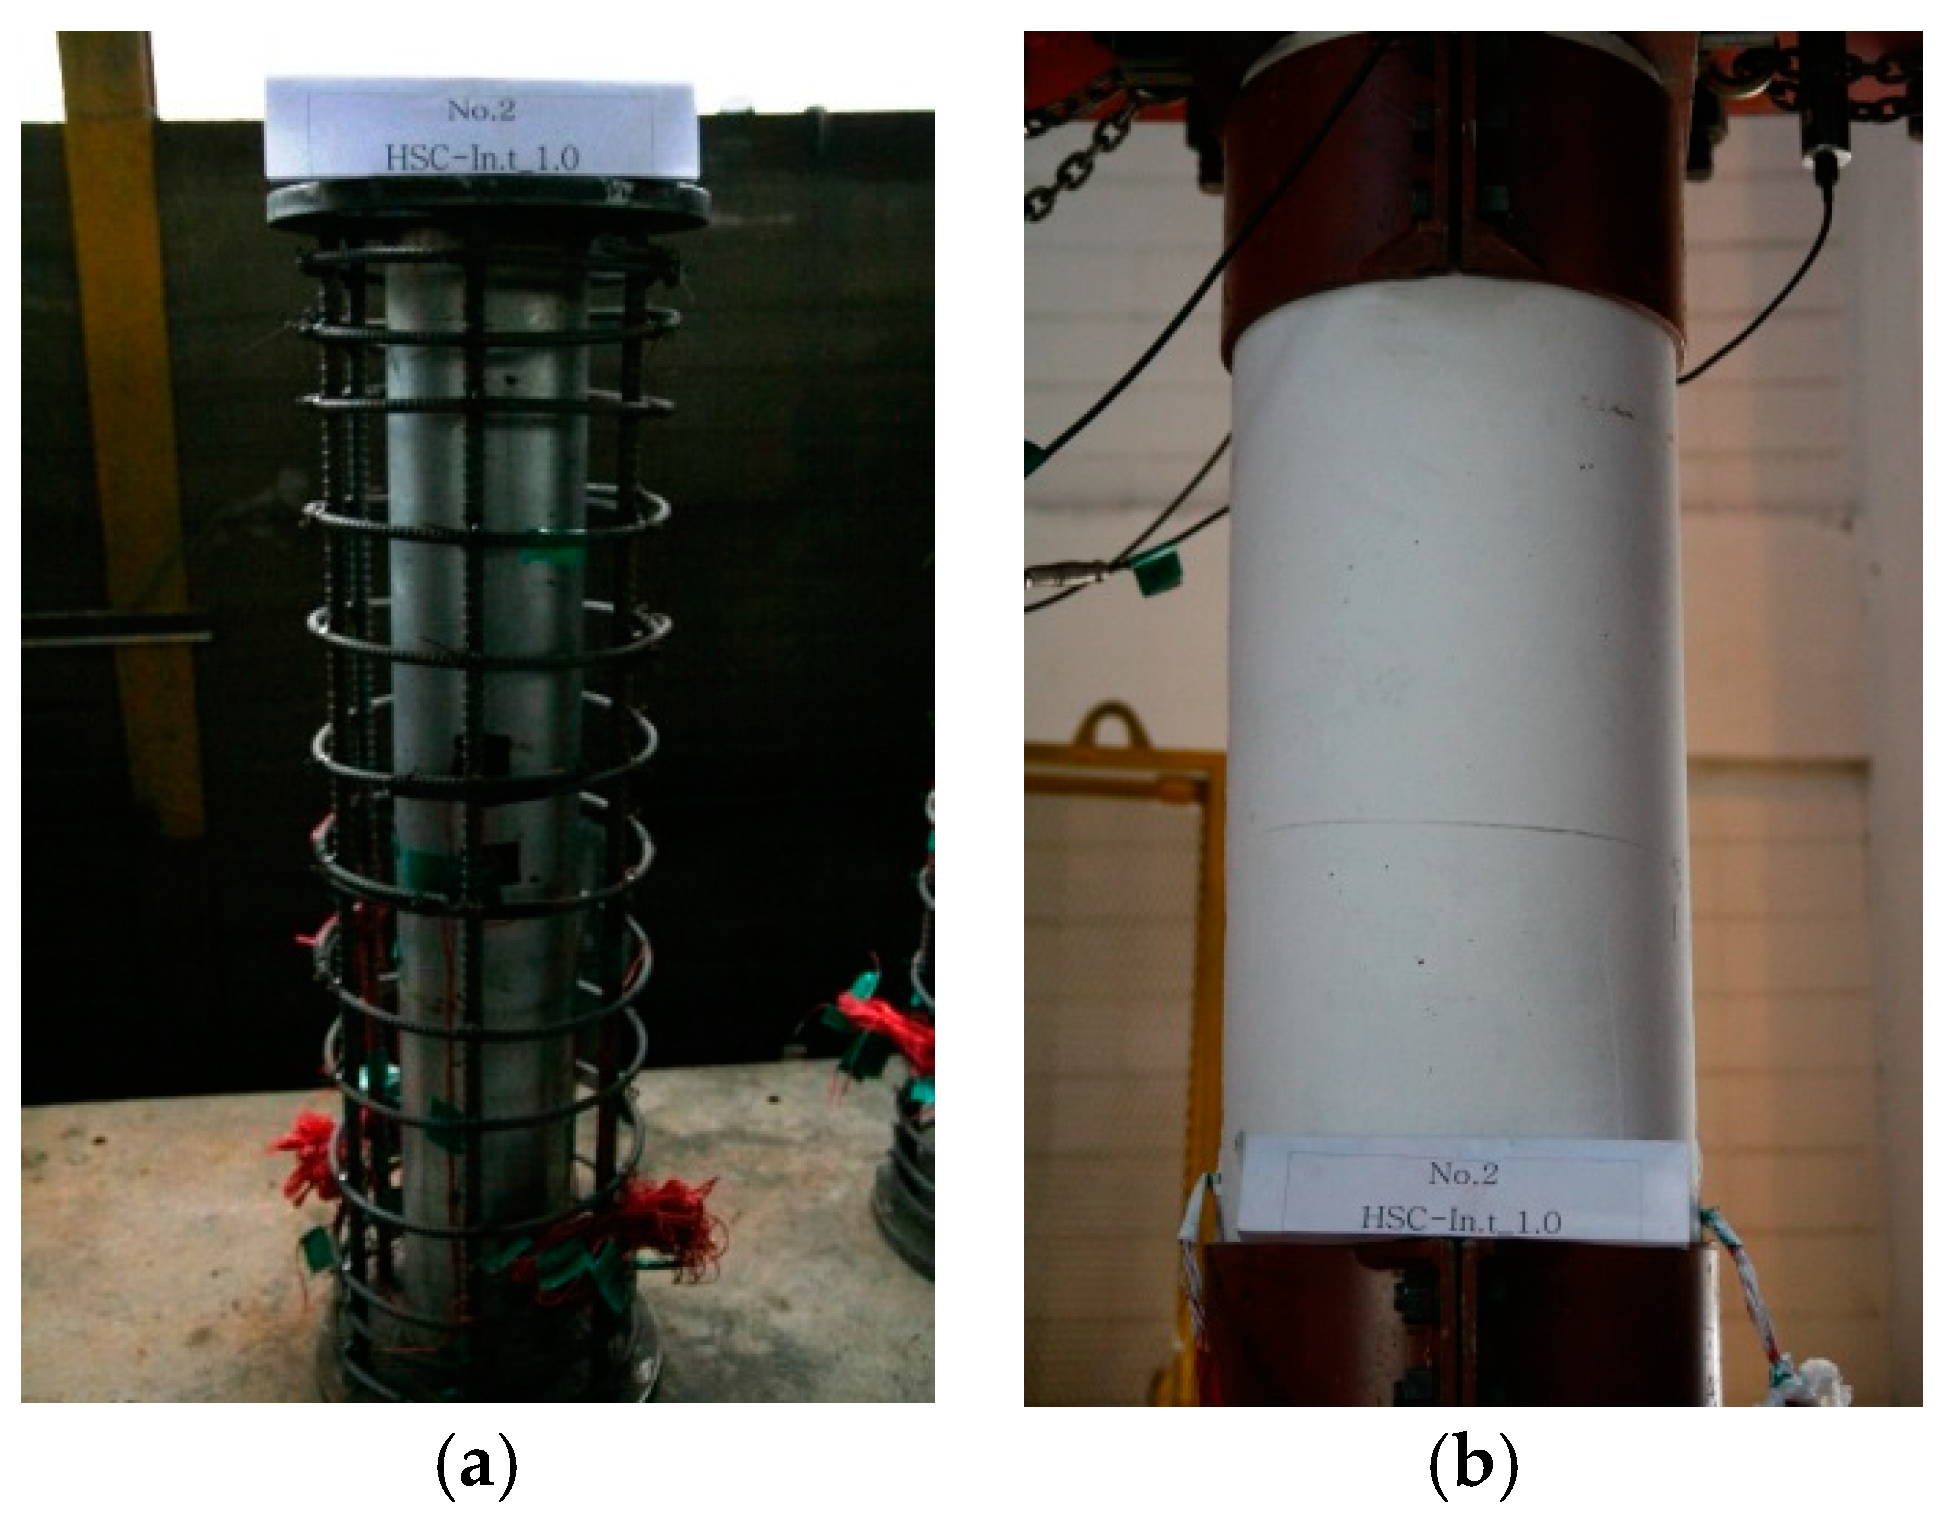
Figure 4 shows the layout of the reinforcements and the setup of the specimens. The steel plates on the top and bottom of the specimens were reinforced to prevent any failure from ripping off due to compressive concentric loading. After the curing and placement of the concrete, the specimens were produced for testing, which is shown in Figure 4.

Figure 4.
Layout of reinforcements (a) and setup of specimens (b).
3. Test Results
3.1. Investigation of Test Results
Figure 5 shows Specimen HSC-HS_130 at different loading stages. During the ascending part of loading, cracks appeared in the concrete cover after the load exceeded the maximum strength of the column. The cover concrete became suddenly separated at the initial load level. After the crack occurred in the cover concrete on the loading side with an increase in compressive concentric loading, the crack propagated at an angle of 45°.
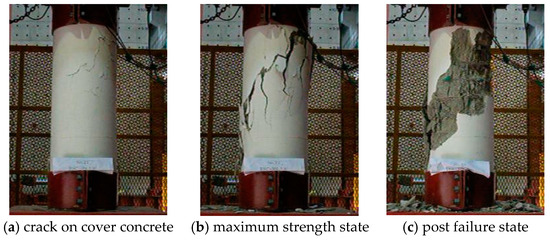
Figure 5.
Appearance of test specimens at different loading stages (HSC-HS_130).
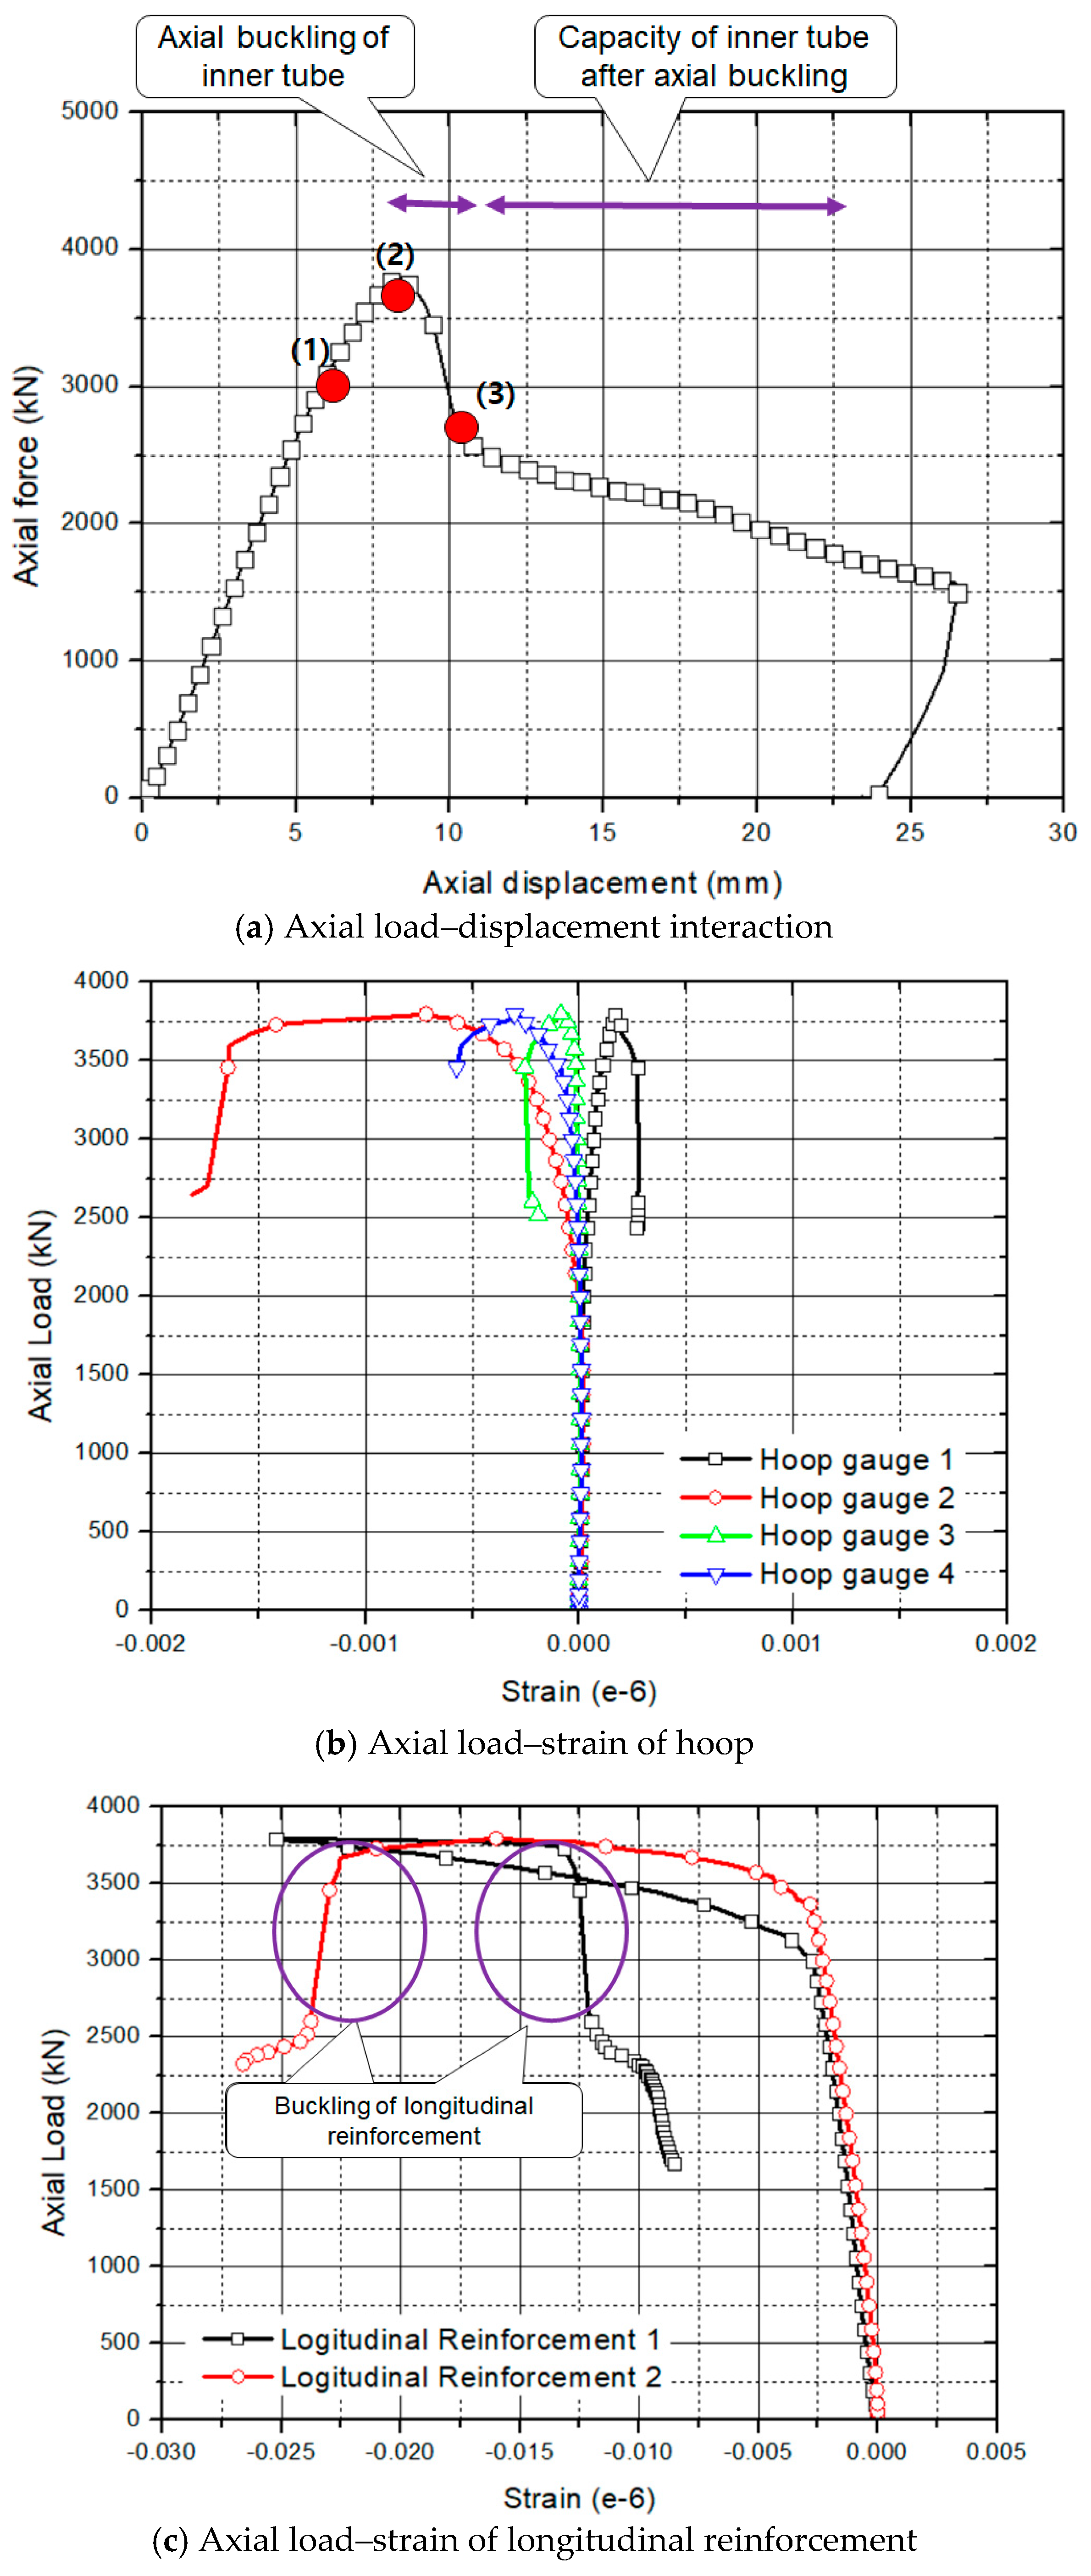
Figure 6a shows the axial load–displacement interactions. The maximum strength of this specimen was 3700 kN. After the maximum strength of the column was reached, the strength reduced rapidly due to the buckling of longitudinal reinforcement or yielding of the transverse reinforcement, which is shown in Figure 6b,c. We confirmed that the strains of longitudinal reinforcements changed from the compressed state to the tensile state, which is shown in Figure 6c.
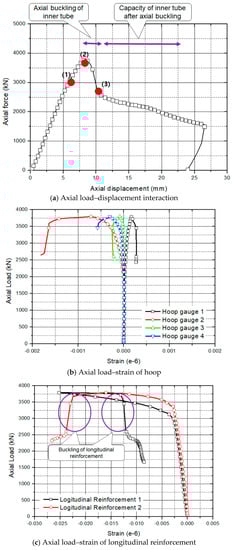
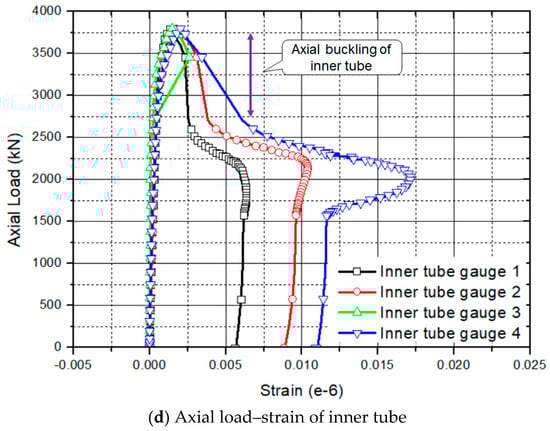
Figure 6.
Behavior of column (HSC-HS_130)
In general, the strength of the RC column with HSC decreased after it reached its maximum strength. On the contrary, the steel-composite hollow RC column had a bifurcation point (3), as shown in Figure 6a. This phenomenon occurred due to the resistance after the buckling of inner tube, as shown in Figure 6d. This column had 65% of the maximum strength after the inner steel tube collapsed.
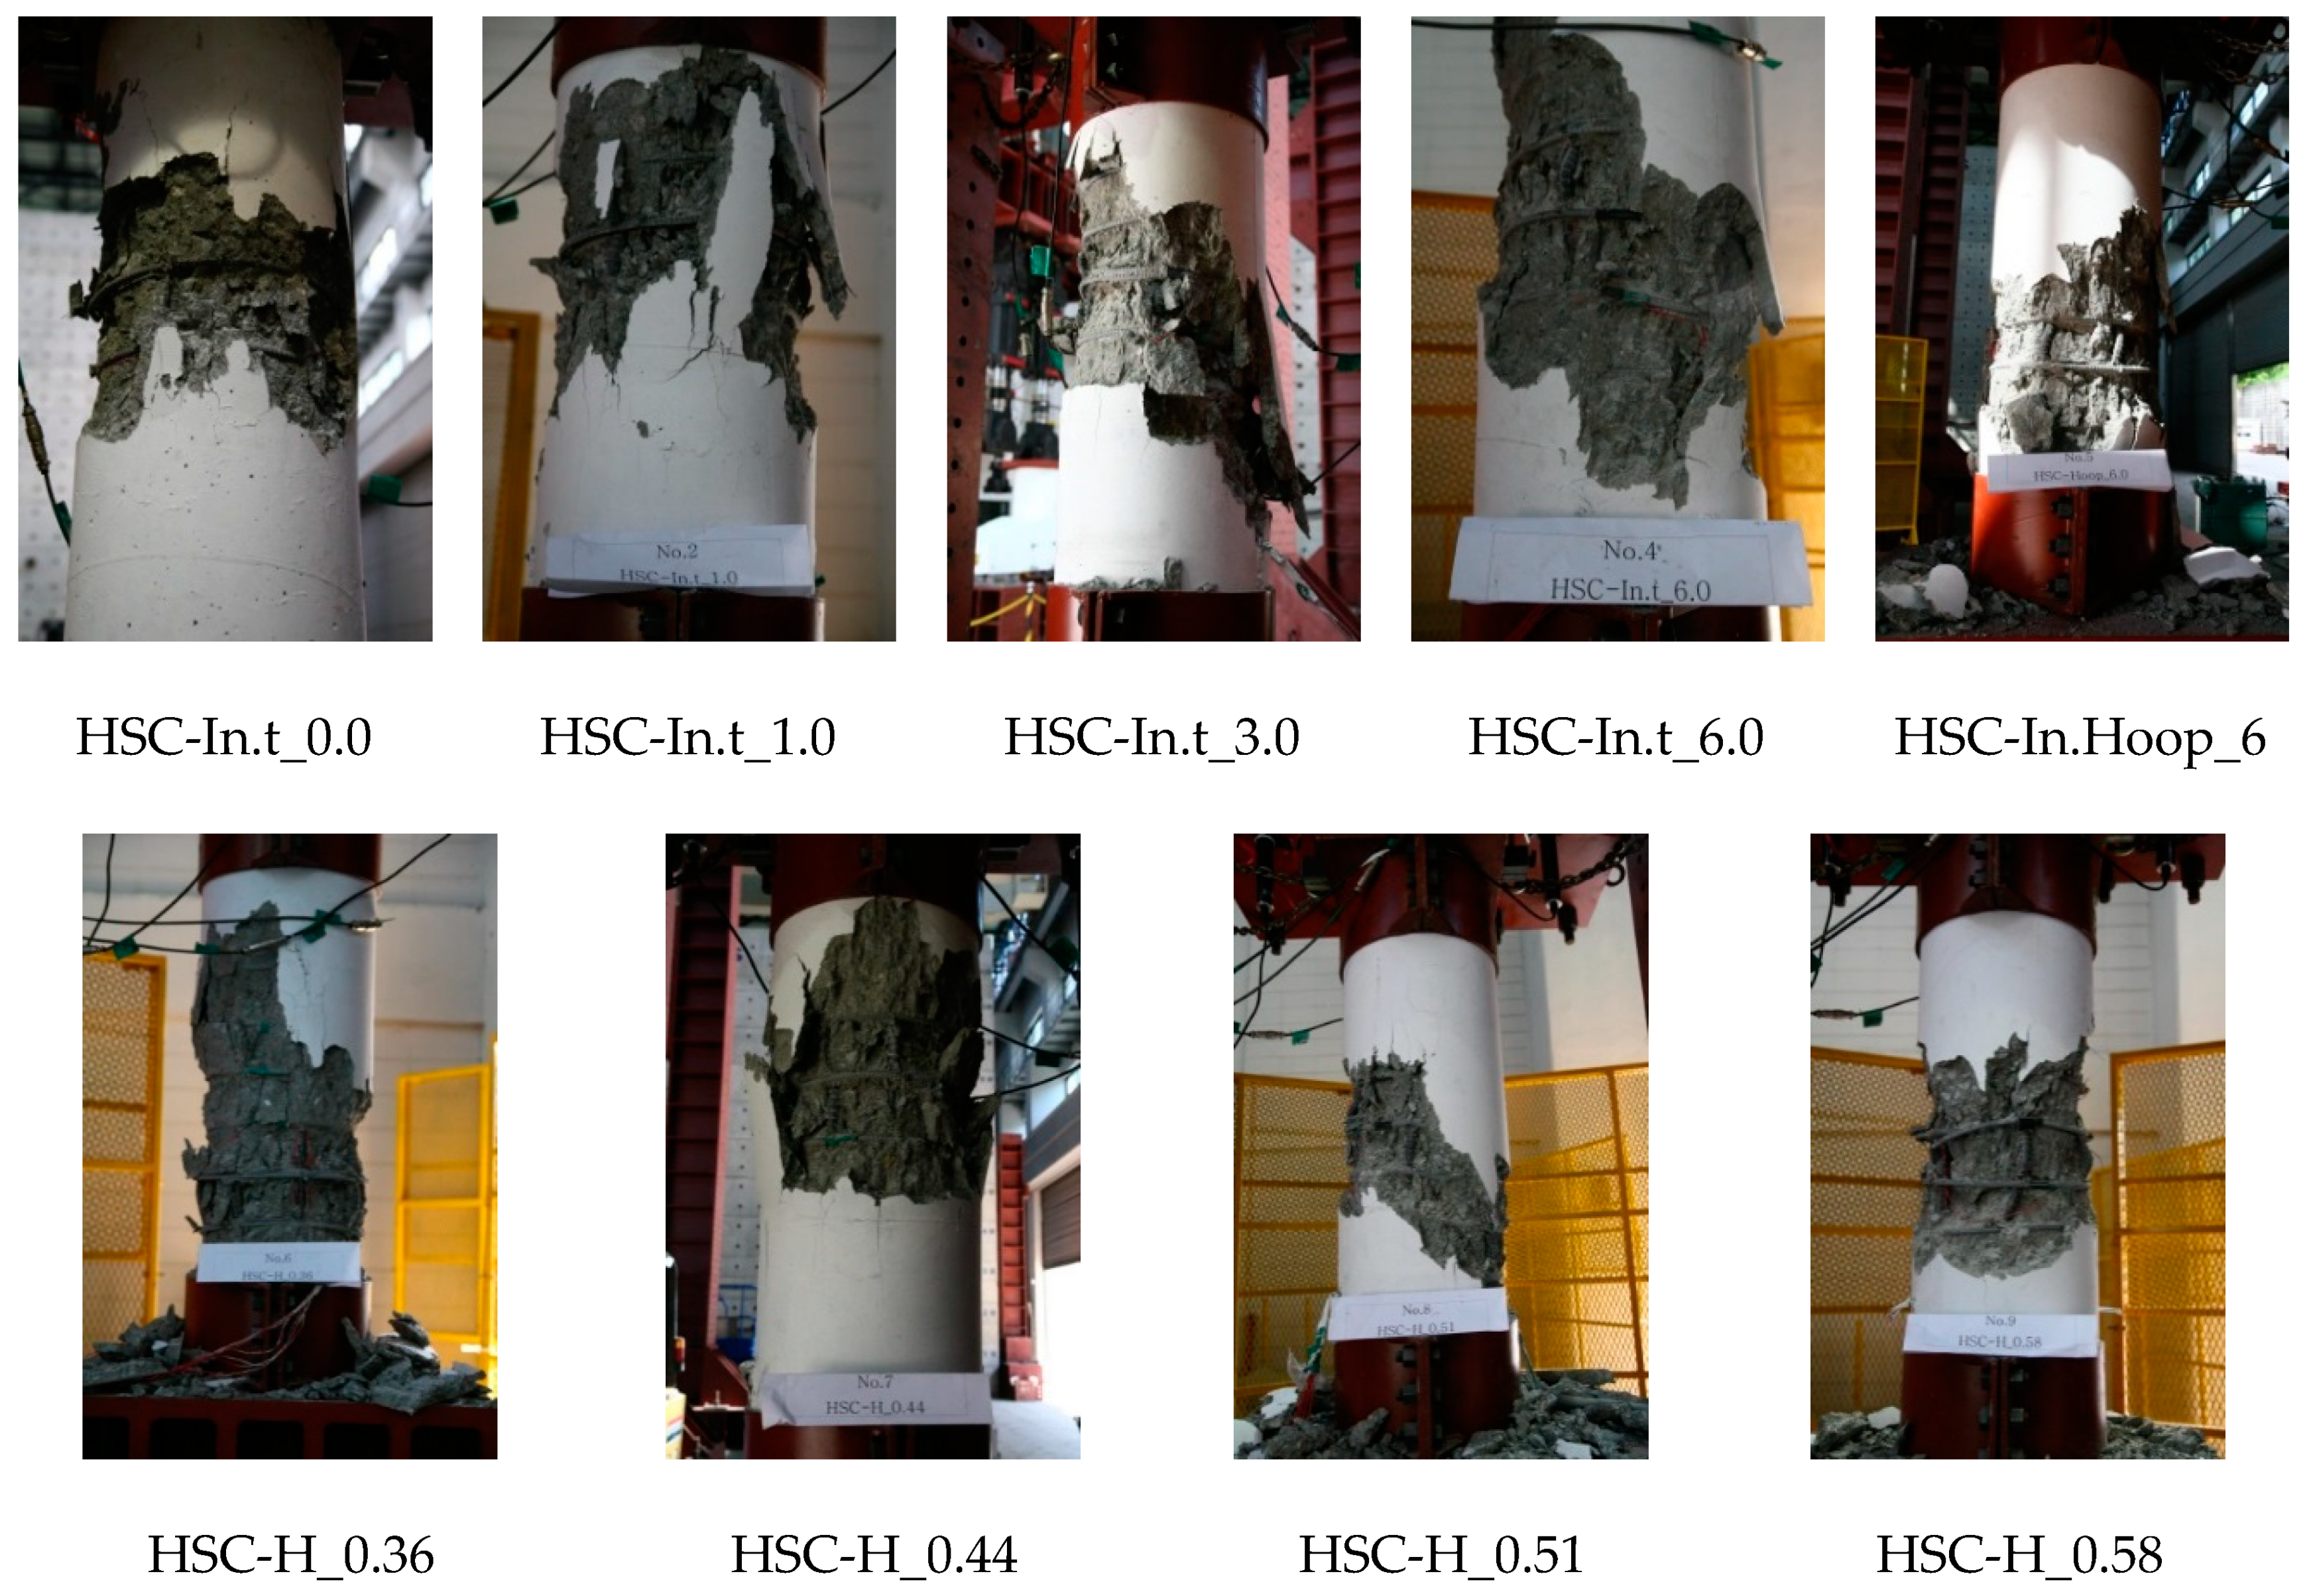
Figure 7 and Table 2 show the images of specimens after testing. These specimens had two trends depending on the splicing of the transverse reinforcements. When the transverse reinforcements experienced yield failure, the crack and failure pattern had a 45° angle in the axial direction. The longitudinal reinforcements and the steel inner tube became buckled. If the transverse reinforcement was loosened, the concrete in that part was intensively destroyed, as shown in Figure 7 (HSC-In.t_0.0, HSC-In.t_1.0, HSC-H_0.44, HSC-H_0.58, HSC-D_300, and NSC-In.t_0.0). The inclination of the shear sliding plane with the horizontal axis varied from 25° for low-confined specimens to 45° for highly confined specimens.
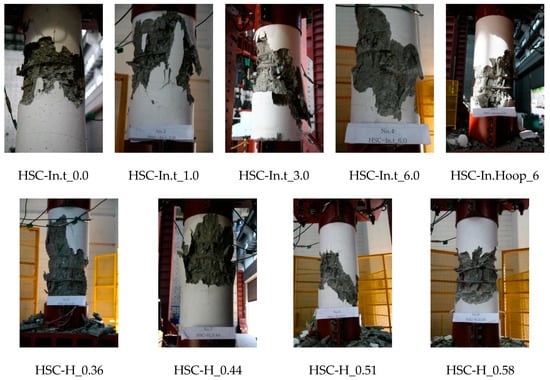
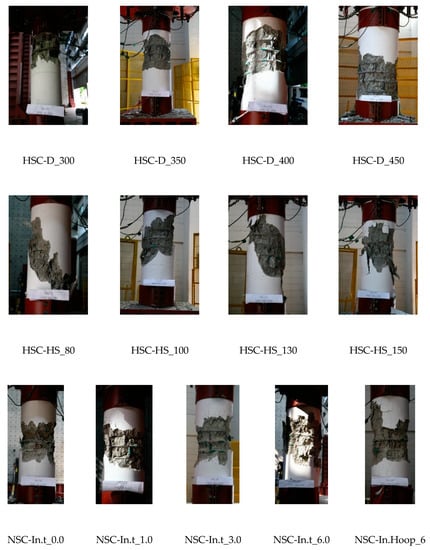
Figure 7.
Appearance of specimens after testing.
Table 2.
Qualitative analysis of experimental results.
3.2. Effect of Test Variables on Behavior of Column
In order to study the effect of each variable on the behavior of the composite column, the response curves of the column were compared with each of the following variables: concrete compressive strength, inner tube thickness, transverse reinforcement space, hollow ratio, and column diameter.
To investigate the confined concrete, the strength of the longitudinal reinforcement and inner tube was determined by conducting an analysis of the total axial load versus axial strain. The curves represent the axial load sustained by the concrete, which was normalized using the method proposed by Daniel and Patrick [1]. The non-confined strength of the total concrete cross-section can be defined as , where is the total cross-sectional area of the concrete. The non-confined strength of the concrete core section can be defined as , where is the concrete core area delineated by the centerline of the outside side of the transverse reinforcement. The strength of the steel tube and longitudinal reinforcements can be defined as , where is the the strength of the longitudinal reinforcement, is the strength of the inner steel tube, and is the strength of the column.
The relative ratio between the maximum strength of column and each component material was analyzed. This allowed us to investigate the confining effect of these specimens.
3.2.1. Concrete Compressive Strength and Inner Tube Thickness
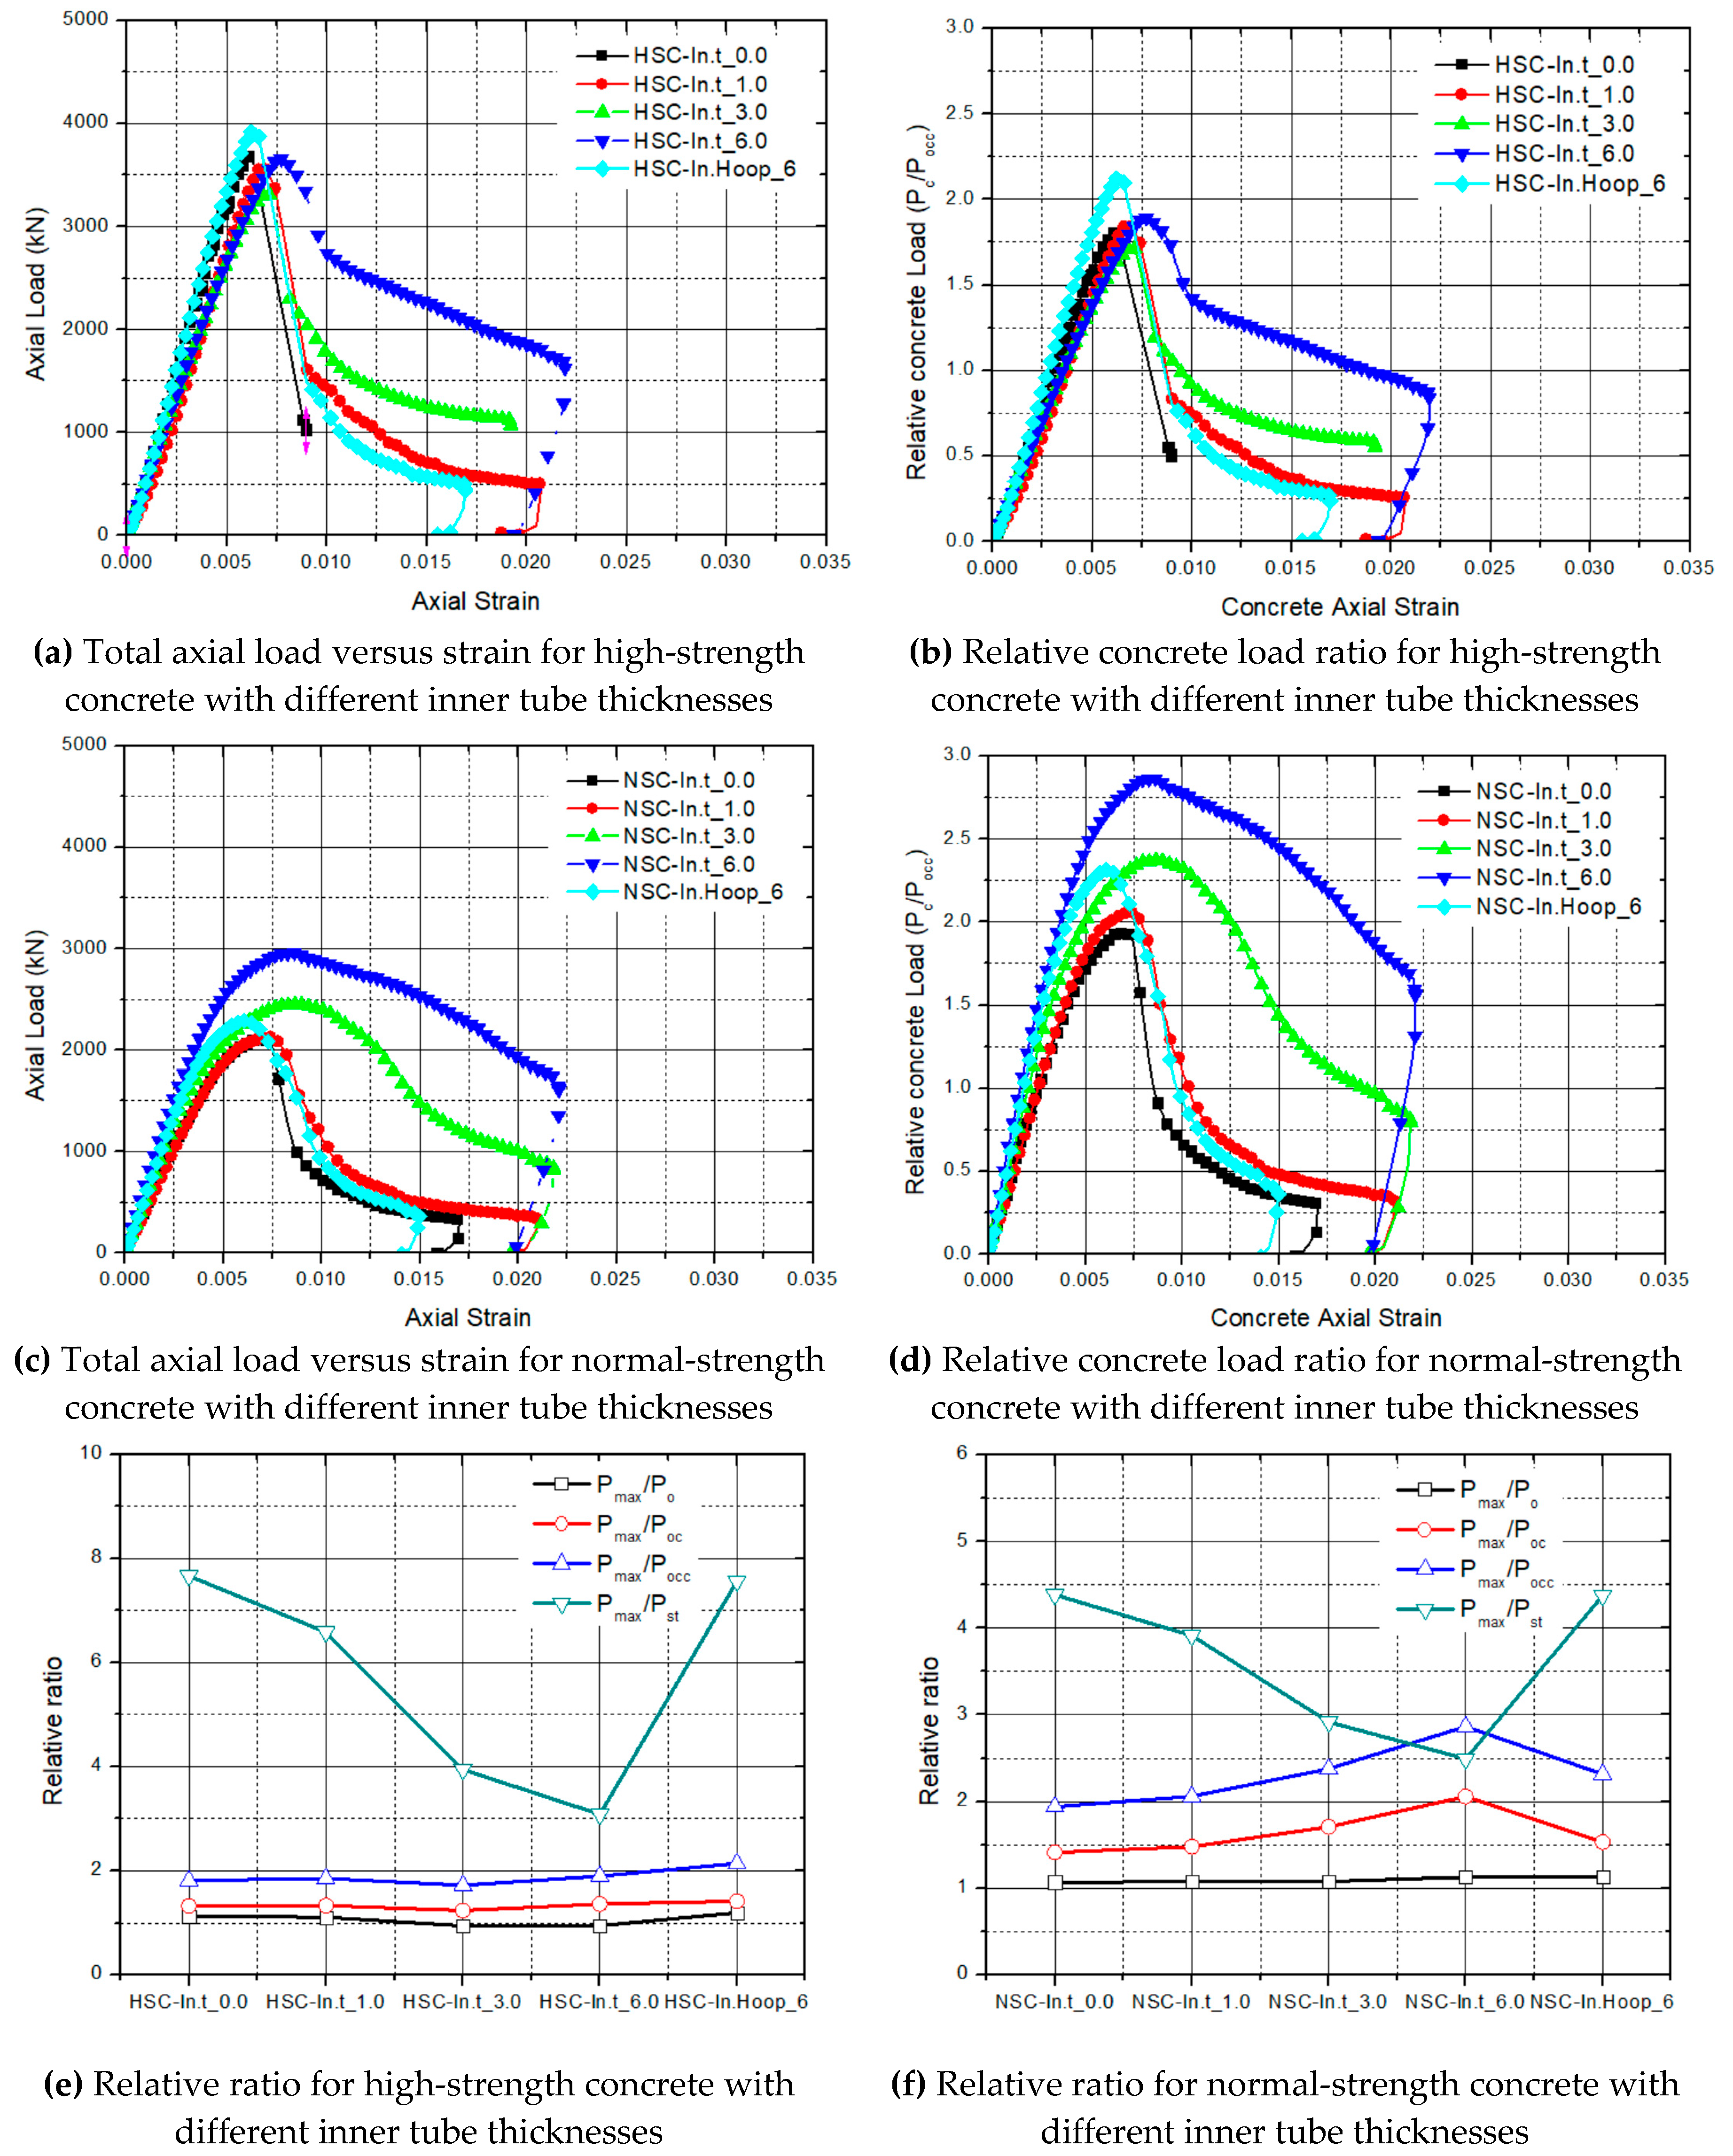
Figure 8 shows the stress–strain curves of the confined concrete according to concrete compressive strength. The relative ratio between the strength of the core concrete and maximum strength gains was found to be 1.7, 1.8, 1.6, and 2.2 in the high-strength specimens. Furthermore, the strength of the NSC specimen increased by 1.95, 2.1, 2.4, 2.7, and 2.3. The inner tube thickness affects the confining effect of the core concrete in the normal-strength concrete analysis model, which is shown in Figure 8f. On the other hand, the ratio of the HSC model does not stay at a similar value depending on the thickness of the inner tube, which is shown in Figure 8e. With an increase in the inner tube thickness, the relative ratio between the maximum strength of the column and the strength of the steel components was reduced. The HSC had less lateral expansion under axial compression than normal-strength concrete because of its higher elastic modulus and its lower chance of internal micro-cracking. As a result, the efficiency of the passive confinement of high-strength concrete decreased more as compared to normal-strength concrete. An increase in the thickness of the inner tube resulted in an enhancement in the confinement effect of the core concrete due to the inner tube confining the core concrete in tri-axial directions. Furthermore, the ductility of the column improved with an increase in the inner tube thickness.
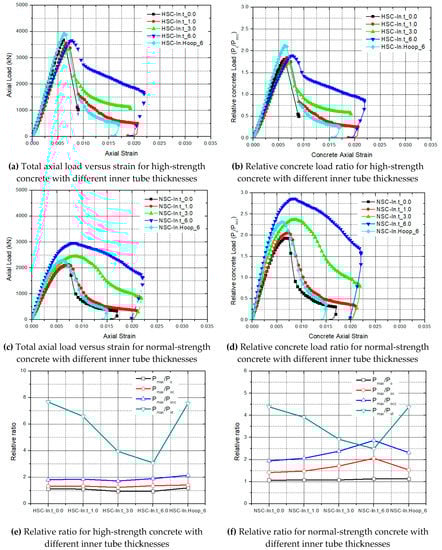
Figure 8.
Experimental stress–strain curves and effect of the inner tube thickness.
3.2.2. Hollow Ratio
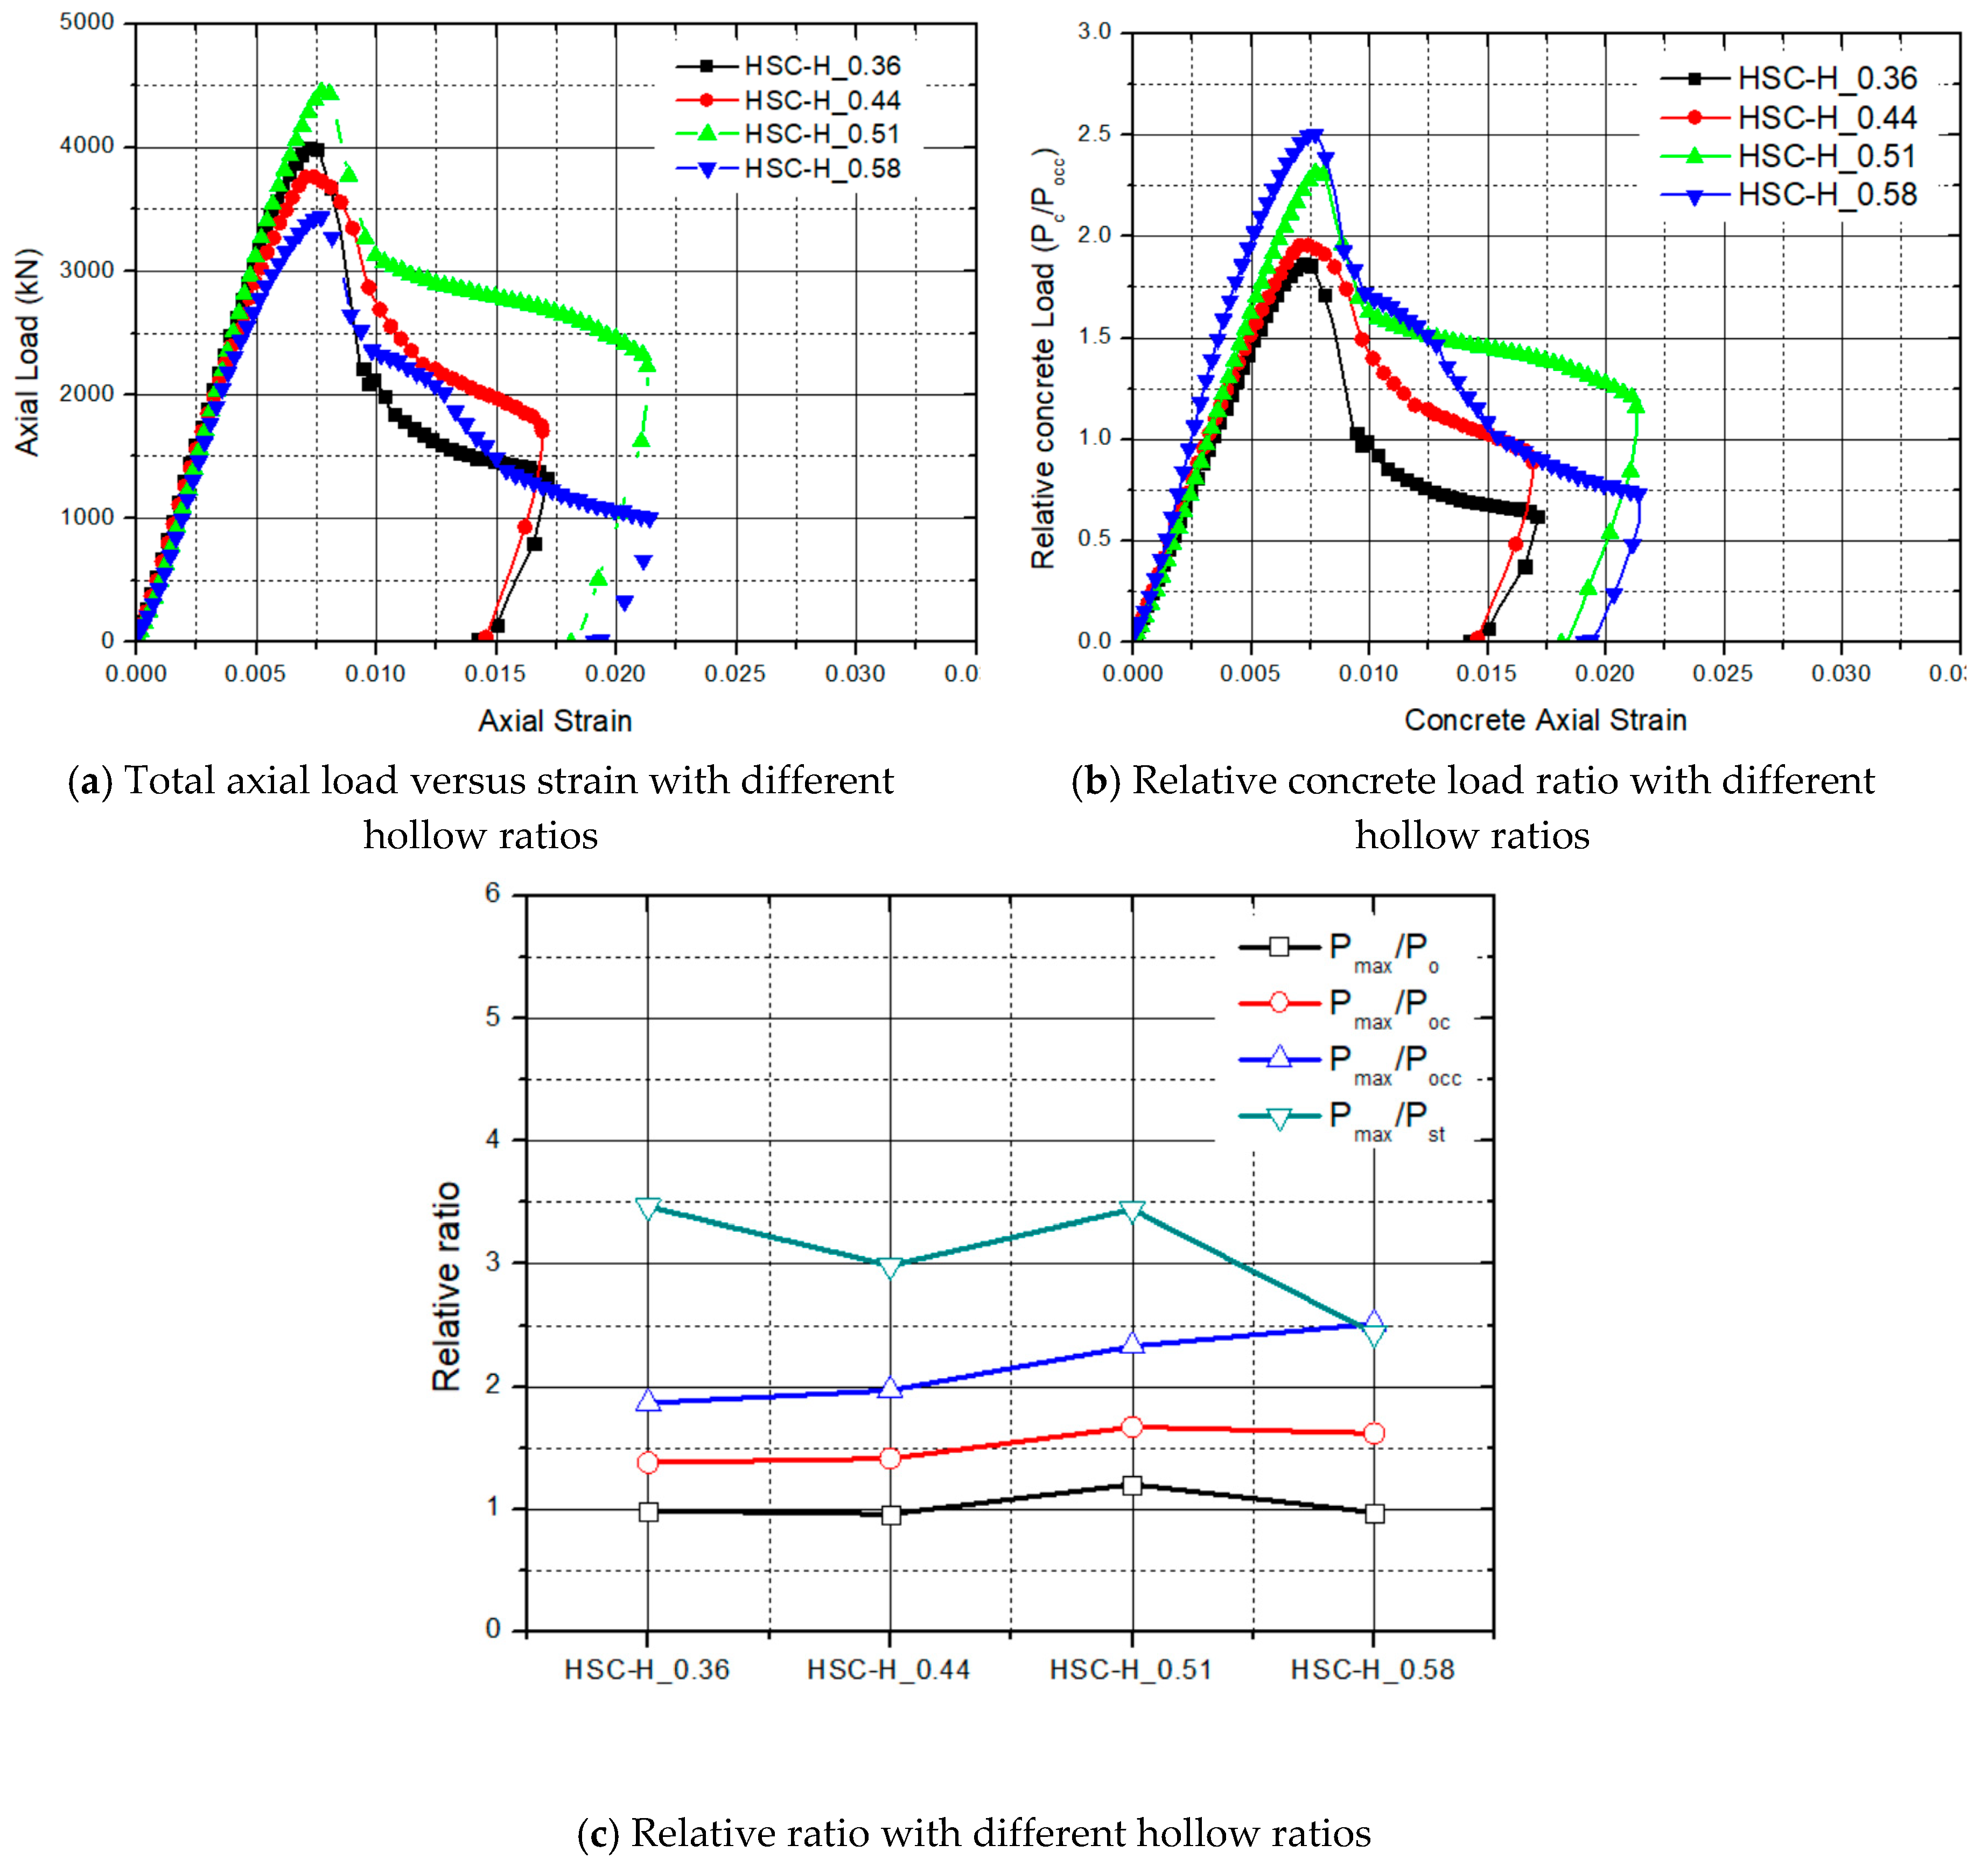
Figure 9 illustrates the experimental stress–strain curves and the effect of the hollow ratio. This ranged from 0.36 to 0.58. The ratio of was in the range of 0.9–1.2 with an average of 1.0. The strength of the confined core concrete increased to 1.8, 2.0, 2.26, and 2.5. The test results indicated that the relative concrete load ratio was enhanced with an increase in the hollow ratio, which is shown in Figure 9c.
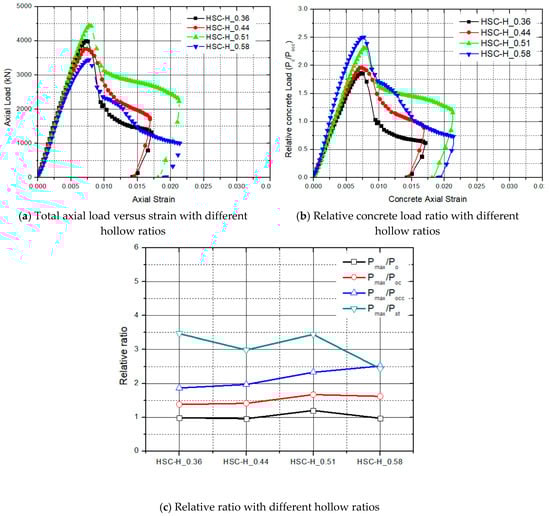
Figure 9.
Experimental stress–strain curves and effect of the hollow ratio.
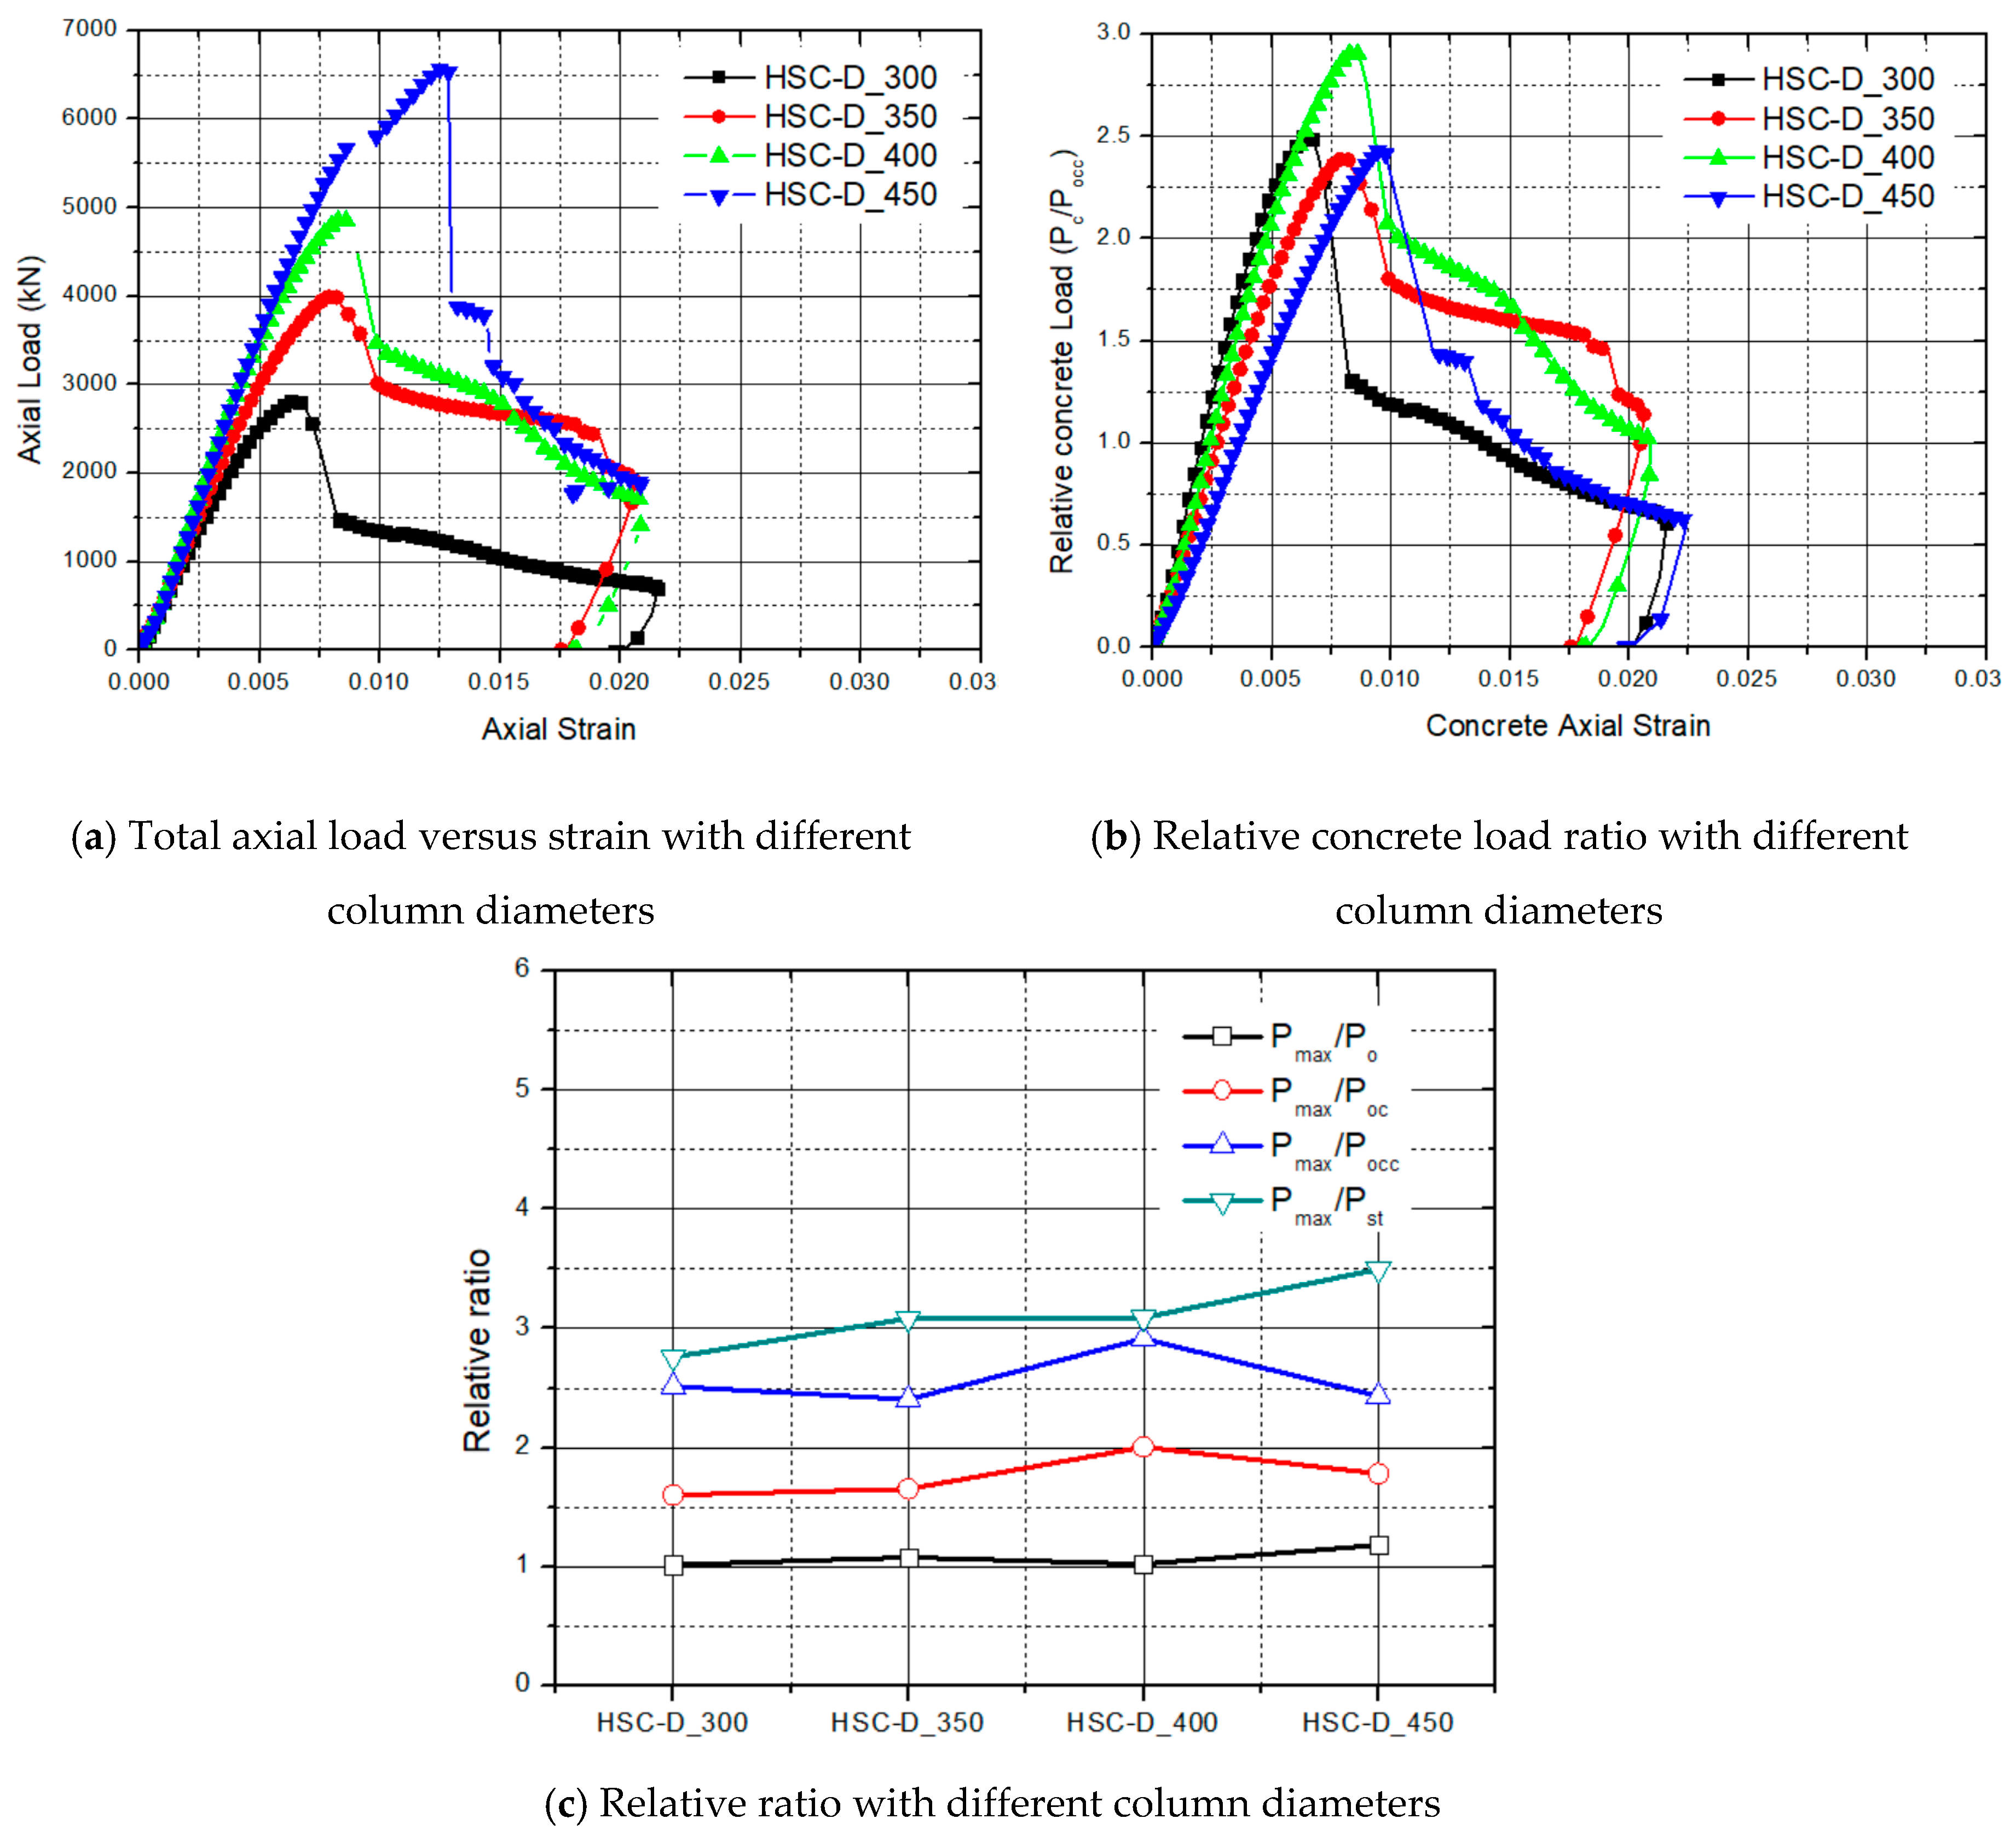
3.2.3. Diameter of Column
Figure 10 shows the experimental stress–strain curves and confined concrete effects when the column diameter changed from 300 mm to 450 mm. The total axial load was enhanced with an increase in the column diameter, as shown in Figure 10a. The effect of confined concrete increased from 2.5 to 3, as shown in Figure 10b,c. The ratio, strength of core concrete, and maximum strength of column changed, as shown in Figure 10c. The confining effect of the 400 mm diameter model was high only because it did not cause transverse reinforcements loosening. The specimens with column diameters of 300 mm, 350 mm, and 450 mm had poor confinement effects due to loose transverse reinforcement packing. The confinement effect from the change in diameter was estimated continuously.
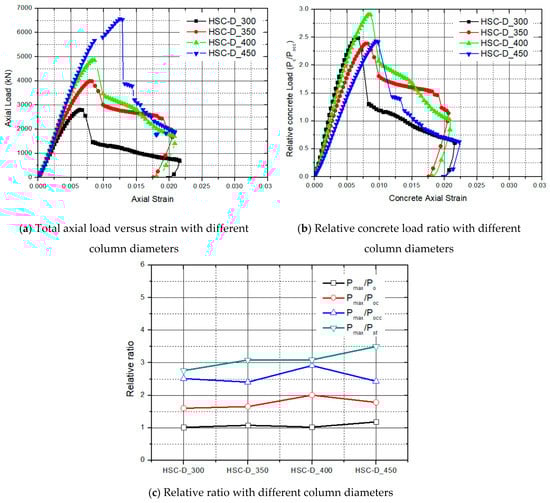
Figure 10.
Experimental stress–strain curves and effect of the column diameter.
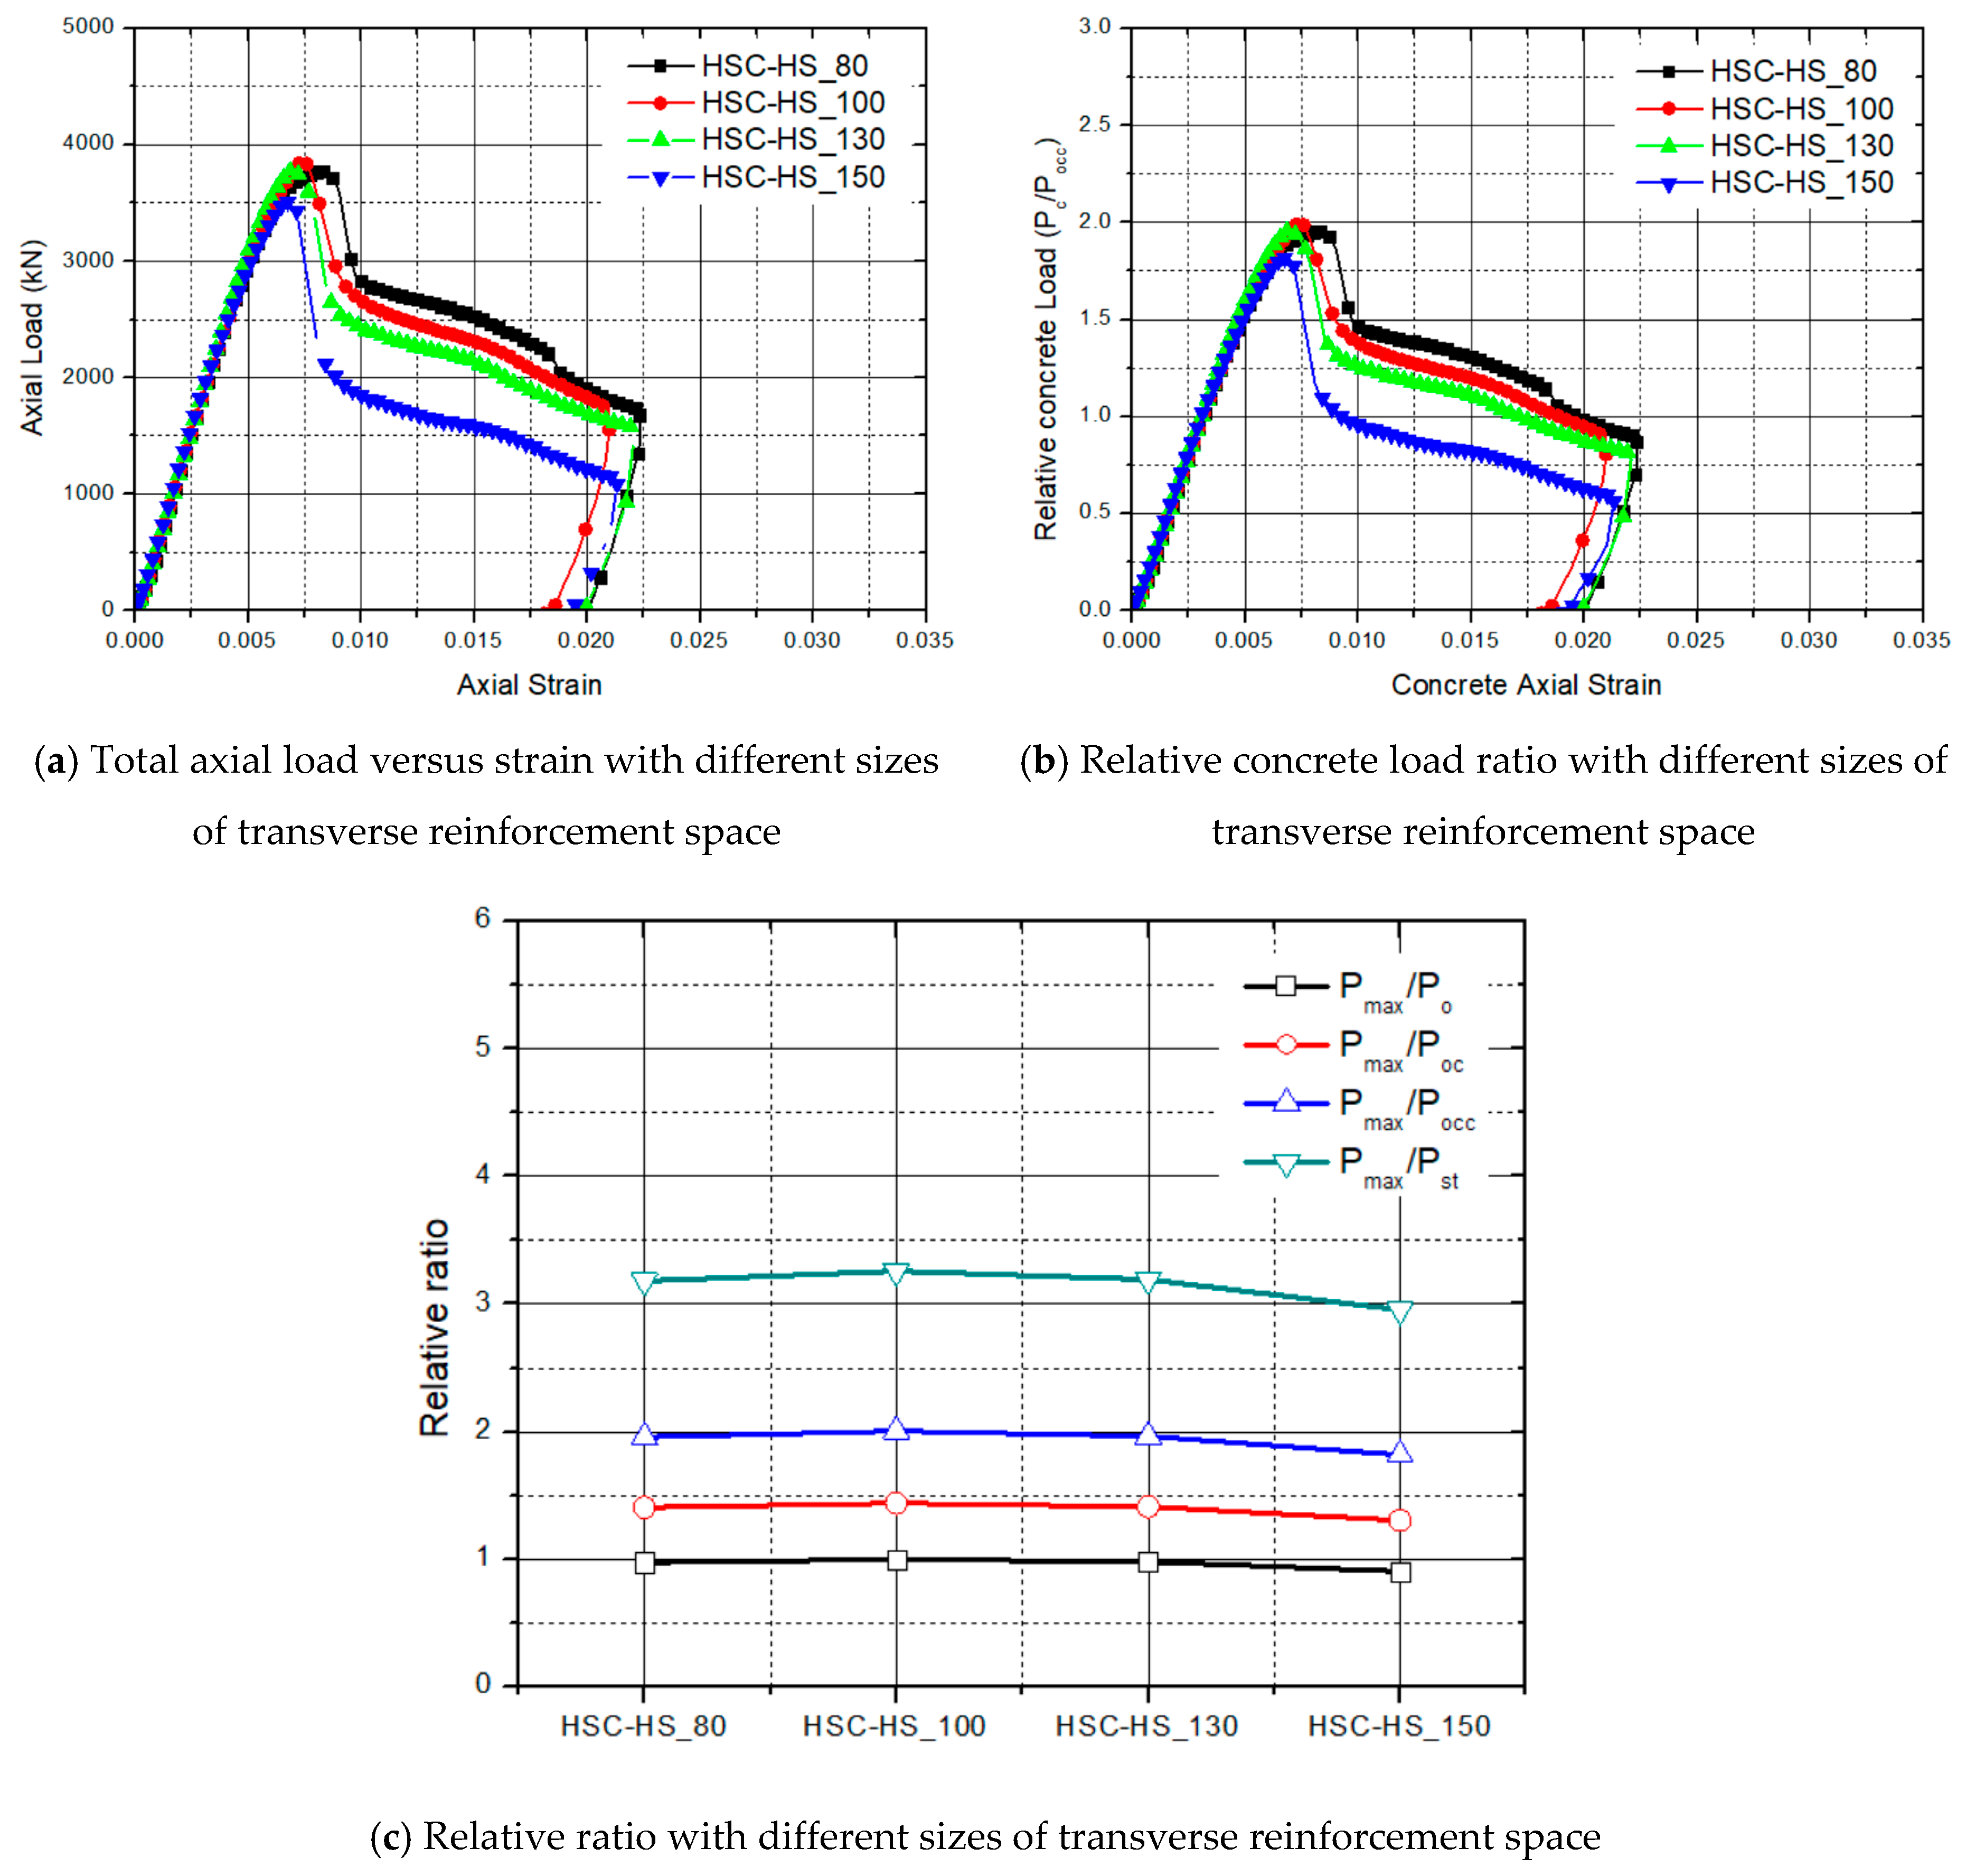
3.2.4. Transverse Reinforcement Space
In general, the lateral confining press imposed on the concrete core is directly related to the amount of lateral reinforcement applied. Thus, a large confining pressure applied to the concrete core will result in better confinement efficiency. To investigate this effect, an experimental study was performed with a different number of lateral reinforcements, as shown in Figure 11. The size of the transverse reinforcement space ranged from 80 to 150 mm. As a result, the confined effect of the core concrete from a different number of lateral reinforcements did not increase, as shown in Figure 11c in the HSC test model. The buckling of the longitudinal reinforcement and steel inner tube occurred due to the wide transverse reinforcement spaces. The number of transverse reinforcements, which needs to be economical, must be determined to increase the confining effect.
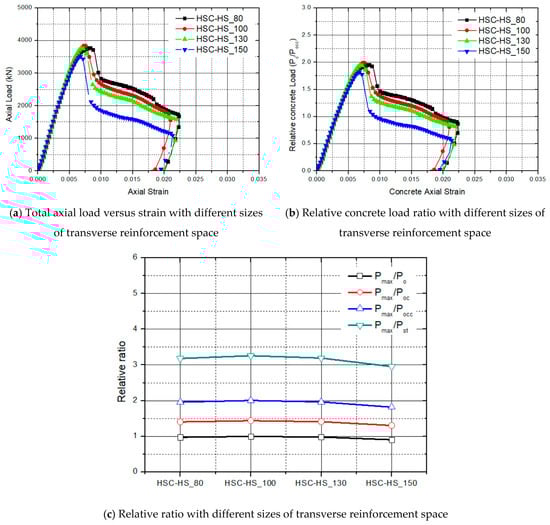
Figure 11.
Experimental stress–strain curves and effect of the transverse reinforcement space.
4. Summary and Conclusions
In this study, the compressive behavior of steel-composite hollow RC columns with HSC was studied experimentally. We concluded the following:
- The HSC column decreased rapidly after reaching its maximum strength. Its column models had different trends compared to those made of normal-strength concrete. Furthermore, this column had a bifurcation point. This phenomenon occurred due to the resistance after the buckling of the inner tube.
- Overall, the confining effect was negligible when high-strength concrete was applied to this column. In order to determine the confining effect of the normal-strength concrete column model, the lateral reinforcement is considered to be very important.
- This column was found to prevent rapid brittle fractures due to the inner tube. We hypothesized that the column would perform better when the buckling strength of the inner tube was increased.
Author Contributions
D.W. conducted experiments and investigations. S.K. analyzed the experimental results. J.S. conducted data analysis. Y.-J.K. was corresponding author and summarized and analyzed the paper.
Funding
This study was funded by Korea National Research Foundation (grant number 2018R1D1A1B07050335).
Conflicts of Interest
The authors declare that they have no conflict of interest.
References
- Cusson, D.; Paultre, P. High-Strength concrete columns confined by rectangular ties. J. Str. Eng. 1994, 120, 783–804. [Google Scholar] [CrossRef]
- Miarka, P.; Seitl, S.; Bílek, V. Comparison of Fracture Resistance of the Normal and High Strength Concrete Evaluated by Brazilian Disc Test. Proceedings 2018, 2, 399. [Google Scholar] [CrossRef]
- Dong, H.; Cao, W.; Bian, J.; Zhang, J. The fire resistance performance of recycled aggregate concrete columns with different concrete compressive strengths. Materials 2014, 7, 7843–7860. [Google Scholar] [CrossRef] [PubMed]
- Han, T.H.; Lim, N.H.; Han, S.Y.; Park, J.S.; Kang, Y.J. Nonlinear concrete model for an internally confined hollow reinforced concrete column. Mag. Concr. Res. 2008, 60, 429–440. [Google Scholar] [CrossRef]
- Won, D.H.; Han, T.H.; Kim, J.S.; Kang, Y.J. Optimum confining effect in steel-composite hollow RC column with inner tube under compressive load. Mag. Concr. Res. 2014, 66, 433–446. [Google Scholar] [CrossRef]
- Han, T.H.; Stallings, J.M.; Cho, S.K.; Kang, Y.J. Behaviour of a hollow RC column with an internal tube. Mag. Concr. Res. 2010, 62, 25–38. [Google Scholar] [CrossRef]
- Han, T.H.; Yoon, K.Y.; Kang, Y.J. Compressive strength of circular hollow reinforced concrete confined by an internal steel tube. Constr. Build. Mater. 2010, 24, 1690–1699. [Google Scholar] [CrossRef]
- Mander, J.B.; Priestly, M.J.N.; Park, R. Seismic Design of Bridge Piers; Research Report No. 84-2; University of Canterbury: Christchurch, New Zealand, 1984. [Google Scholar]


© 2019 by the authors. Licensee MDPI, Basel, Switzerland. This article is an open access article distributed under the terms and conditions of the Creative Commons Attribution (CC BY) license (http://creativecommons.org/licenses/by/4.0/).