Article

Impacts of Urban Green Landscape Patterns on Land Surface Temperature: Evidence from the Adjacent Area of Olympic Forest Park of Beijing, China

1
School of Architecture and Design, Southwest Jiaotong University, Chengdu 610031, China
2
Institute of Geographical Sciences and Natural Resources Research, Chinese Academy of Science, Beijing 100101, China
3
College of Resources and Environment, University of Chinese Academy of Sciences, Beijing 100049, China
*
Author to whom correspondence should be addressed.
Sustainability 2019, 11(2), 513; https://doi.org/10.3390/su11020513
Submission received: 6 December 2018 / Revised: 10 January 2019 / Accepted: 12 January 2019 / Published: 18 January 2019

Abstract

:
Urban green space has been considered as an ecological measure to mitigate urban heat islands (UHI). However, few studies investigate the cooling effect of the adjacent area of the urban park; as the transition region from a green space to a hardened surface where more complex heat exchange occurs, it deserves to be paid more attention. This paper examines the relationship between the urban greening patterns and the cooling effect in the surrounding areas of the Olympic Forest Park in Beijing. Results showed that the forestland and waterbodies could cool 6.51% and 12.82% of the impervious surface temperatures, respectively. For every 10% increase in the green space ratio, the land surface temperature drops by 0.4 °C, and per kilometer increase in the distance from the forest park, the land surface temperature increases by 0.15 °C. The aggregation index (AI) and largest patch index (LPI) of the green space patterns presented a strong negative correlation with surface temperature. This study confirms the cooling effects in the adjacent area of the urban park and highlights their dependence on urban greening patterns. Therefore, we should not only develop more green spaces but also scientifically plan their spatial configuration in the limited urban land for the improvement of the cooling effect.

1. Introduction

Urban climate change and rapid urbanization worldwide are two challenges and fundamental considerations in 21st-century urban planning [1]. Urban heat island (UHI) is an event resulting from rapid urbanization [2] which is described as urban areas with significantly warmer temperatures than its surrounding rural areas. The UHI is caused by replacing vegetated surfaces with hard surfaces in the process of urbanization [3]. The negative consequences of UHI have been suggested to increment the rate of heart stroke, hyperthermia, and mortality [4]; to elevate energy consumption and air pollution and reduce human comfort [5], to change species composition and distribution [6], and to increase ground level ozone concentrations which have negative impacts on human health [7]. Consequently, finding effective measures to alleviate and mitigate the UHI has become a major research area in urban planning and urban ecology [8,9,10,11].
Fortunately, urban green spaces which provide various ecosystem services, such as runoff reduction [12], air and water purification [13], and noise reduction [14], also has been considered as an ecological element to mitigate UHI through the process of the cooling effect [15]. The cooling effect of urban green spaces has been linked to two key processes of evapotranspiration and shading [5,16]. The significance of the cooling effect of urban green spaces on urban heat is widely documented [5,8,17]. Increasing the ratio of green space coverage in urban areas can efficiently reduce the ambient air temperature and the land surface temperature (LST) [5,9,18,19]. The cooling effect provided by different land cover types, such as trees, grass, and waterbodies, has been studied in cities with different climate conditions. It is found that the cooling effect of waterbodies and trees is more pronounced than that of grass [8,9,20]. In addition, the size of the green patch is another important factor to determine the cooling effect [21]. However, previous studies have mainly focused on the cooling effect of greeneries inside parks; few reports are available on the extension of the cooling effect in the surrounding area of green patches, and it has come out with unsimilar conclusions. For example, Hamada and Ohta (2010) suggested that the cooling effect of the urban park is to extend for several hundred meters [22]; however, according to Honjo et al. (1990) the cooling effect of an urban park can be extended in the surrounding area with a distance similar to the length of the park [23]. Also, the level of the cooling effect and the length of area which is influenced by the green space depends on the size of the green space [10,16].
In addition, the surface temperature can be influenced by the spatial configuration of the urban green space [11,24,25]. Since cities have limited land and natural resources such as water for greening, urban planners and other decision makers would benefit from the knowledge of optimizing the composition and configuration pattern of green spaces to more efficiently mitigate urban heat stress [11,17,26]. However, there is a lack of enough and consistent knowledge on the effect of spatial configuration of urban green space on alleviating temperature. In some cases, researches indicated contradictory results. For instance, the largest patch index (LPI) as an important landscape metric was negatively correlated with LST in Baltimore, USA [19]; Berlin, Germany [27]; and Shanghai, China [28] while it was positively associated with LST in Beijing, China [25]. This inconsistency limits the application of findings to urban green space planning and management. Although this inconsistency is poorly understood, few studies suggested it is because of the different climate contexts of the previous study areas or the application of various research methodologies [11]. Therefore, more research is crucial in order to efficiently design and plan urban green spaces.
Generally, an abundance of previous studies focused on the relationship between the cooling effects and the green spaces inside a park, and few studies investigated the cooling effect of the adjacent areas of the urban park. As the transition region from a green surface to a hardened surface, where more complex heat exchange occurs, it deserves to be paid more attention to the cooling effect of the green space in the surrounding area. The objective of this paper is to identify the cooling effect of the urban park in its surrounding area and to contribute to the creation and scientific planning and management of urban green spaces.

2. Materials and Methods

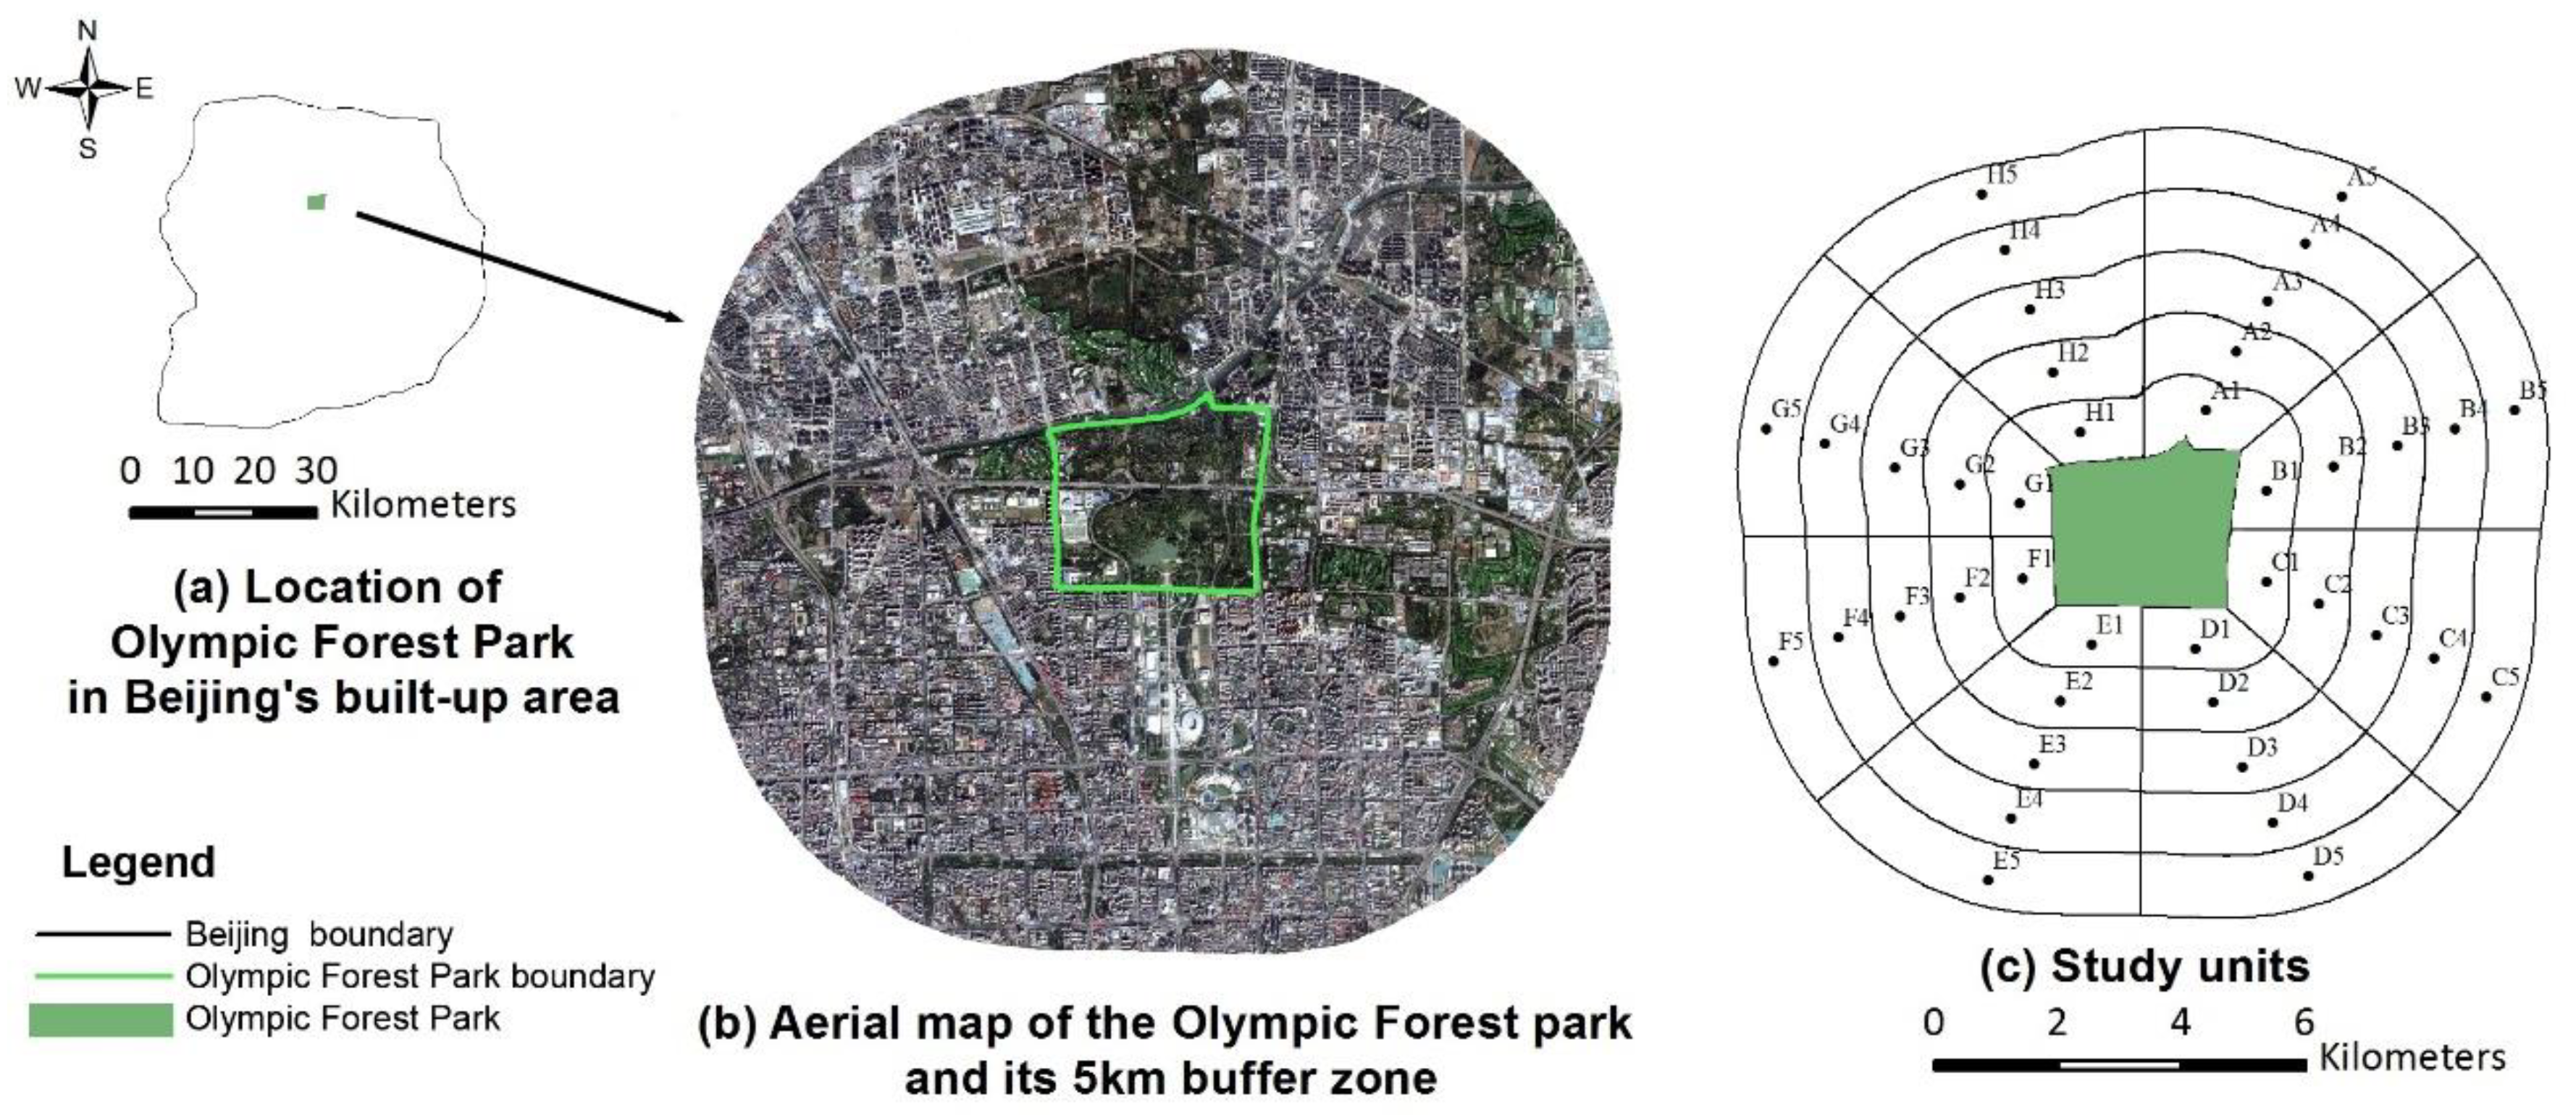
2.1. Case Study Area

The city Beijing is the capital of China and the world’s third most populated city [29]. The city has a monsoon-influenced humid continental climate with an annual average temperature of 12.6 °C (27 °C in July and −4 °C in January). The city has been a witness to the UHI phenomena since the past fifty years, and the current average summertime UHI reaches 4.5 °C [5].
The Olympic Forest Park, with the area of 1000 hectare, has been constructed for the 2008 World Olympic Games in the north of Beijing’s urban area and has become a recreation and tourism hotspot. It is covered with deciduous and evergreen trees, grasses, shrubs and a man-made dragon-shape lake. The buffer zone of the park mainly includes green and grey spaces, where grey spaces refer to buildings, roads, etc. This research focuses on the Olympic Forest Park of Beijing (39.98° to 40.00° N, 116.38° to 116.40° E) and its 5 km buffer zone. The diameter of the buffer zone was determined to be slightly bigger than the biggest diameter of the park, since one of our objectives was to study the extension of the cooling effect of the park into the surrounding area, and according to Honjo et al. (1990), the cooling effect of an urban park can be extended with a distance similar to the length of the park [23].
For a detailed study on the gradient changes of the green space and its surface temperature, the 5 km buffer zone of the Olympic Forest Park was divided into 48 sections. Firstly, it was divided to five rings in increments of 1 km, which the first ring had a 1 km distance from the edge of the park, and then each ring was divided into 8 sections according to the direction (Figure 1c). Finally, LST, land covers type, and landscape metrics of each section as well as the entire study area were studied.

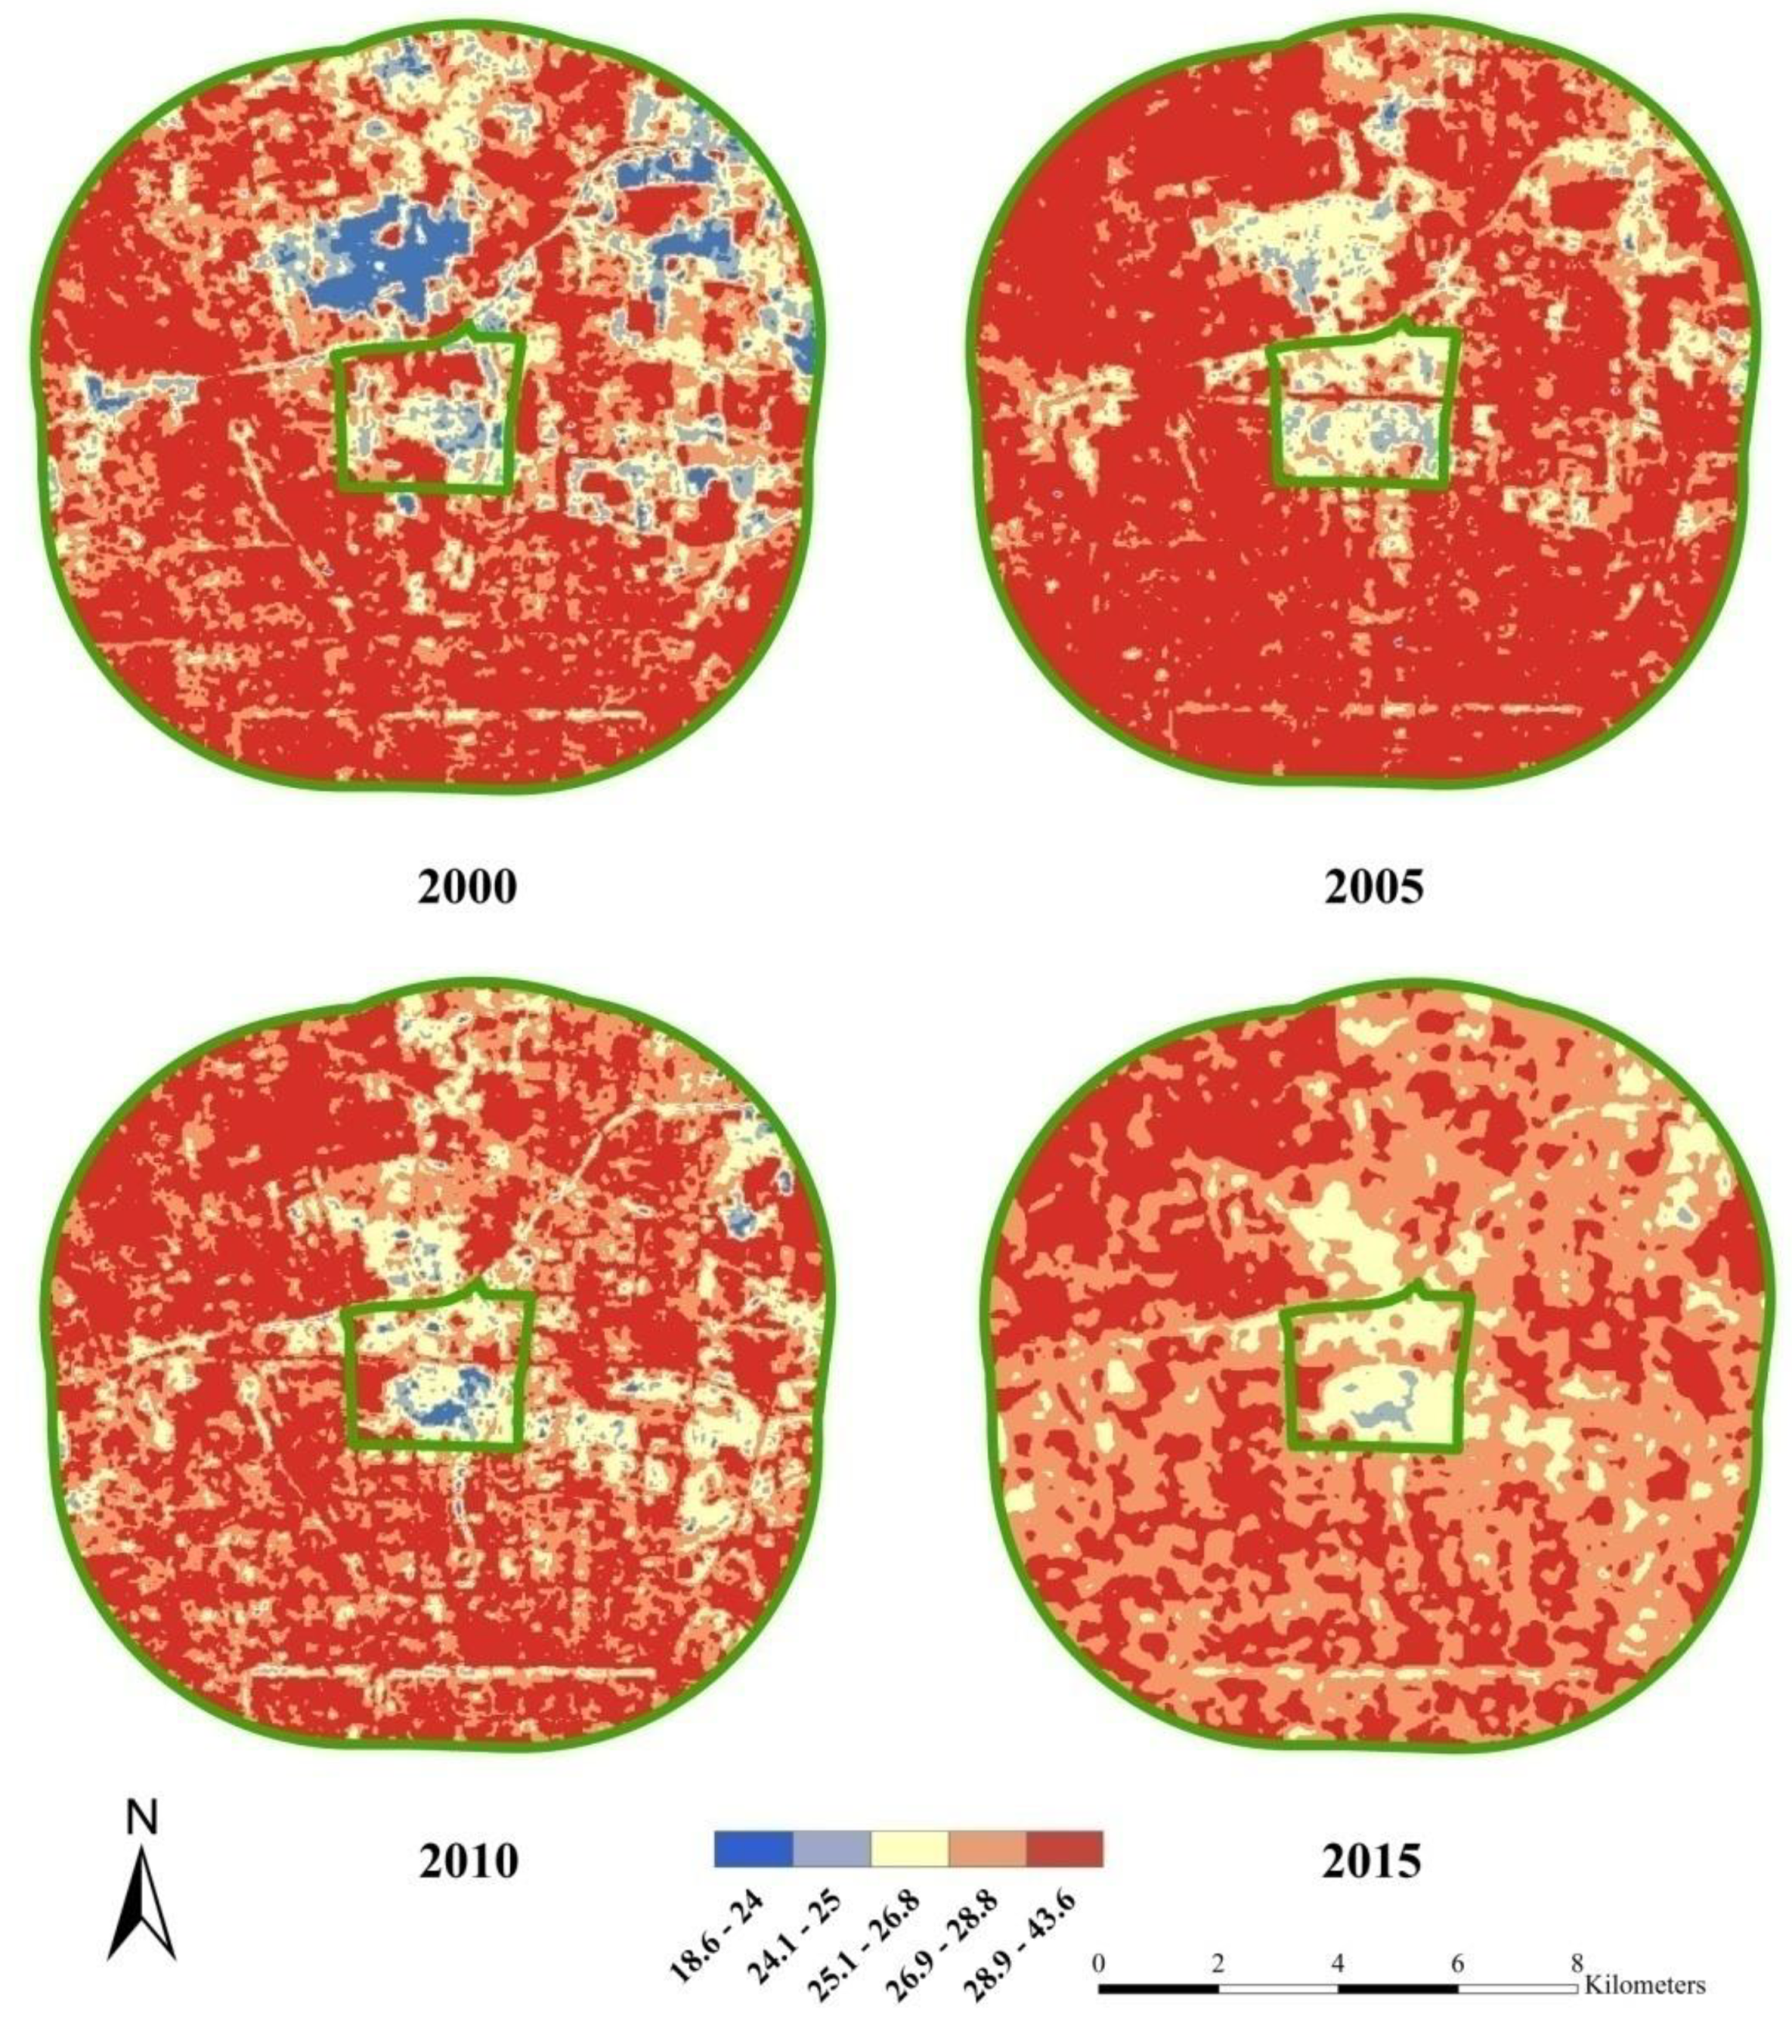
2.2. Land Surface Temperature

Land surface temperature Indicates heat energy emitted by the buildings, land, and other surfaces. Instruments mounted on satellites and airplanes can measure temperatures of surfaces and show temperature differences at small scales (i.e., roads, pavements, roofs, and grassy areas). However, remote sensing data have their limitations, so we combined this data for LST and data taken from weather stations for air temperatures to present the most complete picture of the UHI in the study area.
The land surface temperature data of the study area from 2000 to 2014 were derived from the thermal infrared bands (TIR) of Landsat 7 (ETM+) and Landsat 8 TM with a spatial resolution of 30m (resampled from 120m). Landsat 7 (ETM+) images were acquired on August 20, 2000 and August 18, 2005. Lands at 8 TM images were acquired on August 16, 2010, and August 19, 2014 (row32/path123) (Figure 2).
Firstly, the Top-of-Atmospheric Radiances (TOA) were calculated from the digital number (DN) of the TIR bands [30], and then surface radiance was extracted from the TOA by removing the atmospheric effect in the thermal zone [31]. Finally, the LST was estimated from the surface radiance using the Plank function [32].

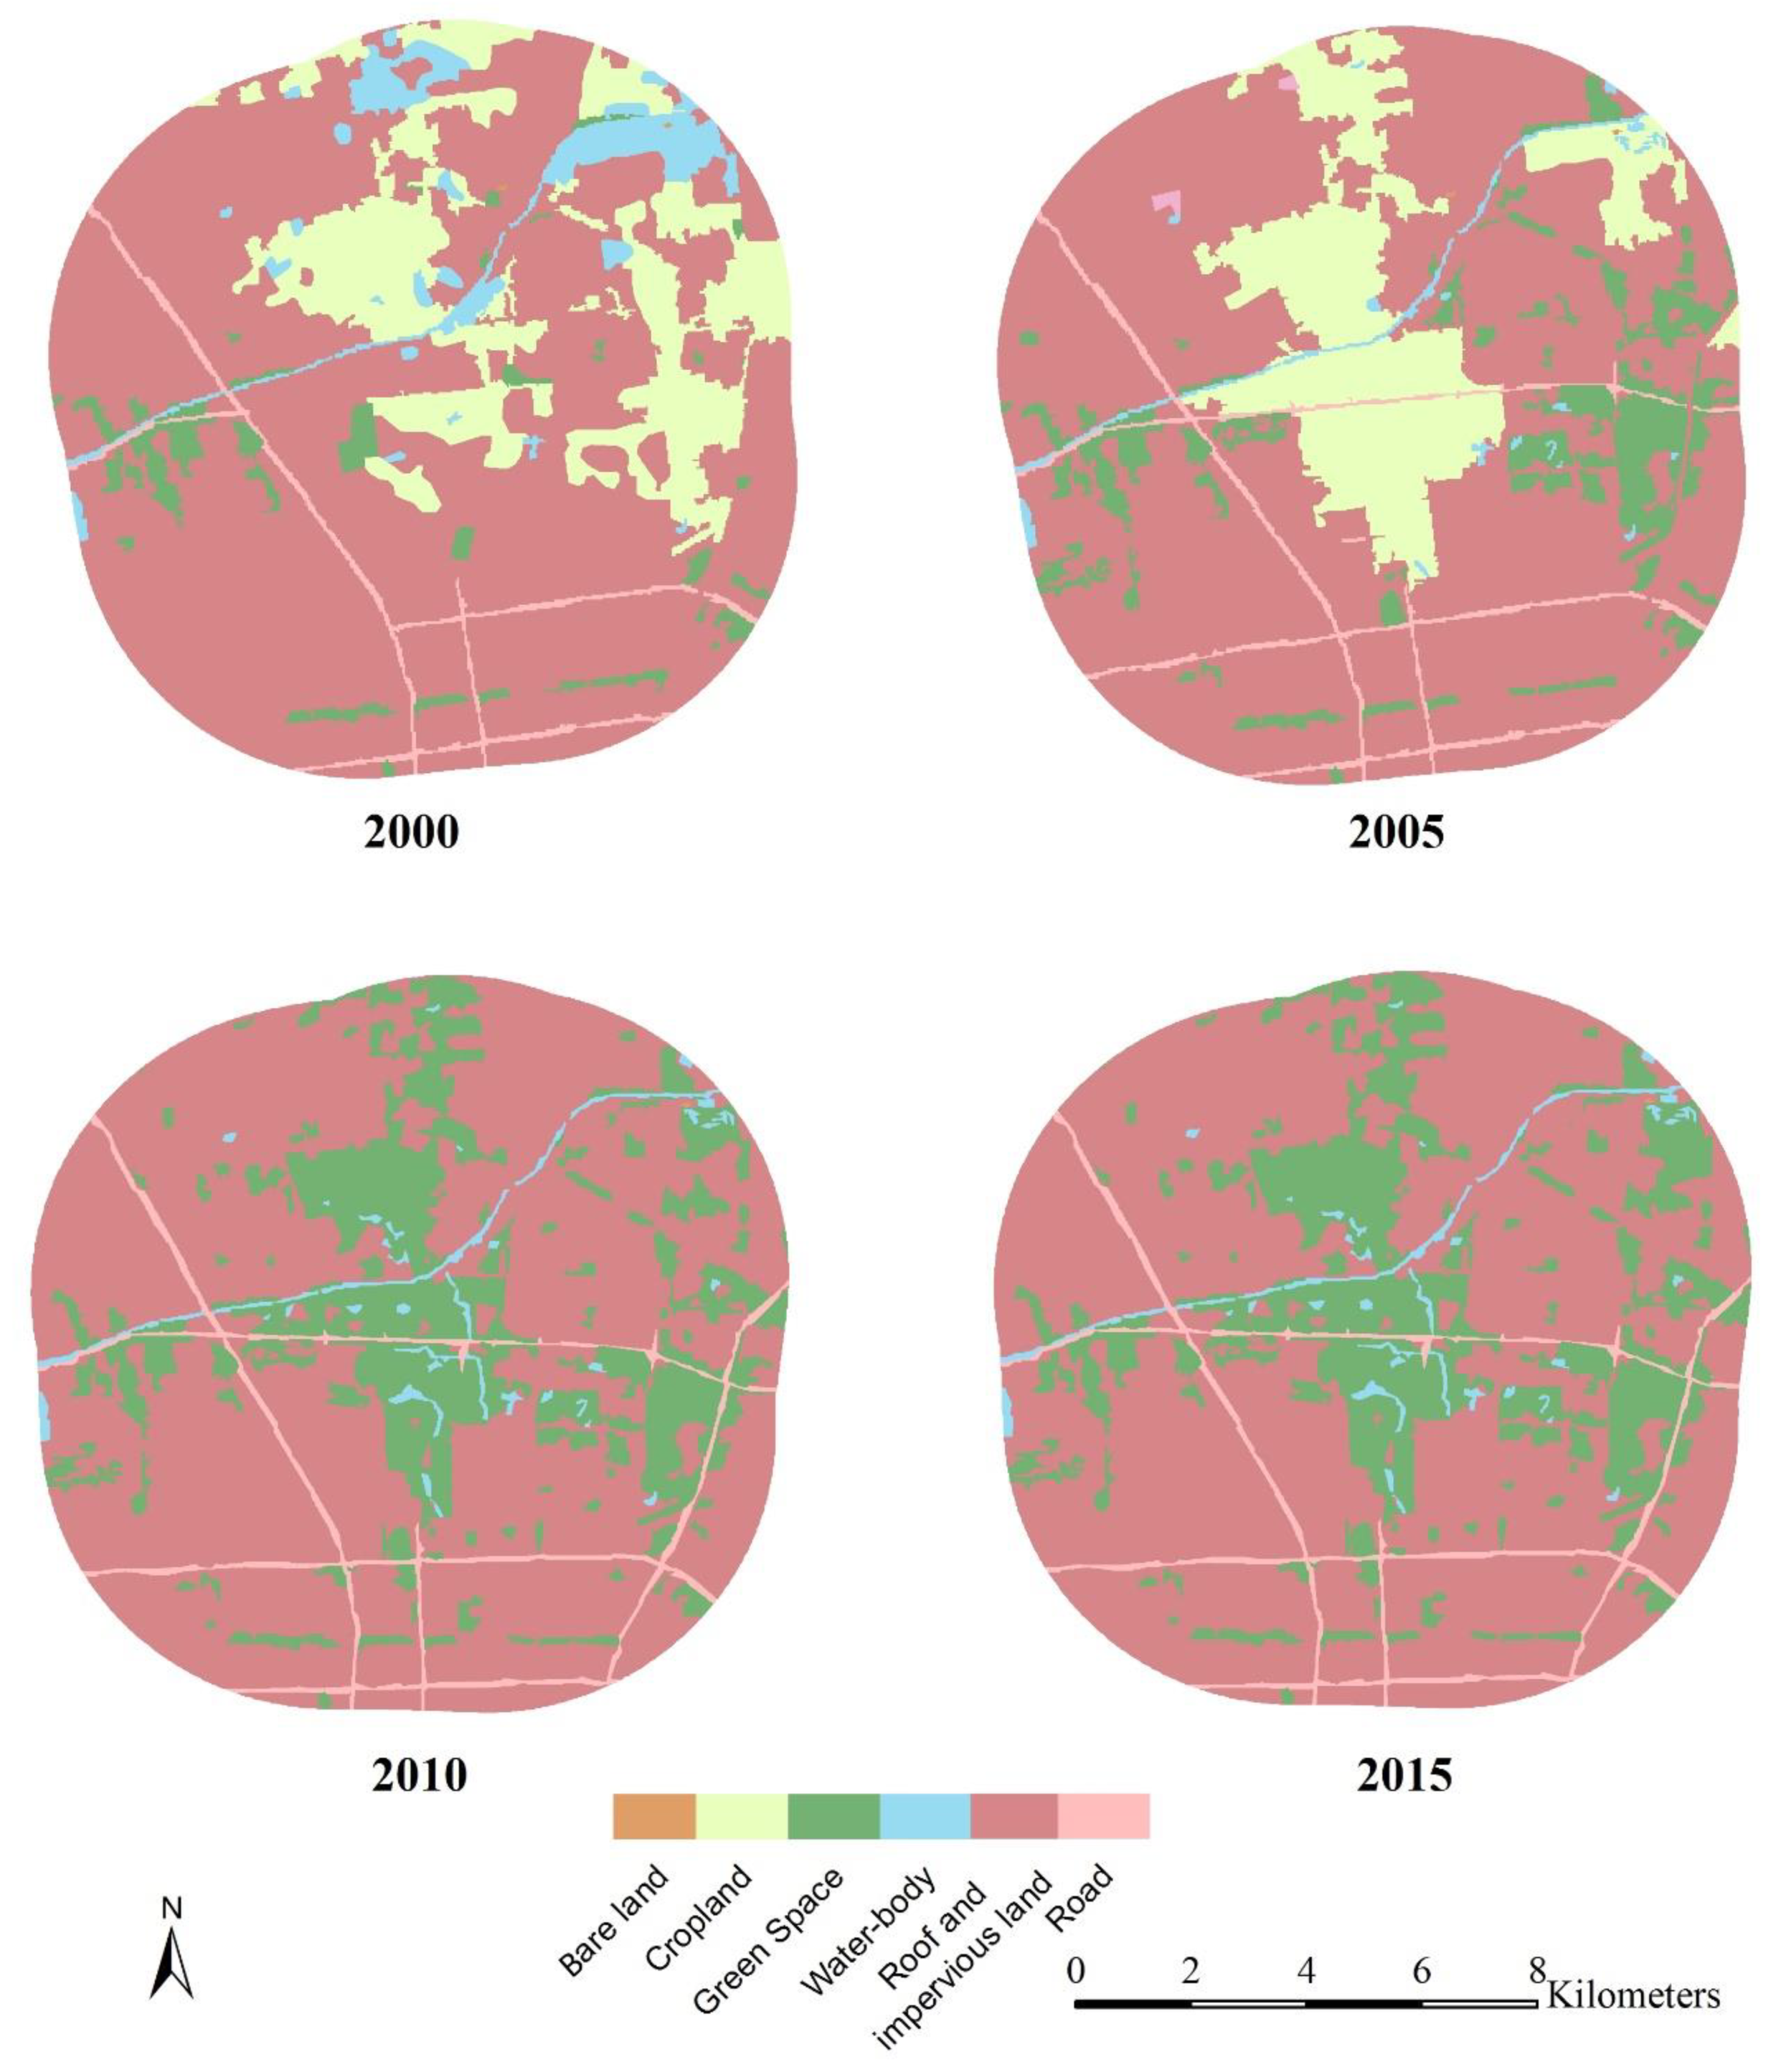
2.3. Land Cover Patterns

The land cover of the study area was classified based on the supervised classification of the remote sensing data, the natural attribute of the land cover, and the classification system of the green space investigation data in the study area. The remote sensing data include the high-resolution images of the study area in 2000 (SPOT4, panchromatic 10m), 2005, 2010, and 2015 (SPOT5, fusion 2.5m). Six land cover categories were identified, namely green space, waterbodies, farmland, bare lands, buildings, and roads (Table 1). Urban green space, waterbodies, and farmland were assumed as landscape components of the green space, while bare lands, buildings, and roads were assumed as grey space (Figure 3).

2.4. Calculation Method

The relationship among LST and area and spatial pattern of green spaces were investigated at multiple scales, which means using different sizes of study units. Specifically, we compared study units within the same rings. Also, we compared LST changes in the rings (ring1 to 5) by increasing the distance from the edge of the park. For each analytical unit, the mean LST was calculated and assumed as the variable for statistical analysis. The percent cover of the green patches and the six landscape metrics (Table 2) were assumed as a predictor variable. A principal component analysis (PCA) was applied to investigate the relationship between the LST and the ratio of green area to total unit area and landscape metrics.
The land use change analysis method was applied to understand the spatial change of the green parches. Firstly, the land cover vector data of different years were converted to 30m × 30m raster data (the same as the resampled pixel size of the Landsat TM and ETM thermal bands), and then the overlay command of the arc toolbox in ArcGIS10.0 (Esri, Redlands, CA, USA) was applied to overlay the landscape type distribution maps in 2000, 2005, 2010, and 2015 to analyze the changes in the green patches over time.
Numerous landscape metrics can indicate and reflect the structure and special characteristics of the landscape pattern [33]. Here, we chose 6 landscape metrics to measure and indicate the quantity, shape, and spatial relationship of the green spaces patches, including number of patches (NP), landscape shape index (LSI), connectivity (CONNECT), largest patch index (LPI), aggregation index (AI), and patch density (PD) (Table 2). These metrics were calculated in FRAGSTATS 4.0 (University of Massachusetts, MA, USA).

3. Results

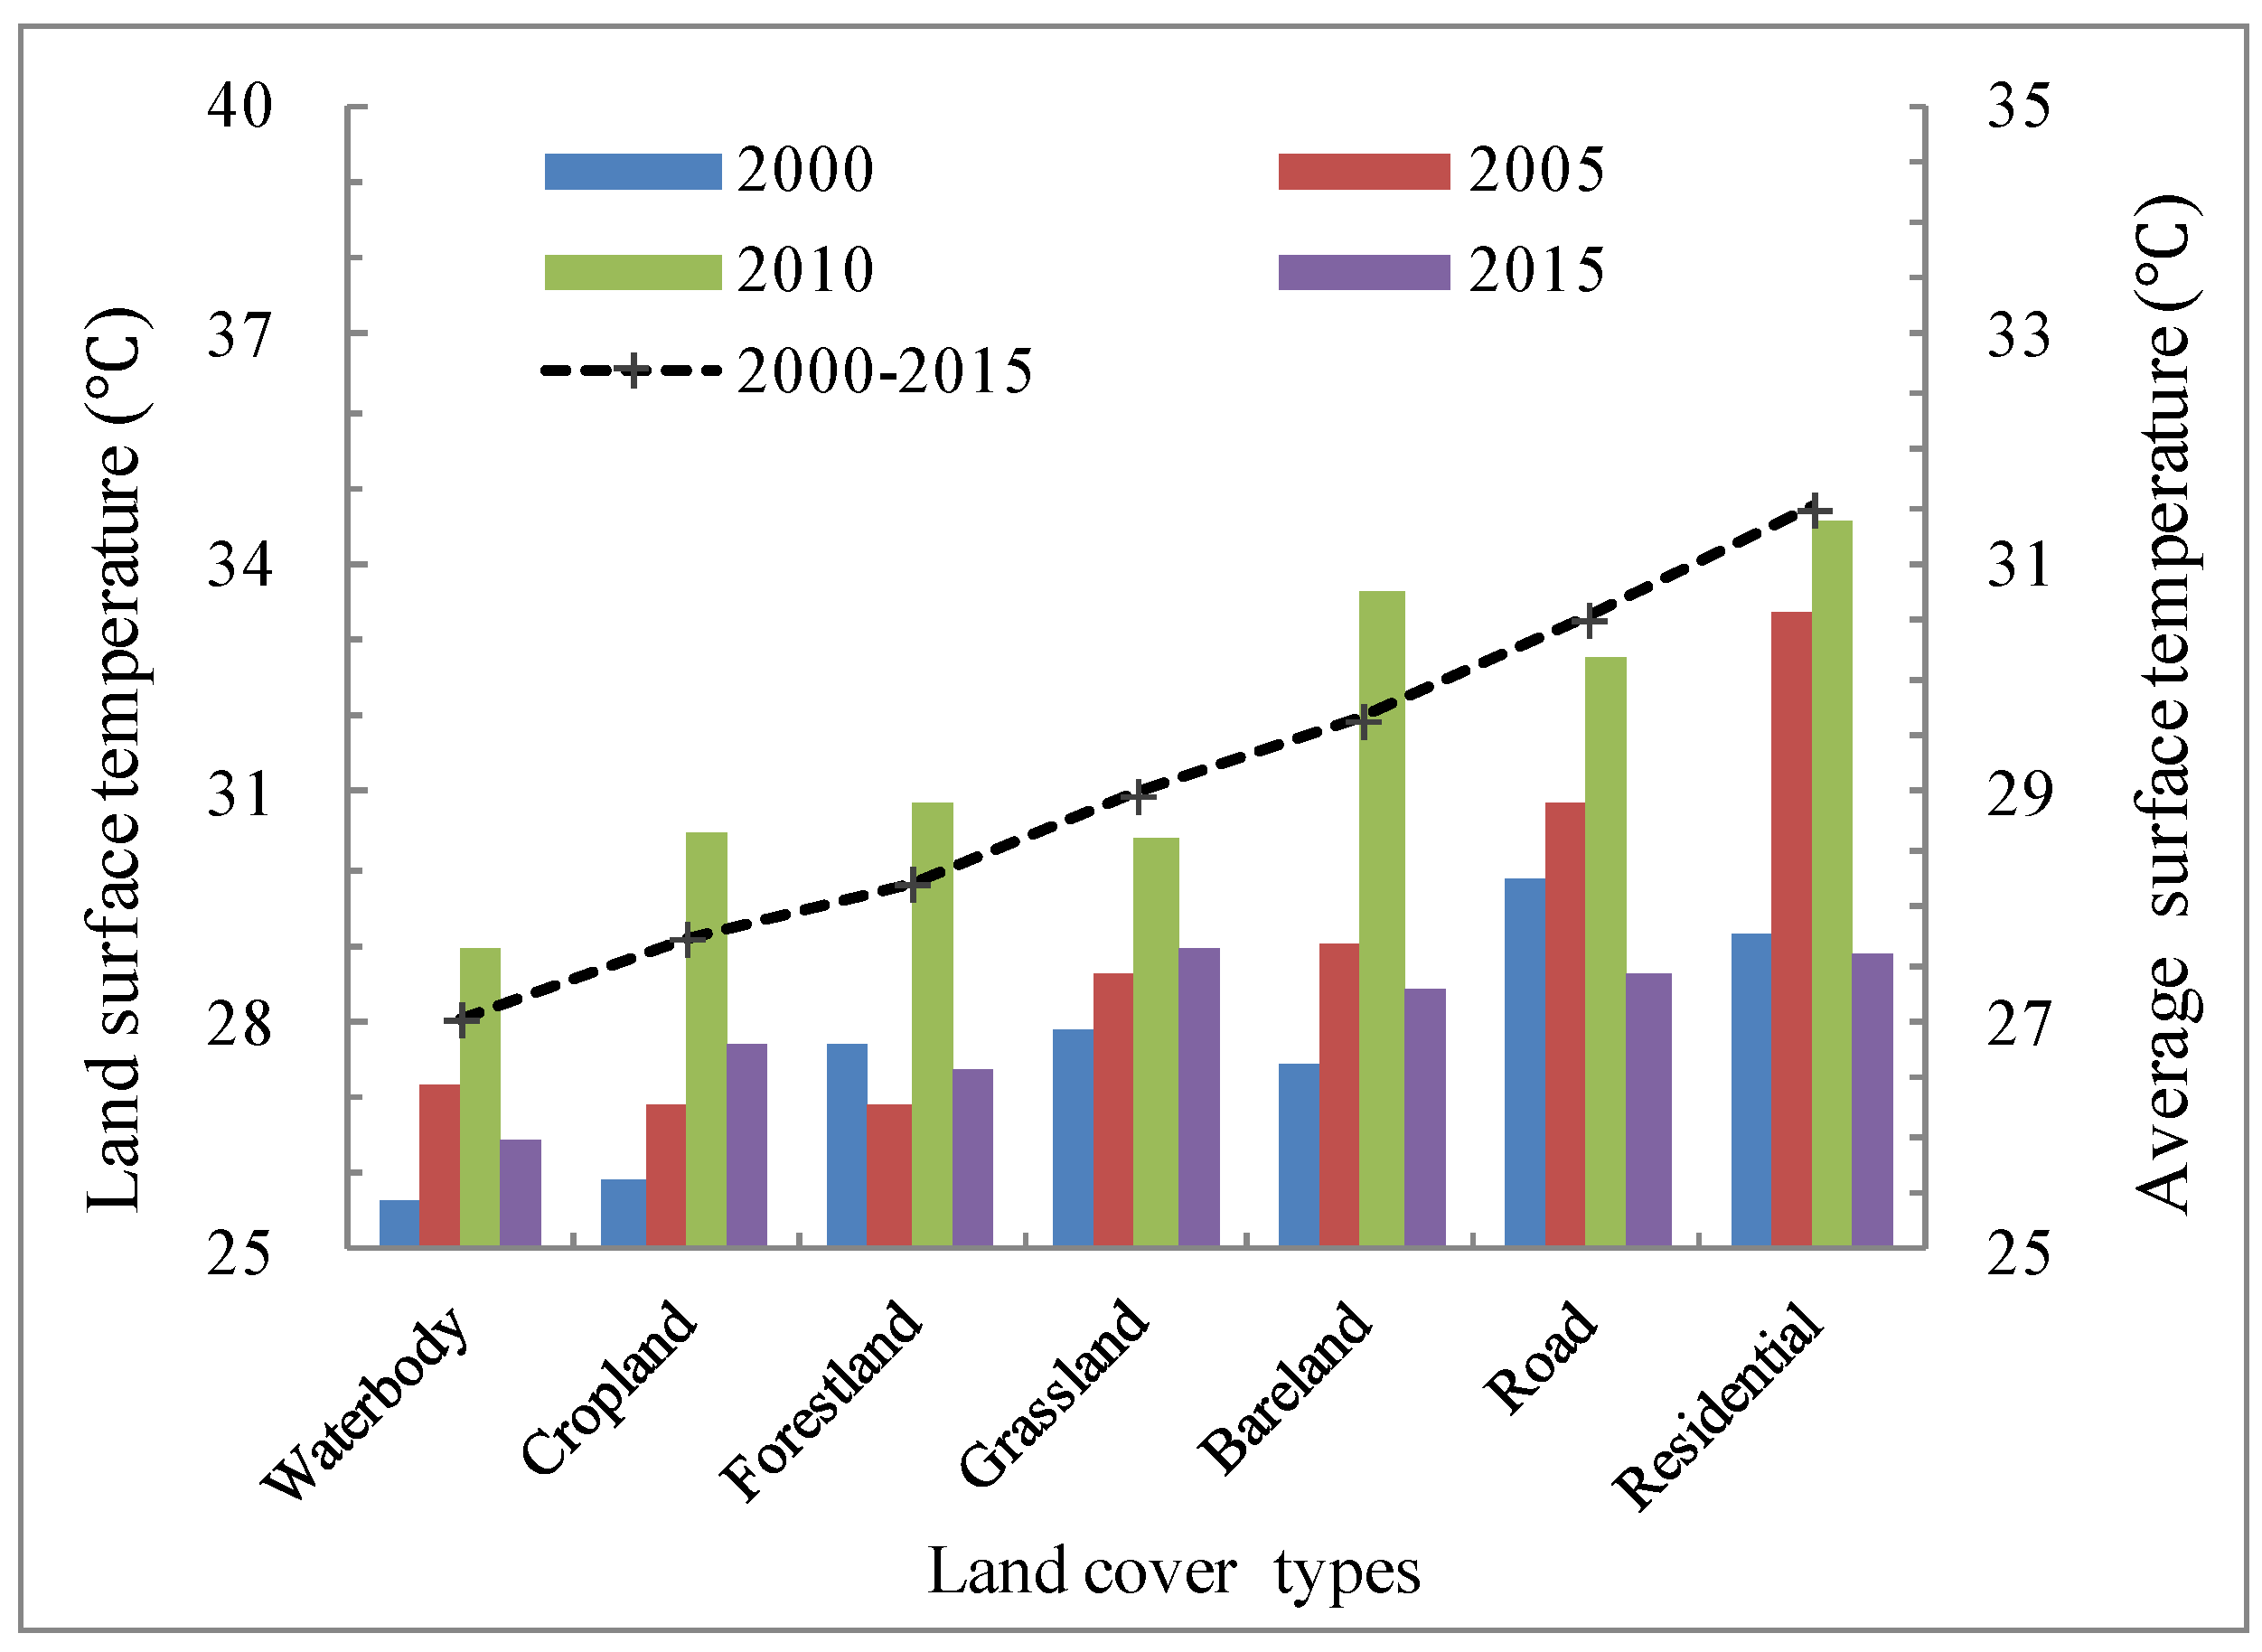
3.1. Land Surface Temperature and Green Space Cover

Rapid urbanization inevitably leads to land cover change and transformation of the natural surface into an impervious surface. Our study indicated that although the Olympic Forest Park has been constructed in the study area in 2008, the area of green coverage has dropped from 2000 to 2015 and has been replaced with impervious surfaces. The area and proportion of green coverage in the study area in 2000 were 31.67 km2 (23.9%) but then decreased to 30.01 km2 (22.8%) in 2005 and further to 27.04 km2 (20.5%) in 2010, and there were no important changes from 2010 to 2015 (Table 3). On the whole, the area of the green spaces from 2000 to 2015 has been reduced by 4 km2 which shows 3% of the green coverage has been replaced by grey spaces. Among the green space types, cropland and waterbodies within the study area have been reduced by 1.2 km2 and 5 km2 from 2000 to 2005 accordingly, while grass and forest (includes urban tree parks and green belts) have increased by 5.7 km2 and 2 km2 correspondingly. From 2005 to 2010, cropland dramatically shrank to 22.3 km2 and then vanished from the map of 2015, while grass, forests, and waterbodies have increased 6.7 km2, 8.9 km2, and 0.5 km2 accordingly. From 2010 to 2015, there was no important change in the components of the green spaces within the study area (Table 3). Generally, grass and forest have increased from 2000 to 2010 due to large-scale urban projects in this period, especially the construction of the Olympic Forest Park for the 2008 World Olympic Games within the study area. Meanwhile, croplands and waterbodies have been invaded by roads and business and residential areas.
Overlaying land cover and LST maps showed that land cover type is an important factor to determine LST; waterbody as the coolest land cover type (27.5 °C) was 8 °C cooler than residential area as the hottest land cover type by 35.3 °C. On average, the grey land cover types, including roads, bare lands, and residential areas, had a significantly higher LST than the green spaces, including waterbodies, grass, trees, and croplands. However, among the green space types, grass had the lowest cooling effect (Figure 4).
The LST data of the entire study area as well as each analytical zone showed that the ratio of green space had a strong negative relationship with LST (Table 4). For example, among the study zones, zone E (see Figure 1c and Figure 3) had the lowest green space ratio at 10.4% and it presented the highest LST at 30.3 °C, while in zone H, the LST dropped to its lowest level (29.2 °C) in response to a considerable increase in the green space ratio to 39.3% (Figure 5).

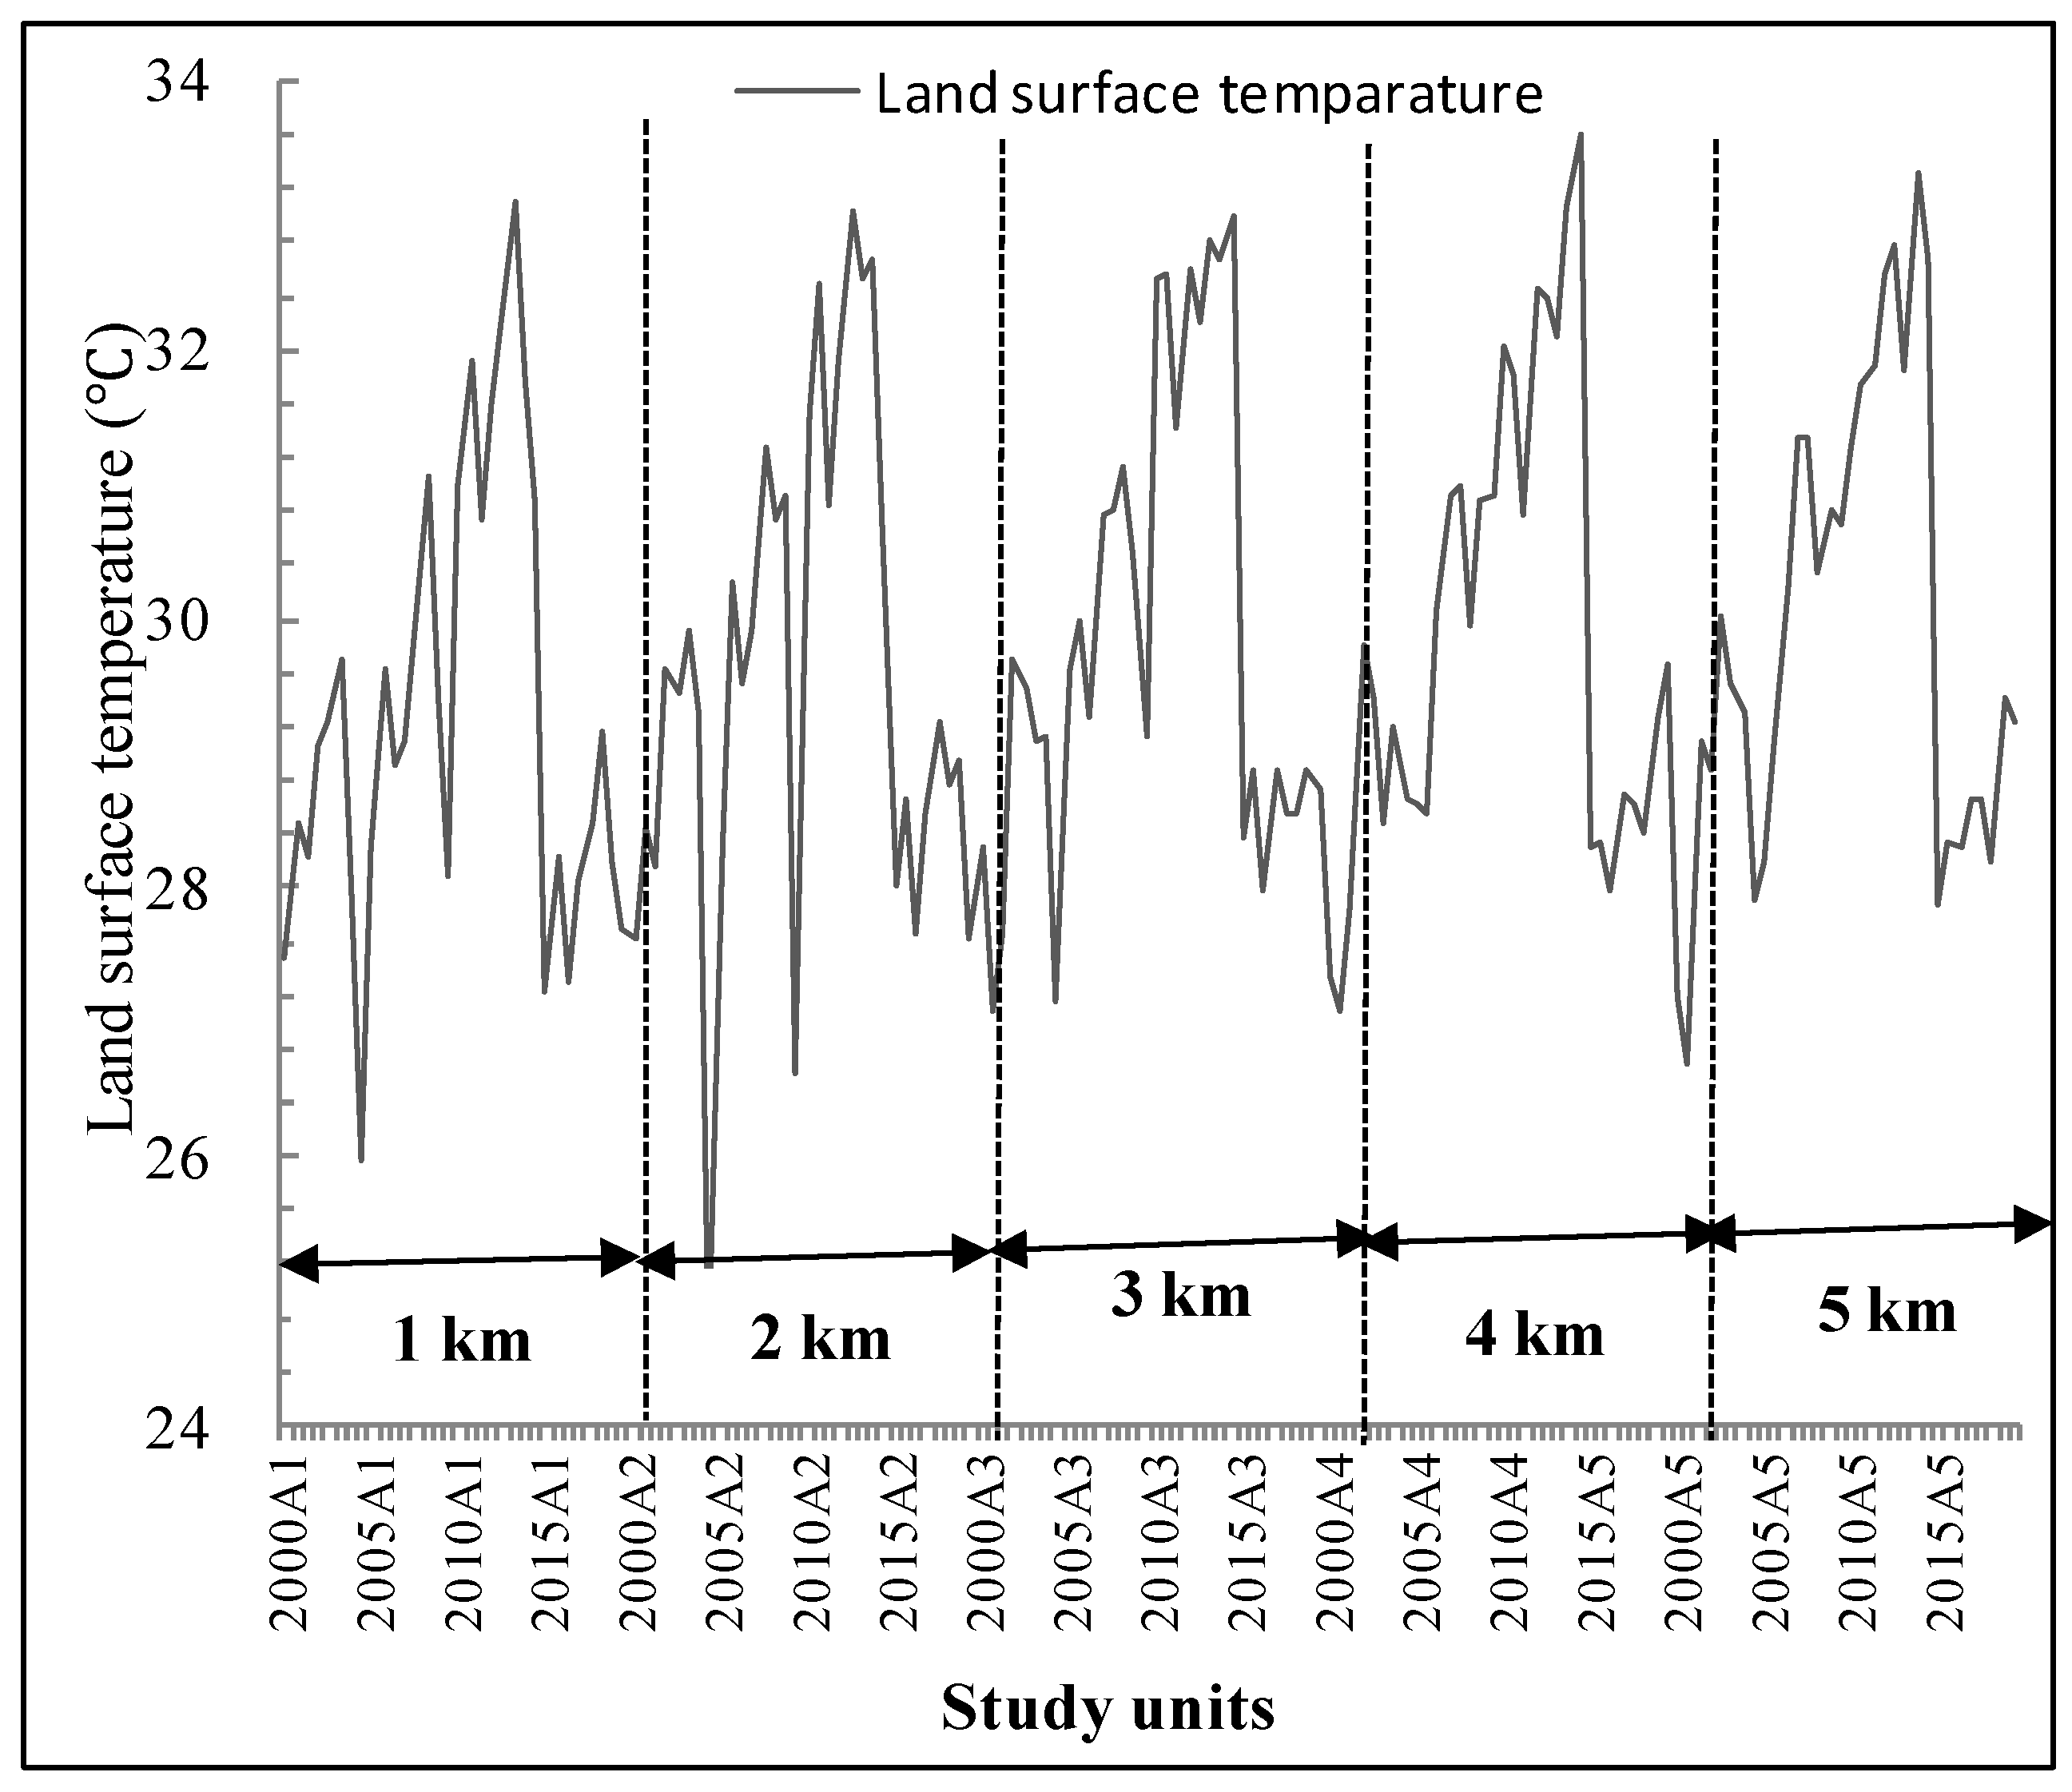
3.2. Land Surface Temperature and Distance from Forest Park

Urban green spaces provide cool islands which extend to the surrounding area. In this study, the Olympic Forest Park in the area of 10 km2 was the biggest green patch and covered 9% of the entire study area. Since it was located in the center of the study area, we analyzed the extension of its cooling effect on the surrounding area. The result suggested that the LST of the surrounding areas of the park is likely to be affected by the distance to the edge of the park and the ratio of the green space. The cooling effect of the park decreased by increasing the distance to the edge of the park, and the areas with a 5 km distance from the park’s edge was 0.7 °C warmer than the area within 1 km. It also was shown that the ratio of the green space in each zone is another important factor to determine the LST level. As an example, in the area within a 4 km distance from the park, an increase in the ratio of the green spaces affected the increasing trend of the LST and lowered it (Figure 6 and Figure 7). In addition, the LST maps of the study area confirmed this finding as it shows that the green space patches generate cool cores and that its cooling effect contribute to providing a cool buffer zone in the surrounding area, and increasing the distance from these cores weakens the cooling effect (Figure 2). However, the Pearson analysis suggested that the LST is more strongly correlated with the green space ratio (r = −0.452) rather than the distance (r = +0.118), which emphases the importance of the construction of more green spaces at different locations of the cities to cool down the temperature. Also, it was found that for a 10% increase in the green space rate, the LST drops by 0.4 °C and for a 1 km decrease in distance to the edge of the park, the LST decreases by 0.15 °C.

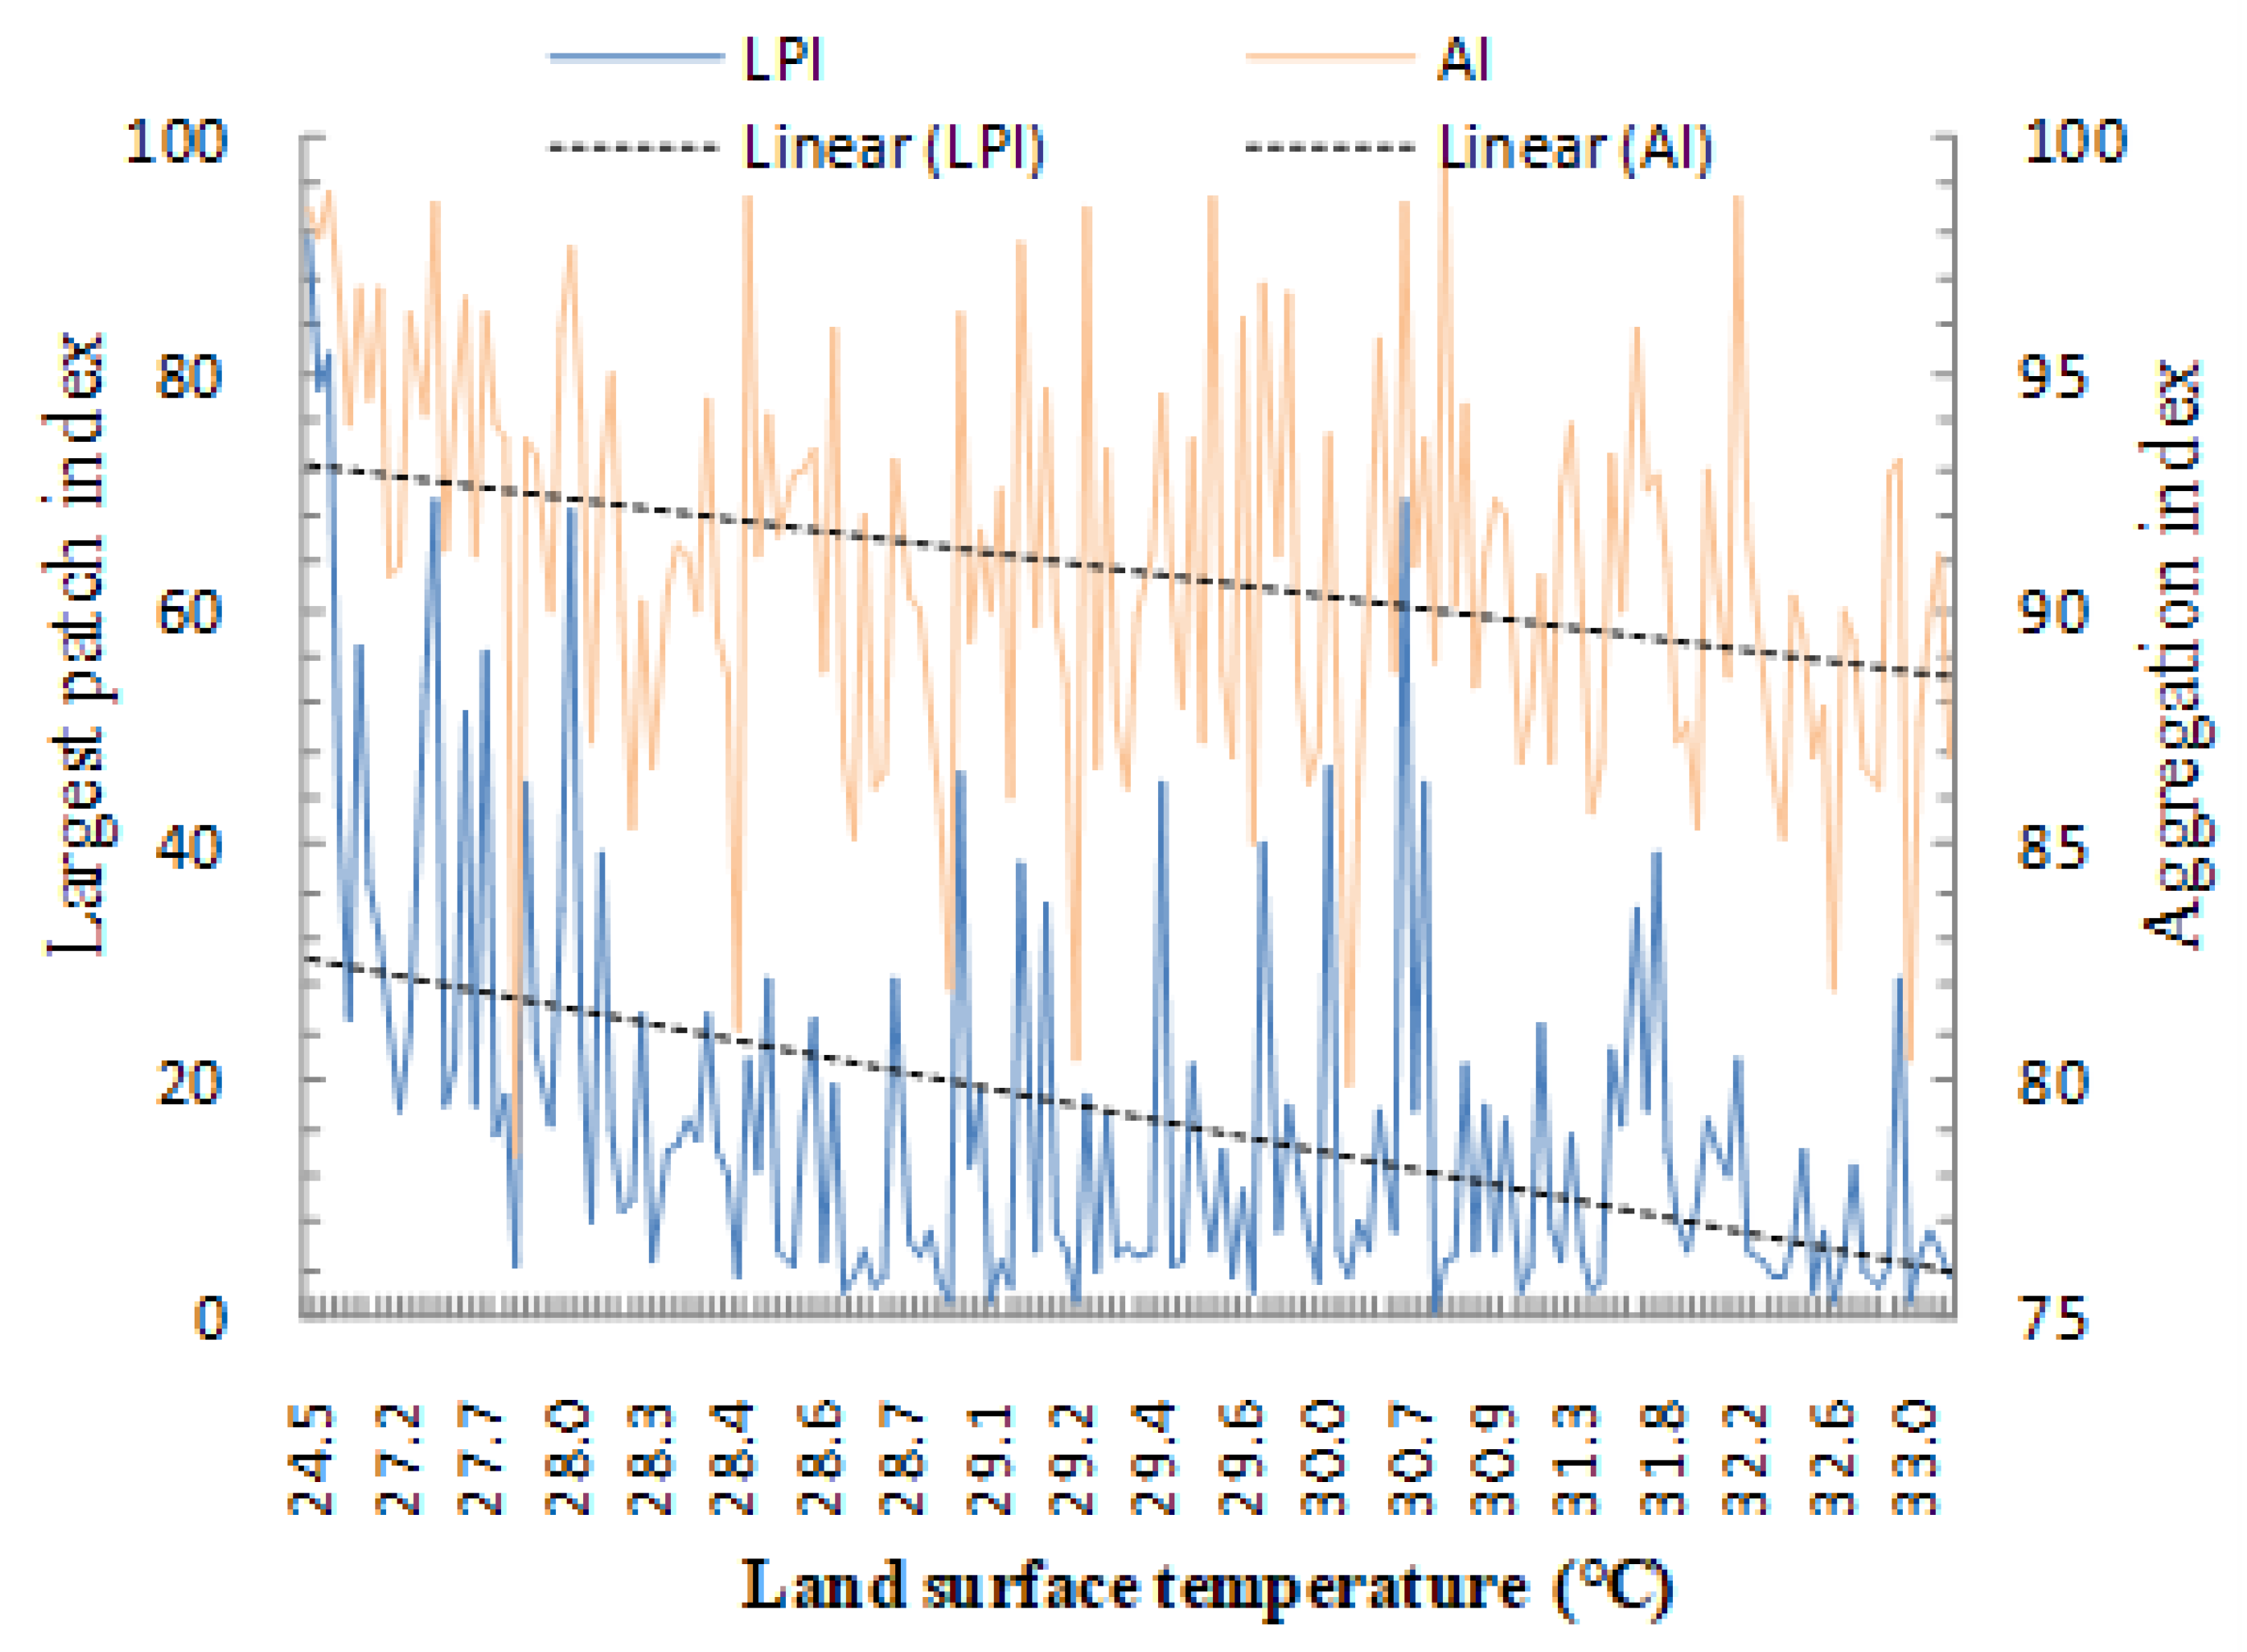
3.3. Land Surface Temperature and Green Landscape Metric

According to the landscape pattern indices of the urban green space in the study area (Table 5), the NP and PD of the green space increased consistently from 2000 to 2015, indicating the fragmentation of the landscape and heterogeneity increased. Also, the LSI, which is an important index to understand the landscape shape, increased gradually during the study period revealing a significant effect of human activities on the pattern of landscape. The decreasing trend of AI, which is an indicator for the spatial relationship between green patches, suggests a clustered distribution, fragmentation, and tendency of the green space; a decreasing trend of CONNECT shows the lowering connectivity of the green space patches because of urbanization and the scarcity of green spaces. LPI which is widely used as a landscape fragmentation indicator decreased; it confirms the landscape fragmentation and isolation over the 15-year span.
LST was strongly negatively correlated with LPI and AI. The interesting finding was that the LPI and the green space ratio had a relatively same correlation with LST and that both factors could predict about 46% of the variations in the LST. Among other landscape metrics, although not significant, connectivity was negatively correlated with LST, and NP, LSI, and PD were positively correlated. (Figure 8). This result reveals the negative consequences of urbanization and fragmentation of urban green spaces in the study area.

4. Discussion

4.1. LST and Land Cover Composition

This study investigated the composition and configuration of urban green spaces including land cover type, ratio of greeneries in study units, distance to the urban park, and landscape metrics, and its influences on the surface temperature and the urban heat islands’ intensity. The result showed that both the composition and configuration of the green space significantly affect the magnitude and extension of LST. This research broadens our scientific understanding of the cooling effect of urban green spaces. It has important plan, design, and management implications. Green space planners, designers, and managers can gain insights into optimizing the cooling effect in citiesto mitigate the negative impacts of urbanization and urban heat islands.
It was shown that the LST differences among land covers types were significant, and it reached 8 °C between waterbodies and residential areas as the coolest and hottest land cover types; green space types, including trees, grass, and waterbodies, presented lower LSTs in comparison with grey types. Theoretically, the LST difference is because of material composition and their ability to retain or reflect the solar energy [34]. Greeneries and water have higher albedo than impervious surfaces [7], and they can reflect the solar radiation more than low albedo materials, such as concerts which absorb solar energy and increase surface temperature [5,35]. Also, green spaces cool the temperature through processes of evapotranspiration and shading [5,35]. Among the green covers in this study, trees showed more pronounced cooling effects, while grass presented the lowest effect. A recent study in Beijing carried out in Reference [8] also found similar temperature differences among land cover types. It can be implied that shade is a prime factor which contributes to the cooling effect of trees [8,20,36,37], while, waterbodies and grass have a lesser cooling effect due to the lack of this factor. Previous reports have also suggested that grass is less effective than trees and waterbodies [38] or grass has no significant effect [29,39], or it is even reported to have heating effects rather than cooling effects [40]. However, it can be revealed that the cooling function of grass is likely to be more affected by green space management regimes such as irrigation, as grass is more sensitive to water stress and could lose its evapotranspiration function earlier because of shallow roots [17]. Since a considerable portion of urban areas such as stadiums, boulevards play grounds, etc. is covered by grass, we encourage green space managers to pay more attention to grass management to maximize the cooling effect in the era of urban climate change. Also planting more trees in urban green spaces optimizes the associated cooling function.
It was shown that the green space ratio in each study was negatively significantly correlated with LST for a 10% increase in the green space rate as LST drops by 0.4 °C. These results are consistent with the findings from previous studies [17], increasing the ratio of green coverage to grey coverage can significantly decrease LST. Also, according to Huang et al. [26] an increase in percent cover of pavement and building increases the simulated LST, while it decreases with the increase of water and greeneries.

4.2. LST Land Distance to Urban Park

The results showed that, although not statistically significant, the distance to the park was positively correlated with the LST, and with each 1km increase in the distance to the park, the LST rose by 0.15 °C. Findings from previous studies have confirmed the extension of the cooling effect in the surrounding area, while they have provided different interpretations for it. Hamada and Ohta (2010) studied an urban park with the size of 147 hectares in Japan and suggested that the cooling effect of the urban park extends for several hundred meters [22].According to Honjoet al. (1990), the cooling effect of an urban park can be extended in the surrounding area with a distance similar to the length of the park [23].Also, the cooling range of the influenced area by the green space depends on the size of green space [10,16]. In addition, it indicated that the availability of the green space and evapotranspiration cause the cooling effects while wind is an important factor in the flow convection of cool air to the surrounding area; urban geometry, buildings layout, and weather conditions, particularly wind speed and sun exposure, are found to be important factors to extend the cooling effect [16,26].We conclude that the availability of green space in the proximity of built-up areas should receive enough importance in the process of planning and designing although the distance is not a prime factor and LST can be affected by the ratio and configuration of the green space as well. However, further researches are necessary to fully understand the mechanism of the extension of the cooling effect of green spaces in surrounding built areas.

4.3. LST Land Landscape Configurations

The decreasing trend of LPI, AI, and CONNECT in the study area, which indicate fragmentation, isolation, and disconnection of green patches, were negatively correlated with the LST according to an analysis of 48 study units. Meanwhile, NP, LSI, and PD, which reveal the same concept of green space fragmentation, showed a positive correlation with the LST. The result obviously explained the negative consequences of rapid urbanization and replacing green covers with grey covers in the increasing UHI phenomenon. Our findings are supported by the former studies on pattern changes of urban green spaces in Beijing which showed that the aggregation and connectivity of green patches decreased while the number of patches increased from 2000 to 2010 [39,41]. It is also reported that large and continuous green space patches provide higher evapotranspiration and, therefore, a higher cooling effect than that of smaller and fragmented green patches, so the fragmentation of green space is likely to increase the LST [39,41]. It is found that there is a positive correlation between LST with PD and LSI at the landscape level in Beijing, suggesting that several green space patches represent a higher cooling function than when concentrated in a single area [42]. However, in some cases, contradictory results have been reported. For instance, a greater patch density of urban green spaces had a negative correlation with LST in Shenzhen, China [27]; Berlin, Germany [19]; and Baltimore, USA [11]. This inconsistency in the result may be because these studies have been carried out in cities with different climate contexts or different statistical methodologies were employed [10]. Regarding the lack of comprehensive data, the spatial configuration of green space in relation to the urban temperature should be addressed in further studies to be clearly understood.

4.4. Important Factors in Cooling Effect of Urban Green Space

Land cover composition analysis showed that trees and waterbodies were more effective to mitigate the urban heat island in the study area among land cover types (Figure 4). Furthermore, the Pearson correlation analysis (Table 4) showed that among the composition and configuration factors, the percent coverage of greenery, the largest patch index, and the aggregation index could present pronounced effects to mitigate the land surface temperature. Since the largest patch index and the aggregation index are mainly linked to the size of the green space patches, our results underscore that the area and size of green space in dense urban areas are prime factors to efficiently alleviate the urban heat islands effect. This conclusion is consistent with previous studies: in a study in Beijing on urban planning and climate, indicators such as the ratio of green coverage, the floor area ratio, the building height, and the building density, it was found that the ratio of green coverage in the total unit area was the most significant indicator to mitigate high temperature events in the city [10]; in Baltimore, USA, using a correlation analysis and multiple linear regression, it was indicated that both the composition and configuration of green space play important roles to cool down cities and they emphasized on a higher percent cover of woody vegetations [11,19]; and another study in China showed that the largest green patch size and the percentage of water area are prime factors to maximize the cooling effect of green spaces [29].

4.5. Planning Implementation and Limitations

There has been an increasing interest in linking the theory of urban ecology to scientific green space design and management [8,9,10,11]. The result of current research implies few suggestions for practical utilization in order to maximize the cooling effect of green spaces. These suggestions may be considered in the process of urban planning and green space design and management.
(1) Attention to the ecological functions of urban green space: Urban green spaces can be considered as an ecologic measure to alleviate UHI by providing the cooling effect, and both the composition and configuration of urban green spaces can affect the magnitude of the surface temperature. Therefore, construction and designing urban green spaces should not be confined to aesthetic values but must highlight the ecological function of greeneries network in cities.
(2) Planting more trees rather than other types of green spaces: Generally, among greeneries, trees are more efficient in providing cooling effects than grass. In contrast, hard surfaces such as buildings and roads contribute to higher levels of UHI. Thus, planting more trees should receive enough attention in the cities facing the UHI phenomenon.
(3) Lesser distance to urban parks or constructing more urban parks: The results showed that the land surface temperature in the surrounding areas of the urban park declined as the distance to the park decreased. We encourage constructing more parks in urban built areas or constructing buildings near parks.
(4) Increasing the area and size of green space: Among green space spatial composition and configuration factors, the ratio of green space to grey space, the size, and the aggregation index (AI) of green patches which are strongly negatively correlated with LST are prime factors in its cooling effect. Increasing the area and size of green space covers, particularly, tree covers should be considered as an effective measure to alleviate the excess urban heat in urbanized area.
(5) New spatial structures of green space: The results indirectly imply that replacing grey surfaces such as buildings with green covers is expensive or impractical, so paying attention to vertical greening (green walls/etc), green roofs and also optimizing the layout and pattern of greeneries are necessary to the ecological development of cities.
(6) Green space protection policies: One of the negative consequences of rapid urbanization is shrinking and fragmentation of green spaces. Stakeholders should promote protecting policies which benefit citizens well-being through various ecosystem services of green space.
Despite the positive results, the present study has several limitations. The study has been carried out in Beijing, China with a humid-continental climate; the result might not be applicable for other climate conditions. Also, landscape compositions were classified into six types in terms of planning and management, while the effect of different futures in the same land cover type has been ignored. For example, all woody plants were considered as tree covers without considering the effect of different woody plant species. Also, we only collected summer daytime remotely sensed data to study the land surface temperature, while seasonal and nighttime data is also necessary to comprehensively understand the mechanisms of the cooling effect of urban green spaces. The approach of the present study can be improved in future researches by studying the effect of the landscape configuration of green spaces in different climate contexts and by the incorporation of vegetation characteristic differences. In addition, new spatial structures of urban green space such as green walls and green roofs are not taken into account in this study and should be addressed in the process of urban planning and green space design.

5. Conclusions

Urban green space has been considered as an ecologic measure to alleviate the negative consequences of urban heat islands on the environment and human health. It is widely documented that increasing the area of green space can reduce ambient air temperature. However, there is a lack of enough and consistent evidence to understand the extension of the cooling effect of green spaces into the surrounding area and also to prove the effect of the spatial configuration of green spaces. In this paper, we examined the spatial and temporal patterns of urban green space composition and configuration in the surrounding areas of the Olympic Forest Park of Beijing, China in relation with urban surface temperature changes between 2000 and 2015. We found that the urban green space of the study area has shrunk and fragmented during the time span in response to rapid urbanization. Generally, trees and waterbodies are more efficient in providing the cooling effect than grass; in contrast, buildings and roads contribute to higher levels of UHI. The land surface temperature in the surrounding areas of an urban park can be affected not only by green coverage ratio and spatial patterns but also by the distance to the park. Therefore, the negative impacts of urbanization on urban heat islands can be alleviated not only by balancing the landscape composition but also by enhancing its spatial configuration. This finding provides important insights to urban green space planners on urban heat island alleviation through vegetations. We encourage them to pay more attention to planting trees, increasing the percent green coverage, larger patch of green spaces, and vertical greeneries and green roofs, particularly in dense urban areas.

Author Contributions

Research design and methodology, M.A.-B., B.Z. and G.-D.X.; original draft preparation, M.A.-B., B.Z. and G.-D.X.; validation, G.-D.X. and B.Z.; analysis, M.A.-B. and B.Z.; writing—review and editing, Y.S.; all authors read and approved the manuscript.

Funding

This research was funded by the National Major Research Development Program of China (No.2016YFC0503403). The first author was sponsored by CAS-TWAS President Fellowship (The world Academy of Sciences studentship of the Chinese Academy of Sciences) during preparation of this manuscript.

Acknowledgments

In this section you can acknowledge any support given which is not covered by the author contribution or funding sections. This may include administrative and technical support, or donations in kind (e.g. materials used for experiments).

Conflicts of Interest

The authors declare no conflict of interest

References

  1. Simonds, J.O. Landscape Architecture: A Manual of Site Planning and Design; McGraw-Hill Professional: New York, NY, USA, 2007. [Google Scholar]
  2. Kong, F.; Yan, W.; Zheng, G.; Yin, H.; Cavan, G.; Zhan, W.; Zhang, N.; Cheng, L. Retrieval of three-dimensional tree canopy and shade using terrestrial laser scanning (TLS) data to analyze the cooling effect of vegetation. Agric. For. Meteorol. 2016, 217, 22–34. [Google Scholar] [CrossRef]
  3. Solecki, W.D.; Rosenzweig, C.; Parshall, L.; Pope, G.; Clark, M.; Cox, J.; Wiencke, M. Mitigation of the heat island effect in urban New Jersey. Glob. Environ. Chang. Part B Environ. Hazards 2005, 6, 39–49. [Google Scholar] [CrossRef]
  4. Tan, J.; Zheng, Y.; Song, G.; Kalkstein, L.S.; Kalkstein, A.J.; Tang, X. Heat wave impacts on mortality in Shanghai, 1998 and 2003. Int. J. Biometeorol. 2007, 51, 193–200. [Google Scholar] [CrossRef] [PubMed]
  5. Zhang, B.; Xie, G.D.; Gao, J.X.; Yang, Y. The cooling effect of urban green spaces as a contribution to energy-saving and emission-reduction: A case study in Beijing, China. Build. Environ. 2014, 76, 37–43. [Google Scholar] [CrossRef]
  6. White, M.A.; Nemani, R.R.; Thornton, P.E.; Running, S.W. Satellite evidence of phenological differences between urbanized and rural areas of the eastern United States deciduous broadleaf forest. Ecosystems 2002, 5, 260–273. [Google Scholar] [CrossRef]
  7. Akbari, H.; Pomerantz, M.; Taha, H. Cool surfaces and shade trees to reduce energy use and improve air quality in urban areas. Sol. Energy 2001, 70, 295–310. [Google Scholar] [CrossRef]
  8. Amani-Beni, M.; Zhang, B.; Xie, G.; Xu, J. Impact of urban park’s tree, grass and waterbody on microclimate in hot summer days: A case study of Olympic Park in Beijing, China. Urban For. Urban Green. 2018, 32, 1–6. [Google Scholar] [CrossRef]
  9. Bowler, D.E.; Buyung-Ali, L.; Knight, T.M.; Pullin, A.S. Urban greening to cool towns and cities: A systematic review of the empirical evidence. Landsc. Urban Plan. 2010, 97, 147–155. [Google Scholar] [CrossRef]
  10. Zhao, C.; Fu, G.; Liu, X.; Fu, F. Urban planning indicators, morphology and climate indicators: A case study for a north-south transect of Beijing, China. Build. Environ. 2011, 46, 1174–1183. [Google Scholar] [CrossRef]
  11. Zhou, W.; Wang, J.; Cadenasso, M.L. Effects of the spatial configuration of trees on urban heat mitigation: A comparative study. Remote Sens. Environ. 2017, 195, 1–12. [Google Scholar] [CrossRef]
  12. Deletic, A. Sediment transport in urban runoff over grassed areas. J. Hydrol. 2005, 301, 108–122. [Google Scholar] [CrossRef]
  13. Zhang, B.; Xie, G.; Zhang, C.; Zhang, J. The economic benefits of rainwater-runoff reduction by urban green spaces: A case study in Beijing, China. J. Environ. Manag. 2012, 100, 65–71. [Google Scholar] [CrossRef] [PubMed]
  14. Kabisch, N. Ecosystem service implementation and governance challenges in urban green space planning-The case of Berlin, Germany. Land Use Policy 2015, 42, 557–567. [Google Scholar] [CrossRef]
  15. Niemelä, J. Ecology of urban green spaces: The way forward in answering major research questions. Landsc. Urban Plan. 2014, 125, 298–303. [Google Scholar] [CrossRef]
  16. Oke, T.R.; Crowther, J.M.; Mcnaughton, K.G.; Monteith, J.L.; Gardiner, B. The Micrometeorology of the Urban Forest. Phil. Trans. R. Soc. Lond. B 1989, 335–349. [Google Scholar] [CrossRef]
  17. Myint, S.W.; Zheng, B.; Talen, E.; Fan, C.; Kaplan, S.; Middel, A.; Smith, M.; Huang, H.; Brazel, A. Does the spatial arrangement of urban landscape matter? examples of urban warming and cooling in phoenix and las vegas. Ecosyst. Health Sustain. 2015, 1, 1–15. [Google Scholar] [CrossRef]
  18. Connors, J.P.; Galletti, C.S.; Chow, W.T.L. Landscape configuration and urban heat island effects: Assessing the relationship between landscape characteristics and land surface temperature in Phoenix, Arizona. Landsc. Ecol. 2013, 28, 271–283. [Google Scholar] [CrossRef]
  19. Zhou, W.; Huang, G.; Cadenasso, M.L. Does spatial configuration matter? Understanding the effects of land cover pattern on land surface temperature in urban landscapes. Landsc. Urban Plan. 2011, 102, 54–63. [Google Scholar] [CrossRef]
  20. Ng, E.; Chen, L.; Wang, Y.; Yuan, C. A study on the cooling effects of greening in a high-density city: An experience from Hong Kong. Build. Environ. 2012, 47, 256–271. [Google Scholar] [CrossRef]
  21. Yu, C.; Hien, W.N. Thermal benefits of city parks. Energy Build. 2006, 38, 105–120. [Google Scholar] [CrossRef]
  22. Hamada, S.; Ohta, T. Seasonal variations in the cooling effect of urban green areas on surrounding urban areas. Urban For. Urban Green. 2010, 9, 15–24. [Google Scholar] [CrossRef]
  23. Honjo, T.; Takakura, T. Simulation of Thermal Effects of Urban reen Areas on Their Surrounding Areas. Energy Build. 1990, 16, 443–446. [Google Scholar] [CrossRef]
  24. Kong, F.; Yin, H.; James, P.; Hutyra, L.R.; He, H.S. Effects of spatial pattern of greenspace on urban cooling in a large metropolitan area of eastern China. Landsc. Urban Plan. 2014, 128, 35–47. [Google Scholar] [CrossRef]
  25. Li, X.; Zhou, W.Q.; Ouyang, Z.; Qian, Y.; Zhou, W.Q.; Li, W.; Han, L.; Yu, W.; Pickett, S.T.A.; Li, X.; et al. Relationship between land surface temperature and spatial pattern of greenspace: What are the effects of spatial resolution? Landsc. Urban Plan. 2013, 114, 1–8. [Google Scholar] [CrossRef]
  26. Huang, G.; Zhou, W.; Cadenasso, M.L. Is everyone hot in the city? Spatial pattern of land surface temperatures, land cover and neighborhood socioeconomic characteristics in Baltimore, MD. J. Environ. Manag. 2011, 92, 1753–1759. [Google Scholar] [CrossRef] [PubMed]
  27. Dugord, P.-A.; Lauf, S.; Schuster, C.; Kleinschmit, B. Land use patterns, temperature distribution, and potential heat stress risk—The case study Berlin, Germany. Comput. Environ. Urban Syst. 2014, 48, 86–98. [Google Scholar] [CrossRef]
  28. Li, J.; Song, C.; Cao, L.; Zhu, F.; Meng, X.; Wu, J. Impacts of landscape structure on surface urban heat islands: A case study of Shanghai, China. Remote Sens. Environ. 2011, 115, 3249–3263. [Google Scholar] [CrossRef]
  29. Yang, C.; He, X.; Yu, L.; Yang, J.; Yan, F.; Bu, K.; Chang, L.; Zhang, S. The cooling effect of urban parks and its monthly variations in a snow climate city. Remote Sens. 2017, 9, 1066. [Google Scholar] [CrossRef]
  30. Landsat Project Science Office at NASA’s Goddard Space Flight Center. Landsat 7 Science Data Users Handbook; NASA: Washington, DC, USA, 2008; Volume 2008.
  31. Asgarian, A.; Amiri, B.J.; Sakieh, Y. Assessing the effect of green cover spatial patterns on urban land surface temperature using landscape metrics approach. Urban Ecosyst. 2015, 18, 209–222. [Google Scholar] [CrossRef]
  32. Chander, G.; Markham, B.L.; Helder, D.L. Summary of current radiometric calibration coefficients for Landsat MSS, TM, ETM+, and EO-1 ALI sensors. Remote Sens. Environ. 2009, 113, 893–903. [Google Scholar] [CrossRef] [Green Version]
  33. McGarigal, K. The Gradient Concept of Landscape Structure. Available online: https://www.cambridge.org/core/books/issues-and-perspectives-in-landscape-ecology/gradient-concept-of-landscape-structure/541A6A42FBCB99C9CE046EB915CC1A69 (accessed on 14 January 2019). [CrossRef]
  34. Tan, C.L.; Wong, N.H.; Tan, P.Y.; Jusuf, S.K.; Chiam, Z.Q. Impact of plant evapotranspiration rate and shrub albedo on temperature reduction in the tropical outdoor environment. Build. Environ. 2015, 94, 206–217. [Google Scholar] [CrossRef]
  35. Santamouris, M. The role of green spaces, Appropriate materials for the urban environment. In Energy and Climate in the Urban Built Environment; Earthscan: London, UK, 2001; pp. 145–181. [Google Scholar]
  36. Coutts, A.; Harris, R. A Multi-Scale Assessment of Urban Heating in Melbourne during an Extreme Heat Event: Policy Approaches for Adaptation; Monash University: Monash, Austalia, 2013. [Google Scholar]
  37. Xie, Q.; Wu, Y.; Zhou, Z.; Wang, Z. Remote sensing study of the impact of vegetation on thermal environment in different contexts. IOP Conf. Ser. Earth Environ. Sci. 2018, 121. [Google Scholar] [CrossRef]
  38. Nichol, J.E. High-Resolution Surface Temperature Patterns Related to Urban Morphology in a Tropical City: A Satellite-Based Study. J. Appl. Meteorol. 1996, 35, 135–146. [Google Scholar] [CrossRef] [Green Version]
  39. Cao, X.; Onishi, A.; Chen, J.; Imura, H. Quantifying the cool island intensity of urban parks using ASTER and IKONOS data. Landsc. Urban Plan. 2010, 96, 224–231. [Google Scholar] [CrossRef]
  40. Gill, S.E.; Handley, J.F.; Ennos, A.R.; Pauleit, S. Adapting Cities for Climate Change: The Role of the Green Infrastructure. Built Environ. 1998, 33, 115–133. [Google Scholar] [CrossRef]
  41. Zhang, X.; Zhong, T.; Feng, X.; Wang, K. Estimation of the relationship between vegetation patches and urban land surface temperature with remote sensing. Int. J. Remote Sens. 2009, 30, 2105–2118. [Google Scholar] [CrossRef]
  42. Li, S.; Zhao, Z.; Miaomiao, X.; Wang, Y. Investigating spatial non-stationary and scale-dependent relationships between urban surface temperature and environmental factors using geographically weighted regression. Environ. Model. Softw. 2010, 25, 1789–1800. [Google Scholar] [CrossRef]
Figure 1. The location of the Olympic Forest Park and its 5km buffer zone (study area) in Beijing.
Sustainability 11 00513 g001
Figure 2. Distributions of the land surface temperature (LST) in the study area from 2000 to 2015.
Sustainability 11 00513 g002
Figure 3. Spatial–temporal changes of the land cover from 2000 to 2015 in the study area.
Sustainability 11 00513 g003
Figure 4. Variation of LST among land cover types.
Sustainability 11 00513 g004
Figure 5. The relations between the LST and green space ratio in different zones in the 5km surrounding area of the Olympic Forest Park from 2000 to 2015.
Sustainability 11 00513 g005
Figure 6. Relations among the LST, the green area ratio, and distance in the study area.
Sustainability 11 00513 g006
Figure 7. Variation of LST in different zones in 5km surrounding area of Olympic Forest Park from 2000 to 2015.
Sustainability 11 00513 g007
Figure 8. Relations between LST, LPI, and AI in the different zones of the study area.
Sustainability 11 00513 g008
Table 1. Classification of land cover types in the study area.
Urban Space TypeLand Cover TypeCharacteristics of Land Cover Type
Green spaceFarmlandFarms, growing crops, paddy fields, etc.
WaterbodyRivers (canals), lakes, ponds, etc.
Urban green spaceUrban parks, urban trees, grasses, gardens, etc.
Grey spaceBare landLands hard to use, sandy lands, saline-alkali lands, bare lands
Roof and impervious landResidential areas, industrial buildings, shopping plazas
RoadRoads, traffic lands
Table 2. Selected landscape metrics for the study area.
CategoryLandscape IndicesDescription
ConfigurationNumber of patches (NP)The number of green patches in study unit
Largest patch index (LPI)The proportion of the largest green patch within study unit.
Patch density (PD)The number of green patches per unit area (indicating fragmentation level of landscape and heterogeneity)
ShapeLandscape shape index (LSI)The complexity of landscape structure (indicating the effect of human activities on the pattern of landscape)
Aggregation index (AI)Spatial aggregation of green patches within study unit (indicating spatial relationship between green patches)
ConnectivityConnectivity (CONNECT)Connections among green patches
Table 3. Types of green spaces in the study area from 2000 to 2015.
Type2000200520102015
Area (km2)Ratio (%)Area (km2)Ratio (%)Area (km2)Ratio (%)Area (km2)Ratio (%)
Grassland1.23.36.818.715.547.916.048.6
Forestland3.911.25.916.114.845.614.744.7
Waterbody6.618.71.64.32.16.52.26.7
Cropland23.466.922.360.80.00.00.00.0
Table 4. The Pearson correlation analysis results between the LST and green space ratio, distance, and the landscape metrics.
LSTPDCONCTNPLPIAIDISTGREENLSI
LSTPEARSON Correlation10.087−0980.133−0.450 **−0.314 **0.118−0.453 **0.082
Sig. (2-tailed)-0.2800.2240.0970.0000.0000.1380.0000.310
N160160160160160160160160160
Note: LST = land surface temperature, PD = patch density, CONCT= connectivity, NP = number of patches, LPI = largest patch index, AI = aggregation index, DIST =distance to the edge of park, GREEN = green space ratio, and LSI = landscape shape index. ** Correlation is significant at the 0.05 level.
Table 5. Landscape metrics of the study area from 2000 to 2015.
Landscape index20002005201020152000–2015
NP39546810061
LSI11.7114.9613.3115.593.88
PD0.280.390.490.720.44
CONNECT1.481.891.450.77−0.72
AI94.5593.3793.8992.00−2.54
LPI11.7521.409.803.93−7.82
Note: NP = number of patches, LSI = landscape shape index, PD = patch density, CONNECT= connectivity, AI = aggregation index, and LPI = largest patch index.

