Abstract
This study focuses on the association of sex differences and psychological factors with periodic general health examination (GHE) behaviors. We conducted a survey in Hanoi and the surrounding areas, collecting 2068 valid observations; the cross-section dataset was then analyzed using the baseline category logit model. The study shows that most people are afraid of discovering diseases through general health examinations (76.64%), and the fear of illness detection appears to be stronger for females than for males (β1(male) = −0.409, p < 0.001). People whose friends/relatives have experienced prolonged treatment tend to show more hesitation in participating in physical check-ups (β2 = 0.221, p < 0.05). On the ideal frequency of GHEs, 90% of the participants agree on once or twice a year. The probability of considering a certain period of time as an appropriate frequency for GHEs changes in accordance with the last doctor visit (low probability of a health examination every 18 months) and one’s fear of potential health problems post-checkup (no fear raises probability of viewing a health examination every 6 months by 9–13 percentage points). The results add to the literature on periodic GHE in particular and on preventive health behaviors in general.
1. Introduction
1.1. On General Health Examinations
Periodic general health examination (GHE) is expected to be an effective method of helping people improve their health [1,2]. One of the first mentions of periodic health examination was by Dobell in 1861: he advocated for such examinations as a method of following up on the health status of tuberculosis patients [3]. From the 1920s until the 1970s, many medical institutions in the U.S systematically encouraged and advised citizens to take periodic health checkups [4,5]. In earlier surveys, over 90% of participants thought they should check their blood pressure, heart, lungs and stomach regularly [6]. Many studies have suggested more efficient use of healthcare resources on the grounds that periodic GHEs may help reduce the actual mortality rate [1,7,8,9,10].
Yet, it is important to note that this practice is not widely followed across the world. This study looks at the case of Vietnam, a developing country with a per capita income of approximately USD2000 and a large population facing diverse health issues [11]. In terms of periodic GHE, Vietnam’s healthcare lacks sustainability on both the institutional and individual levels. First, there is little regulation in this area. Most governmental efforts focus on health insurance, namely the expansion of insurance coverage, the positive effects of which have been debated and refuted [12]. Otherwise, health-related programs mostly concern health communication—often at a rather rudimentary level such as education on basic hygiene—and improvement of infrastructure. This mostly applies to rural areas in order to compensate for the fact that the health system is still largely centralized, with many rural patients risking destitution to travel to larger cities to receive treatment [13]. This could result in overpopulation of central hospitals in large cities, especially during disease outbreaks, which clogs the flow of patients and leads to lower treatment quality—characteristics of an unsustainable health system [14].
Second, on the individual level, employers are required to organize at least one GHE every six months for heavy manual workers and every year for other employees [15]. People are, however, skeptical about the quality of these enforced check-ups [16] and for a good reason: no regulations exist regarding GHE, creating legal loopholes for employers to cut down on costs by organizing inadequate check-ups. This means that the only health checkups that should “count” are those taken by people on their own initiative. Yet most people only willingly perform health examinations when they suspect they have a health-related condition, which may lead to late discovery of illness and higher treatment costs later, exacerbating the risk of financial difficulty for individuals from rural areas.
1.2. Sex and Psychological Differences Involved in Health Behaviors
Although there are doubts over the relationship between gender and periodic health examination [17], numerous reports provide evidence that women have more healthy habits and use health services more often than men do [18,19,20,21,22,23,24,25]. In the U.S, several survey results have concluded that men have higher mortality rates [26,27,28] despite overestimating their own health status [29]. This behavior was also observed among male university students in Canada, the majority of whom rated their health status as “very good”, whereas female students admitted their health to be just “good”, or lower [30].
While several reasons ranging from personality to actual health conditions could account for such behavior, the differences of the sexes undoubtedly provide some explanation [17,19,31]. Women may be more sensitive and able to perceive more subtle signals from their own body [32]. With a positive attitude towards healthcare and diseases prevention, women tend to detect health problems early on, while men mostly perform medical examinations when obliged to, such as for work purposes or during the process of acquiring insurance [33,34]. Aside from the biological differences of the two sexes, social factors might also explain the diverging behaviors of men and women regarding healthcare. For instance, in traditional views, men tend to (falsely) think of themselves as less susceptible to injuries or illness [29,35]. This mentality may be rooted in traditional gender roles: A man is the family’s breadwinner and usually accepts higher workplace risks while a woman has a higher priority for health matters of the family, which includes that of her own [30,36]; nevertheless, perceptions of healthcare might vary under the effects of marriage [37]. Considering the influence of family members’ health status on the decisions regarding GHEs, there is evidence showing that women tend to spend less money on GHE than men and will consider GHE fees before deciding to participate [7,38,39,40,41,42]. But if a family member is seriously sick or dying, women’s anxiety over health status will significantly increase and affect their healthcare decisions [43].
The survey of related literature shows a considerable difference in healthcare decision-making between the sexes. However, it is still not clear, for example, how the differences in men and women’s GHEs participation are associated with psychological factors such as a family member suffering from prolonged treatment or the fear of finding out one’s own illness.
1.3. Psychological Factors and GHEs Participation
The voluminous literature on health beliefs has long explored the complex relationship between psychological factors and healthcare behaviors [44,45]. For example, a study finds people who feel healthy at the moment as one of the reasons for not attending GHEs [46], another shows that non-attenders tend not to value health as strongly, have low self-efficacy, feel less in control of their health and be less likely to believe in the efficacy of health checks [47]. In contrast, it is known that those with a relatively good health condition, taking medical examinations and receiving advice from health experts about diseases prevention tend to improve their health status, helping to reduce the number of visits to health professionals [48]. In addition, as periodic GHEs only perform a number of standard tests for early symptoms, they should not cause a build-up of psychological hesitations [12,17,49].
Studies confirm that spending money on preventive health practice such as general physical examinations is a complicated decision, in particular when psychological factors are taken into account. However, the literature seems to overlook the influence of the fear of finding out one’s own illness and the experience of having one’s family members or close relatives going through long-term medical treatment. This study will (i) demonstrate the correlation among the sexes, the health status of relatives/friends and people’s reluctance to take health checkups due to worries over potential discovery of illness; and (ii) provide empirical evidence on the association between the time gap since the last health checkup and the fear of uncovering any health problems with the propensity of taking up GHEs.
2. Materials and Methods
2.1. Sample
The dataset of the study was collected in various clinics, hospitals, companies, schools and households in Hanoi and its surrounding areas. It was conducted by the Vuong & Associates research team during the last quarter of 2016, under the ethical standards and institutional approval numbered V&A/07/2016 (12 September 2016), following which a statement of research ethics is provided at the end of each questionnaire (the participants will be anonymized; all information collected will be used for only research purposes; the participants are free to leave the interview at any point of their own choosing). Overall, the survey team approached 2479 people; one out of six declined to take part in the study. The time for each interview was 10–15 min/questionnaire. In the end, the final sample size was 2068 subjects. The data descriptor of the final dataset has been approved by Nature Research [50,51] and it was deposited at both Open Science Framework and Harvard’s Dataverse [51] according to the principle of open data and scientific transparency [52].
2.2. Procedures
Raw data are entered in MS Excel then converted into CSV. Data treatment and categorical structuring for multi-way contingency data tables are performed in R 3.3.1. The actual estimating of statistical coefficients, and computing relevant test statistics, employs the baseline-categorical logit (BCL) model, enabling the exploring of possible relationships among the concerning variables through different specifications depending upon choices of response and predictor variables [46]. The following passages give an overview of the descriptive statistics.
Among 2068 respondents, the percentage of young people (<30 years old) accounts for the majority (63.15%), and the proportion of respondents aged 50 or more (≥50 years) is very small, only about 5.67% (Table 1). It is worth noting that 64.08% respondents were female, which was significantly skewed compared to the man-to-woman ratio of 97.5:100 for the entire country and 96.7:100 for Hanoi (2017 preliminary statistics provided by the General Statistics Office of Vietnam—citation later). Women appear to have accepted interviews more often than men; this observation shall be further discussed later in this article.

Table 1.
Descriptive statistics.
More than 3/4 of the survey respondents said they were not concerned about participating in periodic GHEs due to possible disease detection but rather due to other causes: too time-consuming (51.69%), financially costly (37.23%), low confidence in the quality of service (26.78%), or feeling that GHEs aren’t urgent or important (51.89%).
Notably, about 2/3 of the respondents had their most recent check-up less than 12 months ago (66.39%) with the main reasons being early symptoms of a health problem (35.30%) and at the request of the employers (35.11%). The remaining reasons are due to public rumors or unofficial information about some epidemic or disease outbreaks (4.74%), and self-perceived needs of health checkups (24.85%).
Concerning health status of relatives/friends of the participants, 44.34% had friends or relatives who had been or were currently under long-term treatment, while the remainder had relatives/friends in good health and who had never received long-term treatment. In addition, over 90% of those interviewed said that if they had enough time and money, GHEs should be taken once or twice a year. Still 9.28% thought that attending GHEs should take place every 18 months or even longer. The hesitation toward GHE due to possible discovery of diseases in relation to the appropriate examination time is described in Figure 1.
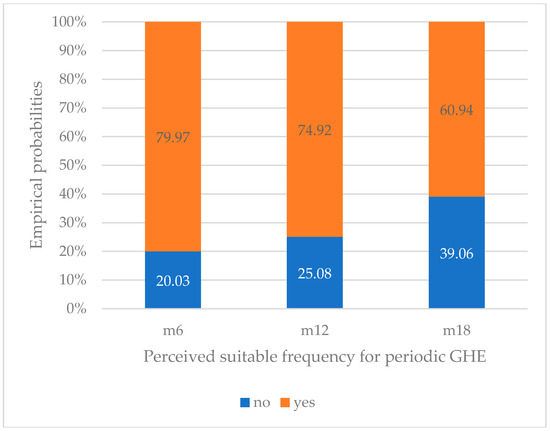
Figure 1.
Relationship between fear of illness detection and perceived suitable GHE frequency (date from Table S1).
In Figure 1, it can be seen that the proportion of people afraid of detecting illnesses through periodic GHE (“yes”) at the appropriate time of 6 months (“m6”) is the highest, and this percentage decreases as the time gap since the participant’s most recent GHE increases.
2.3. Measures
Specifically, in this article, two kinds of probability will be measured:
- (i)
- The probability of a person hesitant to take periodic general health examination due to fear of discovering one’s disease (coded as “DiscDisease”) against sex (“Sex”) and whether their friends or family have gone through long-term treatment (“AcqTrmt”);
- (ii)
- The probability of perceived appropriate periodic GHE frequency (6 months, 12 months, ≥18 months) (“SuitFreq”) against the time since their last visit to a doctor (“RecExam”) and the fear of diseases detection (“DiscDisease”).
2.4. Analysis
The baseline-categorical logit model has been employed in order to investigate the probability of the dependent variable against both independent variables simultaneously.
The estimated coefficients in multivariable logistic models are used to calculate the empirical probabilities. The statistical significance of predictor variables in the model are determined based on z-value and p-value (p); with p < 0.05 being the conventional level of statistical significance required for a positive result. The general equation of the baseline-categorical logit model is:
in which x is the independent variable; and πj(x) = P(Y = j|x) its probability. Thus πj = P(Yij = 1) with Y being the dependent variable [53].
ln(πj(x)/πJ(x)) = αj + βjTx, j = 1,…, J−1.
In the logit model, the probability of an event, among a distribution {πj(x)}, is computed as:
with ∑jπj(x) = 1; αJ = 0 and βJ = 0; in which n is the number of observations in the sample, j the categorical values of an observation i, and h a row in basic matrix Xi. Estimated probabilities can be used to predict the possibilities of Y in different conditions of Xi [13,50,51,53,54].
πj(x) = exp(αj + βjTx)/(1 + J−1∑(h−1)exp(αj + βjTx))
Applying the regression model, first, the relationship between hesitation towards GHE due to fear of disease discovery associated with sex differences and health status of friends/relatives. The dependent variable is “DiscDisease” (hesitation due to possible disease detection) with two categories “Yes” and “No”. The dependent variables are “Sex”, having values of “Male” and “Female”; and “AcqTrmt” (the status of the respondents having friends/relatives undertaking a long-term medical treatment), which can be true (“Yes”) or false (“Never”). The results give statistically significant (p < 0.0001) coefficients which help to establish an empirical relationship as provided in Table 2.
Table 2.
Estimation results of the response “DiscDisease” and the predictor “Sex” and “AcqTrmt”.
From the results above, the regression equation (Equation (1)) is derived.
ln(πyes/πno) = −1.155 − 0.409 × male.Sex + 0.221 × yes.AcqTrmt
According to Equation (1), in order to calculate the probability of a man being afraid of GHE and having friends/relatives experiencing long-term treatment, the following formula is employed:
πyes = e−1.155−0.409+0.221/(1 + e−1.155−0.409+0.221) = 0.207
Next, periodic GHE behaviors are assessed through the dependent variable—the perceived suitable frequencies of GHE (“SuitFreq”): every 6 months (“m6”), every 12 months (“m12”), and every 18 months or more (“m18”). The first factor that is supposed to have an impact on the people’s behavior is the fear of diseases, represented by the variable of “DiscDisease”, having one of the two categorical values: “Yes” and “No”. The second factor, the time since a respondent’s most recent medical examination (“RecExam”), is also taken into account and divided into four categories: <12 months (“less12”), 12–24 months (“b1224”), more than 24 months (“g24”), and forgotten/never attending (“unknown”). Actual estimations for logistic regression models report that almost all estimate coefficients are highly significant with <0.01. Detailed results are presented in Table 3.
Table 3.
Estimating the response “SuitFreq” against the predictor “RecExam” and “DiscDisease”.
The equations of Equations (2) and (3) below help to quantify the influence of the time since the participant’s most recent doctor visit and psychological concerns to diseases on perceivably appropriate GHE frequency.
ln(πm6/πm18) = 2.026 + 0.854 × less12.RecExam − 0.588×g24.RecExam
− 1.085 × unknown.RecExam − 0.838 × yes.DiscDisease
− 1.085 × unknown.RecExam − 0.838 × yes.DiscDisease
ln(πm12/πm18) = 1.793 + 0.277 × less12.RecExam − 0.865×g24.RecExam
− 1.553 × unknown.RecExam − 0.594 × yes.DiscDisease
− 1.553 × unknown.RecExam − 0.594 × yes.DiscDisease
Modifying Equations (2) and (3), we can obtain πm6 on the conditions of “RecExam” = “less12” and “DiscDisease” = “Yes” according to the following formula:
πm6 = e2.026 + 0.854−0.838/(1 + e2.026 + 0.854−0.838 + e1.793 + 0.277−0.594) = 0.589
3. Results
3.1. Fear of Disease Detection in GHE Decisions
Other conditional probabilities are computed likewise, with the empirical results being reported in Table 4.
Table 4.
Probability of hesitation toward GHE due to disease detection as influenced by the sex and health status of friends or relatives.
It is clear from Table 4 that both men and women are significantly more likely not to be afraid of finding out their own health problems through GHEs (from nearly 72% to 83% probability) whether they have friends or family members who go through long-term medical treatment or not.
For people afraid of discovering their own diseases, women are about 7–8 percentage points more likely to be reluctant to attend a health exam. By contrast, the probability of being afraid of disease detection in GHE is lower in men. It is of interest to observe the calculated coefficients as they evaluate the extent to which psychological factors affect participants’ hesitation toward periodic GHE (Equation (1)). Notably, the coefficient of the variable “Sex” at “male” is negative (β1 = −0.409 with p < 0.001), meaning that πyes of male participants is smaller than that of females. This is also confirmed by the probabilities in Table 3. However, the difference between men and women is not too large.
Table 3 also reveals that those who have friends or relatives who used to suffer from long-time treatment are more likely to fear disease detection as a reason to their hesitation toward periodic GHE. For example, if a woman has relatives or friends who have experienced long-time therapy, the probability of her hesitating to take periodic GHE is 28.2%, but this figure will drop to 24% if her friends or relatives have good health.
3.2. Correlates of Perception on the Appropriate GHE Frequencies
Table 5 below shows the probability of selecting the appropriate periodic GHE frequencies controlling the time since the most recent doctor visit and the fear of detecting diseases through check-ups.
Table 5.
Probabilities of periodic GHE frequencies perceived as suitable based on the time since the participant’s most recent doctor visits and the fear of detecting disease through check-ups.
Table 5 shows that participants are most inclined to attend a regular health check every 6 months regardless of having fear of finding out their own health problems or visiting the doctor recently (from 39.4% to 66.6%). Opinions on a checkup every 12 months appear neutral, fluctuating from 25% to 43.7%. By contrast, the frequency of every 18 months marks the widest range of probability, from 3.8% up to 35.6%.
Looking at the finer details, one can see that regardless of the fear of discovering one’s own illness, those who have visited the doctor within the last two years tend to have a very low probability of seeing 18 months as an appropriate frequency for GHE uptake (3.8–13.1%).
The probability of a person seeing every six months as an appropriate frequency for GHE is shown to increase from 9 to 13 percentage points if the person is not afraid of discovering one’s own illness. The pattern reverses for the 12 months and 18 months frequency.
When it comes to people’s behaviors toward periodic GHEs, from Equations (2) and (3), it can be seen that apart from intercepts, the coefficient at “unknown” of “RecExam” has the largest absolute value (β3 = ∑1.085 with p-value < 0.001 at Equation (2) and β3 = ∑1.553 with p-value < 0.001 at Equation (3)). Thus, out of all the time values since the patient’s most recent doctor visit, it is in reality the “unknown” variable that has a significant impact on the likelihood of people believing that periodic GHE should be taken every 6 or 12 months. Figure 2 depicts the impact tendencies of “RecExam” and “DiscDisease” on participants’ perception of suitable GHE frequencies.
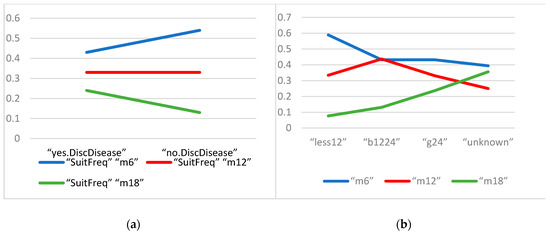
Figure 2.
(a) Changes in preferred periodic GHE frequencies of those who last visited doctors 2 years ago; (b) Changes in preferred periodic GHE frequencies as perceived by those who are afraid of figuring out diseases through periodic GHEs (date from Tables S2 and S3).
Figure 2a depicts changes in the preferred periodic GHE frequencies of those who last visited doctors two years ago. It can be easily observed that the line of “m6” goes upward and “m18” downward as they move from “yes.DiscDisease” (afraid of detecting disease) to “no.DiscDisease” (not afraid). In other words, people without the fear of detecting their own illness through GHE are more likely to perceive every six months as the appropriate frequency for the service and less likely to perceive every 18 months as appropriate. For the frequency of every 12 months, the line “m12” lays nearly horizontal, showing that both ready patients and hesitating patients have nearly the same propensity to take periodic GHE every 12 months.
Figure 2b presents the changes in suitable periodic GHE frequencies as perceived by those who are afraid of figuring out diseases through periodic physical exams. It can be remarked that when moving from the point “less12” to “unknown”, the probability line of “m6” goes downward from nearly 60% to almost 40%, whereas the “m18” has an opposite slope from 7.7% to nearly 36%. In particular, the “m12” line is broken at the point “b1224” but then continues going down. In summary, the longer the time since the last doctor visit, the less likely that a person would accept attending periodic GHE every six or 12 months.
4. Discussion
This study has shown the high probability of a person, regardless of his or her sex, not to be afraid of finding out his or her own health problems through GHEs (from nearly 72% to 83% probability), regardless of having friends or family who go through long-term medical treatment. This result is not surprising given that most people often cited reasons of a practical nature for not attending health examination, such as a lack of time or hindrances at work [46,47]. However, reluctance toward regular health checks doesn’t only stem from concerns over a lack of resources, such as time or money [55]; psychological factors, such as the fear of discovering a potential negative health condition, as this study has shown, could also influence people’s decision-making regarding the services. Among the notable results, the probability of hesitating to take GHE due to the fear of discovering diseases is about 7–8 percentage points higher in women, while the pattern reverses for men. In other words, women are more likely than men to be reluctant to take GHE due to the fear of potential illness detection. This behavioral pattern is attributable to the viewpoint that in a society such as Vietnam, women are traditionally viewed as more vulnerable. However, the literature in Western countries seems to show women to be more likely to use health screening services [19,20,47,51], thus suggesting the result obtained in this study might only be generalizable in patriarchal cultures.
Another counter-intuitive result is the hesitation toward periodic health check-ups among those whose friends or relatives used to suffer from long-term treatment. One would expect someone who knows how taxing illnesses can be through witnessing experiences of their closed ones to be more careful and inclined towards having periodic GHE. This behavior, driven by the fear of detecting one’s potential illness, might be explained by a number of factors: the trauma caused by witnessing the long-term medical treatment of family friends, or perhaps, the financial constraints when the ill person happens to be dependent on a respondent to some degree [6,10,55,56,57].
The study also confirms that the average person is most likely to see “every six months” as an appropriate frequency for GHE, regardless of their fear of finding out their own health problems, and of the length of time since their most recent doctor visit. However, when looking at more details, the probability of a person seeing “every six months” as an appropriate frequency for GHE is shown to increase slightly if the person is not afraid of the potential of detecting an illness. This pattern is the opposite for the 12 months and 18 months frequency. That means having fear of facing the possibility of discovering illness through GHEs is associated with a higher probability of delaying GHE and widening the gap between each check-up. This procrastination is interesting given the literature on the subject tends to focus on the binary choice of attending or not-attending [8,19,31,47]. In fact, this touches upon a new dimension of the quality and effectiveness of periodic GHE that had not been discussed in the extant literature, which is its frequency. This is especially important as some countries have regulations concerning periodic GHE and its frequency while others might not.
Regarding how the time since the most recent doctor visit is associated with the perceived appropriate frequency of GHE, those who have visited the doctor within the last two years tend to have a very low probability of seeing every 18 months as an appropriate frequency (3.8–13.1%). This might just be because they are still being monitored by professional healthcare personnel, either in treatment or post-treatment recovery. But their higher level of concerns over health matters can also be due to their past experience with being ill: they pay more attention to healthcare because they understand the importance of having check-ups regularly. In other words, they have “learned their lesson,” and are much more willing to take GHE on a regular basis. This result is intuitive and, interestingly, in stark contrast with the behavior of those who have witnessed friends or relatives cope with diseases. It seems that for more sustainable health behaviors such as more frequent GHE, firsthand experience with illness is more motivating factor compared with merely witnessing health struggles.
Although this study has offered some insights into the behaviors and psychology of GHE decision-making, it is not without limitations. First, regarding the sample itself, the survey is limited to the vicinity of Hanoi, Vietnam, thus, the results presented here should be interpreted with care. The sample is also skewed in regards to biological sex, with over 64 percent participants being female, hence, this skewness’s effect on the representativeness should be taken into account when conducting any analysis of the dataset. Second, there are other psychological factors that are involved in health-related behaviors that the paper has not been able to examine. For example, there can be certain misconceptions about the utility and purpose of the health check-up [2,5,6] that might make people less inclined to take up the service. There can be a central role for the view of a person on uncertainty in the decision of attending a GHE or not [51]. Finally, it is arguable that health behaviors are influenced by cultural factors, for example, people in different cultures might have different patterns in spending, reasoning or procrastinating, etc. [58]. Hence, future studies should take into account cultural differences in health behaviors.
5. Conclusions
This paper has presented a statistical analysis using the baseline-category logit model to explore how the factors of sex differences and having family members/friends going through a long-term medical treatment are associated with the fear of discovering one’s own illness through GHEs. Results confirm that the majority of participants do not hesitate to take periodic GHE out of fear of discovering illnesses. However, being a woman and having family members or friends going through a long-term medical treatment are factors that are shown to increase the probability of reluctance towards periodic GHE due to that fear. This clashes with the extant literature dominated by studies done in developed Western countries as well as with rationality and perhaps implies that it is a feature unique to Vietnam and similar countries.
The paper also investigates how the fear of discovering one’s own illness and the time since the most recent doctor visit are associated with the perception of appropriate frequency for GHE. The most notable result is that fear of illness discovery will increase the probability of widening the gap between each GHE. In addition, having had a doctor visit within two years is associated with a very low probability of perceiving a large time gap between general health check-ups as appropriate. The results are shown to add to the literature on GHE decision-making, which seems to dominantly focus on the binary choice of participation or non-participation in GHE and still has a gap regarding the associated psychological factors in preventive health behaviors.
Supplementary Materials
The following are available online at http://www.mdpi.com/2071-1050/11/2/514/s1, Table S1: Distribution of patients against psychological hesitation towards periodic GHE due to diseases discovering and perceivably suitable periodic GHE frequency (Data used for Figure 1), Table S2: Changes in probability of perceivably suitable periodic GHE frequency of those having the last doctor visit 2 years ago (Data used for Figure 2a), Table S3: Changes in probability of perceivably suitable periodic GHE frequency of those who have hesitation towards GHE due to disease identification (Data used for Figure 2b).
Author Contributions
Conceptualization, Q.-H.V.; methodology, Q.-H.V.; validation, T.-H.K. and K.T.; formal analysis, T.-T.V. and V.-P.L.; investigation, K.-C.N.P., V.-P.L. and T.-T.V.; data curation, K.-C.N.P. and T.-T.V.; writing—original draft preparation, T.T.V., M.-T.H., and H.K.T.N.; writing—review and editing, Q.H.V., T.-T.V., M.-T.H., and H.-K.T.N.; visualization, T.-T.V. and K.-C.P.N.; supervision, Q.-H.V.; project administration, Q.H.V. and K.T.
Funding
The research was conducted independently and received no funding from any public or private institutions. The authors were responsible for all expenditures during the investigation.
Acknowledgments
The authors would like to express a deep sense of gratitude towards the respondents of the study, without whom, this research cannot be done. The authors would like to thank several people at Vuong & Associates for their assistance in collecting the data, particularly Dam Thu Ha, Do Thu Hang, Do Phuong Ngoc, Nguyen Thi Phuong, Mai Anh Tuan.
Conflicts of Interest
The authors declare no conflict of interest.
Data availability
The description of how the datasets of this study were generated and processed could be found at [50]. The complete datasets could be found in Open Science Framework: https://osf.io/afz2w/ and Harvard Dataverse: https://doi.org/10.7910/DVN/CWHOIC.
References
- Holland, W. Periodic health examination: History and critical assessment. EuroHealth 2009, 15, 16–20. [Google Scholar]
- Roberts, N.T. The values and limitations of periodic health examinations. J. Chronic Dis. 1959, 9, 95–116. [Google Scholar] [CrossRef]
- Dobell, H. Lectures on the Germs and Vestiges of Disease, and on the Prevention of the Invasion and Fatality of Disease by Periodical Examinations. Available online: https://www.ncbi.nlm.nih.gov/pmc/articles/PMC5180312/pdf/brforeignmcrev72757-0171.pdf (accessed on 18 January 2018).
- Emerson, H. Periodic medical examinations of apparently healthy persons. JAMA J. Am. Med. Assoc. 1923, 80, 1376. [Google Scholar] [CrossRef]
- Han, P.K.J. Historical Changes in the Objectives of the Periodic Health Examination. Ann. Intern. Med. 1997, 127, 910. [Google Scholar] [CrossRef]
- Oboler, S.K.; Prochazka, A.V.; Gonzales, R.; Xu, S.; Anderson, R.J. Public Expectations and Attitudes for Annual Physical Examinations and Testing. Ann. Intern. Med. 2002, 136, 652. [Google Scholar] [CrossRef]
- Zielhuis, G.A. Are periodic school health examinations worthwhile? Health Policy 1985, 5, 241–253. [Google Scholar] [CrossRef]
- Wu, H.-Y.; Yang, L.-L.; Zhou, S. Impact of periodic health examination on surgical treatment for uterine fibroids in Beijing: A case-control study. BMC Health Serv. Res. 2010, 10. [Google Scholar] [CrossRef]
- Burton, L.C.; Steinwachs, D.M.; German, P.S.; Shapiro, S.; Brant, L.J.; Richards, T.M.; Clark, R.D. Preventive services for the elderly: Would coverage affect utilization and costs under Medicare? Am. J. Public Health 1995, 85, 387–391. [Google Scholar] [CrossRef] [PubMed]
- Nakanishi, N.; Tatara, K.; Fujiwara, H. Do preventive health services reduce eventual demand for medical care? Soc. Sci. Med. 1996, 43, 999–1005. [Google Scholar] [CrossRef]
- Vuong, Q. The financial economy of Viet Nam in an age of reform, 1986–2016. In Routledge Handbook of Banking and Finance in Asia; Volz, U., Morgan, P., Yoshino, N., Eds.; Routledge T&F: London, UK, 2019. [Google Scholar]
- Vuong, Q.-H.; Vu, Q.-H.; Vuong, T.-T. What makes Vietnamese (not) attend periodic general health examinations? A 2016 cross-sectional study. Osong Public Health Res. Perspect. 2017, 8, 147–154. [Google Scholar] [CrossRef] [PubMed]
- Vuong, Q.H. Be rich or don’t be sick: Estimating Vietnamese patients’ risk of falling into destitution. SpringerPlus 2015, 4. [Google Scholar] [CrossRef] [PubMed]
- Fineberg, H.V. A Successful and Sustainable Health System—How to Get There from Here. N. Engl. J. Med. 2012, 366, 1020–1027. [Google Scholar] [CrossRef] [PubMed]
- International Cooperation Department. Labour Codes, General Labour and Employment Acts; Ministry of Labour, Official Gazette: Hanoi, Vietnam, 2012; Volume 2012, pp. 48–78. [Google Scholar]
- LĐO. Kham Suc Khoe Dinh Ky Cho Vui [Periordic Health Check-Ups for Fun]. Available online: https://laodong.vn/suc-khoe/kham-suc-khoe-dinh-ky-cho-vui-584383.ldo (accessed on 25 December 2018).
- Nupponen, R. Client views on periodic health examinations: Opinions and personal experience. J. Adv. Nurs. 1996, 23, 521–527. [Google Scholar] [CrossRef] [PubMed]
- Liang, W. A population-based study of age and gender differences in patterns of health-related behaviors. Am. J. Prev. Med. 1999, 17, 8–17. [Google Scholar] [CrossRef]
- Pinkhasov, R.M.; Wong, J.; Kashanian, J.; Lee, M.; Samadi, D.B.; Pinkhasov, M.M.; Shabsigh, R. Are men shortchanged on health? Perspective on health care utilization and health risk behavior in men and women in the United States. Int. J. Clin. Pract. 2010, 64, 475–487. [Google Scholar] [CrossRef]
- Waldron, I. Sex differences in illness incidence, prognosis and mortality: Issues and evidence. Soc. Sci. Med. 1983, 17, 1107–1123. [Google Scholar] [CrossRef]
- Cleary, P.D.; Mechanic, D.; Greenley, J.R. Sex Differences in Medical Care Utilization: An Empirical Investigation. J. Health Soc. Behav. 1982, 23, 106. [Google Scholar] [CrossRef] [PubMed]
- Hibbard, J.H.; Pope, C.R. Gender roles, illness orientation and use of medical services. Soc. Sci. Med. 1983, 17, 129–137. [Google Scholar] [CrossRef]
- Verbrugge, L.M.; Wingard, D.L.; Features Submission, H.C. Sex Differentials in Health and Mortality. Women Health 1987, 12, 103–145. [Google Scholar] [CrossRef]
- Courtenay, W.H. Constructions of masculinity and their influence on men’s well-being: A theory of gender and health. Soc. Sci. Med. 2000, 50, 1385–1401. [Google Scholar] [CrossRef]
- Woodwell, D. National Ambulatory Medical Care Survey, 1996. In ICPSR Data Holdings; Inter-University Consortium for Political and Social Research (ICPSR): California, CA, USA, 1998. [Google Scholar]
- United Nations Statistics Division. Demographic Yearbook 2003. Available online: https://unstats.un.org/unsd/demographic-social/products/dyb/dybsets/2003%20DYB.pdf (accessed on 18 January 2019).
- Kung, H.-C.; Hoyert, D.L.; Xu, J.; Murphy, S.L. Deaths: Final data for 2005. Natl. Vital. Stat. Rep. 2008, 56, 1–120. [Google Scholar] [PubMed]
- Publications S.S.O.A. Actuarial Studies. Available online: http://www.ssa.gov/OACT/NOTES/actstud.html (accessed on 24 May 2018).
- Davies, J.; McCrae, B.P.; Frank, J.; Dochnahl, A.; Pickering, T.; Harrison, B.; Zakrzewski, M.; Wilson, K. Identifying Male College Students’ Perceived Health Needs, Barriers to Seeking Help, and Recommendations to Help Men Adopt Healthier Lifestyles. J. Am. Coll. Health 2000, 48, 259–267. [Google Scholar] [CrossRef] [PubMed]
- Dawson, K.A.; Schneider, M.A.; Fletcher, P.C.; Bryden, P.J. Examining gender differences in the health behaviors of Canadian university students. J. R. Soc. Promot. Health 2007, 127, 38–44. [Google Scholar] [CrossRef] [PubMed]
- Jepson, R.; Clegg, A.; Forbes, C.; Lewis, R.; Sowden, A.; Kleijnen, J. The determinants of screening uptake and interventions for increasing uptake: A systematic review. Health Technol. Assess 2000, 4, 1–133. [Google Scholar]
- Van Wijk, C.M.T.G.; Kolk, A.M. Sex differences in physical symptoms: The contribution of symptom perception theory. Soc. Sci. Med. 1997, 45, 231–246. [Google Scholar] [CrossRef]
- Franks, P.; Clancy, C.M.; Gold, M.R.; Nutting, P.A. Health insurance and subjective health status: Data from the 1987 National Medical Expenditure survey. Am. J. Public Health 1993, 83, 1295–1299. [Google Scholar] [CrossRef]
- Sullivan, T.J.; Andersen, R.; Lion, J.; Anderson, O.W. Two Decades of Health Services: Social Survey Trends in Use and Expenditure. Soc. Forces 1978, 56, 970. [Google Scholar] [CrossRef]
- Addis, M.E.; Mahalik, J.R. Men, masculinity, and the contexts of help seeking. Am. Psychol. 2003, 58, 5–14. [Google Scholar] [CrossRef]
- Mahedy, L.; Todaro-Luck, F.; Bunting, B.; Murphy, S.; Kirby, K. Risk factors for psychological distress in Northern Ireland. Int. J. Soc. Psychiatry 2012, 59, 646–654. [Google Scholar] [CrossRef]
- Vuong, Q.-H.; Vuong, T.-T.; Ho, T.; Nguyen, H. Psychological and Socio-Economic Factors Affecting Social Sustainability through Impacts on Perceived Health Care Quality and Public Health: The Case of Vietnam. Sustainability 2017, 9, 1456. [Google Scholar] [CrossRef]
- Ladwig, K.-H.; Marten-Mittag, B.; Formanek, B.; Dammann, G. Gender differences of symptom reporting and medical health care utilization in the German population. Eur. J. Epidemiol. 2000, 16, 511–518. [Google Scholar] [CrossRef]
- Jianakoplos, N.A.; Bernasek, A. Are women more risk averse? Econ. Inq. 1998, 36, 620–630. [Google Scholar] [CrossRef]
- Croson, R.; Gneezy, U. Gender Differences in Preferences. J. Econ. Lit. 2009, 47, 448–474. [Google Scholar] [CrossRef]
- Donna, R. Women Are Better Retirement Savers than Men, But Still Have a Lot Less Money. Available online: http://time.com/money/3911377/retirement-401ks-women-men/ (accessed on 18 January 2019).
- Lucy, B. The Truth about Our Economy’s Gender Divide? Women Are Saving More Money—But They Won’t Invest. Available online: http://www.independent.co.uk/voices/the-truth-about-our-economys-gender-divide-women-save-more-money-but-they-wont-invest-a6942596.html (accessed on 21 May 2018).
- Wennman-Larsen, A.; Tishelman, C. Advanced home care for cancer patients at the end of life: A qualitative study of hopes and expectations of family caregivers. Scand. J. Caring Sci. 2002, 16, 240–247. [Google Scholar] [CrossRef]
- Rosenstock, I.M. The Health Belief Model and Preventive Health Behavior. Health Educ. Monogr. 1974, 2, 354–386. [Google Scholar] [CrossRef]
- Skinner, C.; Tiro, J.; Champion, V. The health belief model. In Health Behavior: Theory, Research, and Practice, 5th ed.; Glanz, K., Rimer, B., Viswanath, K., Eds.; Jossey-Bass: San Francisco, CA, USA, 2015. [Google Scholar]
- Wall, M.; Teeland, L. Non-participants in a preventive health examination for cardiovascular disease: Characteristics, reasons for non-participation, and willingness to participate in the future. Scand. J. Prim. Health Care 2004, 22, 248–251. [Google Scholar] [CrossRef]
- Dryden, R.; Williams, B.; McCowan, C.; Themessl-Huber, M. What do we know about who does and does not attend general health checks? Findings from a narrative scoping review. BMC Public Health 2012, 12. [Google Scholar] [CrossRef]
- Burton, L.C.; German, P.S.; Shapiro, S. A Preventive Services Demonstration. Med. Care 1997, 35, 1149–1157. [Google Scholar] [CrossRef]
- Boland, B.J.; Wollan, P.C.; Silverstein, M.D. Yield of laboratory tests for case-finding in the ambulatory general medical examination. Am. J. Med. 1996, 101, 142–152. [Google Scholar] [CrossRef]
- Vuong, Q.-H. Survey data on Vietnamese propensity to attend periodic general health examinations. Sci. Data 2017, 4, 170142. [Google Scholar] [CrossRef]
- Vuong, Q.-H.; Ho, T.-M.; Nguyen, H.-K.; Vuong, T.-T. Healthcare consumers’ sensitivity to costs: A reflection on behavioural economics from an emerging market. Palgrave Commun. 2018, 4. [Google Scholar] [CrossRef]
- Vuong, Q.-H.; La, V.-P.; Vuong, T.-T.; Ho, M.-T.; Nguyen, H.-K.T.; Nguyen, V.-H.; Pham, H.-H.; Ho, M.-T. An open database of productivity in Vietnam’s social sciences and humanities for public use. Sci. Data 2018, 5, 180188. [Google Scholar] [CrossRef] [PubMed]
- Agresti, A. Categorical Data Analysis; John Wiley & Sons, Inc.: New York, NY, USA, 2002. [Google Scholar]
- Vuong, Q.; Nguyen, T. Vietnamese patients’ choice of healthcare provider: In search of quality information. Int. J. Behav. Healthcare Res. 2015, 5, 184–212. [Google Scholar] [CrossRef]
- Kuo, R.N.; Lai, M.-S. The influence of socio-economic status and multimorbidity patterns on healthcare costs: A six-year follow-up under a universal healthcare system. Int. J. Equity Health 2013, 12, 69. [Google Scholar] [CrossRef] [PubMed]
- Sun, X.; Chen, Y.; Tong, X.; Feng, Z.; Wei, L.; Zhou, D.; Tian, M.; Lv, B.; Feng, D. The use of annual physical examinations among the elderly in rural China: A cross-sectional study. BMC Health Serv. Res. 2014, 14. [Google Scholar] [CrossRef] [PubMed]
- Horner, S.D.; Ambrogne, J.; Coleman, M.A.; Hanson, C.; Hodnicki, D.; Lopez, S.A.; Talmadge, M.C. Traveling for Care: Factors Influencing Health Care Access for Rural Dwellers. Public Health Nurs. 1994, 11, 145–149. [Google Scholar] [CrossRef]
- Vuong, Q.-H.; Bui, Q.-K.; La, V.-P.; Vuong, T.-T.; Nguyen, V.-H.T.; Ho, M.-T.; Nguyen, H.-K.T.; Ho, M.-T. Cultural additivity: Behavioural insights from the interaction of Confucianism, Buddhism and Taoism in folktales. Palgrave Commun. 2018, 4, 143. [Google Scholar] [CrossRef]


© 2019 by the authors. Licensee MDPI, Basel, Switzerland. This article is an open access article distributed under the terms and conditions of the Creative Commons Attribution (CC BY) license (http://creativecommons.org/licenses/by/4.0/).