Article

Interaction of Diet and Ozone Exposure on Oxidative Stress Parameters within Specific Brain Regions of Male Brown Norway Rats

by
Joseph M. Valdez
1,†,
Andrew F. M. Johnstone
1,†,
Judy E. Richards
2,
Judith E. Schmid
1,
Joyce E. Royland
3 and
Prasada Rao S. Kodavanti
1,*
1
Neurotoxicology Branch, Toxicity Assessment Division, NHEERL/ORD, U.S. Environmental Protection Agency, Research Triangle Park, NC 27711, USA
2
Environmental Public Health Division, NHEERL/ORD, U.S. Environmental Protection Agency, Research Triangle Park, NC 27711, USA
3
Integrated Systems Toxicology Division, NHEERL/ORD, U.S. Environmental Protection Agency, Research Triangle Park, NC 27711, USA
*
Author to whom correspondence should be addressed.
These authors contributed equally to this work.
Int. J. Mol. Sci. 2019, 20(1), 11; https://doi.org/10.3390/ijms20010011
Submission received: 2 November 2018 / Revised: 29 November 2018 / Accepted: 18 December 2018 / Published: 20 December 2018
(This article belongs to the Special Issue Mitochondrial Dysfunction and Oxidative Damage)

Abstract

:
Oxidative stress (OS) contributes to the neurological and cardio/pulmonary effects caused by adverse metabolic states and air pollutants such as ozone (O3). This study explores the interactive effects of O3 and diet (high-fructose (FRUC) or high–fat (FAT)) on OS in different rat brain regions. In acute exposure, there was a decrease in markers of reactive oxygen species (ROS) production in some brain regions by diet and not by O3. Total antioxidant substances (TAS) were increased in the cerebellum (CER) and frontal cortex (FC) and decreased in the striatum (STR) by both diets irrespective of O3 exposure. Protein carbonyls (PC) and total aconitase decreased in some brain regions irrespective of exposure. Following subacute exposure, an increase in markers of ROS was observed in both diet groups. TAS was increased in the FC (FAT only) and there was a clear O3 effect where TAS was increased in the FC and STR. Diet increased PC formation within the CER in the FAT group, while the hippocampus showed a decrease in PC after O3 exposure in controls. In general, these results indicate that diet/O3 did not have a global effect on brain OS parameters, but showed some brain region- and OS parameter-specific effects by diets.

1. Introduction

Over the past few decades, there has been an increase in both diabetes and obesity throughout the world, with steeper trends seen in more developed countries that have adopted the Western diet rich in refined sugars and saturated fats (SF) [1,2]. Research into the effects of consuming these diets has revealed a strong correlation with severe metabolic disorders such as type 2 (non-insulin-dependent) diabetes and obesity [3]. The rise in obesity strongly correlates to the increase in the use of high-fructose corn syrup in sweetened beverages and foods, with the U.S. being one of the largest consumers [4]. It has also been argued that the increased consumption of SF has contributed significantly to the rise in obesity [5]. Though there is controversy over whether dietary fat, sugar, or even economic status (causing a reliance on high caloric food and beverages) is the primary contributor to adverse metabolic states, there is agreement that energy-dense foods (high in fat and carbohydrate content) lead to severe metabolic disorders [5,6,7].
A common adverse outcome of diabetes and obesity is damage to cardiac, renal, nervous, and/or hepatic tissues. A potential mechanism is hyperglycemic-induced production of reactive oxygen species (ROS) which can, in turn, cause oxidative stress (OS)-induced tissue damage [8]. For instance, a diet rich in fat has been shown to lead to OS within the hepatic tissue of rats [9]. Recent studies have shown that inhalation of airborne toxicants can exacerbate the effects of metabolic disorders. Bass et al. [10] have shown that rats exposed to 1.0 ppm ozone (O3) consistently develop glucose intolerance across all life stages. Interestingly, O3 has also been shown to cause activation of the hypothalamic–pituitary–adrenal (HPA) axis, a keystone pathway in sympathetic nervous system (SNS) activation [11]. It is well established that the SNS can exacerbate and possibly causes physiological symptoms associated with obesity, metabolic syndrome, and diabetes by causing insulin resistance, increased heart rate and blood pressure, and increased lipolysis in visceral fat [12,13].
O3 is a prototypic air pollutant and a major component of smog. It is one of the six criteria air pollutants and the known health effects include lung injury and nervous system effects [14,15]. Recent studies indicate that O3 exposure leads to pulmonary immune response resulting in circulating factors in blood (microglial proinflammatory response and β-amyloid 42 neurotoxicity) and these signals are detected by microglia in the brain resulting in primed proinflammatory phenotypes, suggesting that the lung-brain axis has significant implications for how air pollution may affect the brain to augment CNS effects [16]. In addition, O3 has been reported to elevate cytokines and causes OS in the brain [17]. Most studies have focused on the adverse effects of diet or various stressors alone and few reports exist about combined effects of diet and environmental stressors. In either case, the organism’s physiological endpoints (i.e., behavioral, pulmonary, cardiac, metabolism, etc.) are the main focus [18,19]. There are few, if any, studies related to the possible interaction between diet and O3, especially on brain neurochemistry. Studies using the same cohort of rats showed that treatment with high-fructose and high-fat diets attenuated some O3-induced effects on pulmonary function, neurobehavior, and metabolism [20]. The purpose of this study is to further understand this interaction by exploring the potential for high-fat or high-fructose effects on OS within specific brain regions of animals exposed to O3 either acutely or subacutely. Of the selected brain regions, the cerebellum (CER) is involved in motor activity while the hypothalamus (HYP) is involved in the pulmonary and cardiac effects through the HPA axis. Combining the diet and O3 treatments will provide insight into a more realistic exposure paradigm of individuals who live in areas with high amounts of O3 pollution and who have access to highly caloric foods.

2. Results

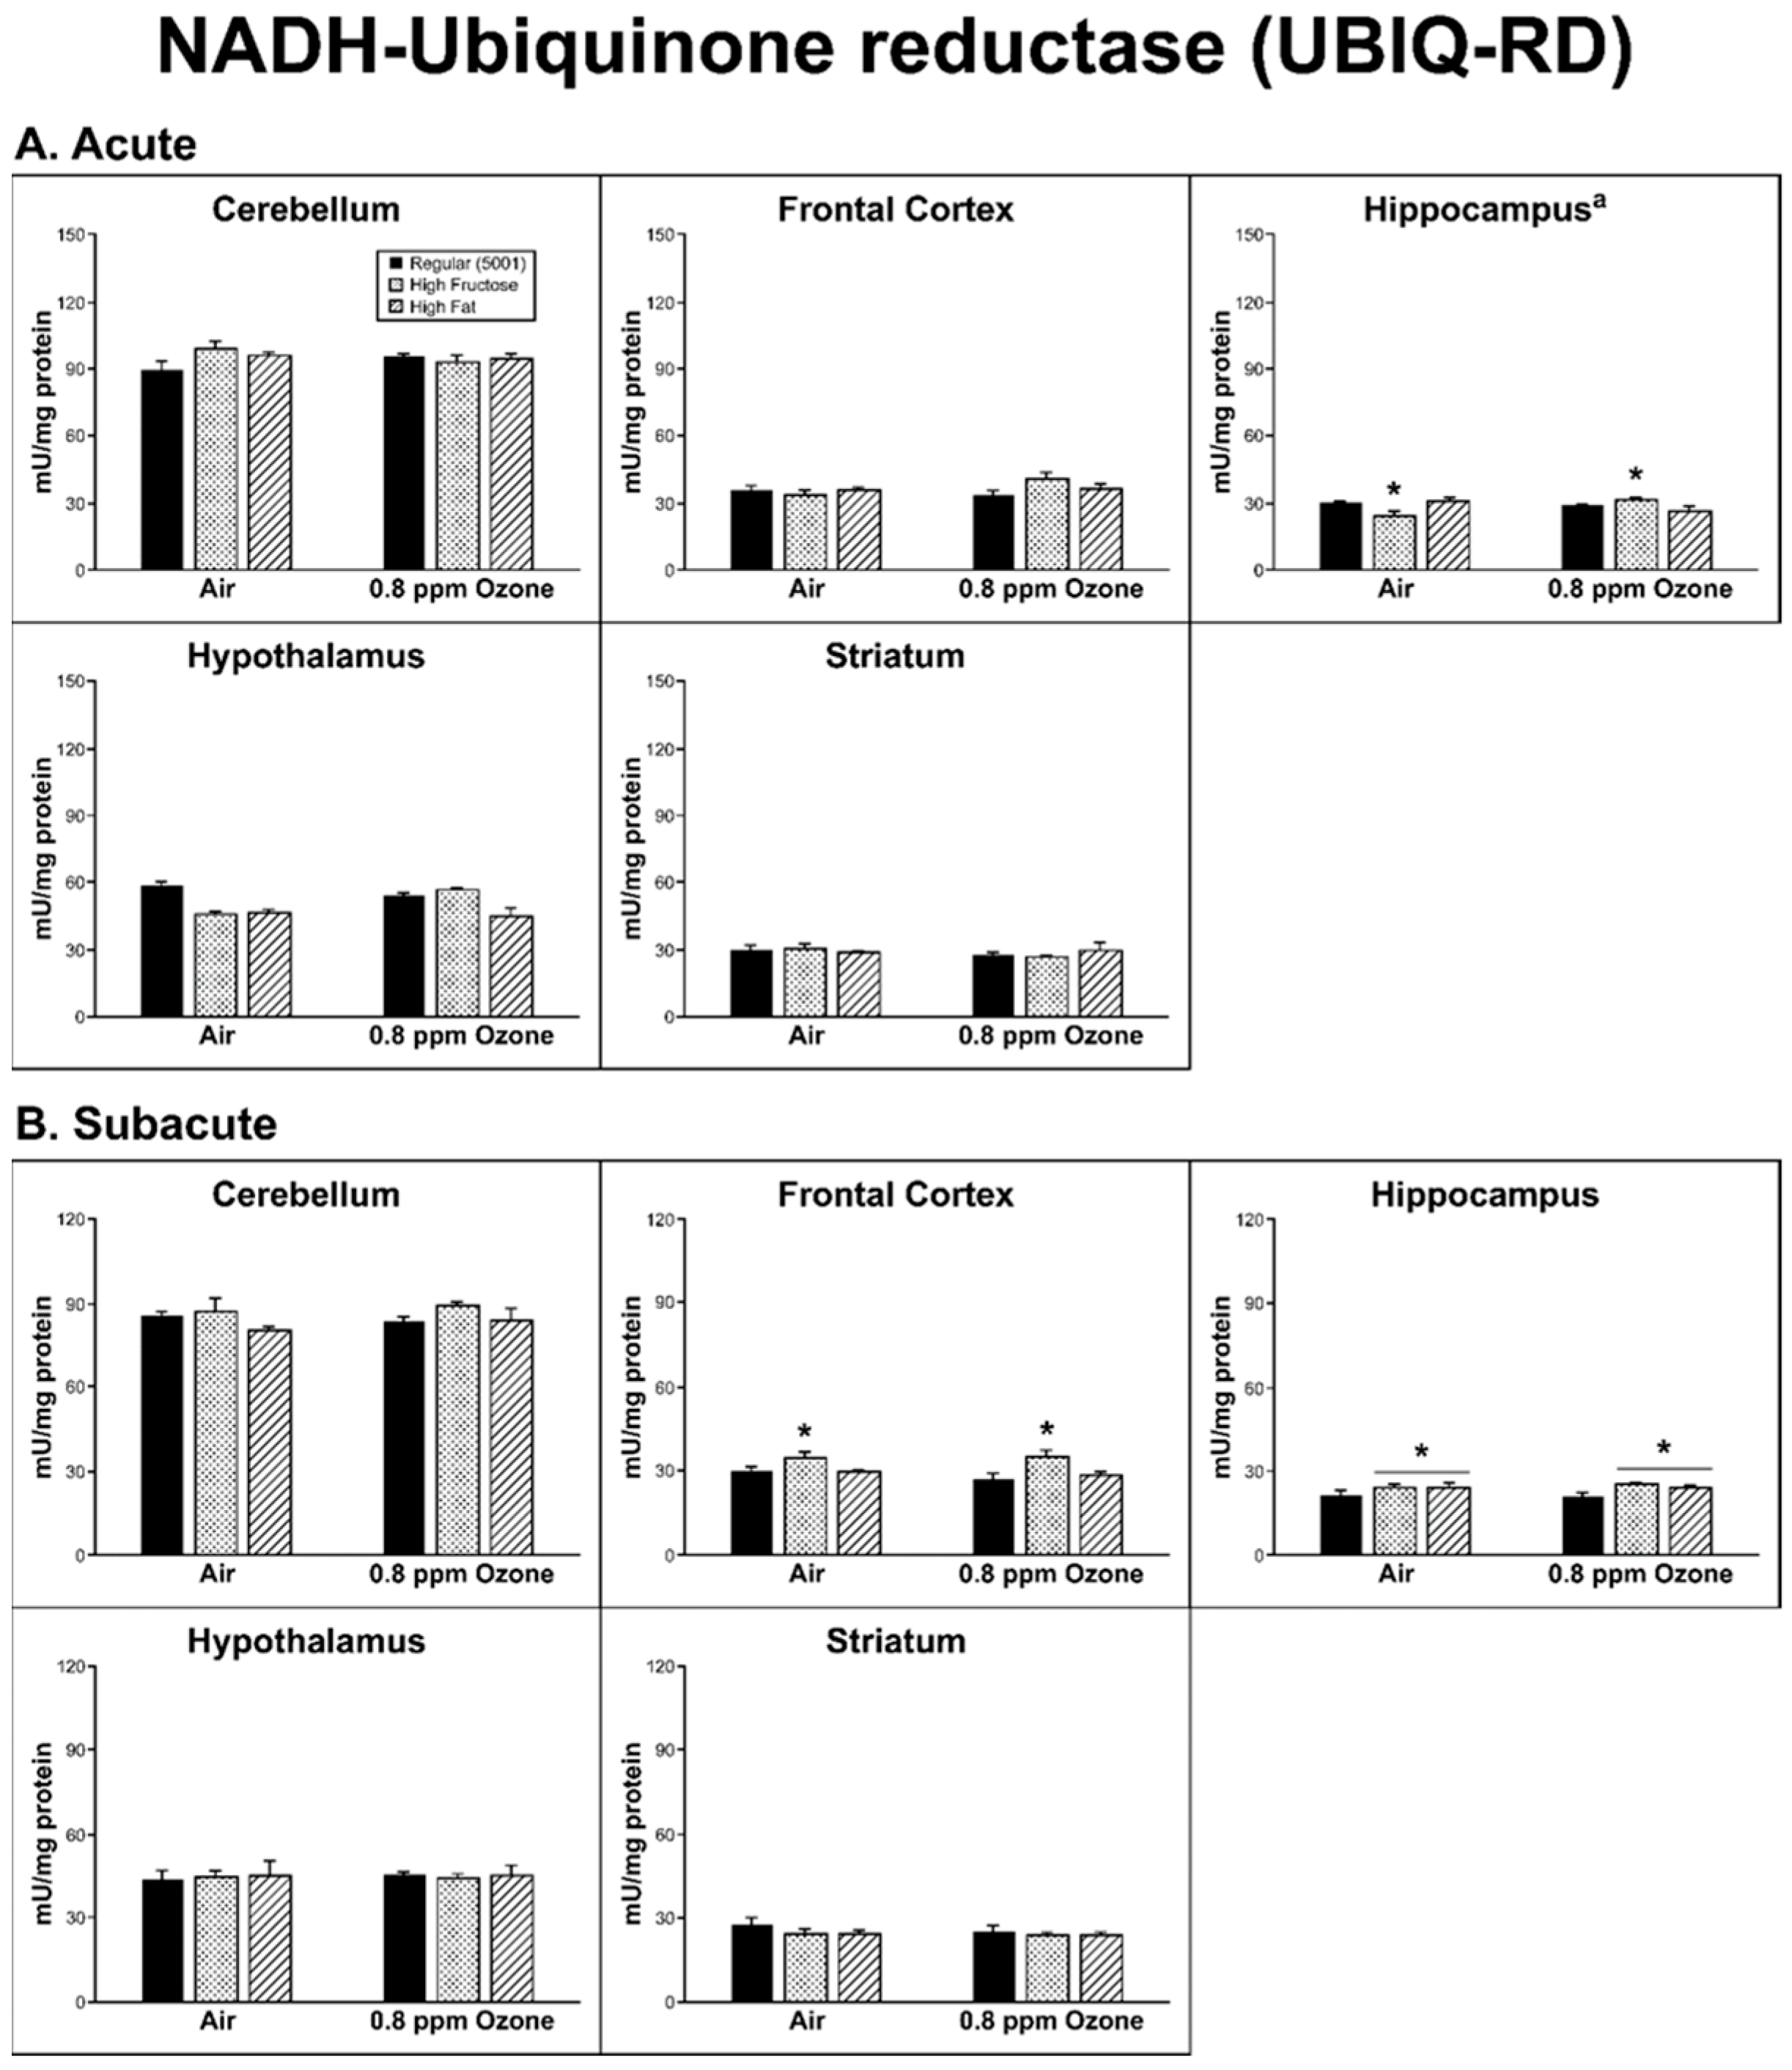
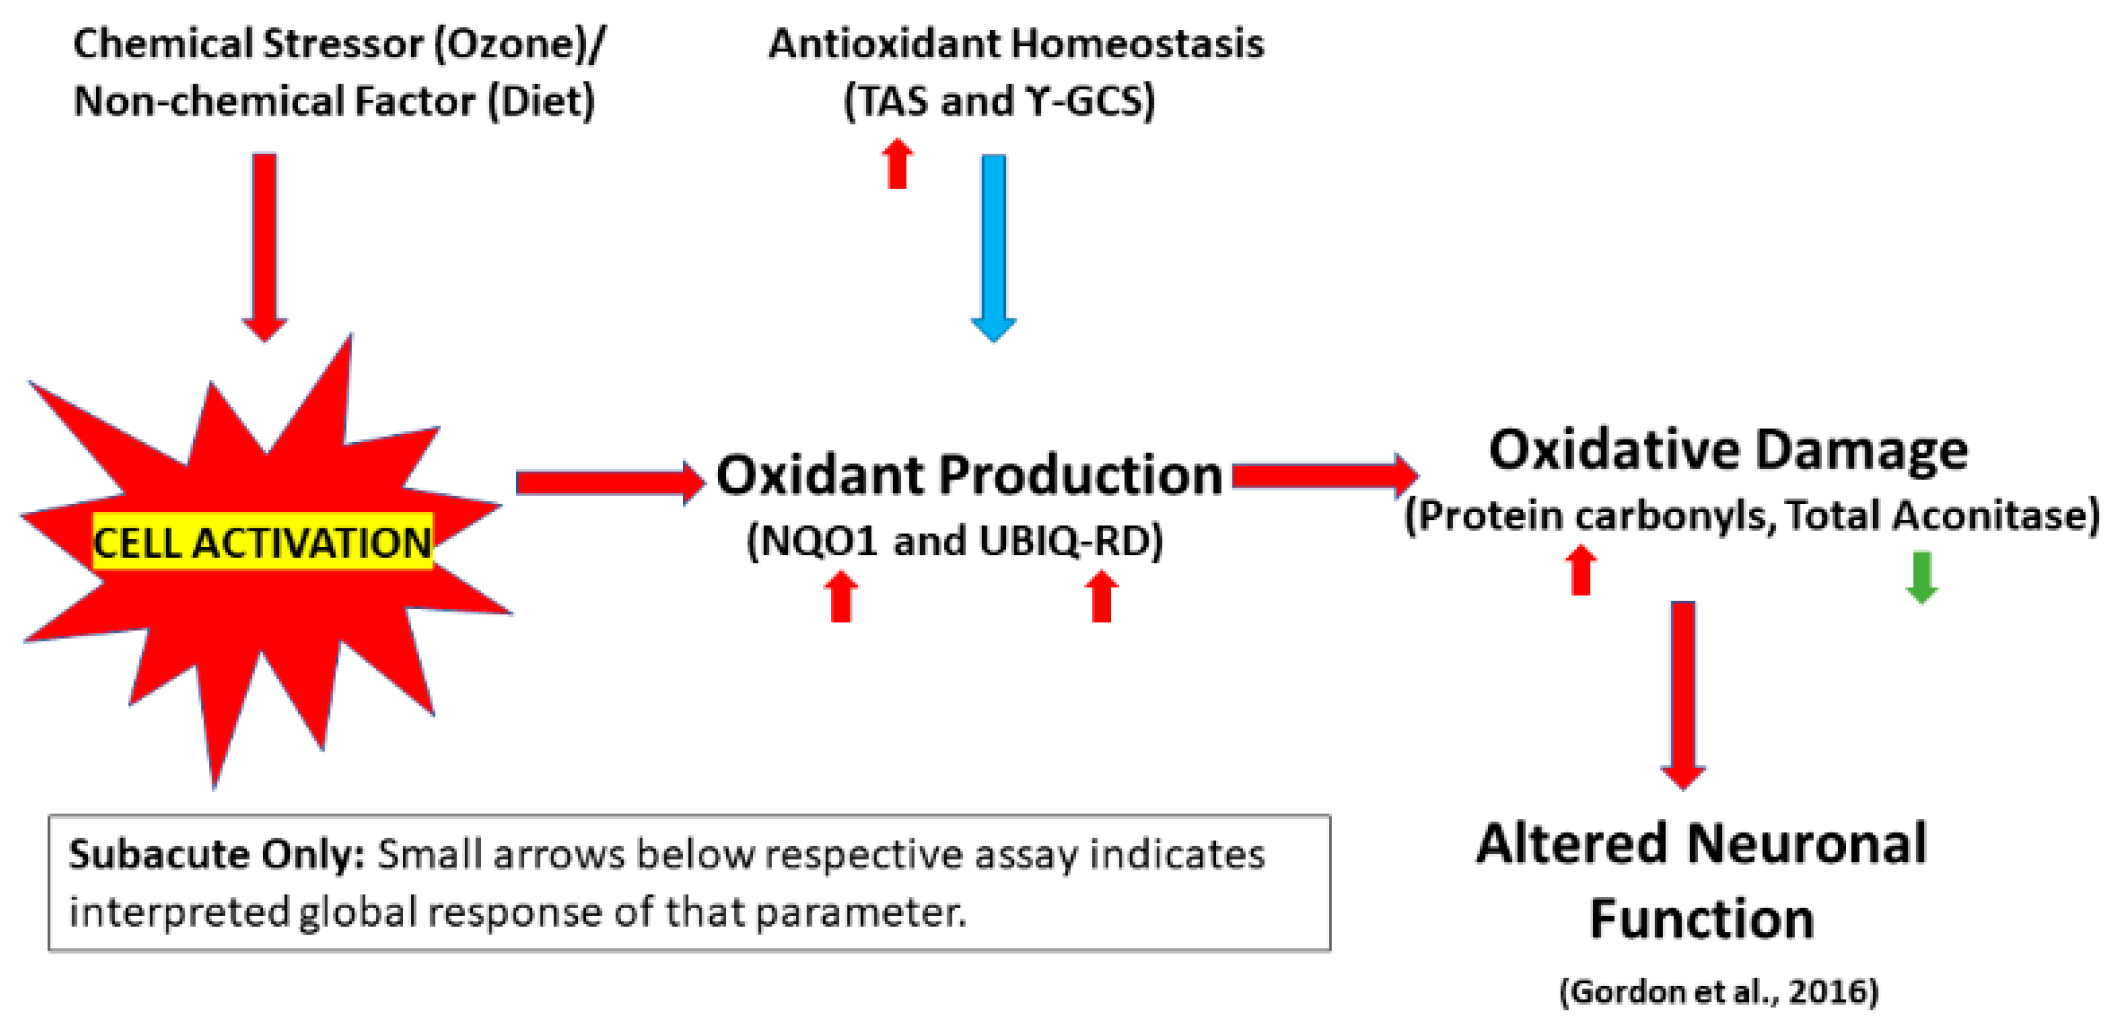
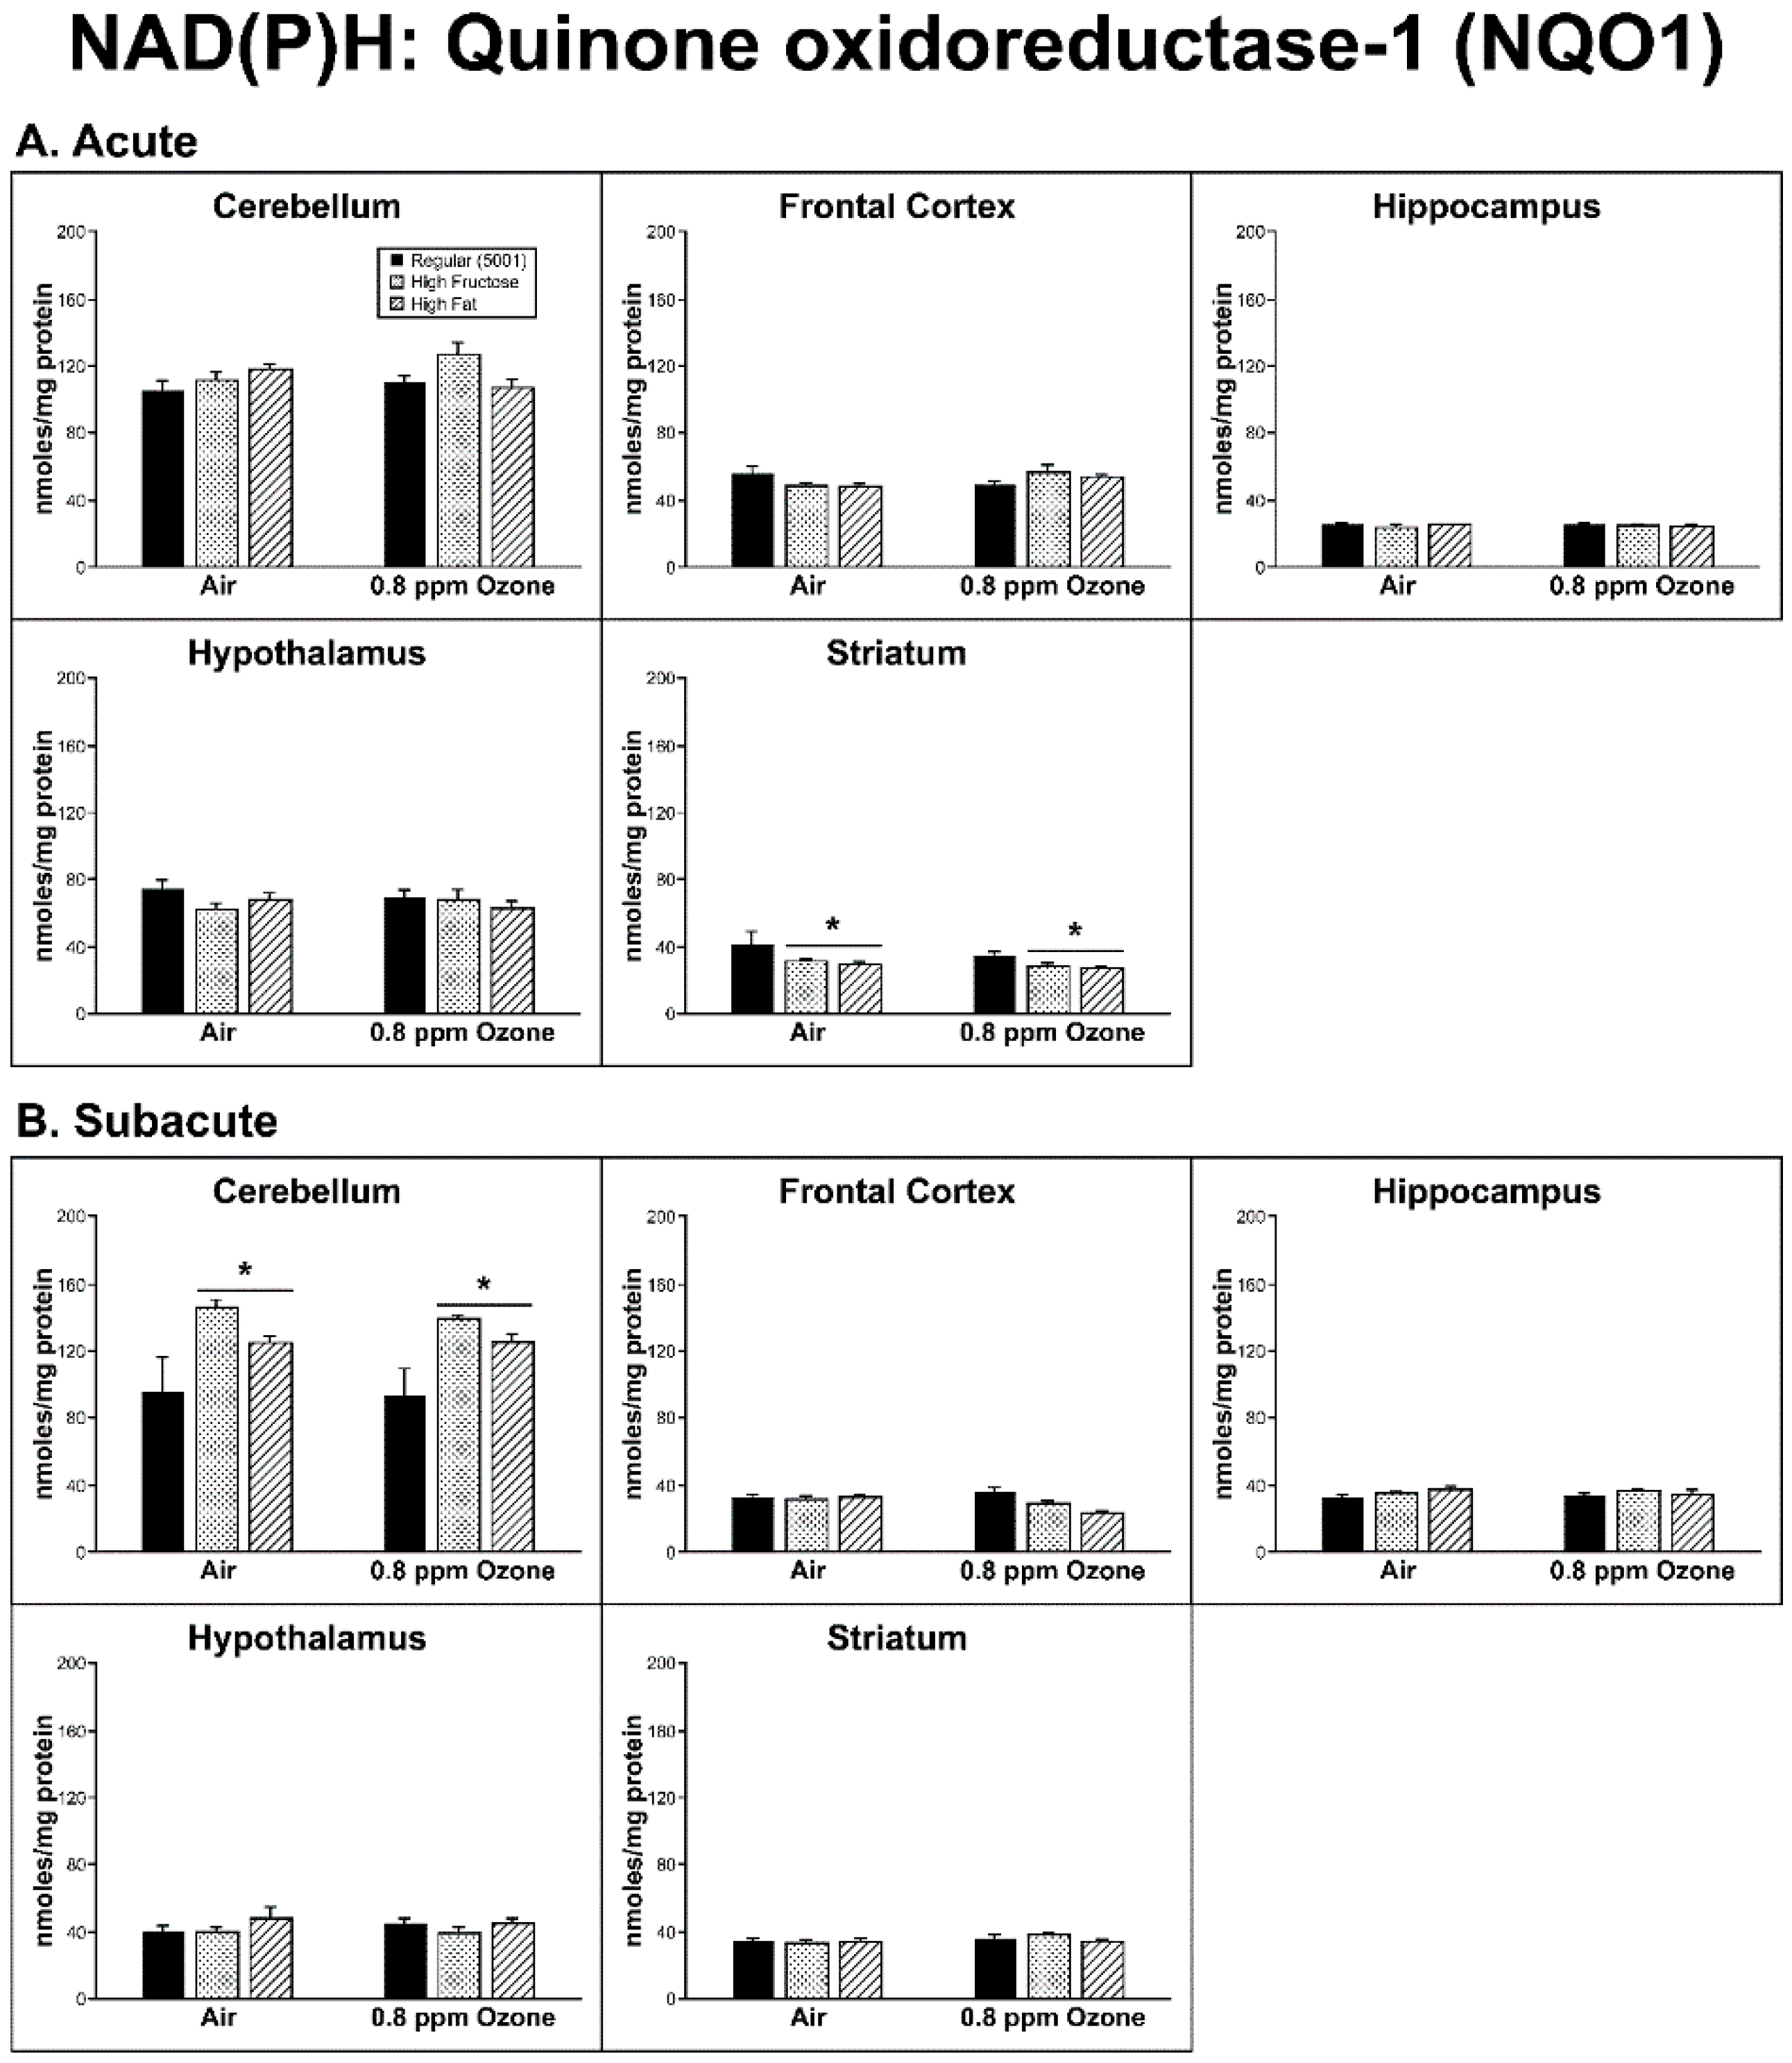
2.1. Production of Reactive Oxygen Species (ROS)

Acute Exposure: In order to measure the production of ROS, NQO1 and UBIQ-RD activities were assessed. The striatum (STR) showed a significant diet effect (F2,24 = 4.14, p = 0.028) for the NQO1 measure, as there was a decrease in activity with both diets when compared to the regular (5001) diet (p < 0.05; Figure 1A). The UBIQ-RD activity showed a significant interaction between diet and O3 treatment (F2,24 = 9.63, p = 0.001) in the hippocampus (HIP). The FRUC/O3- exposed group and the FAT-unexposed group both had higher UBIQ-RD than the FRUC-unexposed group (p < 0.05; Figure 2A).
Subacute Exposure: The NQO1 measure within the subacute group did reveal a diet effect in the CER (F2,26 = 9.16, p = 0.001), with all three diets being significantly different from each other, in the order: FRUC > regular > FAT (Figure 1B). In the FC, while the O3–diet interaction was not quite significant (F2,24 = 3.21, p = 0.058), the O3-exposed regular diet group had higher NQO1 activity than the exposed FAT group (p < 0.05).
The UBIQ-RD data showed a diet effect in both the FC (F2,26 = 7.24, p = 0.003) and the HIP (F2,26 = 3.79, p = 0.036). In the FC, the FRUC group had higher UBIQ-RD than both FAT and regular diet groups (p < 0.01); in the HIP, FAT and FRUC were higher than the regular diet (Figure 2B, p < 0.05).

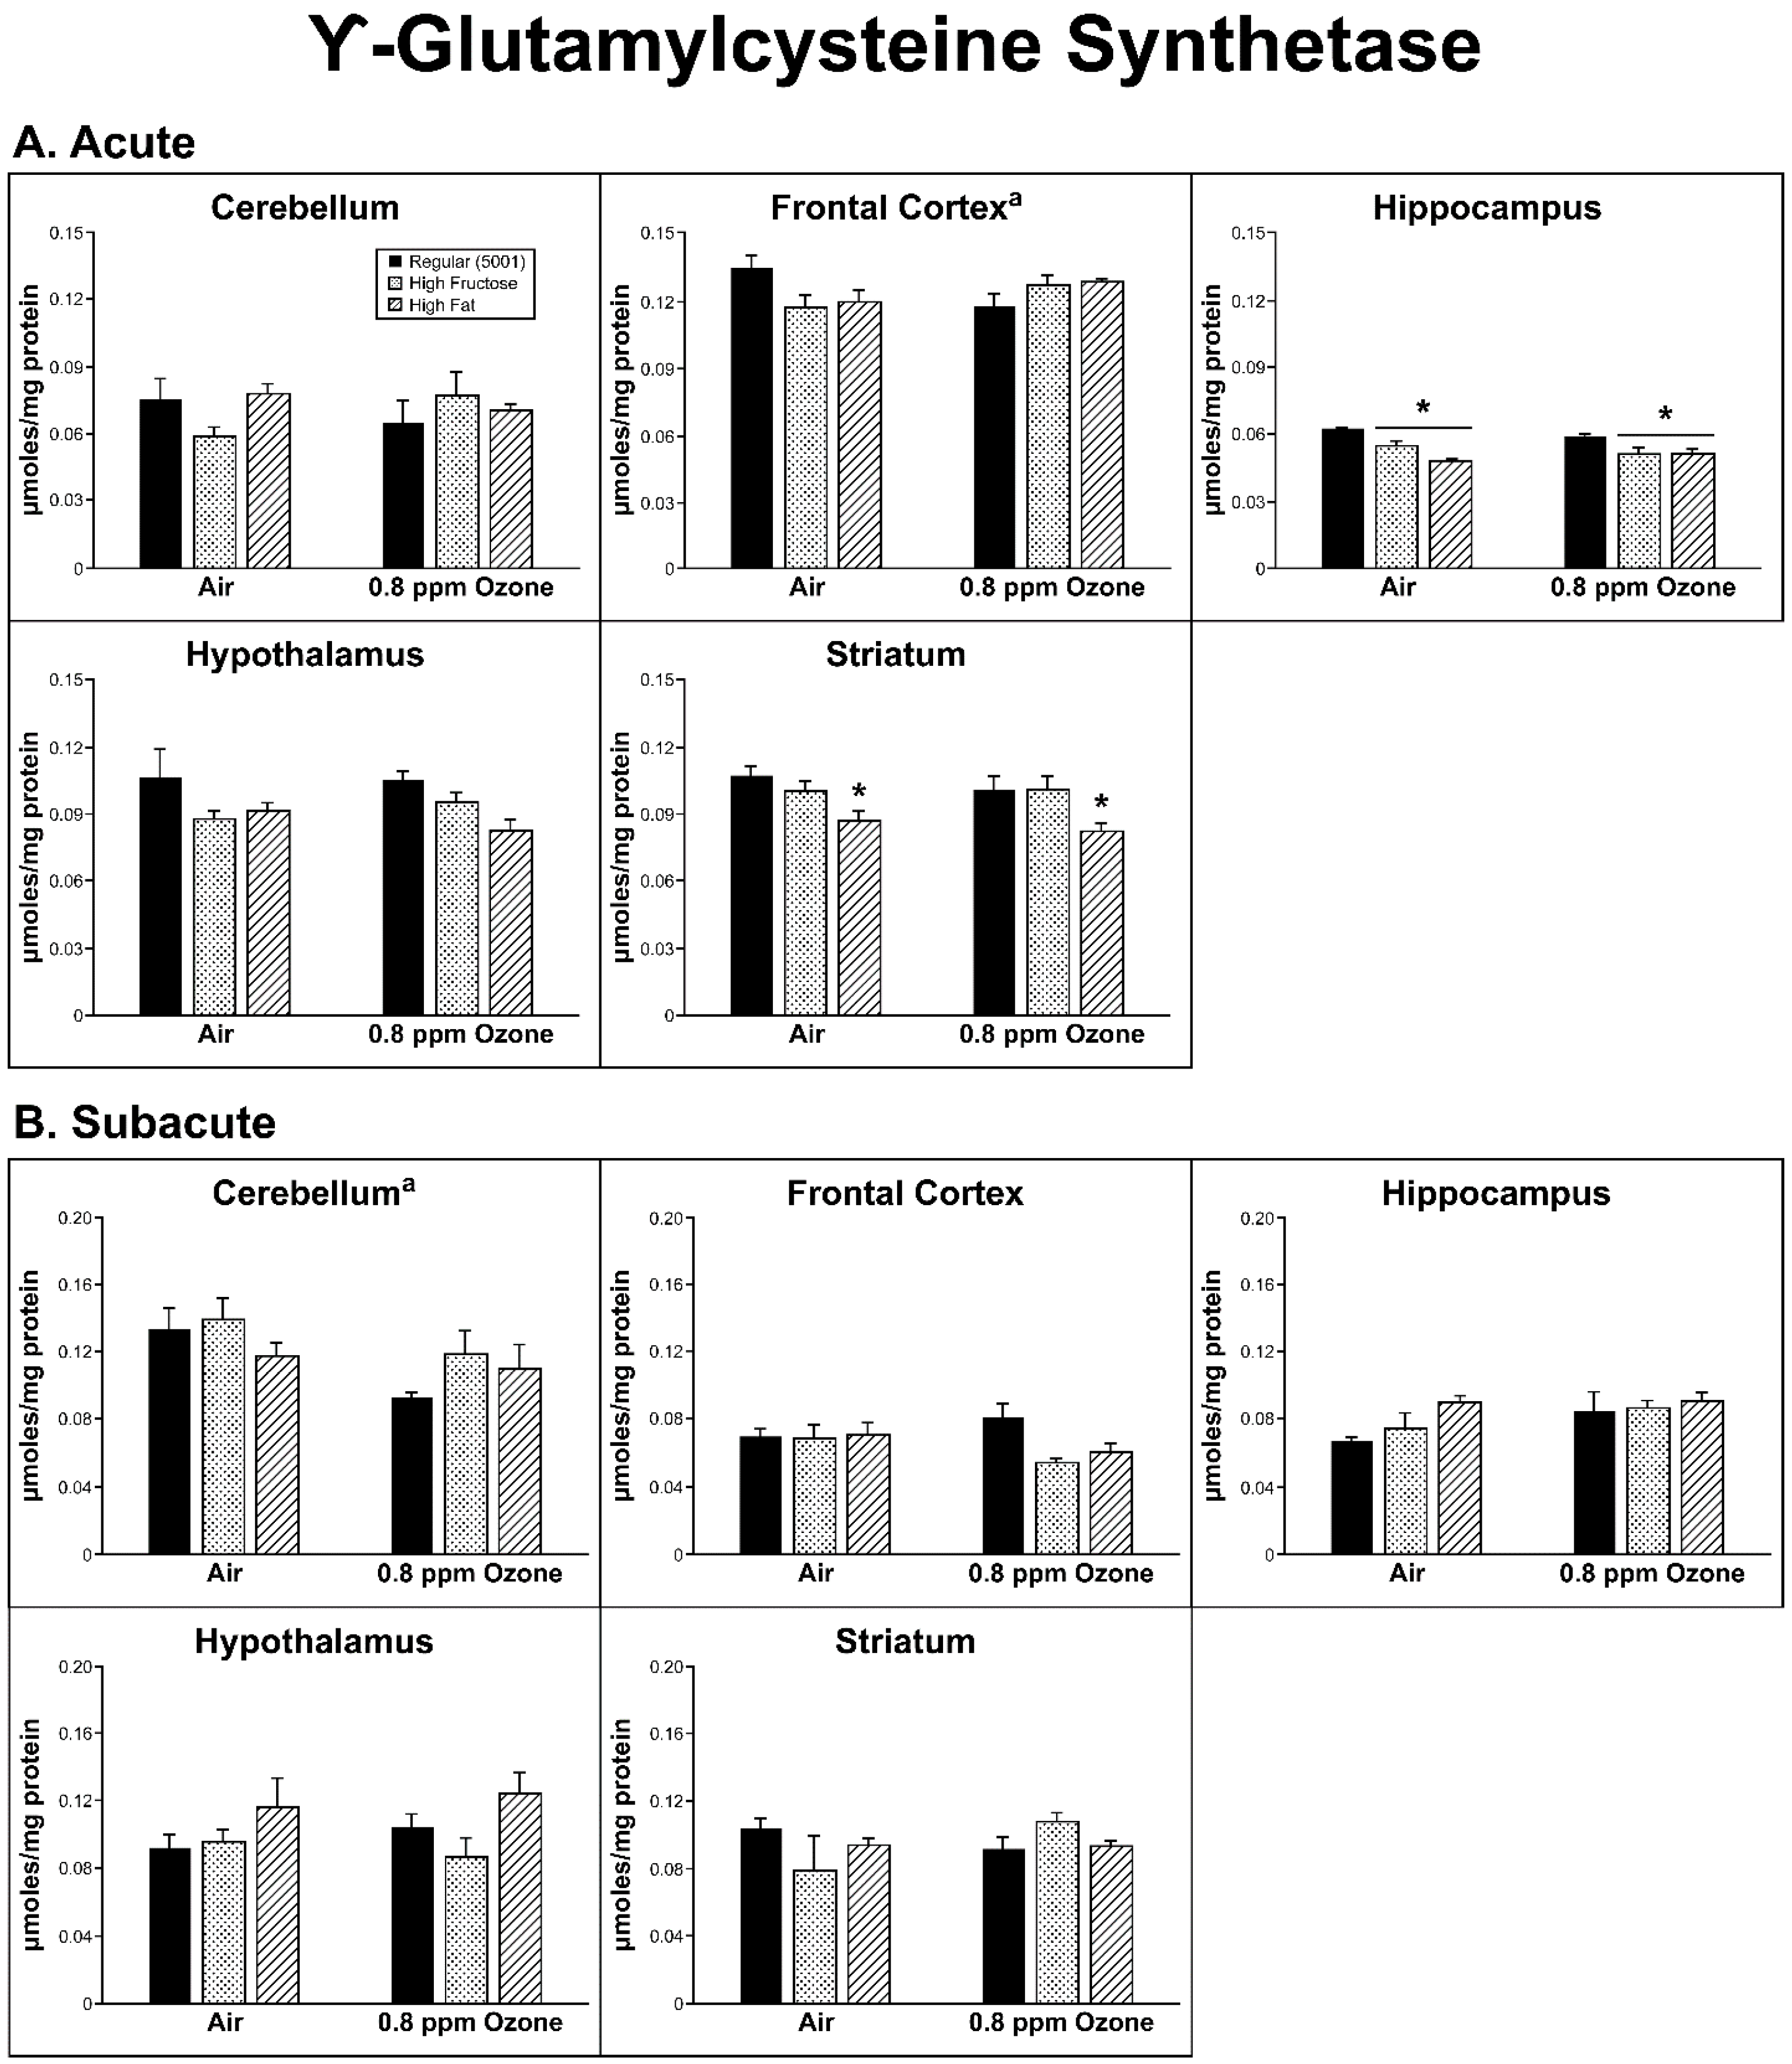
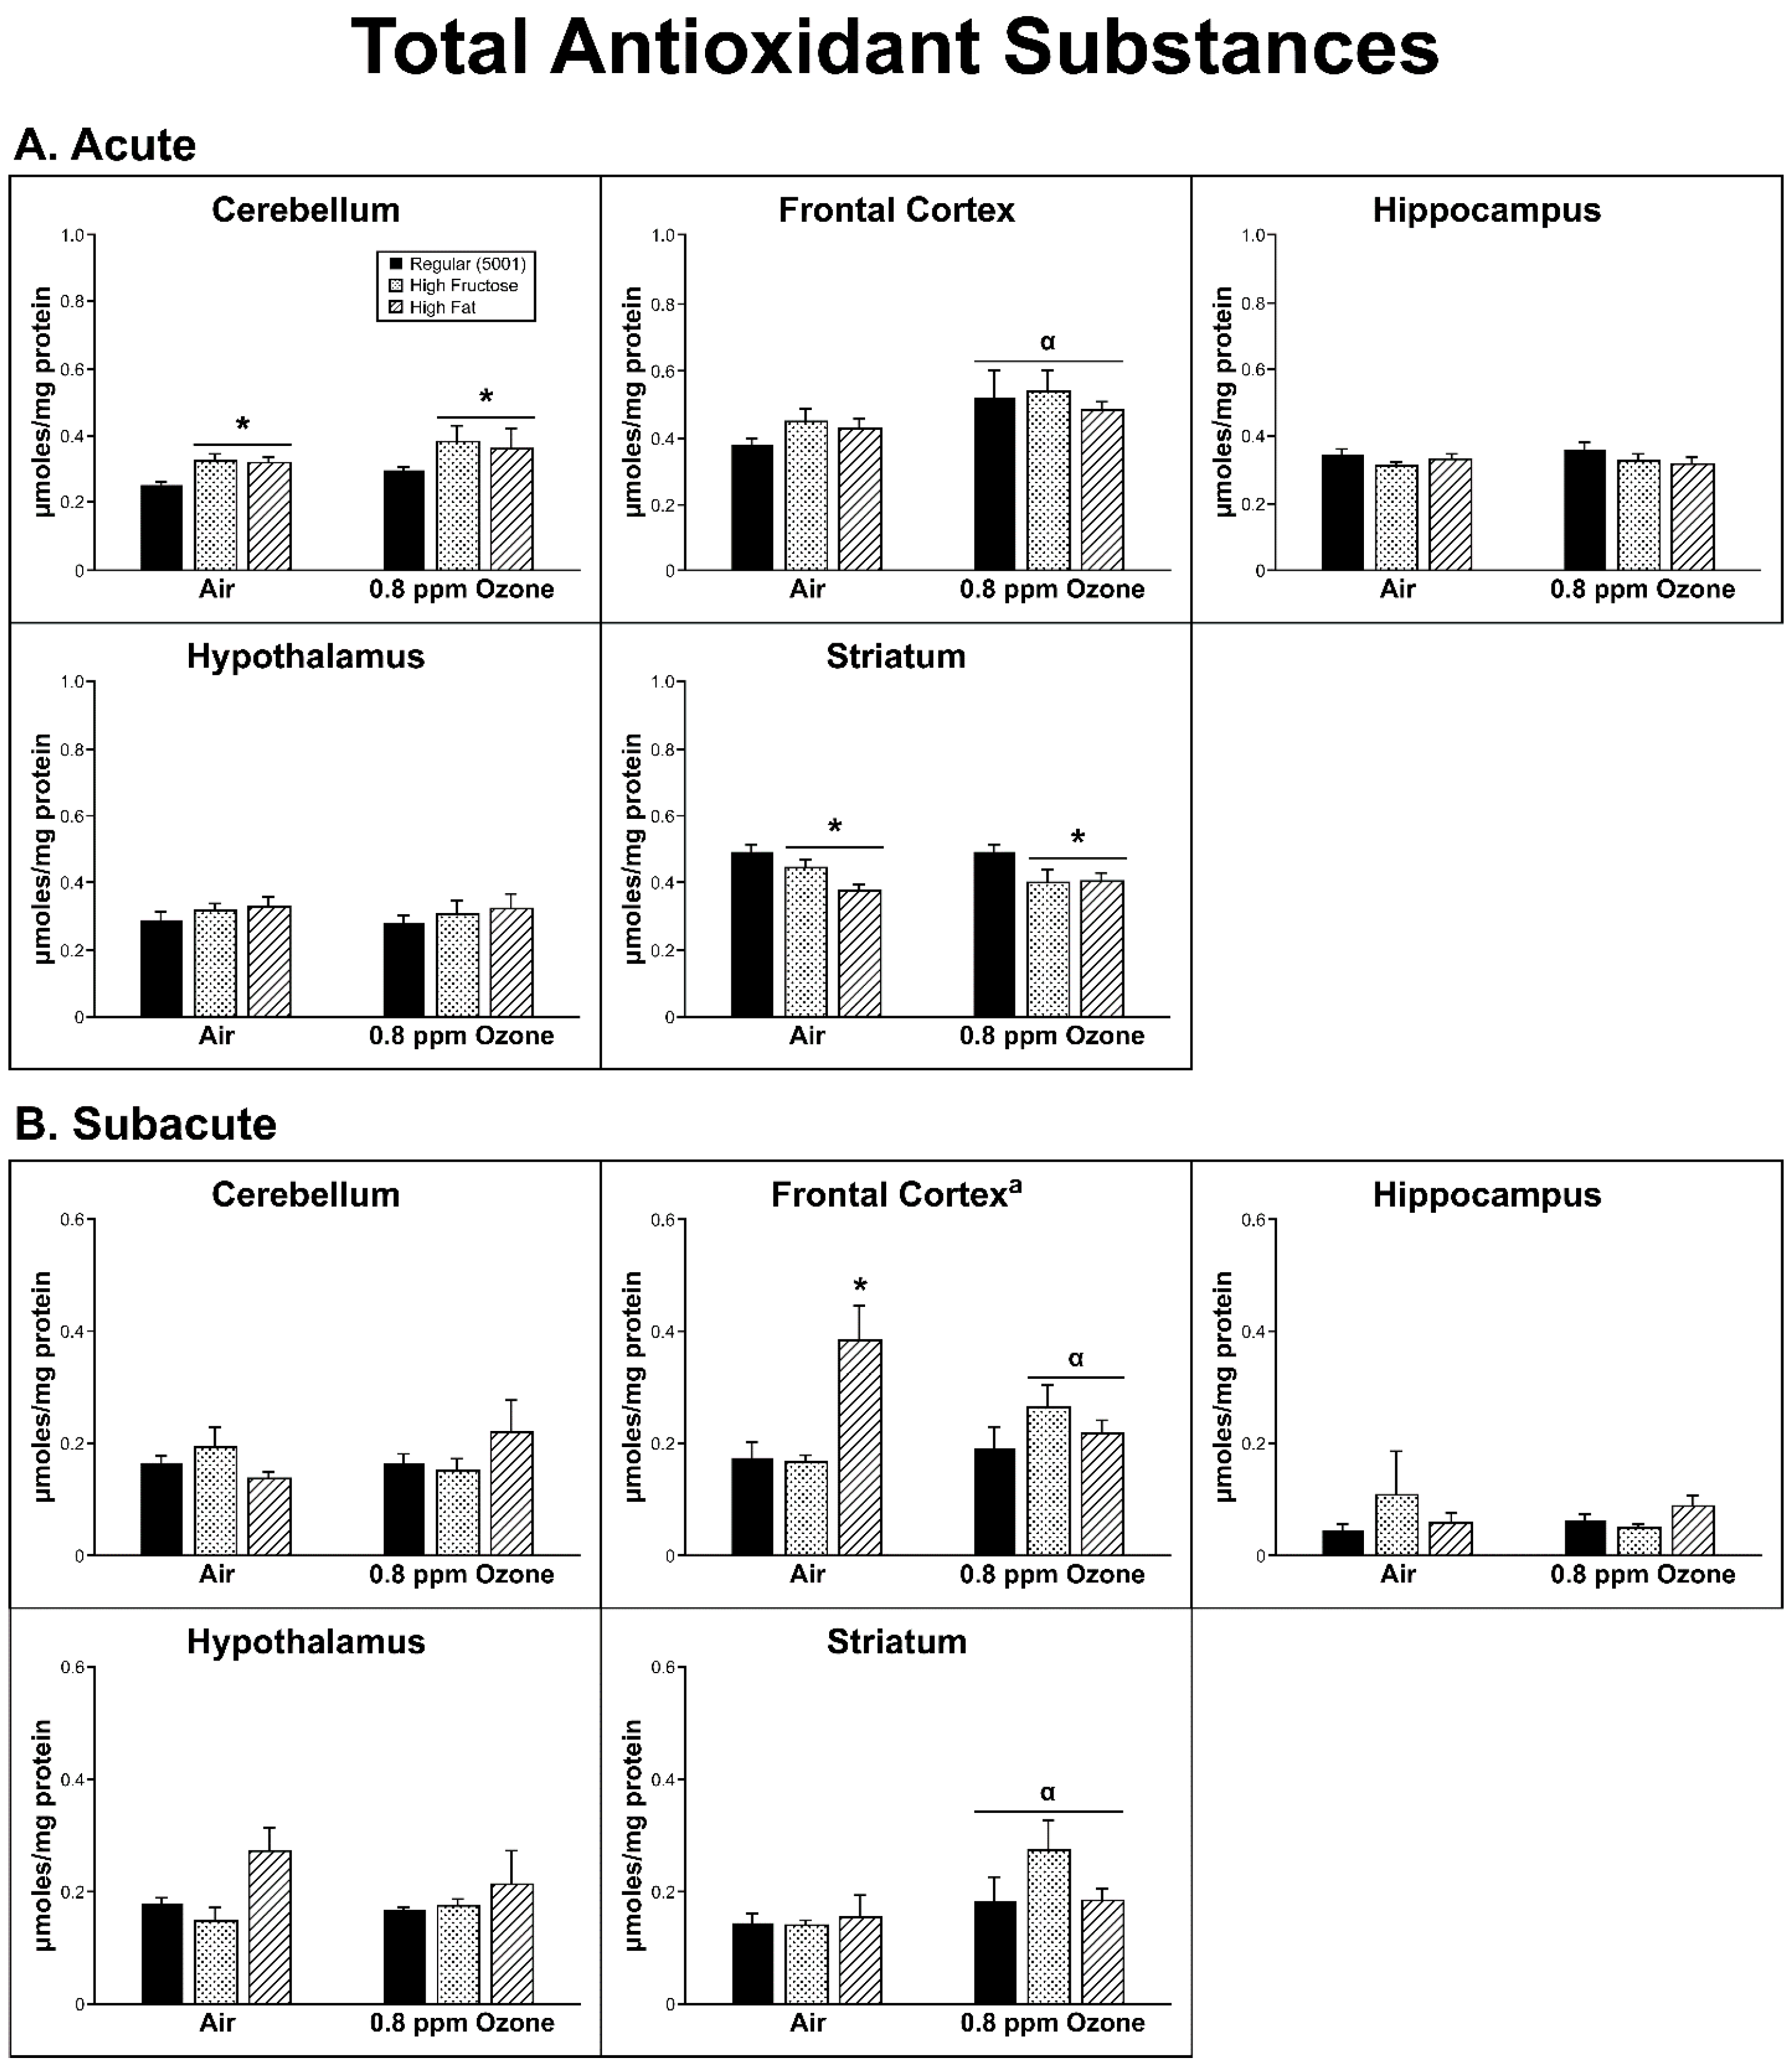
2.2. Antioxidant Homeostasis

Acute Exposure: Overall, there were only a few occasions where O3 exposure led to a significant change in antioxidant homeostasis, while dietary condition led to multiple instances of significance. In the FC, across the dietary groups, O3 (0.8 ppm) exposure was associated with a significant increase in TAS (F1,26 = 7.66, p = 0.010). With respect to dietary treatment, we found that the CER (F2,26 = 5.04, p = 0.014) showed a significant increase in total antioxidants in both the FRUC (p < 0.01) and the FAT (p < 0.01) diets relative to the regular diet. In contrast, TAS in the STR (diet F2,26 = 6.039, p = 0.007) showed a significant decrease in both the FRUC (p < 0.05) and the FAT (p < 0.01) diets when compared to the Regular (5001) diet (Figure 3A).
A significant interaction was found between diet and O3 treatment within the FC for the γ-GCS measure (F2,24 = 4.672, p = 0.019), but this was not supported by any significant differences among the diet and/or O3 groups. We did observe a decrease in γ-GCS in the HIP (F2,26 = 13.77, p < 0.001) for both FRUC and FAT groups relative to the regular diet group (p < 0.01), while in the STR (F2,26 = 9.187, p = 0.001) there was a significant decrease in the FAT group relative to both the high-fructose and the regular diets (p < 0.01; Figure 4A) in both air- and O3-exposed rats.
Subacute Exposure: The subacute group did show a significant interaction between dietary condition and O3 treatment in the FC (F2,26 = 6.275, p = 0.006) for TAS where there was also a significant diet effect (F2,24 = 6.00, p = 0.006). Across O3 groups, the FAT diet was associated with higher TAS than the regular diet (p = 0.008); however, among the individual diet by O3 groups, only FAT/control was significantly higher than the two Regular Diet/O3 groups (p < 0.05). FAT/control was also significantly higher in TAS than the FRUC/control group in FC.
In the STR, there was a significant O3 treatment effect in TAS, with higher TAS levels in the O3-exposed animals (F2,24 = 4.84, p = 0.037). Interestingly, there was a significant O3 treatment effect in the γ-GCS measure within the CER (F1,26 = 6.28, p = 0.019) as well, where O3 was associated with lower γ-GCS activity (Figure 3B and Figure 4B).

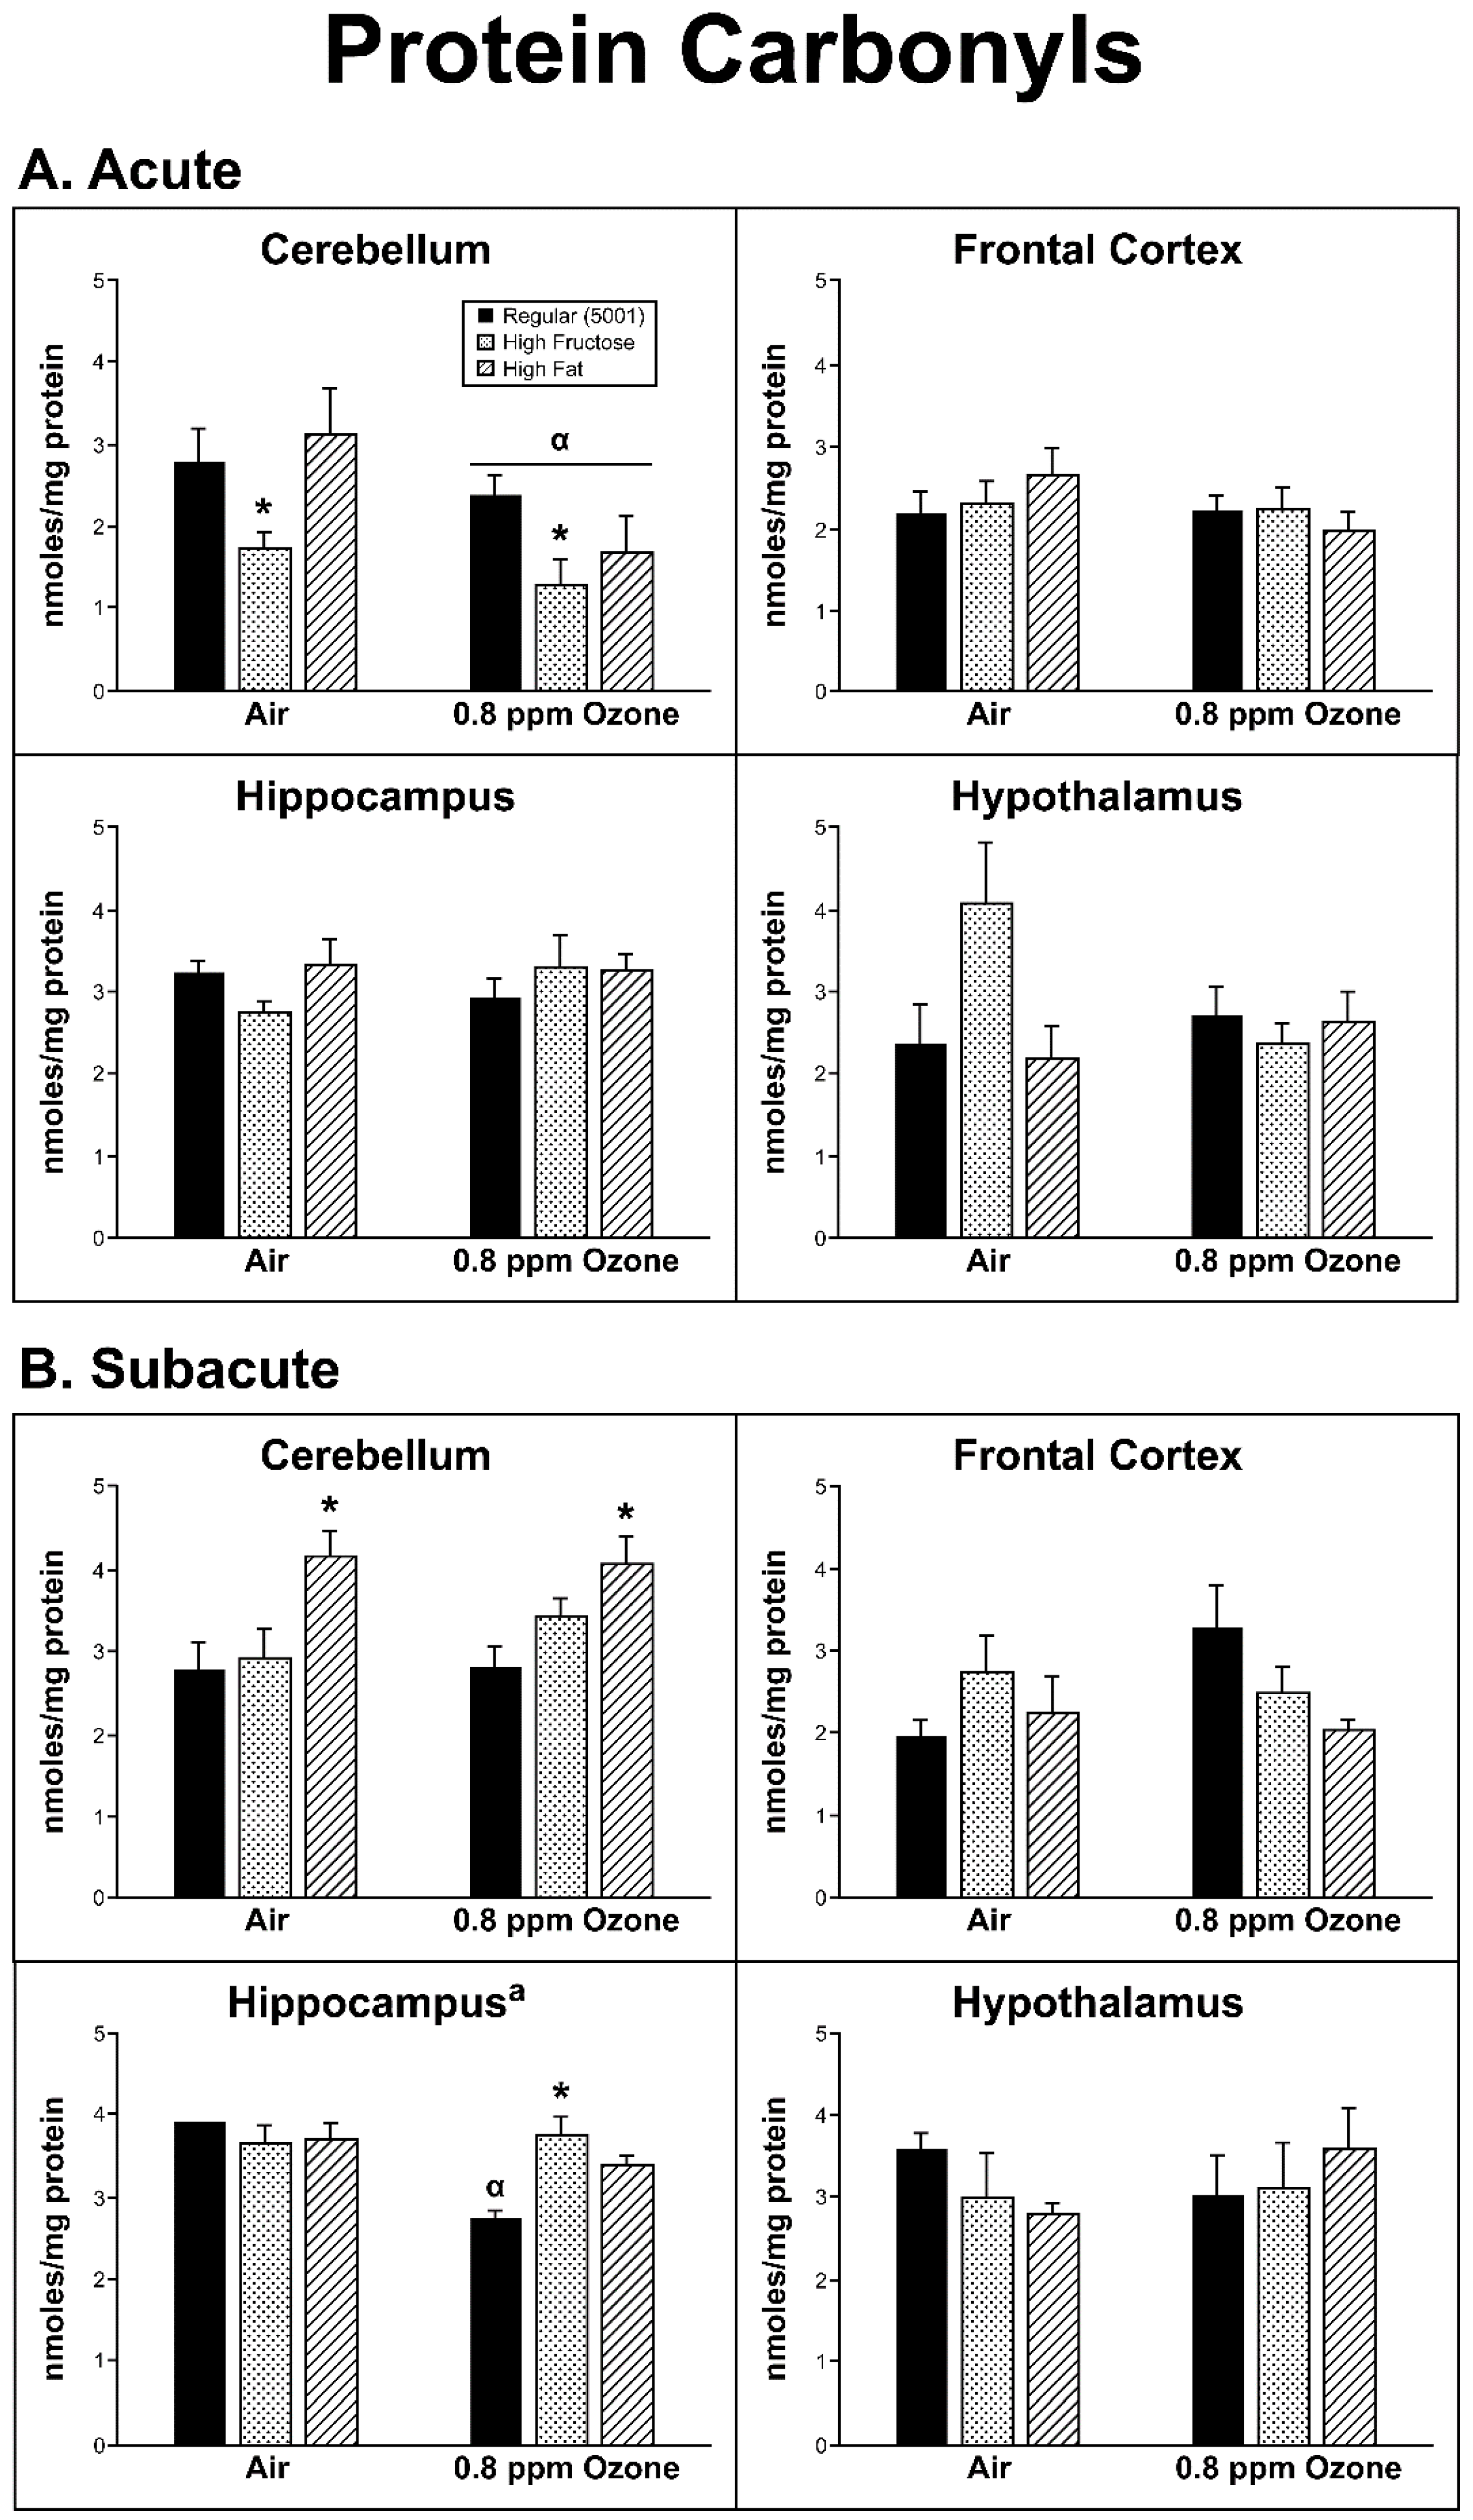
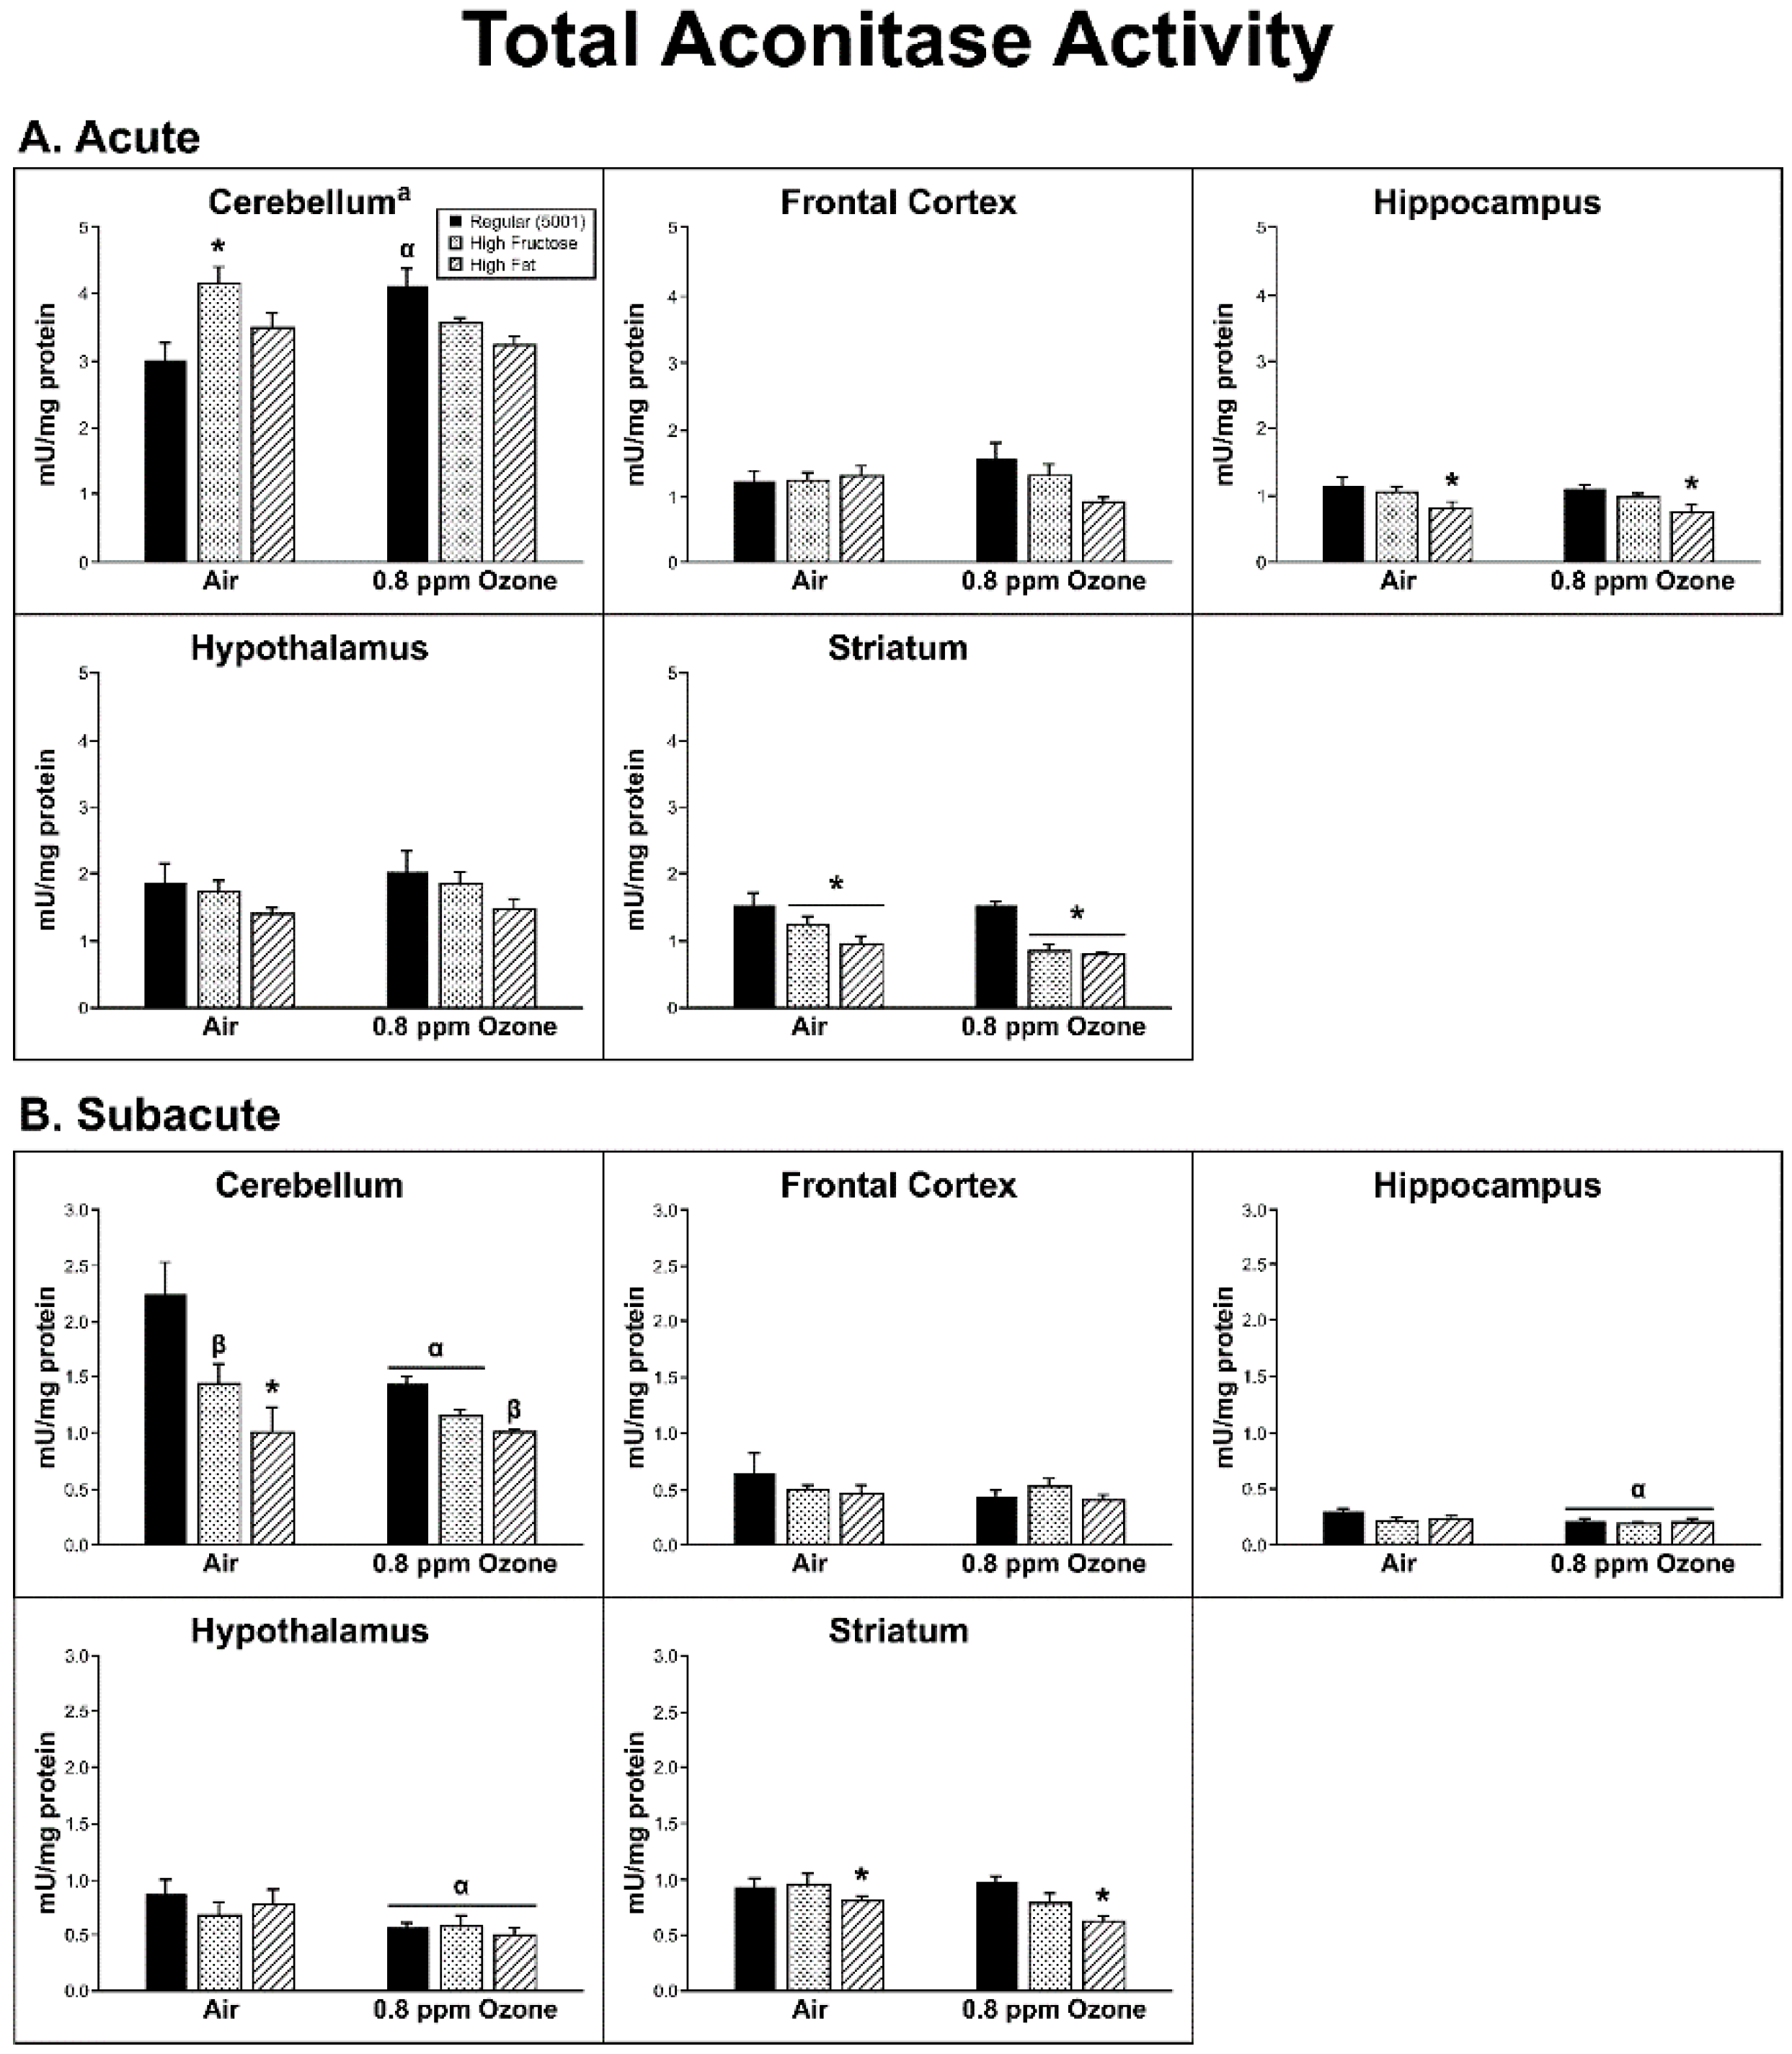
2.3. Oxidative Damage

Acute Exposure: Oxidative damage was determined by measuring PC and aconitase activity. Within the acute group, the only brain region that showed any significant changes in PC content resulting from O3 treatment was the CER, which had both an O3 effect (F1,26 = 5.73, p = 0.024) and a diet treatment effect (F2,26 = 4.223, p = 0.026). Across diet groups, there was a decrease following exposure to O3 (p < 0.05). With respect to differences among diet groups, PC content showed a significant decrease in the FRUC group relative to both FAT and regular diet (p < 0.05; Figure 5A).
The measure of aconitase activity revealed a significant O3 by diet interaction within the CER (F2,24 = 8.89, p = 0.001). This was not due to a systematic O3 or diet effect; however, the FRUC/control and Regular diet/O3 groups had significantly higher aconitase than the Regular diet/control group (p < 0.05). Within the HIP, there were differences in aconitase activity due to diet (F2,26 = 7.023, p = 0.004); there was a significant decrease in the FAT and FRUC animals relative to the regular diet groups (p ≤ 0.01). Within the STR (diet F2,26 = 13.44, p < 0.001), there was also a significant decrease in aconitase activity in both the FRUC and FAT diets relative to the regular diet (p < 0.01; Figure 6A).
Subacute Exposure: In the subacute group, there was a significant interaction between diet and O3 in PC in the HIP (F2,22 = 6.18, p = 0.007). This was due to an overall O3 effect (F1,22 = 10.18, p = 0.004) where across the three diet groups, O3 treatment was associated with a decrease in PC levels; however, individually, the O3-treated FRUC group had a small (nonsignificant) increase in PC, while regular and FAT diets showed a decrease. Of the latter two, only the regular diet decrease was individually significant (Figure 5B; p < 0.05) in HIP. There was a significant diet effect in the CER (F2,32 = 9.11, p = 0.001) where FAT animals had significantly higher PC levels than animals fed FRUC (p < 0.05) and regular diet (p < 0.01).
There was a significant decrease in aconitase activity across diet groups when compared to their respective air controls for both HIP and HYP (F1,26 = 7.80, 7.13, with p = 0.010, 0.013, respectively). In the STR, there was a significant diet effect (F2,26 = 4.68, p = 0.018) where the FAT animals had lower aconitase levels than those on the regular diet (Figure 6B). There was also a diet effect in the CER (F2,26 = 4.68, p = 0.018) where all three diet groups were different from each other, with the order of aconitase activity being regular > high-fructose > high-fat (p < 0.001 for regular vs. FAT, and p < 0.05 for the other two comparisons).

3. Discussion

In this study, we attempt to understand the combined effects of O3 exposure and different diets on oxidative stress (OS) parameters in different brain regions of rats. The diets (FRUC and FAT) chosen are thought to be associated with adverse metabolic states and are also of concern in compounding effects to environmental toxicant exposure [20]. In short, juvenile rats were given either a control, high-fat, or high-fructose diet and exposed to either air (control) or 0.8 ppm O3 in acute or subacute exposure paradigms. Multiple brain regions (cerebellum, frontal cortex, hippocampus, hypothalamus, and striatum) were examined for markers of OS, specifically, oxyradical production (NQO1 and UBIQ-RD), antioxidant homeostasis (TAS and γ-GCS), and oxidative damage (protein carbonyls and aconitase).
NQO1 (NAD(P)H: quinone oxidoreductase) is an electron reductase enzyme found specifically in the cytosol and is expressed in many tissues [21]. In brain tissue, NQO1 is found abundantly in astrocytes and endothelial cells, is neuroprotective against oxidative damage in vivo and in vitro, and has increased activity in neurodegenerative diseases, such as Parkinson’s and Alzheimer’s [22,23,24]. Ubiquinone reductase (UBIQ-RD) is the first complex of the electron transport chain found in the inner membrane of the mitochondria and is crucial for ATP production [25] and also plays a role in neurodegenerative diseases [26,27,28,29]. There was not an apparent global O3/diet interaction when compared to controls for markers of ROS production. Only the HIP showed a diet/O3 interaction in UBIQ-RD activity after acute O3 exposure. However, there was a diet-driven effect in the acute FRUC and FAT groups in the STR region of subjects when compared to controls indicated by a decrease in NQO1 activity. Conversely, there was an increase in activity in the subacute CER subjects with both test diets. Age may play a factor in these results, as the subacute group was four weeks older than the acute group when sacrificed and previous work has shown that age may be a factor in OS in differing brain regions of Brown Norway rats [30]. Effects on UBIQ-RD were, again, largely due to diet. We found the FRUC versus control diet (5001) to increase activity in the HIP following acute O3 exposure but decreased activity in the air controls. The FRUC diet also produced changes in UBIQ-RD activity with the longer subacute exposure regimen, showing significant increases in the FC and HIP in both the air- and O3-exposed animals. The FAT diet increased UBIQ-RD activity in the HIP under these conditions as well. The electron transport chain is known to be a source of oxygen radical production [30]. Changes in UBIQ-RD activity due to changes in resource input could impact energy metabolism with a downstream consequence on ROS production.
Protective antioxidant measures were also affected in some specific brain regions. Antioxidants are important mitigators of ROS damage in all tissues, including the brain, and their activity is highly influenced by the cause and region of damage [31]. TAS and γ-GCS were measured in the same brain regions. TAS measures allow insight as to the amount of total antioxidants available within a cell or tissue and indicate the capacity of the cell to combat ROS. Acutely exposed rats showed a diet-driven effect in both CER (increase) and STR (decrease), while in FC, O3 caused an increase in TAS regardless of diet. Subacutely, diet seemed to be the driving factor for changes in TAS, with an increase in FC of FAT air and both experimental diets in O3 subjects. An O3 effect was seen in all diets within the STR. γ-GCS enzyme activity indirectly measures the abundance of glutathione, as it is the rate-limiting step in its production. Glutathione, being a potent antioxidant, was able to prevent damage from free radical productions and the amount measured gives insight as to the amount of ROS present. Again, diet and not O3 was the main factor that altered γ-GCS activity and was only seen in the acute-exposure animal HIP (FAT and FRUC) and STR (FAT only). It should be mentioned that following acute exposure, when all groups were factored in, there was an interaction between dietary and O3 treatments in the FC, and the same was also found in the subacute CER groups. Without a clear trend in antioxidant substance as compared to ROS production, it is difficult to conclude that diet has any effect on OS that may be O3-derived.
When oxyradical production is unable to be controlled, oxidative damage ensues. Total aconitase and protein carbonyls were assessed and measured as metrics of oxidative damage following O3 exposure. Aconitase is an enzyme that is both cytosolic and mitochondrial, with the major amount being in the mitochondria, and is vulnerable to free radical damage. Cytosolically, aconitase plays a critical role in iron metabolism, whereas in the mitochondria, it is a key player in mtDNA stabilization, which makes it an indirect indicator of mtDNA damage, but both have been linked to neurodegenerative diseases [32,33]. In this study, diet was again the driving factor both with acute and subacute O3 exposure, with a decrease in aconitase activity in affected brain regions (acutely—HIP and STR, subacutely—CER and STR). There was no direct pattern seen with protein carbonyls—a strong indicator of oxidative damage through oxidized proteins via Lysine, Arginine, Proline, and Threonine residues [34]. Acutely, CER showed a decrease in all groups exposed to O3, but diet remained the main factor in the FRUC group. Following longer exposure times, in the CER, diet showed a significant increase in the FAT group while the HIP revealed a possible O3/diet interaction within the FRUC groups. The only other subacute measure that would be predictive of oxidative damage was an increase in UBIQ-RD activity. Interestingly, acutely, there was a decrease in γ-GCS activity in the HIP. This may give insight that initial O3 exposure starts an oxidative damage pathway in the HIP region as shown by Rivas-Arancibia et al. [35] during chronic exposure.
Before concluding, the diets themselves must be addressed. In an effort to understand the outcomes of this study, we looked at the diets themselves as they were chosen based on equal caloric content, not equal nutritional makeup (i.e., minerals and vitamins). Both the high-fructose and high-fat diets were purified, meaning they lacked the natural phytoestrogens and isoflavones found in the control diet. This possesses the possibility that the lack of natural antioxidants potentially contributed to the results seen in this study. Other rodent (rat/mouse) studies with matched diets [36,37,38,39] have shown similar OS results as have studies not using matched diets [40,41] and those where diet composition was not reported [42,43]. In this three-tiered attempt to identify an increased susceptibility to metabolic disorders due to an interaction of calorie-dense diets and O3 exposure, cause and effect remain elusive. Parameters measured in this current study inferred OS from free radical production, antioxidant potential, and macromolecule damage in animals with differing diets in acute and subacute paradigms. In a separate study from this same cohort of animals, treatment with either diet led to some improvement of O3 effects on ventilatory, behavioral, and metabolic endpoints. In male Brown Norway rats, tidal volume and breathing frequency (high-fat only, subacute) were somewhat improved, while Penh (a metric of ventilatory resistance) and minute ventilation were exacerbated (both high-fat and high-fructose, subacute only). Vertical and horizontal exploratory (subacutely) behaviors where improved in both high-fat and high-fructose diets, while high-fructose diet alone gave some metabolic improvement in cholesterol and triglyceride serum levels [20]. O3 treatment alone led to significant increases in pulmonary pathology [20] with an increase in bronchoalveolar lavage fluid eosinophil counts (high-fat and high-fructose, subacute). Overall, OS parameters measured in this and related studies [20,44] do not suggest a consistent interaction between O3 and diet on oxidative damage pathways (for schematic of global subacute effects, see Figure 7). They do provide insight as to how highly caloric diets could affect neuronal OS, which will be useful in correlating lifestyle choices in relation to neurodegenerative diseases.

4. Materials and Methods

4.1. Animals

The use of Brown Norway (BN) rats was described previously by Gordon et al. [45,46]. In short, male BN rats were acquired at postnatal day (PND) 22 and maintained in an AAALAC-approved, pathogen-free (SPF; Charles River Laboratories, Raleigh, NC, USA) facility. They were housed individually in polycarbonate cages containing heat-treated beta chip bedding (Nepco, Warrensburg, NY, USA) with enviro-dry added for nest building (Shepherd Specialty Papers, Creedmoor, NC, USA) and held at a constant temperature of 22 °C, on a 12 h light and 12 h dark cycle. All procedures were approved by the NHEERL Institutional Animal Care and Use Committee (LAPR # 18-06-002 with approval date on 12 August 2016), which ensures conformance with the 1996 NRC “Guide for the Care and Use of Laboratory Animals”.

4.2. Dietary Regimen

Access to food (Rodent Chow 5001: Ralston Purina Laboratories, St. Louis, MO, USA) and tap water were available ad libitum unless otherwise stated. Protocols were approved by the NHEERL Institutional Animal Care and Use Committee prior to initiation of this study, and adhered to National Academy of Sciences guidelines on the use of laboratory animals in research. At PND 27, the rats were allocated to one of three dietary (balanced by caloric content) groups for the remainder of the study: regular (Purina 5001), high-fructose (FRUC), or high-fat (FAT) diets. The FRUC and FAT diets were commercially prepared (Harlan, Madison, WI, USA), with 60% of calories from FRUC (containing 600 g/kg fructose; 50 g/kg lard: TD.89247) or FAT (containing 310 g/kg of lard; 90 g/kg sucrose: TD.06414; Table 1).

4.3. O3 Generation and Exposure

O3 generation and exposure paradigm were described previously [20]. Briefly, O3 was generated from oxygen by a silent arc discharge generator (OREC, Phenix, AZ, USA), and its entry into the Rochester-style Hinner chambers was controlled by mass flow controllers. Monitoring of O3 concentration within the chambers was accomplished via photometric O3 analyzers (API Model 400, Teledyne, San Diego, CA, USA). During exposure, the air temperature and relative humidity inside the four chambers (two control and two O3 chambers) were monitored hourly. All air entering the control and O3 chambers was filtered with HEPA 0.3-micron filters rated at 99.97% efficient. Stainless steel wire exposure cages were used to house individual rats. Each individual cage was part of a 16-cage unit.
Following 16 weeks on their respective dietary regimen (control, high-fructose, or high-fat, n = 10 for each diet), rats were exposed to O3 either acutely or subacutely. In the acute study, rats were exposed once to filtered air or 0.8 ppm O3 for 5 h and then sacrificed the next day (18 h postexposure). In the subacute study, rats were exposed to filtered air or O3 (0.8 ppm) for 5 h/d, 1 d/week for four consecutive weeks and sacrificed 18 h postexposure (Figure 8).

4.4. Necropsy and Tissue Isolation

Rats were anesthetized with an overdose of sodium pentobarbital (Virbac AH, Inc., Fort Worth, TX, USA; 50–100 mg/kg, ip). Brains were then quickly removed and brain regions (frontal cortex (FC), cerebellum (CER), striatum (STR), hippocampus (HIP), and hypothalamus (HYP)) were dissected on ice [47], quick-frozen on dry ice, and stored at −80 °C until analyzed.

4.5. Tissue Preparation

The brain tissues were weighed, homogenized with a polytron in 20 mM Tris-HCl buffer (pH 7.4) at 50 mg/mL, and centrifuged at 8000× g for 20 min. The supernatants were assayed for the selected OS markers including ROS production, antioxidant homeostasis, and oxidative damage. All assays, except protein carbonyl content, were modified and adapted for use on the KONELAB clinical chemistry analyzer (Thermo Clinical LabSystems, Espoo, Finland). For measures of protein carbonyl content, brain tissues were weighed, homogenized in 50 mM phosphate buffer containing 1mM EDTA (pH 6.7) at 50 mg/mL, and centrifuged at 10,000× g for 15 min at 4 °C. Protein contents were determined using either a Coomassie Plus Protein Assay Kit or a Pierce BCA Protein Assay Kit (Pierce, Rockford, IL, USA).

4.6. Markers of ROS Production

NAD(P)H:quinone oxidoreductase (NQO1) and NADH-ubiquinone reductase (UBIQ-RD) were selected as markers of ROS production as they play critical roles in several neurodegenerative diseases in which OS is a potential responsible pathway. NQO1 activity was assayed by measuring the NADH and menadione-dependent, dicumarol-inhibited reduction of cytochrome C [48,49]. NQO1 activity was calculated from the difference in reaction rates obtained with and without dicumarol. An extinction coefficient of 18.5 mM-1cm-1 was used in calculations of specific activity [49].
UBIQ-RD activity was assayed following the method of Cormier et al. [50] where the enzyme catalyzes the oxidation of NADH + H+ to NAD+, with the ultimate reduction of ubiquinone to ubiquinol. The rate of UBIQ-RD activity was measured as a rotenone-sensitive rate of NADH oxidation at 37 °C and 340 nm.

4.7. Markers of Cellular Antioxidant Homeostasis

Total antioxidant status (TAS) was measured using a kit from RANDOX Laboratories (Crumlin, Co., Antrim, UK). ABTS® (2,2′-Azino-di-[3-ethylbenzthiazoline sulphonate]) was incubated with a peroxidase (metmyoglobin) and H2O2 to produce the free radical cation ABTS®+. This has a relatively stable blue-green color, which is measured at 600 nm. Antioxidants in the sample cause suppression of this color production in proportion to their concentration [51].
γ-Glutamylcysteine synthetase (γ-GCS) activity was determined from the rate of formation of ADP (assumed to be equal to the rate of oxidation of NADH) calculated from the change in absorbance at 340 nm [52]. The above-mentioned colorimetric assays were adapted for use on the KONLAB clinical chemistry analyzer (Thermo Clinical LabSystems, Espoo, Finland).

4.8. Markers of Oxidative Damage

Protein carbonyls (PC) were assayed using commercial kits from Cayman Chemical Company (Ann Arbor, MI). This assay kit utilizes the 2,4-dinitrophenylhydrazine (DNPH) reaction to measure the protein carbonyl content in a 96-well format. The amount of protein-hydrozone produced was quantified at an absorbance of 370 nm.
The activity of total aconitase (cytosolic and mitochondrial), based on the formation of NADPH from NADP+, was assayed using commercial kits (OXIS International Inc., Portland, OR, USA). Citrate was converted to isocitrate (catalyzed by aconitase), which then underwent oxidative decarboxylation (catalyzed by isocitrate dehydrogenase) and became α-ketoglutarate. Concomitantly during this last reaction, NADP+ was reduced to NADPH. NADPH formation was measured at 340 nm absorbance, and was proportional to aconitase activity.

4.9. Statistical Analysis

For each outcome variable, two-way ANOVAs were run separately for each study (acute and subacute) by brain region combination. First, a factorial ANOVA was run, looking at effects of ozone, diet, and any interaction of the two. If there was an interaction (p < 0.05), all pairwise t-tests among the O3 by diet groups were examined. If there was no interaction (p ≥ 0.05), the interaction term was removed and the main effects model run. If there was a significant O3 and/or diet effect (p < 0.05) in the main effects model, pairwise tests of differences between the ozone and control animals, and/or among the diet groups, were tested. The ANOVA assumptions of normality and homogeneity of variance were examined using scatterplots of data and model residuals via the Shapiro–Wilk test (normality) and Levene’s test (homogeneity of variance). A log transformation was used when it improved normality and/or homogeneity of variance, as was the case with Aconitase, γ-GCS, and TAS. As this was an exploratory study, many analyses and tests were done with no adjustments for multiple comparisons. Therefore, individual significant tests should be interpreted with caution, and emphasis placed on patterns across the data rather than individual tests.

Author Contributions

Conceptualization, P.R.S.K., J.E.R. and A.F.M.J.; Methodology, P.R.S.K., J.M.V., A.F.M.J.; Validation, J.E. Richards, J.E.S. and J.E. Royland; Formal analysis, J.E.S.; Investigation, P.R.S.K., J.M.V. and A.F.M.J.; Resources, P.R.S.K.; Data Curation, J.M.V., A.F.M.J., J.E. Richards and P.R.S.K.; Writing—Original Draft Preparation, J.M.V. and A.F.M.J.; Writing—Review & Editing, P.R.S.K., J.E. Royland, J.M.V., A.F.M.J. and J.E.S.; Visualization, P.R.S.K., J.M.V. and A.F.M.J.; Supervision, P.R.S.K.; Project Administration, P.R.S.K.; Funding Acquisition, P.R.S.K.

Funding

Joseph Valdez is funded by a contract from US-EPA (Award # EP-14-D-000171).

Acknowledgments

The authors thank Luke Godwin for technical assistance and Christopher Gordon and Pamela Phillips for providing brain tissues from cohort of animals tested for cardiac and pulmonary effects. Drs. John Cowden and Reeder Sams from the National Center for Computational Toxicology, US EPA, are acknowledged for their helpful comments on an earlier version of this manuscript. The research described in this article has been reviewed by the National Health and Environmental Effects Research Laboratory, US Environmental Protection Agency, and approved for publication. Approval does not signify that the contents necessarily reflect the views and policies of the Agency nor does mention of trade names or commercial products constitute endorsement or recommendation for use.

Conflicts of Interest

All authors have declared no existing conflicts of interest.

References

  1. Finucane, M.M.; Stevens, G.A.; Cowan, M.J.; Danaei, G.; Lin, J.K.; Paciorek, C.J.; Singh, G.M.; Gutierrez, H.R.; Lu, Y.; Bahalim, A.N. National, regional, and global trends in body-mass index since 1980: Systematic analysis of health examination surveys and epidemiological studies with 960 country-years and 9·1 million participants. Lancet 2011, 377, 557–567. [Google Scholar] [CrossRef]
  2. Danaei, G.; Finucane, M.M.; Lu, Y.; Singh, G.M.; Cowan, M.J.; Paciorek, C.J.; Lin, J.K.; Frazadfar, F.; Khang, Y.H.; Setvens, G.A.; et al. National, regional, and global trends in fasting plasma glucose and diabetes prevalence since 1980: Systematic analysis of health examination surveys and epidemiological studies with 370 country-years and 2·7 million participants. Lancet 2011, 378, 31–40. [Google Scholar] [CrossRef]
  3. Hu, F.; Liu, S.; Dam, R. Diet and risk of Type II diabetes: The role of types of fat and carbohydrate. Diabetologia 2001, 44, 805–817. [Google Scholar] [CrossRef] [PubMed]
  4. Bray, G.; Nielsen, S.; Popkin, B. Consumption of high-fructose corn syrup in beverages may play a role in the epidemic of obesity. Am. J. Clin. Nutr. 2004, 79, 537–543. [Google Scholar] [CrossRef]
  5. Bray, G.A.; Popkin, B.M. Dietary fat intake does affect obesity! Am. J. Clin. Nutr. 1998, 68, 1157–1173. [Google Scholar] [CrossRef]
  6. Drewnowski, A. The Real Contribution of Added Sugars and Fats to Obesity. Epid. Rev. 2007, 29, 160–171. [Google Scholar] [CrossRef] [Green Version]
  7. Gross, L.S.; Li, L.; Ford, E.S.; Liu, S. Increased consumption of refined carbohydrates and the epidemic of type 2 diabetes in the United States: An ecologic assessment. Am. J. Clin. Nutr. 2004, 79, 774–779. [Google Scholar] [CrossRef]
  8. Yu, T.; Sheu, S.-S.; Robotham, J.; Yoon, Y. Mitochondrial fission mediates high glucose-induced cell death through elevated production of reactive oxygen species. Cardiovas. Res. 2008, 79, 341–351. [Google Scholar] [CrossRef] [Green Version]
  9. Milagro, F.I.I.; Campión, J.; Martínez, J.A. Weight gain induced by high-fat feeding involves increased liver oxidative stress. Obesity (Silver Spring, Md.) 2006, 14, 1118–1123. [Google Scholar] [CrossRef]
  10. Bass, V.; Gordon, C.J.; Jarema, K.A.; MacPhail, R.C.; Cascio, W.E.; Phillips, P.M.; Ledbetter, A.D.; Schladweiler, M.C.; Andrews, D.; Miller, D.; et al. Ozone induces glucose intolerance and systemic metabolic effects in young and aged brown Norway rats. Toxicol. Appl. Pharm. 2013, 273, 551–560. [Google Scholar] [CrossRef] [Green Version]
  11. Gackière, F.; Saliba, L.; Baude, A.; Bosler, O.; Strube, C. Ozone inhalation activates stress-responsive regions of the CNS. J. Neurochem. 2011, 117, 961–972. [Google Scholar] [CrossRef] [Green Version]
  12. Tentolouris, N.; Liatis, S.; Katsilambros, N. Sympathetic system activity in obesity and metabolic syndrome. Ann. N. Y. Acad. Sci. 2006, 1083, 129–152. [Google Scholar] [CrossRef] [PubMed]
  13. Tentolouris, N.; Argyrakopoulou, G.; Katsilambros, N. Perturbed autonomic nervous system function in metabolic syndrome. Neuromol. Med. 2008, 10, 169–178. [Google Scholar] [CrossRef] [PubMed]
  14. Kodavanti, U.P. Stretching the stress boundary: Linking air pollution health effects to a neurohormonal stress response. Biochim. Biophys. Acta 2016, 1860, 2880–2890. [Google Scholar] [CrossRef]
  15. Miller, D.B.; Snow, S.J.; Henriquez, A.; Schladweiler, M.C.; Ledbetter, A.D.; Richards, J.E.; Andrews, D.L.; Kodavanti, U.P. Systemic metabolic derangement, pulmonary effects, and insulin insufficiency following subchronic ozone exposure in rats. Toxicol. Appl. Pharmacol. 2016, 306, 47–57. [Google Scholar] [CrossRef] [Green Version]
  16. Mumaw, C.L.; Levesque, S.; McGraw, C.; Robertson, S.; Lucas, S.; Stafflinger, J.E.; Campen, M.J.; Hall, P.; Norenberg, J.P.; Anderson, T.; et al. Microglial priming through the lung-brain axis: The role of air pollution-induced circulating factors. FASEB J. 2016, 30, 1880–1891. [Google Scholar] [CrossRef] [PubMed]
  17. Santiago-Lopez, D.; Bautista-Martinez, J.A.; Hernandex, C.I.; Aguilar-Martinez, M.; Rivas-Arancibia, A. Oxidative stress, progressive damage in the substantia nigra and plasma dopamine oxidation, in rats chronically exposed to ozone. Toxicol. Lett. 2010, 197, 193–200. [Google Scholar] [CrossRef]
  18. Snow, S.J.; Gordon, C.J.; Bass, V.L.; Schladweiler, M.C.; Ledbetter, A.D.; Jarema, K.A.; Phillips, P.M.; Johnstone, A.F.M.; Kodavanti, U.P. Age-related differences in pulmonary effects of acute and subchronic episodic ozone exposures in Brown Norway rats. Inhal. Toxicol. 2016, 28, 313–323. [Google Scholar] [CrossRef]
  19. Gordon, C.J.; Phillips, P.M.; Ledbetter, A.; Snow, S.J.; Schladweiler, M.C.; Johnstone, A.F.; Kodavanti, U.P. Active vs. Sedentary lifestyle from weaning to adulthood and susceptibility to ozone in rats. Am. J. Physiol. Lung Cell Mol. Physiol. 2017, 312, L100–L109. [Google Scholar] [CrossRef]
  20. Gordon, C.J.; Phillips, P.M.; Johnstone, A.F.M.; Beasley, T.E.; Ledbetter, T.E.; Schladweiler, M.C.; Snow, S.J.; Kodavanti, U.P. Effect of high-fructose and high-fat diets on pulmonary sensitivity, motor activity, and body composition of brown Norway rats exposed to ozone. Inhal. Toxicol. 2016, 28, 203–215. [Google Scholar] [CrossRef]
  21. Seigel, D.; Ross, D. Immunodetection of NAD(P)H:quinone oxidoreductase 1 (NQO1) in human tissues. Free Radic. Biol. Med. 2000, 29, 246–253. [Google Scholar] [PubMed]
  22. Van Muiswinkel, F.L.; de Vos, R.A.; Bol, J.G.; Andringa, G.; Jansen Steur, E.N.; Ross, D.; Siegel, D.; Drukarch, B. Expression of NAD(P)H:quinone oxidoreductase in the normal and Parkinsonian substantia nigra. Neurobiol. Aging 2004, 25, 1253–1262. [Google Scholar] [CrossRef] [PubMed] [Green Version]
  23. Park, J.S.; Jung, J.S.; Jeong, Y.H.; Hyan, J.W.; Le, T.K.; Kim, D.H.; Choi, E.C.; Kim, H.S. Antioxidant mechanism of isoflavone metaolies in hydrogen peroxide-stimulate rat primary astrocytes: Critical role of hemoxygnase-1 and NQO1 expression. J. Neurochem. 2011, 119, 909–919. [Google Scholar] [CrossRef] [PubMed]
  24. Rainia, A.K.; Templeton, D.J.; Deak, J.C.; Perry, G.; Smith, M.A. Quinone reductase (NQO1), a sensitive redox indicator, is increased in Alzheimer’s disease. Redox Rep. 1999, 4, 23–27. [Google Scholar] [CrossRef] [PubMed]
  25. Weiss, H.; Friedrich, T.; Hofhaus, G.; Preis, D. The respiratory-chain NADH dehydrogenase (complex I.) of mitochondria. Eur. J. Biochem. 1991, 197, 563–576. [Google Scholar] [CrossRef] [PubMed]
  26. Schapira, A.H. Mitochondrial dysfunction in neurodegenerative disorders. Biochem. Biolphys. Acta 1998, 1366, 225–233. [Google Scholar] [CrossRef] [PubMed]
  27. Schapira, A.H.; Patel, S. Targeting mitochondria for neuroprotection in Parkinson’s disease. Antioxid. Redox. Signal. 2012, 16, 965–973. [Google Scholar] [CrossRef]
  28. Schapira, A.H.; Cooper, J.M.; Dexter, D.; Clark, J.B.; Jenner, P.; Marsden, C.D. Mitochondrial complex I deficiency in Parkinson’s disease. J. Neurochem. 1990, 54, 823–827. [Google Scholar] [CrossRef] [PubMed]
  29. Giachin, G.; Bouverot, R.; Acajjaour, S.; Pantalone, S.; Soler-Lopez, M. Dynamics of Human Mitochondrial Complex I Assembly: Implications for Neurodegenerative Diseases. Front. Mol. Biosci. 2016, 3. [Google Scholar] [CrossRef]
  30. Pandya, J.D.; Royland, J.E.; MacPhail, R.C.; Sullivan, P.G.; Kodavanti, P.R.S. Age- and brain region-specific differences in mitochondrial bioenergetics in Brown Norway rats. Neurobiol. Aging 2016, 42, 25–34. [Google Scholar] [CrossRef]
  31. Halliwell, B.; Aeschbach, R.; Löliger, J.; Aruoma, O.I. The characterization of antioxidants. Food Chem. Toxicol. 1995, 33, 601–617. [Google Scholar] [CrossRef] [PubMed]
  32. Fariss, M.W.; Chan, C.B.; Patel, M.; Van Houten, B.; Orrenius, S. Role of mitochondria in toxic oxidative stress. Mol. Interv. 2005, 5, 94–111. [Google Scholar] [CrossRef] [PubMed]
  33. Chen, X.J.; Wang, X.; Kaufman, B.A.; Butow, R.A. Aconitase couples metabolic regulation to mitochondrial DNA maintenance. Science 2005, 307, 714–717. [Google Scholar] [CrossRef] [PubMed]
  34. Friguet, B.; Bulteau, A.L.; Chondrogianni, N.; Conconi, M.; Petropoulos, I. Protein degradation by the proteasome and its implications in aging. Ann. N. Y. Acad. Sci. 2000, 908, 143–153. [Google Scholar] [CrossRef] [PubMed]
  35. Rivas-Arancibia, S.; Guevara-Guzman, R.; Lopez-Vidal, Y.; Rodriguez-Martinez, E.; Zanardo-Gomes, M.; Angoa-Perez, M.; Raisman-Vozari, R. Oxidative stress caused by ozone exposure induces loss of brain repair in the hippocampus of adult rats. Toxicol. Sci. 2010, 113, 187–197. [Google Scholar] [CrossRef] [PubMed]
  36. Longhi, R.; Almeida, R.F.; Pettenuzzo, L.F.; Souza, D.G.; Machado, L.; Quincozes-Santos, A.; Souza, D.O. Effect of trans fatty acid-enreiched diet on mitochondrial inflammatory, and oxidative stress parametes in the cortex and hippocampus of Wistar rats. Eur. J. Nutr. 2010, 57, 1913–1924. [Google Scholar] [CrossRef]
  37. Ma, W.; Yuan, L.; Yu, H.; Xi, Y.; Xiao, R. Mitochondrial dysfunction and oxidative damage in the brain of diet-induced obese rats but not diet-resistant rats. Life Sci. 2014, 110, 53–60. [Google Scholar] [CrossRef] [PubMed]
  38. Morrison, C.D.; Pistell, P.J.; Ingram, D.K.; Johnson, W.E.; Liu, Y.; Fernandez-Kin, S.O.; White, C.L.; Pupera, M.N.; Uranga, R.M.; Bruce-Keller, A.J.; et al. High Fat Diet Increases Hippocampal Oxidative Stress and Cognitive Impairment in Aged Mice: Implications for decreased Nrf2 signaling. J. Neurochem. 2010, 114, 1581–1589. [Google Scholar] [CrossRef]
  39. Zhang, X.; Fong, F.; Ren, J.; Driscoll, M.J.; Culver, B. High dietary fat induces NADPH oxidase-associated oxidative stress and inflammation in rat cerebral cortex. Exp. Neurol. 2005, 191, 315–325. [Google Scholar] [CrossRef]
  40. Tucsek, Z.; Toth, P.; Sosnowska, D.; Gautam, T.; Mitschelen, M.; Koller, A.; Szalai, G.; Sonntag, W.E.; Ungvari, Z.; Csiszar, A. Obesity in Agining Exacerbates Blood-Brain Barrier Disruption, Neuroinflammation, and Oxidative Stress in the Mouse Hippocampus: Effects on of Genes Involved in Beta-Amyloid Generation and Alzheimer’s Disease. J. Geront. 2014, 69, 1212–1226. [Google Scholar] [CrossRef]
  41. Souza, C.G.; Moreira, J.D.; Siqueira, I.R.; Pereira, A.G.; Rieger, D.K.; Souza, D.O.; Souza, T.M.; Portela, L.V.; Perry, M.L.S. Highly palatable diet consumption increases protein oxidation in rat frontal cortex and anxiety-like behavior. Life Sci. 2007, 81, 198–203. [Google Scholar] [CrossRef] [PubMed]
  42. Cavaliere, G.; Viggiano, E.; Trinchese, G.; De Fillipo, C.; Messina, A.; Monda, V.; Valenzano, A.; Cincione, R.I.; Zammit, C.; Cimmino, F.; et al. Long Feeding High-Fat Induces Hypothalamic Oxidative Stress and Inflammation, and Prolonged Hypothalamic AAMPK Activation in Rat Animal Model. Front. Physiol. 2018, 9, 818. [Google Scholar] [CrossRef] [PubMed]
  43. Amin, K.A.; Kamel, H.H.; Abd Eltawab, M.A. The relation of high fat diet, metabolic tentdisturbances and crain oxidative dysfunction: Modulation by hydroxy citric acid. Lipids Health Dis. 2011, 10, 74. [Google Scholar] [CrossRef] [PubMed]
  44. Gordon, C.J.; Phillips, P.M.; Johnstone, A.F.M.; Schmid, J.; Schladweiler, M.C.; Ledbetter, A.; Snow, S.J.; Kodavanti, U.P. Effects of maternal high-fat diet and sedentary lifestyle on susceptibility of adult offspring to ozone exposure in rats. Inhal. Toxicol. 2017, 29, 239–254. [Google Scholar] [CrossRef] [PubMed]
  45. Gordon, C.J.; Jarema, K.A.; Lehmann, J.R.; Schladweiler, M.C.; Schmid, J.E.; Ward, W.O.; Kodavanti, U.P.; Nyska, A.; MacPhail, R.C. Susceptibility of adult and senescent brown Norway rats to repeated ozone exposure: An assessment of behavior, serum biochemistry and cardiopulmonary function. Inhal. Toxicol. 2013, 25, 141–159. [Google Scholar] [CrossRef]
  46. Gordon, C.J.; Johnstone, A.F.M.; Aydin, C.; Phillips, P.M.; MacPhail, R.C.; Kodavanti, U.P.; Ledbetter, A.D.; Jarema, K.A. Episodic ozone exposure in adult and senescent brown Norway rats: Acute and delayed effect on heart rate, core temperature, and motor activity. Inhal. Toxicol. 2014, 26, 380–390. [Google Scholar] [CrossRef]
  47. Glowinski, J.; Iversen, L.L. Regional studies of catecholamines in the rat brain. 1. The disposition of [3H]-norepinephrine, [3H]-dopamine and [3H]-DOPA in various regions of the brain. J. Neurochem. 1996, 13, 655–669. [Google Scholar] [CrossRef] [PubMed]
  48. Bello, R.I.; Gomez-Diaz, C.; Navarro, F.; Alcain, F.J.; Villalba, J.M. Expression of NAD(P)H:quinone oxidoreductase 1 in HeLa cells: Role of hydrogen peroxide and growth phase. J. Biol. Chem. 2001, 276, 44379–44384. [Google Scholar] [CrossRef]
  49. Lind, C.; Cadenas, E.; Hochstein, P.; Ernster, L. DT-diaphorase: Purification, properties, and function. Meth. Enzymol. 1990, 186, 287–301. [Google Scholar] [PubMed]
  50. Cormier, A.; Morin, C.; Zini, R.; Tillement, J.P.; Lagrue, G. In vitro effects of nicotine on mitochondrial respiration and superoxide anion generation. Brain Res. 2001, 900, 72–79. [Google Scholar] [CrossRef] [PubMed]
  51. Miller, N.J.; Rice-Evans, C.; Davies, M.J.; Gopinathan, V.; Milner, A. A novel method for measuring antioxidant capacity and its application to monitoring the antioxidant status in premature neonates. Clin. Sci. 1993, 84, 407–412. [Google Scholar] [CrossRef] [PubMed]
  52. Seelig, G.F.; Meister, A. γ-Glutamylcysteine synthetase: Interactions of an essential sulfhydryl group. J. Biol. Chem. 1984, 259, 3534–3538. [Google Scholar] [PubMed]
Figure 1. Effects of (A) acute and (B) subacute ozone exposure on NAD(P)H: Quinone oxidoreductase (NQO1) activity in cerebellum, frontal cortex, hippocampus, hypothalamus, and striatum of Brown Norway male rats maintained on either a regular, high-fructose, or high-fat diet. Each value is a mean ± SE of five rats except for: Acute—Hypothalamus—0.8 ppm—High Fat (n = 4). * p < 0.05, within diet compared to Regular (5001).
Ijms 20 00011 g001
Figure 2. Effects of (A) acute and (B) subacute ozone exposure on NADH-ubiquinone reductase (UBIQ-RD) activity in the cerebellum, frontal cortex, hippocampus, hypothalamus, and striatum of Brown Norway male rats maintained on either a regular, high-fructose, or high-fat diet. Each value is a mean ± SE of five rats except for: Hypothalamus—0.8 ppm—High Fat (n = 4). * p < 0.05, within diet treatment compared to Regular (5001); a Significant interaction between dietary condition and ozone treatment, p < 0.01.
Ijms 20 00011 g002
Figure 3. Effects of (A) acute and (B) subacute ozone exposure on total antioxidant substances (TAS) in cerebellum, frontal cortex, hippocampus, hypothalamus, and striatum of Brown Norway male rats maintained on either a regular, high-fructose, or high-fat diet. Each value is a mean ± SE of five rats except for: Acute—Hypothalamus—0.8 ppm—High Fat (n = 4); Subacute—Hippocampus—Air/0.8 ppm—Regular (n = 4). α: p < 0.05, within diet compared to Air; * p < 0.05, within ozone treatment compared to Regular (5001); a Significant interaction between dietary condition and ozone treatment, p < 0.01.
Ijms 20 00011 g003
Figure 4. Effects of (A) acute and (B) subacute ozone exposure on γ-Glutamylcysteine synthetase (γ-GCS) activity in the cerebellum, frontal cortex, hippocampus, hypothalamus, and striatum of Brown Norway male rats maintained on either a regular, high-fructose, or high-fat diet. Each value is a mean ± SE of five rats except for: Hypothalamus—0.8 ppm—High Fat (n = 4). * p < 0.05, within diet treatment compared to Regular (5001). a Significant interaction between dietary condition and ozone treatment, p < 0.05.
Ijms 20 00011 g004
Figure 5. Effects of (A) acute and (B) subacute ozone exposure on protein carbonyl content in cerebellum, frontal cortex, hippocampus, and hypothalamus of Brown Norway male rats maintained on either a regular, high-fructose, or high-fat diet. Each value is a mean ± SE of five rats except for: Acute—Hypothalamus—0.8 ppm—High-Fructose (n = 4); Subacute—Cerebellum—Air—Regular (n = 8); Subacute—Hippocampus—Air/0.8 ppm—Regular (n = 4); Subacute—Hypothalamus—Air/0.8 ppm—Regular (n = 7/8). α: p < 0.05, within diet compared to Air; * p < 0.05, within diet treatment compared to Regular (5001). a Significant interaction between dietary condition and ozone treatment, p < 0.01.
Ijms 20 00011 g005
Figure 6. Effects of (A) acute and (B) subacute ozone exposure on total aconitase activity in cerebellum, frontal cortex, hippocampus, hypothalamus, and striatum of Brown Norway male rats maintained on either a regular, high-fructose, or high-fat diet. Each value is a mean ± SE of five rats. α: p < 0.05, within diet compared to Air; *: p < 0.05, within ozone treatment compared to Regular (5001); β*: p < 0.01, within ozone treatment compared to Regular (5001). a Significant interaction between dietary condition and ozone treatment, p < 0.01.
Ijms 20 00011 g006
Figure 7. Schematic of interpreted overall effects following subacute exposures to O3 and diets. Arrows below respective assay indicate an increase (red arrow) or decrease (green arrow) in that particular parameter. Big red arrow indicates negative effect on the cell while Big blue arrow is indicative of a positive effect and when antioxidant homeostasis is unbalanced with oxidant production, oxidative damage occurs.
Ijms 20 00011 g007
Figure 8. Exposure Paradigm. Animals were received on postnatal day (PND) 21 and either control, high-fat, or high-fructose diets were started on PND 27. Subjects remained on diet throughout the entirety of the study. Acute group was exposed once to O3 on PND 113 and terminated 18 h following. Subacute group received four O3 exposures over 4 weeks and terminated 18 h after final exposure. During this time, physiological parameters (motor activity, glucose tolerance, body composition, metabolism, and ventilatory function) were examined. Following termination, both groups were processed for pathology and brain regions were collected. Timeline is not to scale.
Ijms 20 00011 g008
Table 1. Composition of diets (% by weight).
ComponentRegular (5001) aHigh Fructose bHigh Fat c
Fat13.55.234.3
Carbohydrates58.060.427.3
Protein28.518.323.5
Metabolizable Energy (kcal/g)3.023.65.1
a Ralston Purina; b Harlan TD.89247; c Harlan TD.06414.

