A Precise Gas Dilutor Based on Binary Weighted Critical Flows to Create NO2 Concentrations †


Institute of Electronic Sensor Systems, Graz University of Technology, 8010 Graz, Austria
*
Author to whom correspondence should be addressed.
†
Presented at the Eurosensors 2018 Conference, Graz, Austria, 9–12 September 2018.
Proceedings 2018, 2(13), 998; https://doi.org/10.3390/proceedings2130998
Published: 7 December 2018
(This article belongs to the Proceedings of EUROSENSORS 2018)
Abstract
:A gas diluter based on critical orifices was built and evaluated. The gas diluter is capable of creating dilution ratios of 1:1400 at a total flow of 6.5 L/ min. An extended uncertainty analysis of gas concentrations and dilution ratios according to the Guide to the Expression of Uncertainty in Measurement was conducted. A gas cylinder of 5.16 ppm NO2 with a relative uncertainty of 1.5% (k = 1) can be diluted down to a concentration of 3.69 ppb NO2 (dilution ratio of 1:1400) at an uncertainty of 1.9% (k = 1). The results are in good agreement with reference NO2 measurements, conducted with a chemiluminescence detector (CLD, European reference method EN14211; 2005).
Published: 7 December 2018
1. Introduction
Interests in air quality and exhaust emission measurements have pushed research in new gas sensors. To calibrate and test these sensors, it is necessary to precisely generate gas concentrations over a wide dynamic range. Typical concentrations for environmental NO2 concentrations are in the range of 0.4 µg m−3 (natural background measurements) to 1015 μg m−3 (roadside measurements), which requires a dynamic range of more than 1:1000 [1]. Simple solutions, facilitating mass flow controllers, only produce valid dilution ratios down to 1:5 (cf. Ref. [2]). Advanced gas diluters based on capillaries usually do not allow for higher dilution ratios than 1:10. A binary weighted combination of critical orifices, however, allows high dilution rates at low relative errors, as was shown e.g., in Ref. [3].
2. Materials and Methods
Figure 1 shows a schematic drawing of the gas diluter presented in this work. Critical orifices A to K are placed in an aluminum block (grey) and can individually be set to N2 or NO2 by ball valves. Orifice diameters are chosen such, that the flow rate through each orifice is doubled compared to the next smaller orifice (numbers next to the letters represent the flow rate relative to orifice A). Only the smallest two orifices (A and B) have the same diameter in order to compare the flow rate through orifices A and B with orifice C. Orifice flows were calibrated by means of a Gilibrator 2 bubble flow meter as a primary standard. Great care was taken to exclusively use gas carrying parts made of PTFE and stainless steel, to enable gas dilution of corrosive gases as well.
Dilution ratios are calculated based on relative flow rates with respect to orifice A as described in Ref. [3]. For example, the relative flow rate rC through orifice C is given by Equation (1), where fA, fB, and fC are the measured flow rates through orifices A, B, and C; the flow rate fA+B is the measured flow rate through orifices A and B, and the relative flow rate rB is defined as .
Figure 1.
Schematic drawing of the gas diluter. Red dotted lines represent the path of N2. Green lines represent the path of NO2. The eleven critical orifices are placed within an aluminum block (grey). Numbers next to the orifice letters represent the flow rate relative to orifice A.
Figure 1.
Schematic drawing of the gas diluter. Red dotted lines represent the path of N2. Green lines represent the path of NO2. The eleven critical orifices are placed within an aluminum block (grey). Numbers next to the orifice letters represent the flow rate relative to orifice A.

In the same fashion, the remaining relative flow rates can be calculated (cf. Equation (2) for rD).
Additionally, all relative flow rates are related to the NO2 side, as suggested in Ref. [3]. This is done by calculating the average relative flow through each orifice between NO2 and N2 side for both sides and additionally weighting the N2 side with the relation of the maximum total flows
We use eleven orifices with critical flows ranging from 5.833 mL/ min to 3.134 L/ min. Therefore, a theoretical dilution ratio of 1:1024 is possible. Although precision pressure regulators (LNI Swissgas RP 10) are used on the NO2 and N2 side, the upstream pressure is dropping slightly with increasing flow rate. Therefore, all flow rates have to be related to the same upstream pressure. Flow rates can be easily corrected by assuming a linear pressure-flow rate dependency (), as shown in Equation (3). Each flow rate is related to the upstream pressure at the flow rate through the smallest orifice (), yielding the corrected flow rate Due to the flow rate corrections the maximum dilution ratio is 1:1400. To compensate the cooling effect as consequence of gas expansion, the critical orifices are embodied in a solid, temperature regulated aluminum block, conditioned at 30 °C.
All pressure sensors are equipped with analog outputs. Data acquisition of the pressure measurements was performed using analog inputs of an NI USB-6009. Atmospheric pressure (patm in Figure 1) was measured with a MPX5100AP (NXP) absolute pressure sensor. The differential pressure between N2 and NO2 (dpNO/NO2) was controlled with a TSCSNBN 005 (Honeywell) sensor. The differential pressure between upstream and downstream (dpp2/p1) was measured using a 26PCDFA6D (Honeywell) sensor.
3. Results
To validate the gas diluter, 5.16 ppm NO2 in synthetic air (1.5% relative uncertainty (k = 1), standard gas cylinder) was diluted with N2 and measured with a CLD (API T200). Uncertainties of NO2 concentrations were calculated according to the Guide to the expression of uncertainty of measurement for the combined standard uncertainty of uncorrelated input quantities (chapter 5.1 of Ref. [4]), using GUM Workbench Professional Version 2.4 (Metrodata GmbH). The resulting NO2 concentrations and the corresponding uncertainties are depicted in Table 1. The largest uncertainty contribution stems from the concentration of the NO2 gas cylinder. This explains the small increase in relative uncertainty with increasing dilution ratio, i.e., decreasing NO2 concentration.
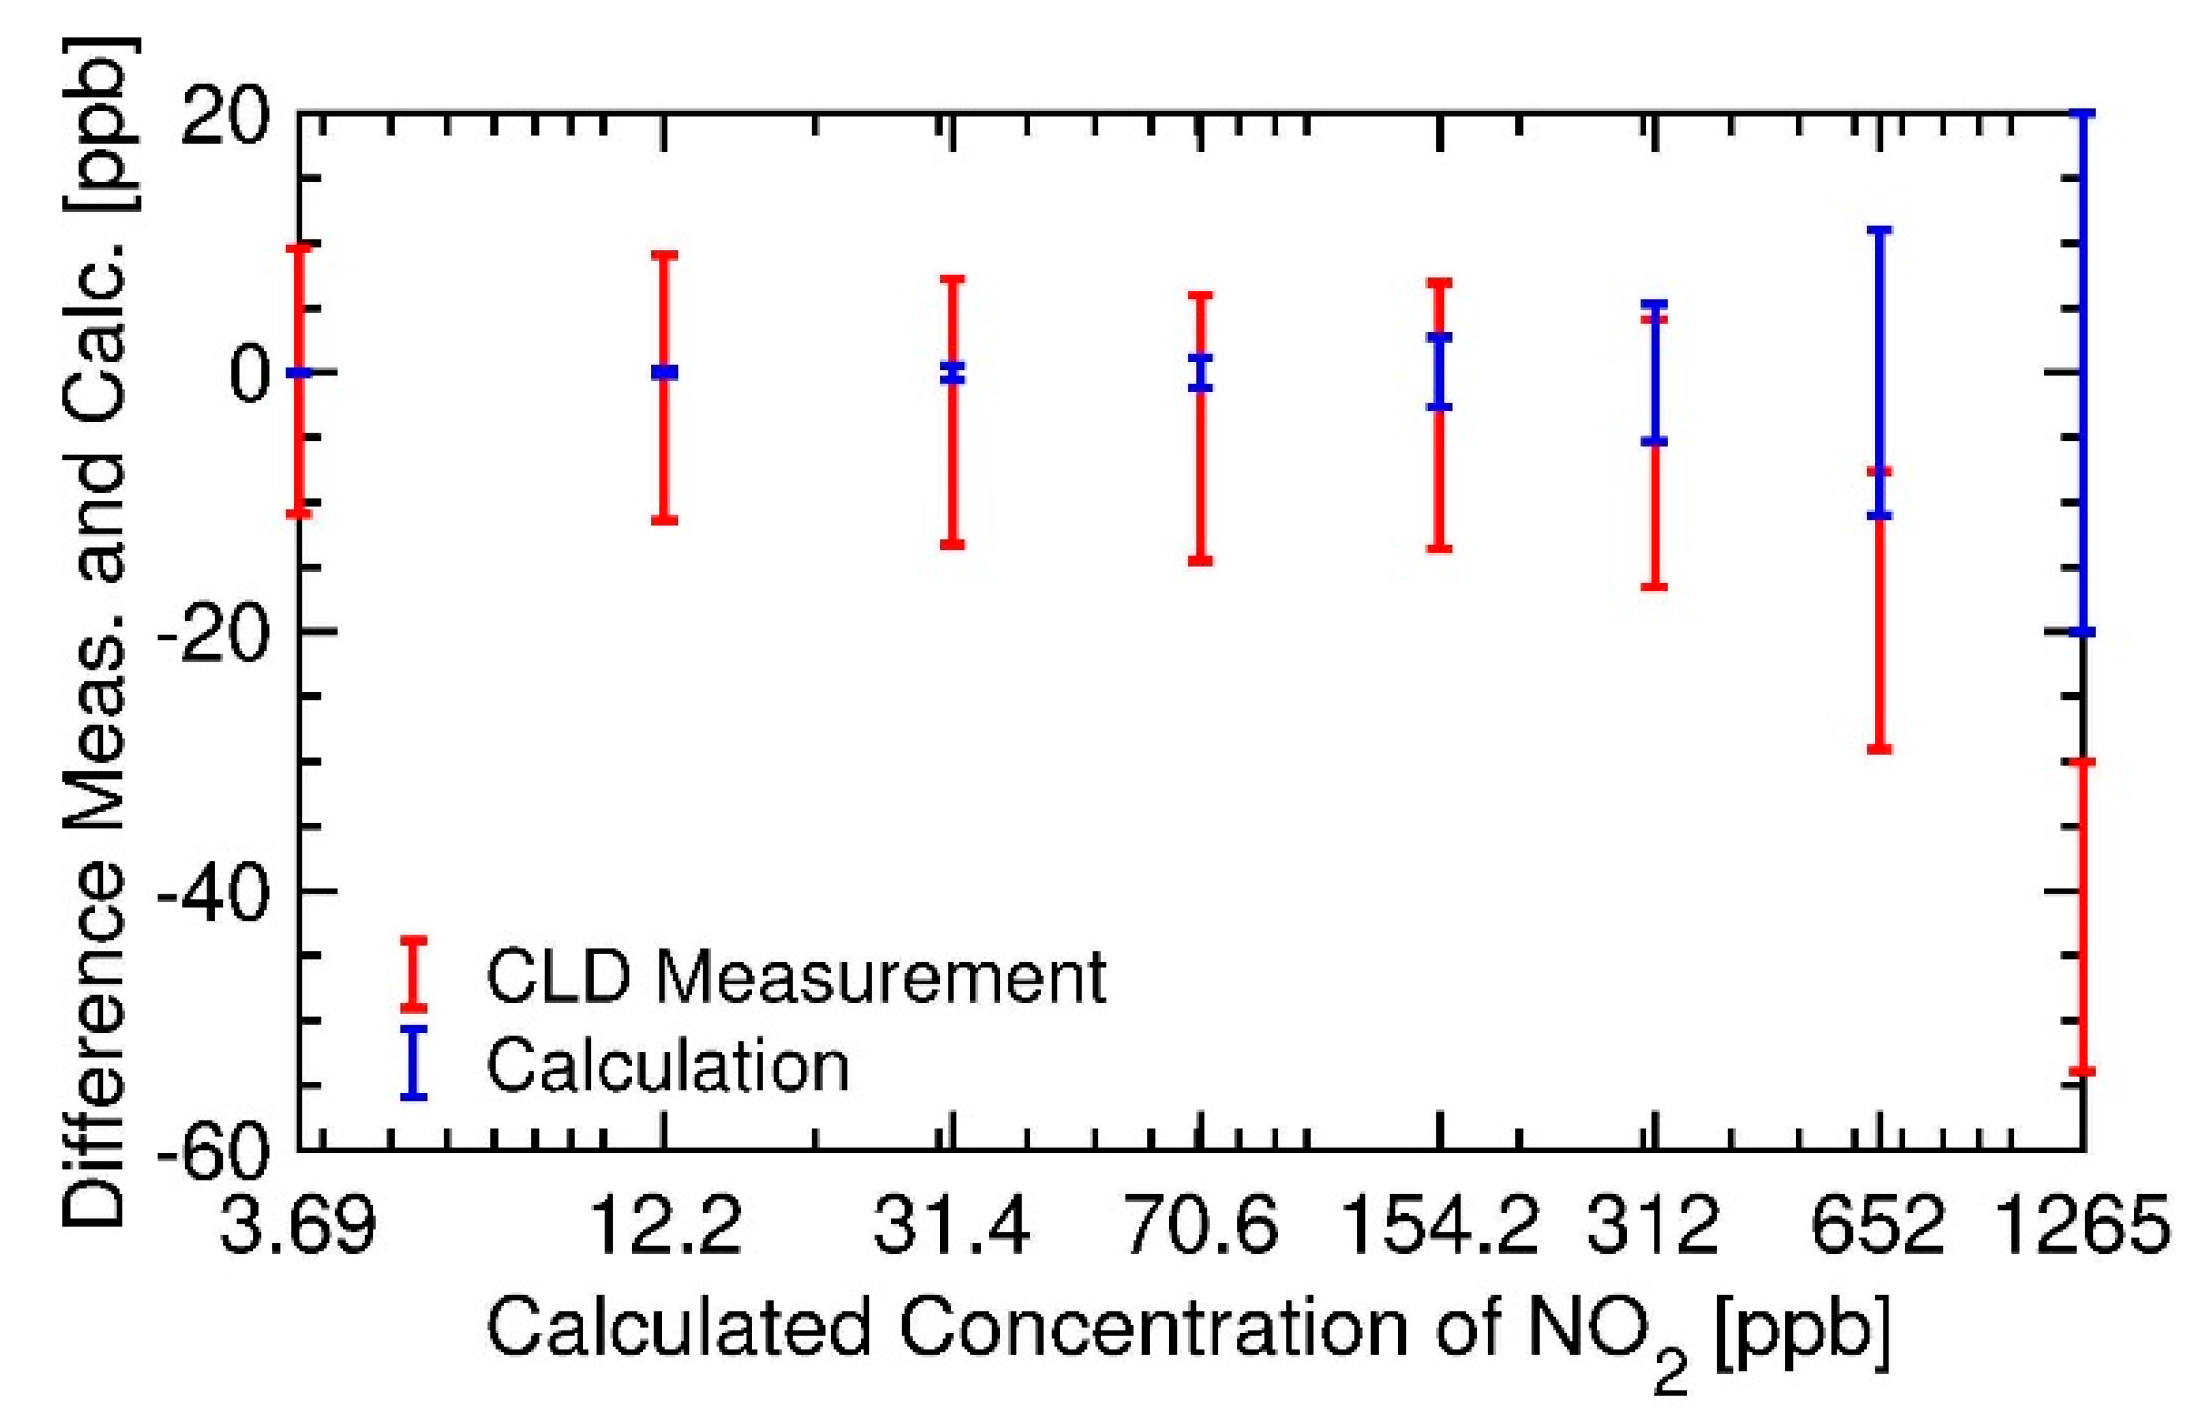
To analyse gas concentrations generated with the gas diluter, the difference between theoretical and measured gas concentrations are depicted as a function of the theoretical gas concentrations in Figure 2. Error bars of the CLD were calculated according to the API T200 specifications [5]. Good agreement was achieved for concentrations up to 652 ppb. As the CLD was spanned with a 836 ppb bottle, measurements above 1000 ppb are extrapolated, explaining the deviation of the 1265 ppb measurement.
As a result of the high dynamic range, the flow through the smallest orifice (A) is only 1/500 of the largest orifice (K). The timeseries of a measurement where valve A was switched from N2 to NO2 (Figure 3), shows that a 30 min waiting time is necessary to obtain stable concentrations.
4. Discussion
The gas diluter presented in this work was successfully evaluated by diluting NO2 with N2 and measuring the resulting concentrations with an API T200 CLD. All generated concentrations were within the error of the CLD and the gas diluter. However, the high dilution rates of the diluter come with the disadvantage of low gas exchange time.
Funding
This research received no external funding.
Acknowledgments
We thank Metrodata GmbH for the provision of GUM Workbench Professional Version 2.4. We also thank the Institute of Internal Combustion Engines and Thermodynamics (FVT) from TU Graz for providing us a calibrated API T200 chemiluminescence detector and their knowledge of operating it.
Conflicts of Interest
The authors declare no conflict of interest. The founding sponsors had no role in the design of the study; in the collection, analyses, or interpretation of data; in the writing of the manuscript, and in the decision to publish the results.
References
- World Health Organization. Regional Office for Europe. Nitrogen dioxide. In Air Quality Guidelines for Europe; Frank Theakston; World Health Organization, Regional Office for Europe: Copenhagen, Denmark, 2000; p. 175. ISBN 92-890-1358-3. [Google Scholar]
- Wiegleb, G. Kalibrierung und Prüfverfahren. In Gasmesstechnik in Theorie und Praxis; Springer Fachmedien: Wiesbaden, Germany, 2016; Volume 1, pp. 713–714. ISBN 978-3-658-10687-4. [Google Scholar]
- Brewer, P.J.; Goody, B.A.; Gillam, T.; Brown, R.J.C.; Milton, M.J.T. High-accuracy stable gas flow dilution using an internally calibrated network of critical flow orifices. Meas. Sci. Technol. 2010, 21, 115902. [Google Scholar] [CrossRef]
- JCGM/WG 1. In Guide to the Expression of Uncertainty in Measurement, 1st ed.; Bureau international des poids et mesures: Sèvres, France, 2008.
- The Model T200 Chemiluminescence NO/NO2/NOx Analyzer. Available online: http://www.teledyne-api. com/prod/Downloads/SAL000046F%20-%20T200.pdf (accessed on 16 June 2018).
Figure 2.
Deviation of the measured from the calculated concentrations (x-axis). Calculated (blue) and measured (red) values are shown with corresponding error bars and are baseline corrected to zero.
Figure 2.
Deviation of the measured from the calculated concentrations (x-axis). Calculated (blue) and measured (red) values are shown with corresponding error bars and are baseline corrected to zero.

Figure 3.
Valve A is switched from N2 to NO2. Due to the low flow rate of the smallest orifices, 30 min waiting time is necessary for achieving a stable concentration.
Figure 3.
Valve A is switched from N2 to NO2. Due to the low flow rate of the smallest orifices, 30 min waiting time is necessary for achieving a stable concentration.


Table 1.
Calculated NO2 concentrations and uncertainties in parts per billion (ppb) and percent (%).
Table 1.
Calculated NO2 concentrations and uncertainties in parts per billion (ppb) and percent (%).
| Concentration [ppb] | Uncertainty, k = 1 [ppb] | Relative Uncertainty, k = 1 [%] |
|---|---|---|
| 3.69 | 0.069 | 1.9 |
| 12.2 | 0.22 | 1.8 |
| 31.4 | 0.56 | 1.8 |
| 70.6 | 1.2 | 1.7 |
| 154.2 | 2.7 | 1.8 |
| 312 | 5.3 | 1.7 |
| 652 | 11 | 1.7 |
| 1265 | 20 | 1.6 |
| 2686 | 42 | 1.6 |
Publisher’s Note: MDPI stays neutral with regard to jurisdictional claims in published maps and institutional affiliations. |
© 2018 by the authors. Licensee MDPI, Basel, Switzerland. This article is an open access article distributed under the terms and conditions of the Creative Commons Attribution (CC BY) license (http://creativecommons.org/licenses/by/4.0/).
Share and Cite
MDPI and ACS Style
Breitegger, P.; Bergmann, A. A Precise Gas Dilutor Based on Binary Weighted Critical Flows to Create NO2 Concentrations. Proceedings 2018, 2, 998. https://doi.org/10.3390/proceedings2130998
AMA Style
Breitegger P, Bergmann A. A Precise Gas Dilutor Based on Binary Weighted Critical Flows to Create NO2 Concentrations. Proceedings. 2018; 2(13):998. https://doi.org/10.3390/proceedings2130998
Chicago/Turabian StyleBreitegger, Philipp, and Alexander Bergmann. 2018. "A Precise Gas Dilutor Based on Binary Weighted Critical Flows to Create NO2 Concentrations" Proceedings 2, no. 13: 998. https://doi.org/10.3390/proceedings2130998