Article

The Role of Sugarcane Catalase Gene ScCAT2 in the Defense Response to Pathogen Challenge and Adversity Stress

1
Key Laboratory of Sugarcane Biology and Genetic Breeding, Ministry of Agriculture, Fujian Agriculture and Forestry University, Fuzhou 350002, China
2
Key Laboratory of Ministry of Education for Genetics, Breeding and Multiple Utilization of Crops, College of Crop Science, Fujian Agriculture and Forestry University, Fuzhou 350002, China
*
Author to whom correspondence should be addressed.
Int. J. Mol. Sci. 2018, 19(9), 2686; https://doi.org/10.3390/ijms19092686
Submission received: 5 August 2018 / Revised: 30 August 2018 / Accepted: 6 September 2018 / Published: 10 September 2018
(This article belongs to the Special Issue Plant–Fungal Interactions)

Abstract

:
Catalases, which consist of multiple structural isoforms, catalyze the decomposition of hydrogen peroxide in cells to prevent membrane lipid peroxidation. In this study, a group II catalase gene ScCAT2 (GenBank Accession No. KF528830) was isolated from sugarcane genotype Yacheng05-179. ScCAT2 encoded a predicted protein of 493 amino acid residues, including a catalase active site signature (FARERIPERVVHARGAS) and a heme-ligand signature (RVFAYADTQ). Subcellular localization experiments showed that the ScCAT2 protein was distributed in the cytoplasm, plasma membrane, and nucleus of Nicotiana benthamiana epidermal cells. Quantitative real-time polymerase chain reaction (qRT-PCR) analysis indicated that the ScCAT2 gene was ubiquitously expressed in sugarcane tissues, with expression levels from high to low in stem skin, stem pith, roots, buds, and leaves. ScCAT2 mRNA expression was upregulated after treatment with abscisic acid (ABA), sodium chloride (NaCl), polyethylene glycol (PEG), and 4 °C low temperature, but downregulated by salicylic acid (SA), methyl jasmonate (MeJA), and copper chloride (CuCl2). Moreover, tolerance of Escherichia coli Rosetta cells carrying pET-32a-ScCAT2 was enhanced by NaCl stress, but not by CuCl2 stress. Sporisorium scitamineum infection of 10 different sugarcane genotypes showed that except for YZ03-258, FN40, and FN39, ScCAT2 transcript abundance in four smut-resistant cultivars (Yacheng05-179, YZ01-1413, YT96-86, and LC05-136) significantly increased at the early stage (1 day post-inoculation), and was decreased or did not change in the two smut-medium-susceptibility cultivars (ROC22 and GT02-467), and one smut-susceptible cultivar (YZ03-103) from 0 to 3 dpi. Meanwhile, the N. benthamiana leaves that transiently overexpressed ScCAT2 exhibited less severe disease symptoms, more intense 3,3′-diaminobenzidine (DAB) staining, and higher expression levels of tobacco immune-related marker genes than the control after inoculation with tobacco pathogen Ralstonia solanacearum or Fusarium solani var. coeruleum. These results indicate that ScCAT2 plays a positive role in immune responses during plant–pathogen interactions, as well as in salt, drought, and cold stresses.

Graphical Abstract

1. Introduction

Catalase (E.C.1.11.1.6; hydrogen peroxide oxidoreductase; CAT), a heme-containing tetramer enzyme, is one of the major enzyme defense systems widely distributed in living organisms. In higher plants, the main function of catalase is to degrade H2O2 and contribute to the prevention of oxidative damage caused by various biotic and abiotic stresses [1,2]. To date, CAT genes have been cloned and identified in various Graminaceae crops, such as Oryza sativa [3], Zea mays [4], Hordeum vulgare [5], and Triticum aestivum [6]. Studies have suggested that CATs are mainly distributed in peroxisomes, glyoxysomes, and the cytoplasm, whereas a small number occur in the mitochondria [7,8].
The expression of catalase genes is regulated by biotic or abiotic stresses [9,10,11,12,13,14,15,16,17,18,19]. Du et al. [9] detected that the expression of the CAT1, CAT2, and CAT3 genes, and the enzyme activities of CATs in Arabidopsis thaliana could be induced by cold, drought, oxidative stress, salicylic acid (SA), and abscisic acid (ABA). Yong et al. [20] showed that the overexpression of the IbCAT2 gene of Ipomoea batatas confers salt and drought tolerance in Escherichia coli and Saccharomyces cerevisiae. Purev et al. [17] have reported that PgCat1 is expressed at different levels in the leaves, stems, roots of Panax ginseng seedlings, and is significantly induced by various stresses, including cropper, hyperosmosis, hydrogen peroxide, ABA, SA, jasmonic acid (JA), chilling, and high light irradiances. Ngcat1 mRNA expression in Nicotiana glutinosa is the highest in leaves, and is repressed by treatment with SA [19]. Both the transcripts of Ngcat1 and its enzyme activity have also been observed in N. benthamiana plants eliciting hypersensitive response (HR) during tobacco mosaic virus (TMV) infection [19].
Catalases, which have multiple structural isoforms, are divided into two groups according to molecular structure and amino acid homologies. Group I consists of two 55 kDa and two 59 kDa subunits, with unique amino acid sequences of Ser–Arg–Leu. Group II consists of four 55 kDa subunits with a unique amino acid sequence of Ser–Ser–Ser [5,8]. Different family members of CATs exhibit variable expression patterns in plants. Three CATs from A. thaliana show organ-specific expression, and are differentially expressed in response to various abiotic stresses [9,21]. Similarly, a Manihot esculenta Crantz catalase gene, MecCAT1, is expressed predominantly in the roots and at very low levels in the leaves, suggesting that MecCAT1 plays a role in delaying deterioration responses [22].
To date, eight CAT genes have been found in Saccharum spp. [23,24,25]. We previously described a positive correlation between catalase activity and smut resistance in sugarcane [23]. A plasma membrane and cytoplasm located catalase gene ScCAT1 (GenBank Accession No. KF664183) was isolated from sugarcane variety Yacheng05-179 after inoculation with smut pathogen Sporisorium scitamineum [23]. ScCAT1 showed a positive response to S. scitamineum infection and various abiotic stimuli, such as plant hormone treatment, oxidative stress, heavy metals, and hyperosmotic stresses [23]. A CAT protein sequence (AGT16310.1) from Saccharum hybrid cultivar R570 has been submitted to National Center for Biotechnology Information (NCBI), however, its function remains unclear. Liu et al. [24] isolated two CAT genes from sugarcane, including SoCAT-1 in S. officinarum and SsCAT-1 in S. spontaneum, and found two allelic variants at the SoCAT-1 (SoCAT-1a and SoCAT-1b, GenBank Accession Nos. KF864224 and KF864225) and SsCAT-1 (SsCAT-1a and SsCAT-1b, GenBank Accession Nos. KF864226 and KF864227) loci. Liu et al. [25] have also cloned EaCAT-1b (GenBank Accession No. KF864228) from Erianthus arundinaceus and SoCAT-1c (GenBank Accession No. KF864231) from S. officinarum. Although the cDNA homology between EaCAT-1b and SoCAT-1c is 98.6%, EaCAT-1b is upregulated by drought stress, whereas SoCAT-1c is downregulated. However, information on the full-length coding sequence of other ScCAT family members and their functions in sugarcane defense is limited. In the present study, a full-length sugarcane catalase gene ScCAT2 (GenBank Accession No. KF528830) was isolated from Yacheng05-179. After protein structural prediction and phylogenetic reconstruction, the gene expression patterns of ScCAT2 under biotic and abiotic stresses, prokaryotic expression analysis, subcellular localization, and transient overexpression in N. benthamiana plants treated with tobacco pathogens, were investigated.

2. Results

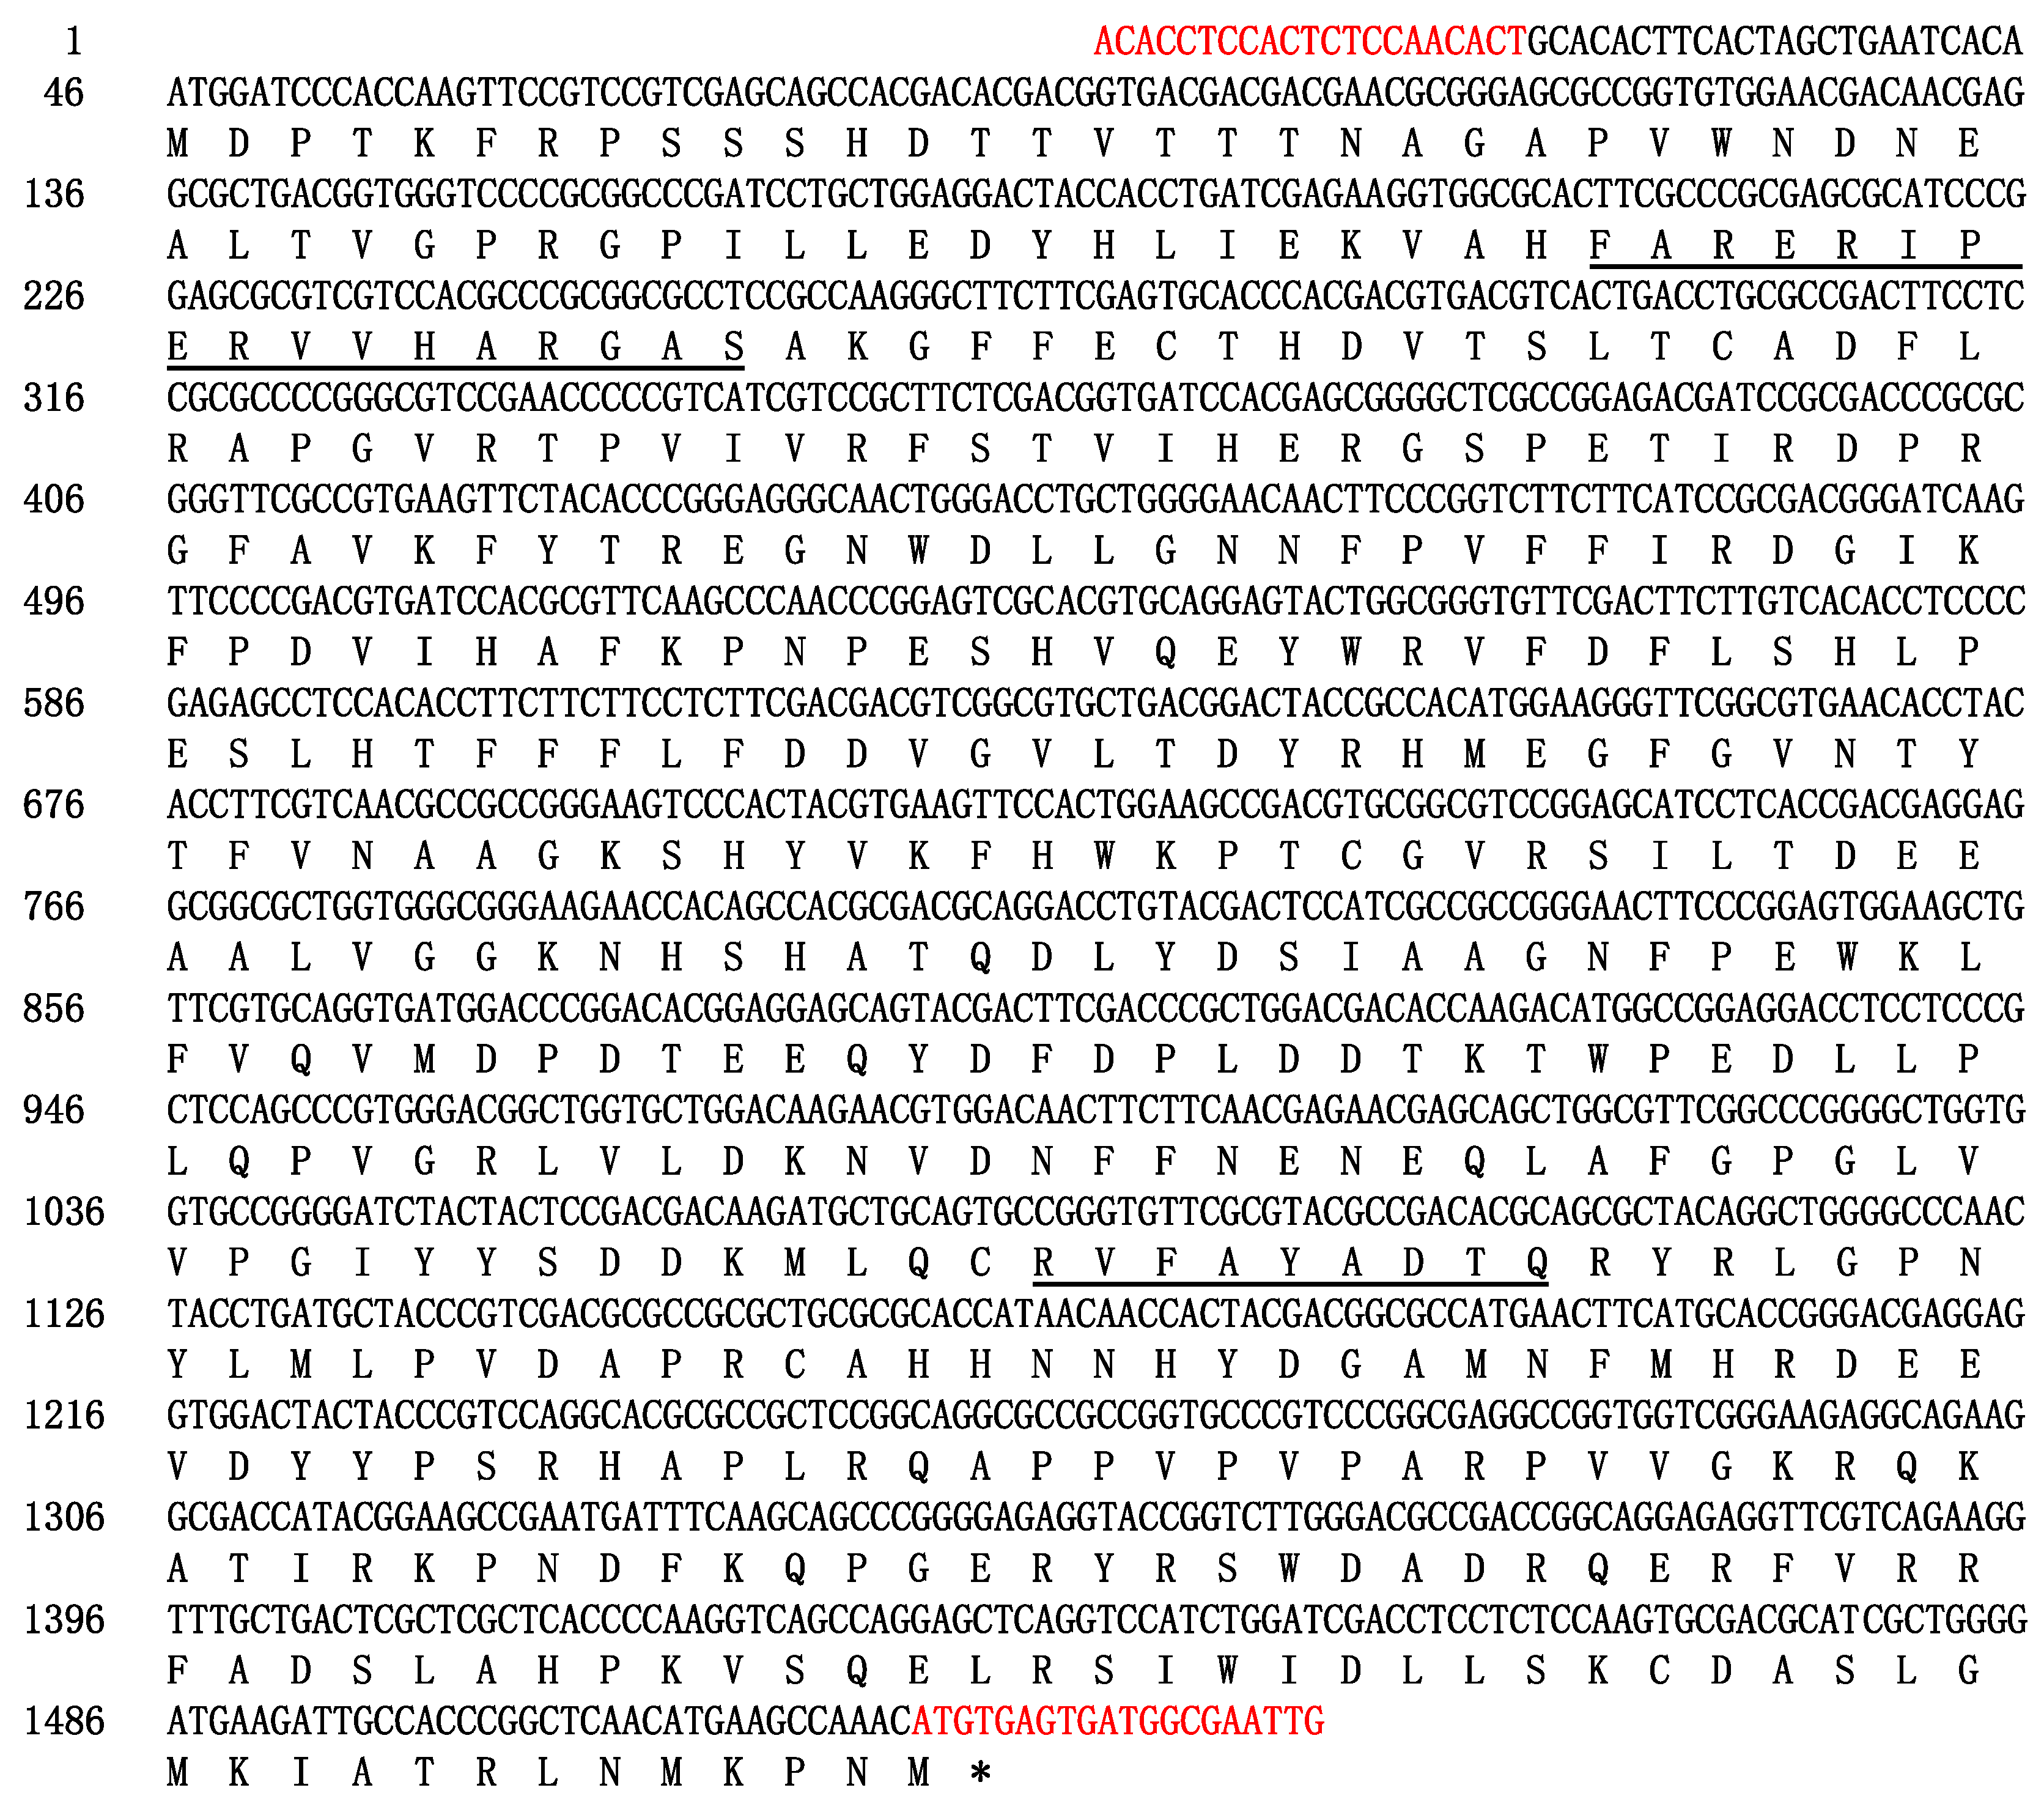
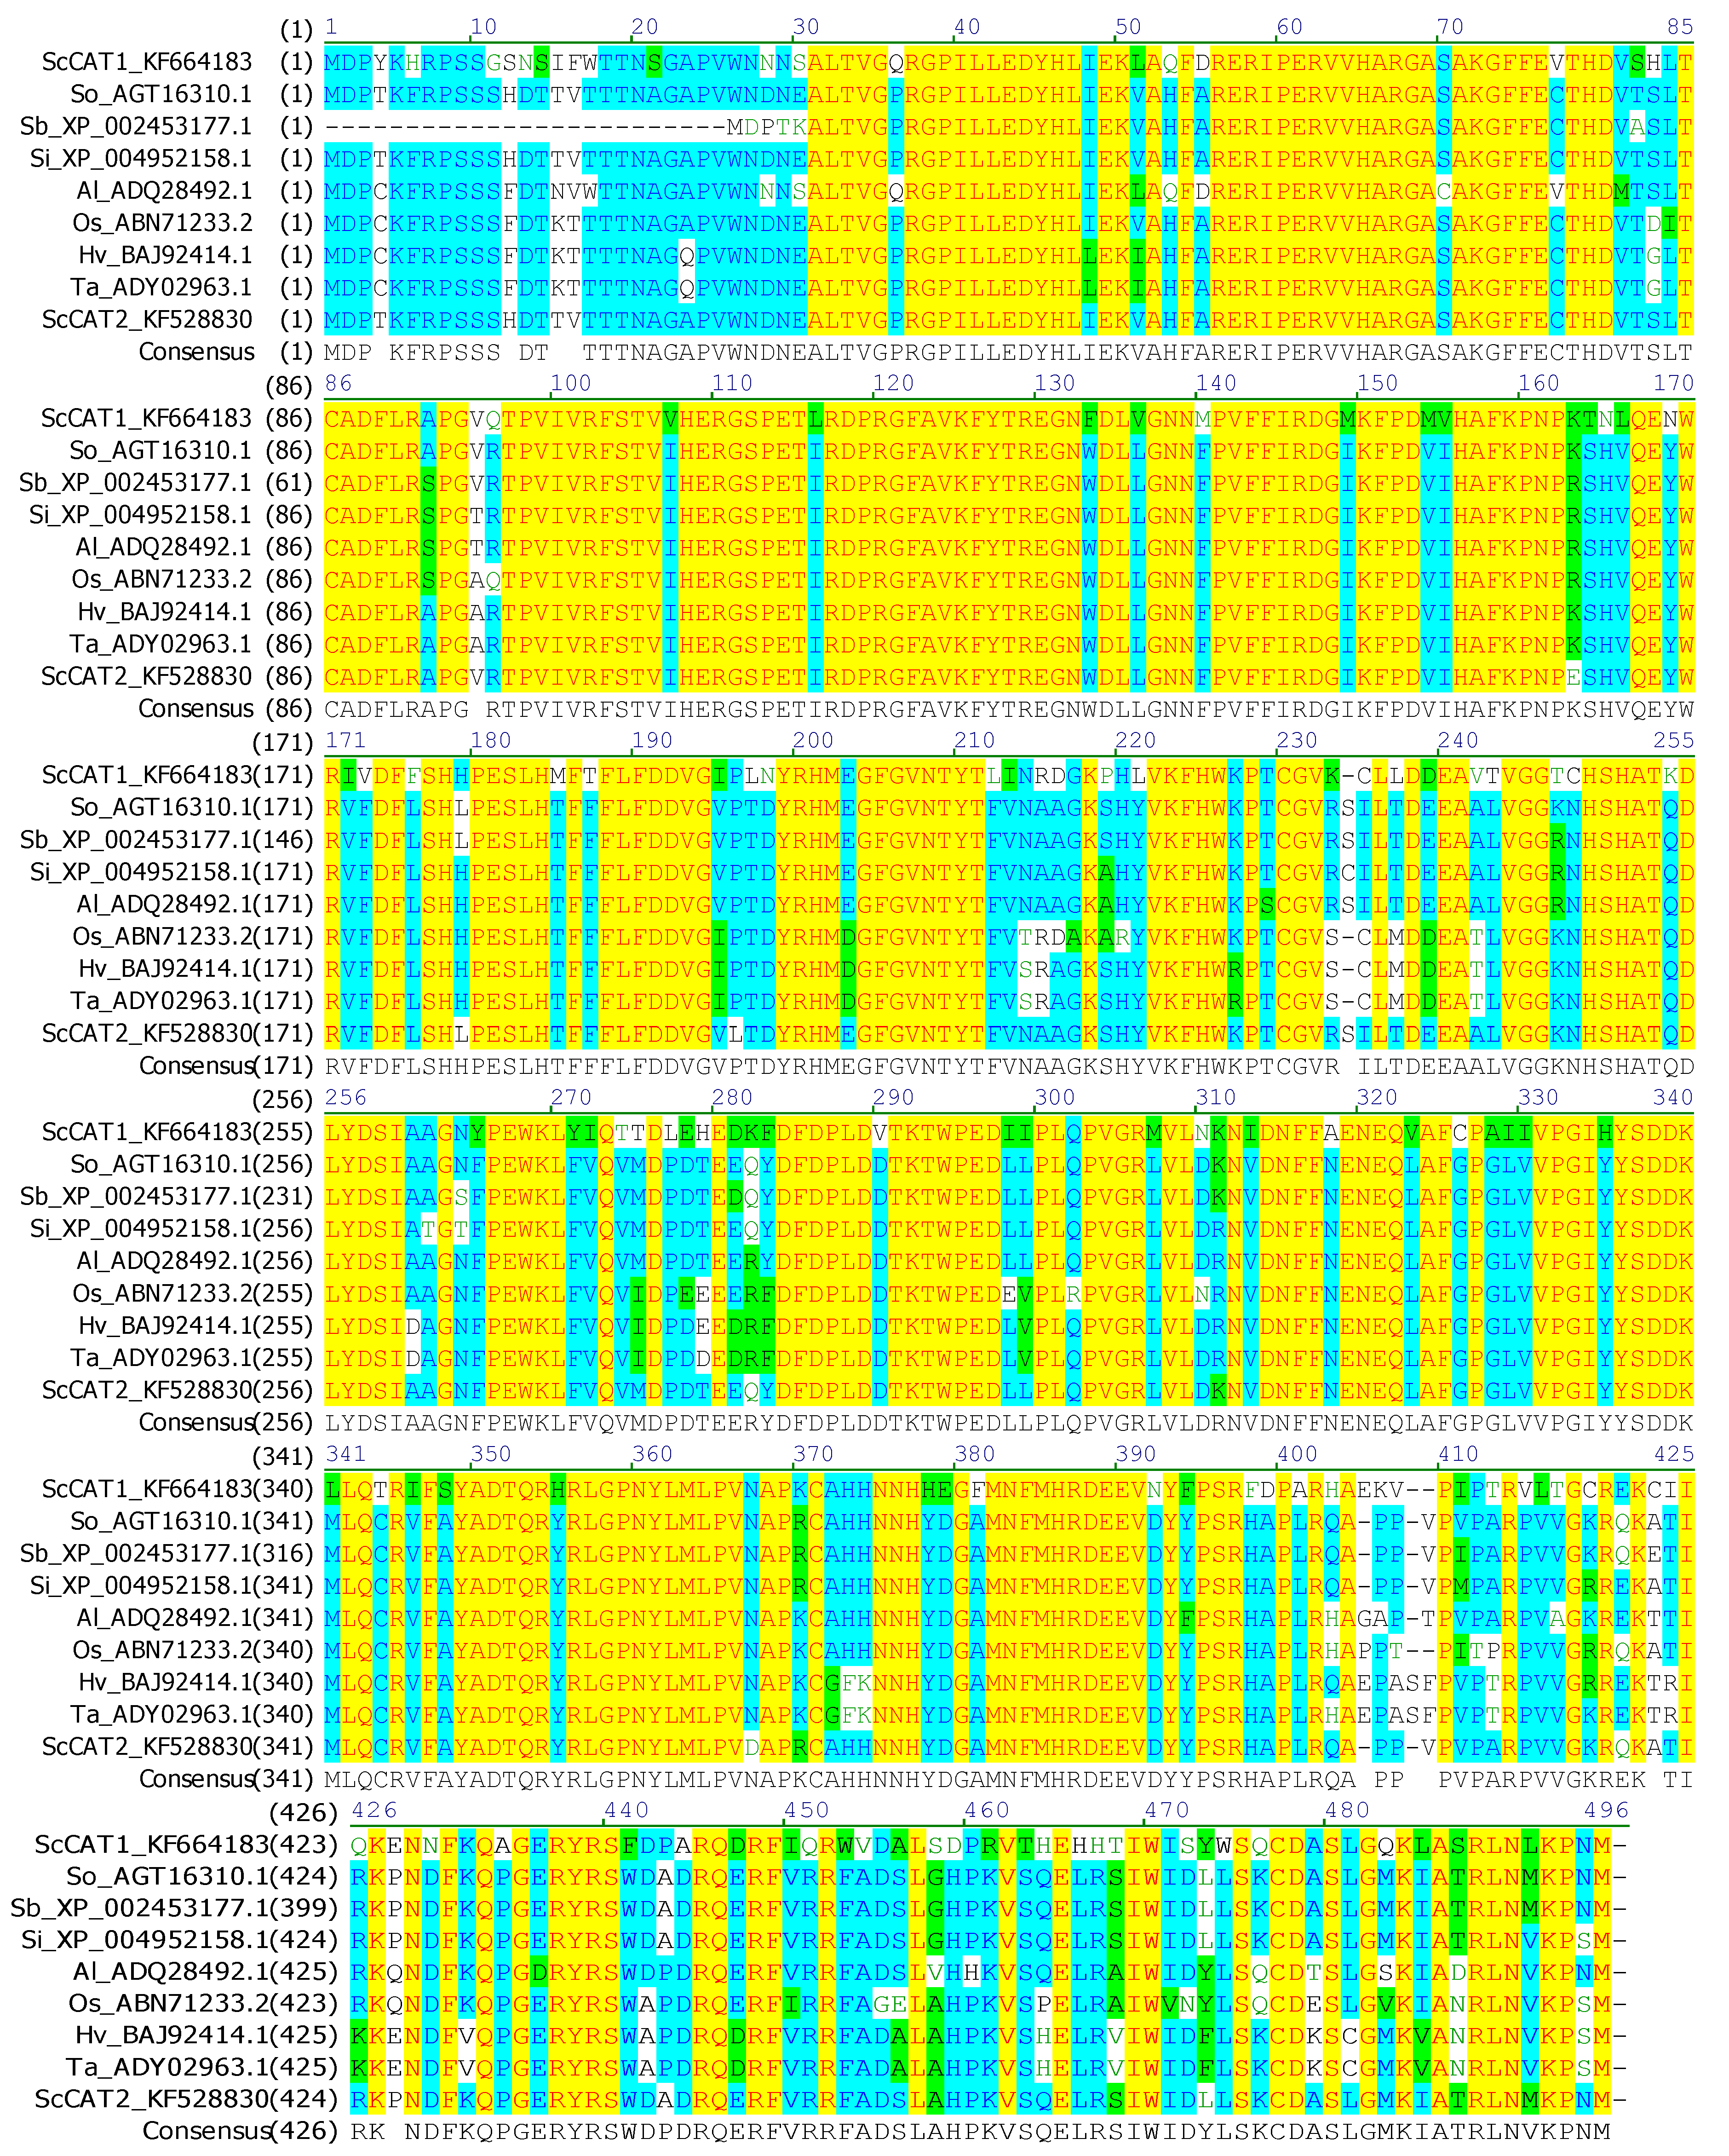
2.1. Cloning and Sequence Analysis of ScCAT2 Gene

A full-length sugarcane catalase gene ScCAT2 (GenBank Accession No. KF528830) was assembled in silico, and cloned from Yacheng05-179 by real-time polymerase chain reaction (RT-PCR). The open reading frame (ORF) of the ScCAT2 gene consisted of 1482 nucleotides and was predicted to encode 493 amino acids (Figure 1). The molecular weight and isoelectric point of the ScCAT2 protein were 56.51 kDa and 6.32, respectively. The ScCAT2 protein was hydrophilic and did not include a signal peptide and transmembrane helix domain, indicating that ScCAT2 may not be a secretory protein. The results of conservative domain search result suggested that ScCAT2 was a member of the catalase-like superfamily which was characterized by a catalase active site signature (FARERIPERVVHARGAS) at positions 54–70, and a heme-ligand signature (RVFAYADTQ) at positions of 344–352 (Figure 1). The secondary structure of the protein encoded by the ScCAT2 gene consisted of irregular curls (57%), α-spirals (25.15%), and extension chains (17.85%). Basic local alignment search tool for proteins (BLASTP) sequence analysis indicated that ScCAT2 was highly homologous to sugarcane and other plant catalases (Figure 2), including the catalase (AGT16310.1, 99.19% identity) from Saccharum hybrid cultivar R570, Sorghum bicolor catalase (XP_002453177.1, 91.68% identity), Setaria italic catalase (XP_004952158.1, 96.35% identity), Aeluropus littoralis catalase (ADQ28492.1, 90.89% identity), O. sativa catalase (ABN71233.2, 87.63% identity), H. vulgare catalase (BAJ92414.1, 87.68% identity), T. aestivum catalase (ADY02963.1, 87.88% identity), and S. officinarum ScCAT1 (KF664183, 71.81% identity). Figure 3 showed that the catalase proteins from sugarcane, Z. mays, O. sativa, H. vulgare, T. aestivum, S. italic, S. bicolor, and A. litoralis could be clustered into two groups, which agreed with the results of Saruyama and Matsumura [6]. ScCAT2 was clustered with group II, and only showed 71.81% identity with ScCAT1, which belonged to group I. These results suggest that sugarcane ScCAT2 encodes a hypothetical group II catalase.

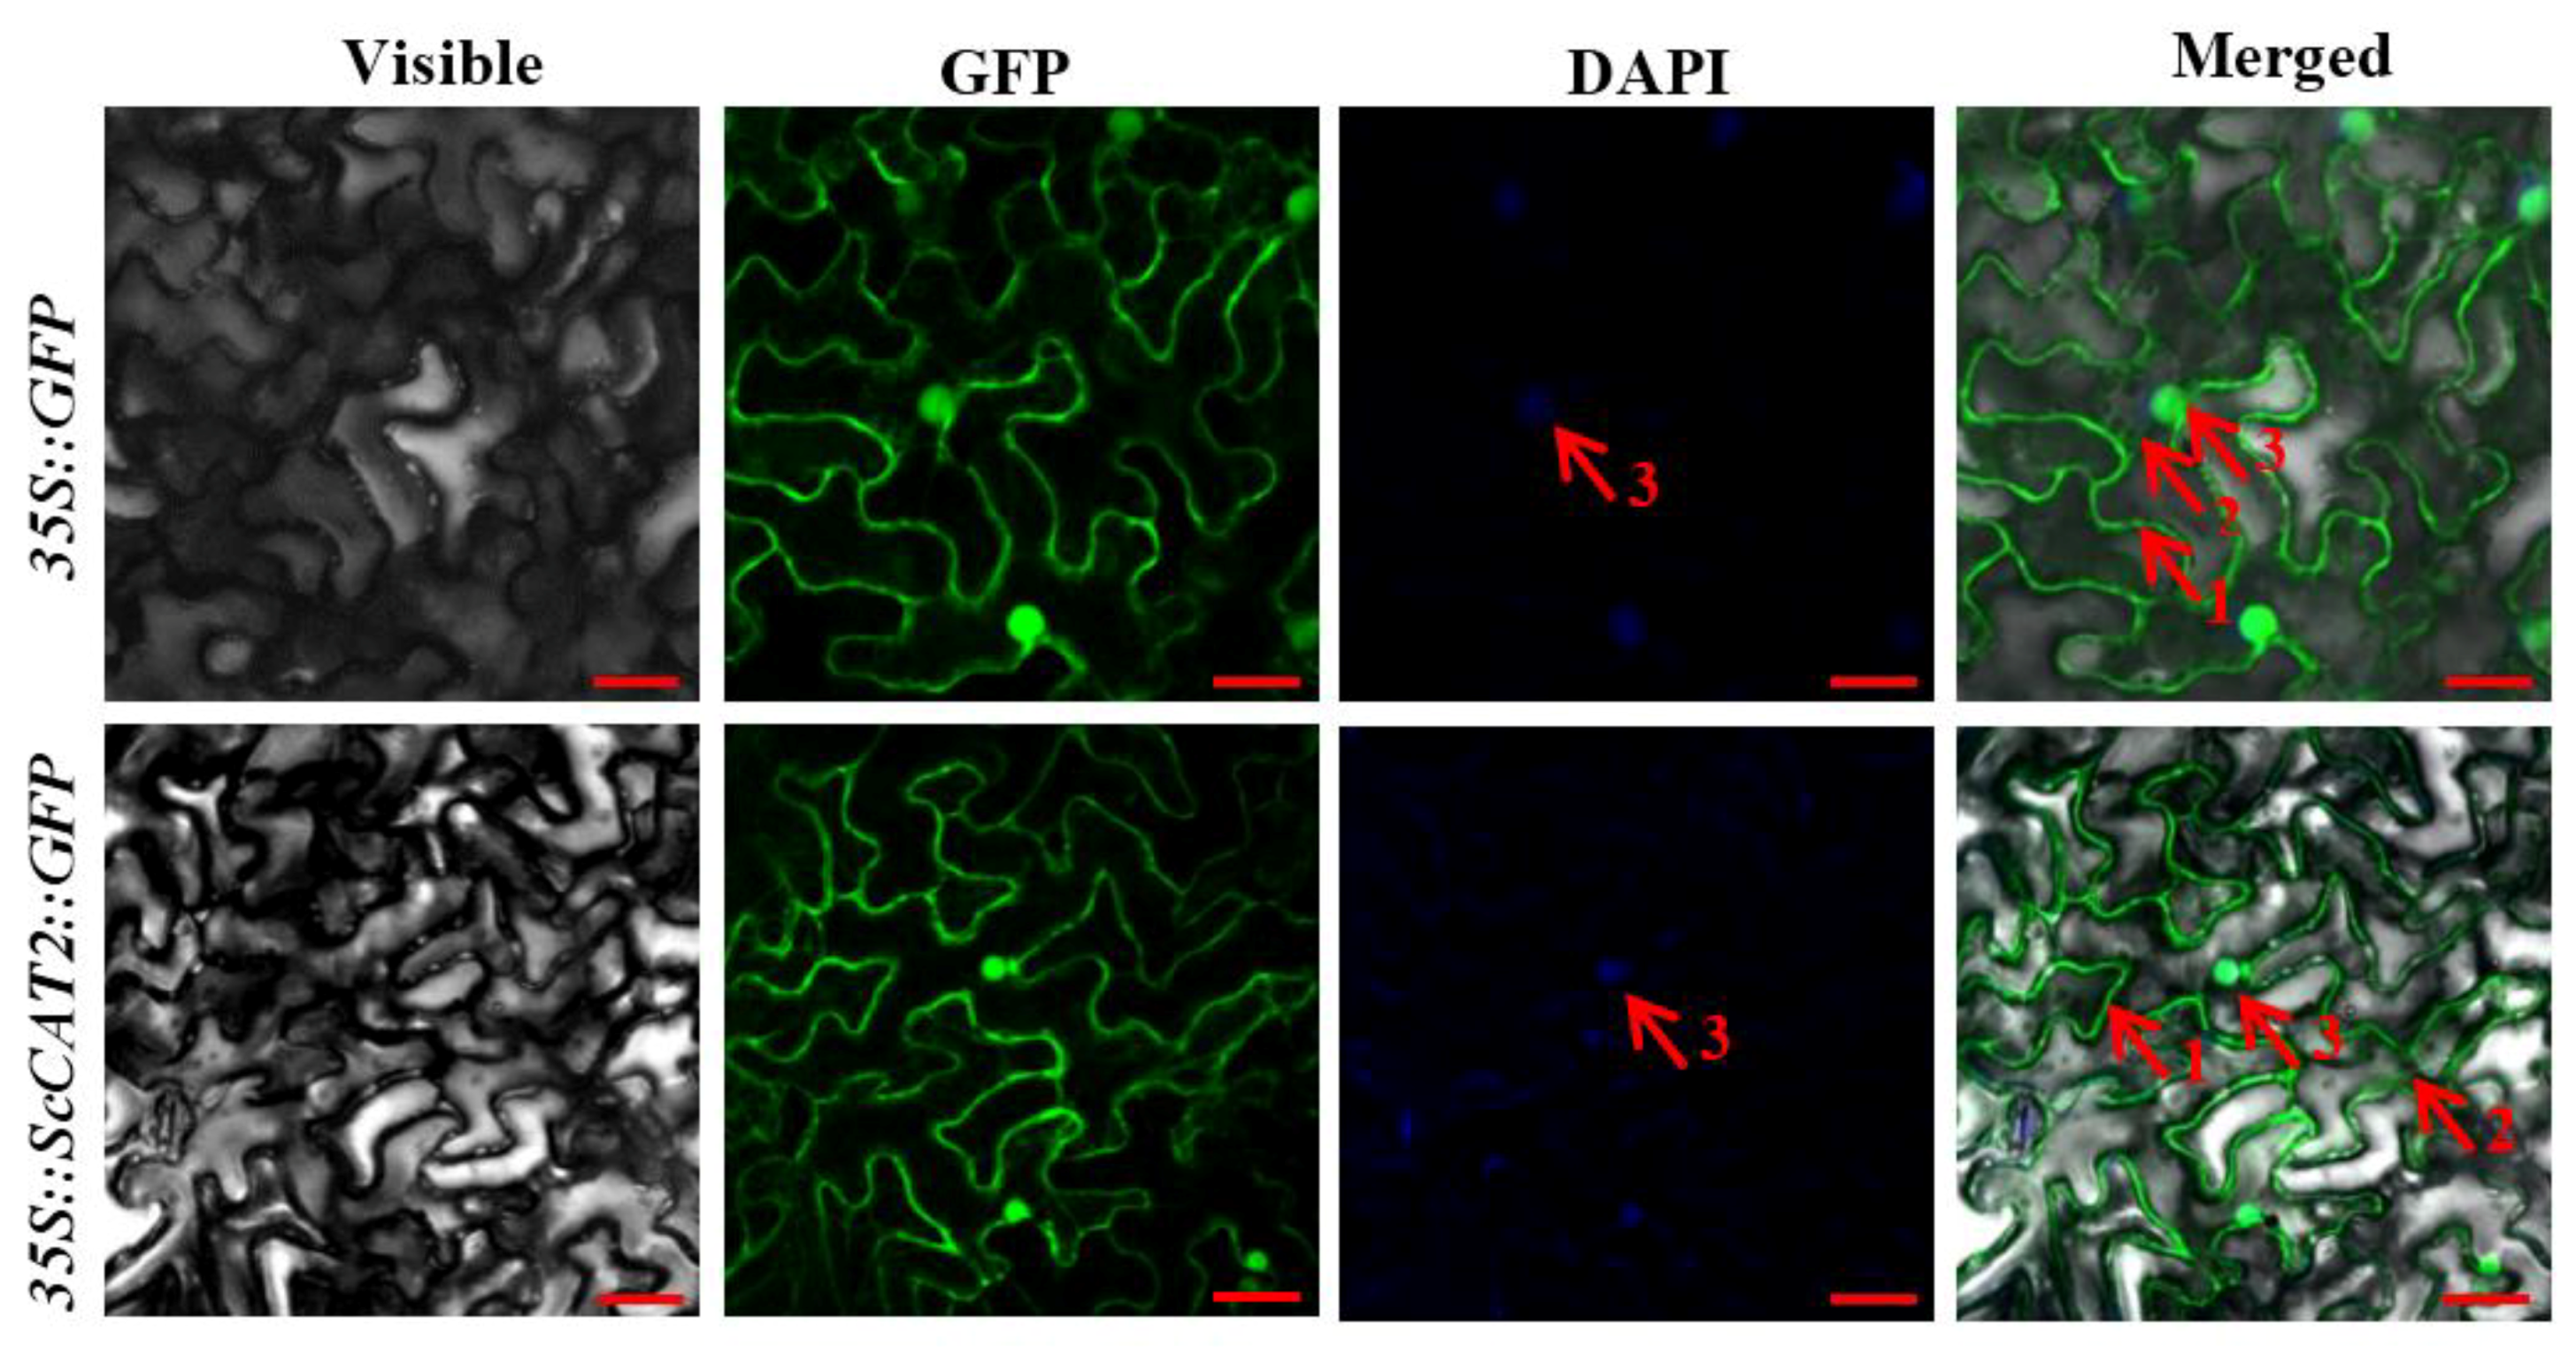
2.2. Subcellular Localization of ScCAT2

ScCAT2 was constructed on a plant expression vector pCAMBIA 2300 between the 35S promoter and green fluorescent protein reporter gene (GFP), and confirmed by enzyme digestion (Figure S1). After agroinfiltration for 2 days, the GFP of the control and the ScCAT2::GFP fusion protein were localized to the cytoplasm, cell membrane, and nucleus (Figure 4). These results are roughly similar to the protein subcellular localization prediction tool (PSORT) prediction that the ScCAT2 protein was situated in the cytoplasm, plasma membrane, and nucleus, with probabilities of 73.9%, 17.4%, and 4.3%, respectively.

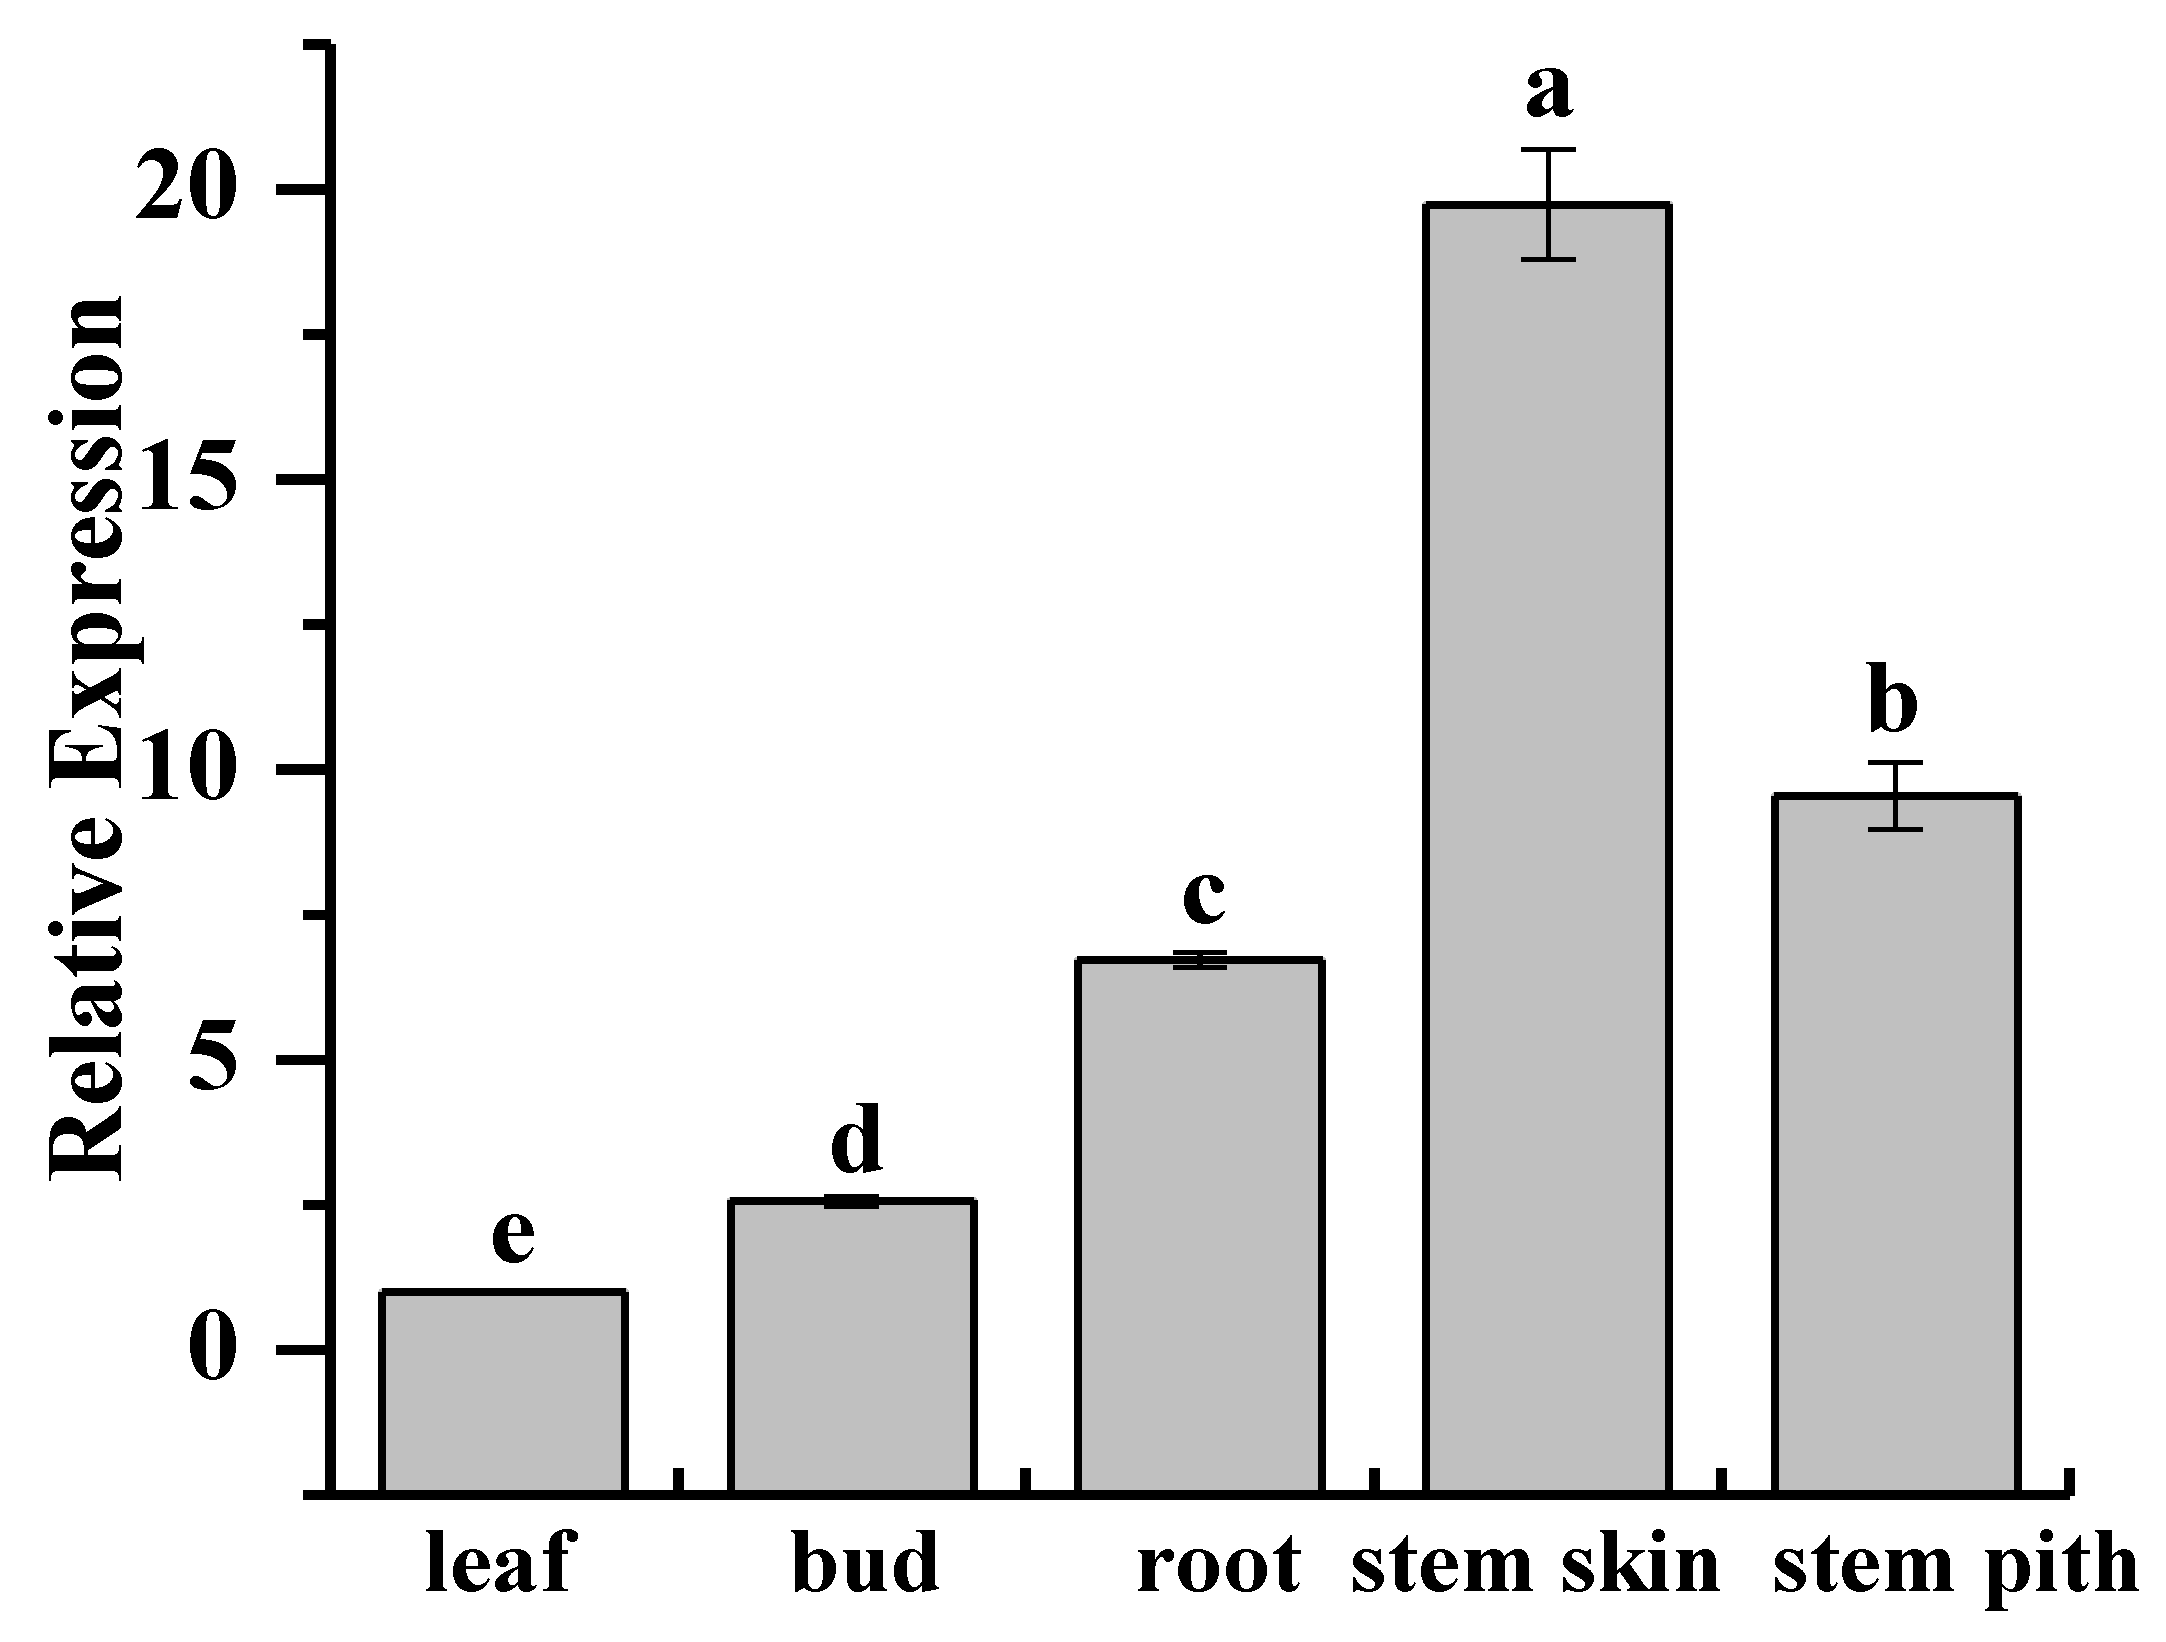
2.3. Tissue-Specific Expression Analysis of ScCAT2

Quantitative real-time polymerase chain reaction (qRT-PCR) analysis showed that ScCAT2 was ubiquitously expressed in the stem skin, stem pith, roots, buds, and leaves of 10-month-old sugarcane genotype Yacheng05-179 tissues at variable levels (Figure 5). The highest relative ScCAT2 expression occurs in the stem skin, which was 19.70-fold higher than that in the leaves.

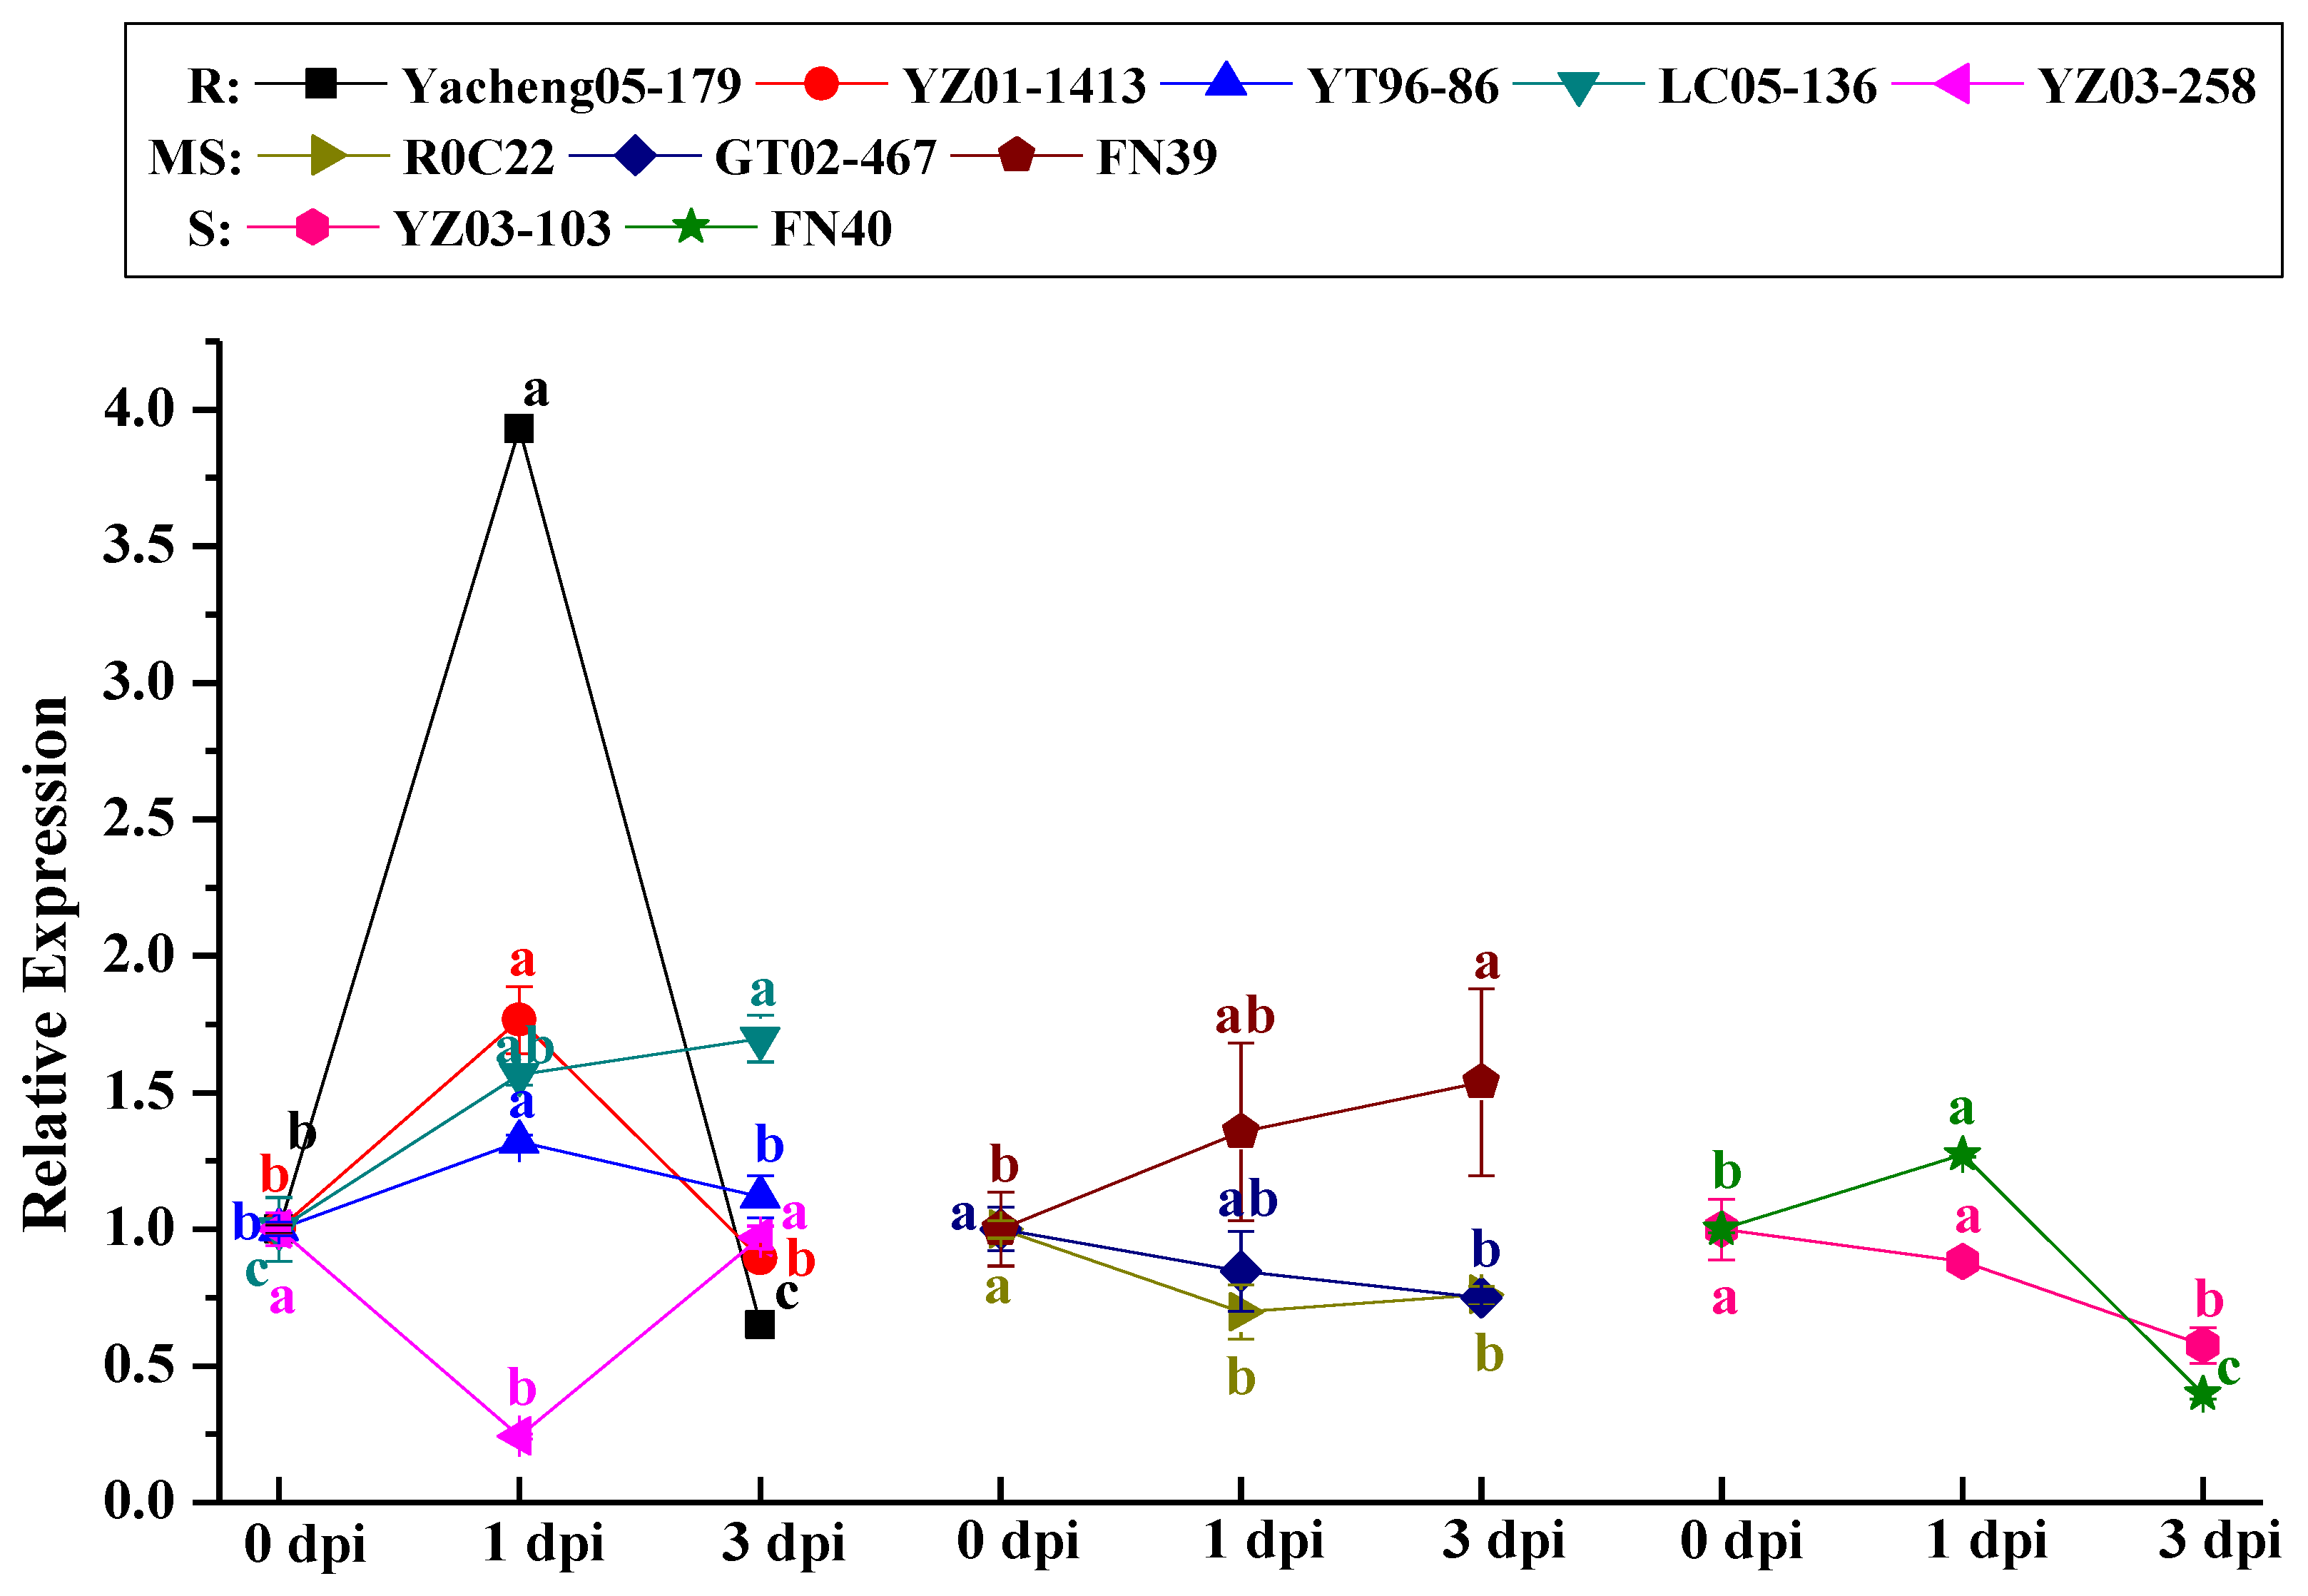
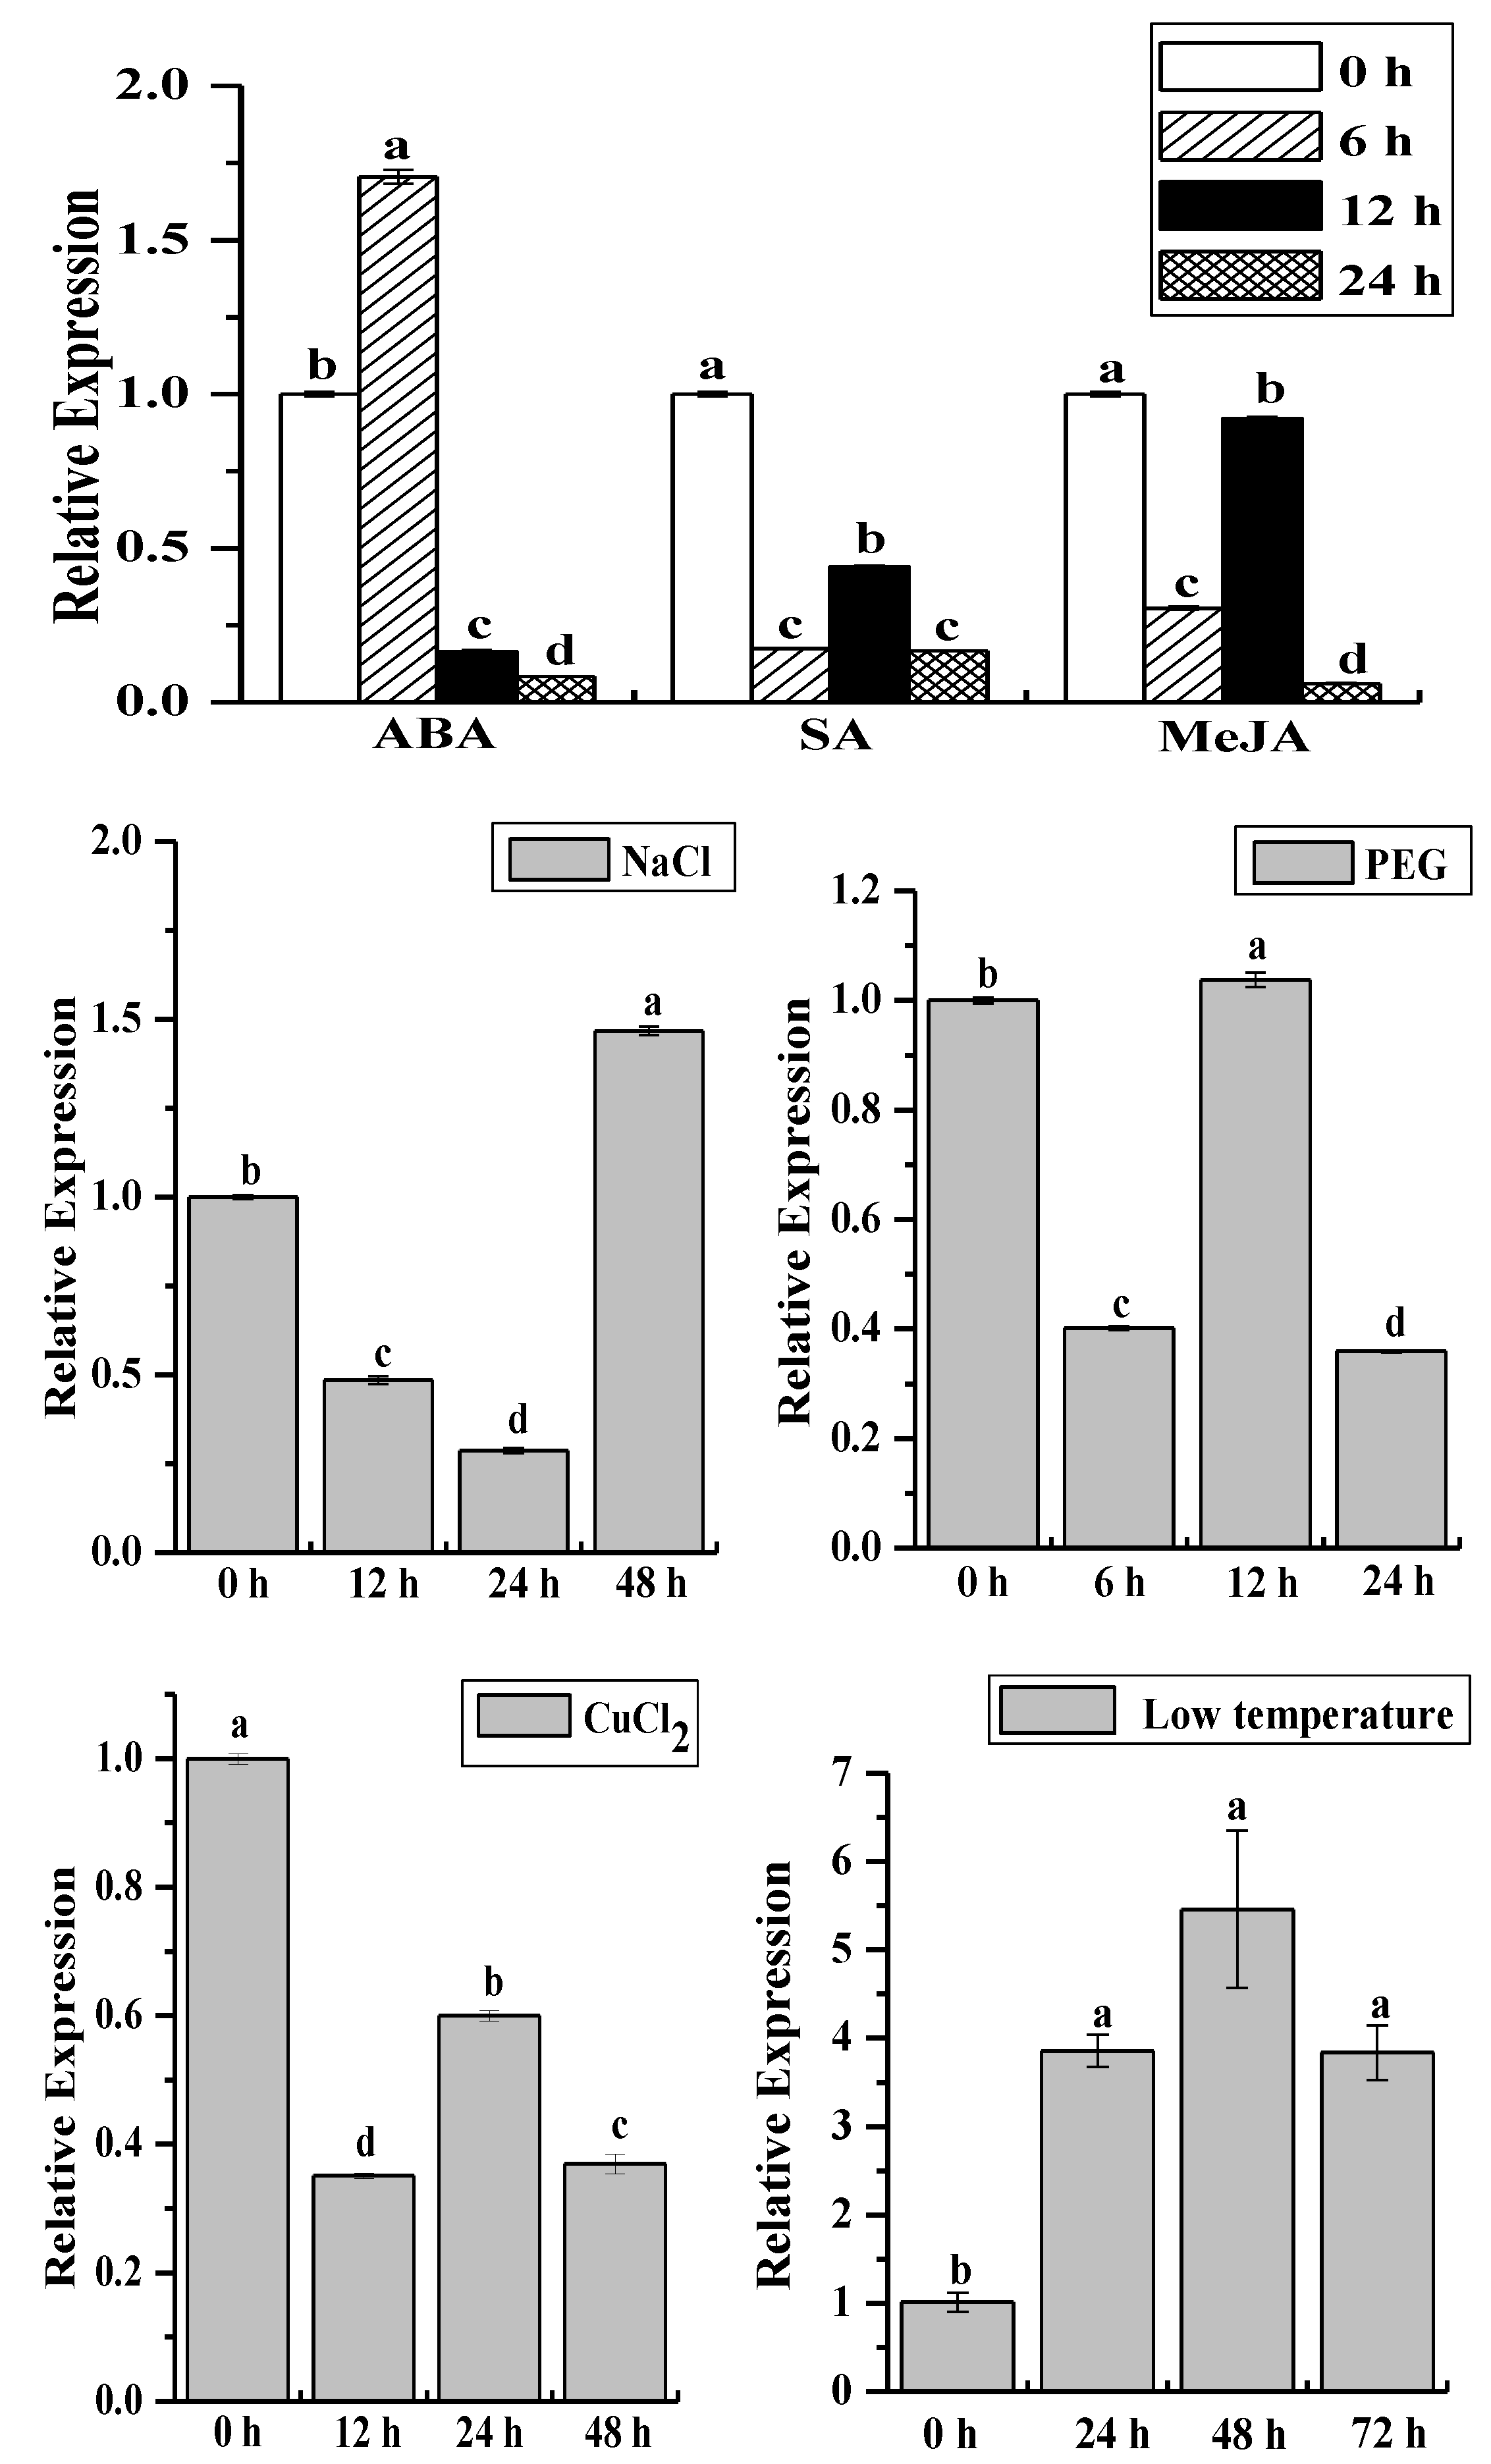
2.4. Analysis of the ScCAT2 Expression Patterns in Different Stress Conditions

Figure 6 showed ScCAT2 transcript abundance in 10 different sugarcane cultivars post-inoculation with S. scitamineum as detected by qRT-PCR. Among the five smut-resistant cultivars, compared to the control, YZ03-258 showed a 0.24-fold decrease in ScCAT2 in expression as early as 1 day post-inoculation (dpi), whereas those of Yacheng05-179, YZ01-1413, YT96-86, and LC05-136 significantly increased by 3.93-, 1.77-, 1.32-, and 1.56-fold. At 3 dpi, the ScCAT2 transcripts remained at a high level (1.68-fold) in LC05-136, and reverted to the control level in YZ01-1413, YT96-86, and YZ03-258, whereas it decreased by 0.65-fold in Yacheng05-179. In three smut-medium-susceptibility cultivars (ROC22, GT02-467, and FN39) and the two smut-susceptible cultivars (YZ03-103 and FN40), except for the upregulation of FN40 at 1 dpi (1.27-fold) and FN39 at 1–3 dpi (1.36-, and 1.54-fold), ScCAT2 was downregulated or remained at the control level.
Under exogenous plant hormone and abiotic stress (Figure 7), ScCAT2 expression was downregulated after treatment with 5 mM SA, 25 μM methyl jasmonate (MeJA), and 100 μM copper chloride (CuCl2). After 100 μM ABA treatment, ScCAT2 transcript abundance significantly increased, as 1.71-fold higher than the control at 6 h, and then underwent a 0.16- and 0.08-fold decrease from 12 h to 24 h. For 250 mM sodium chloride (NaCl) treatment, compared to the control, ScCAT2 expression was decreased by 0.48- and 0.29-fold at 12–24 h, then increased by 1.47-fold at 48 h. The application of 25% polyethylene glycol (PEG) resulted in a downregulation of ScCAT2 at 6 and 24 h, whereas the highest expression was observed at 12 h, which was 1.04-fold higher than the control. After cold (4 °C low temperature) treatment, ScCAT2 transcript abundance significantly increased at 24 h and then kept at a certain level from 24 to 72 h, which was 3.82-, 5.40-, and 3.79-fold higher than the control. Taken together, ScCAT2 expression in sugarcane decreases or does not change with SA, MeJA, and CuCl2 application, but increases with ABA, NaCl, PEG, and cold stimuli.

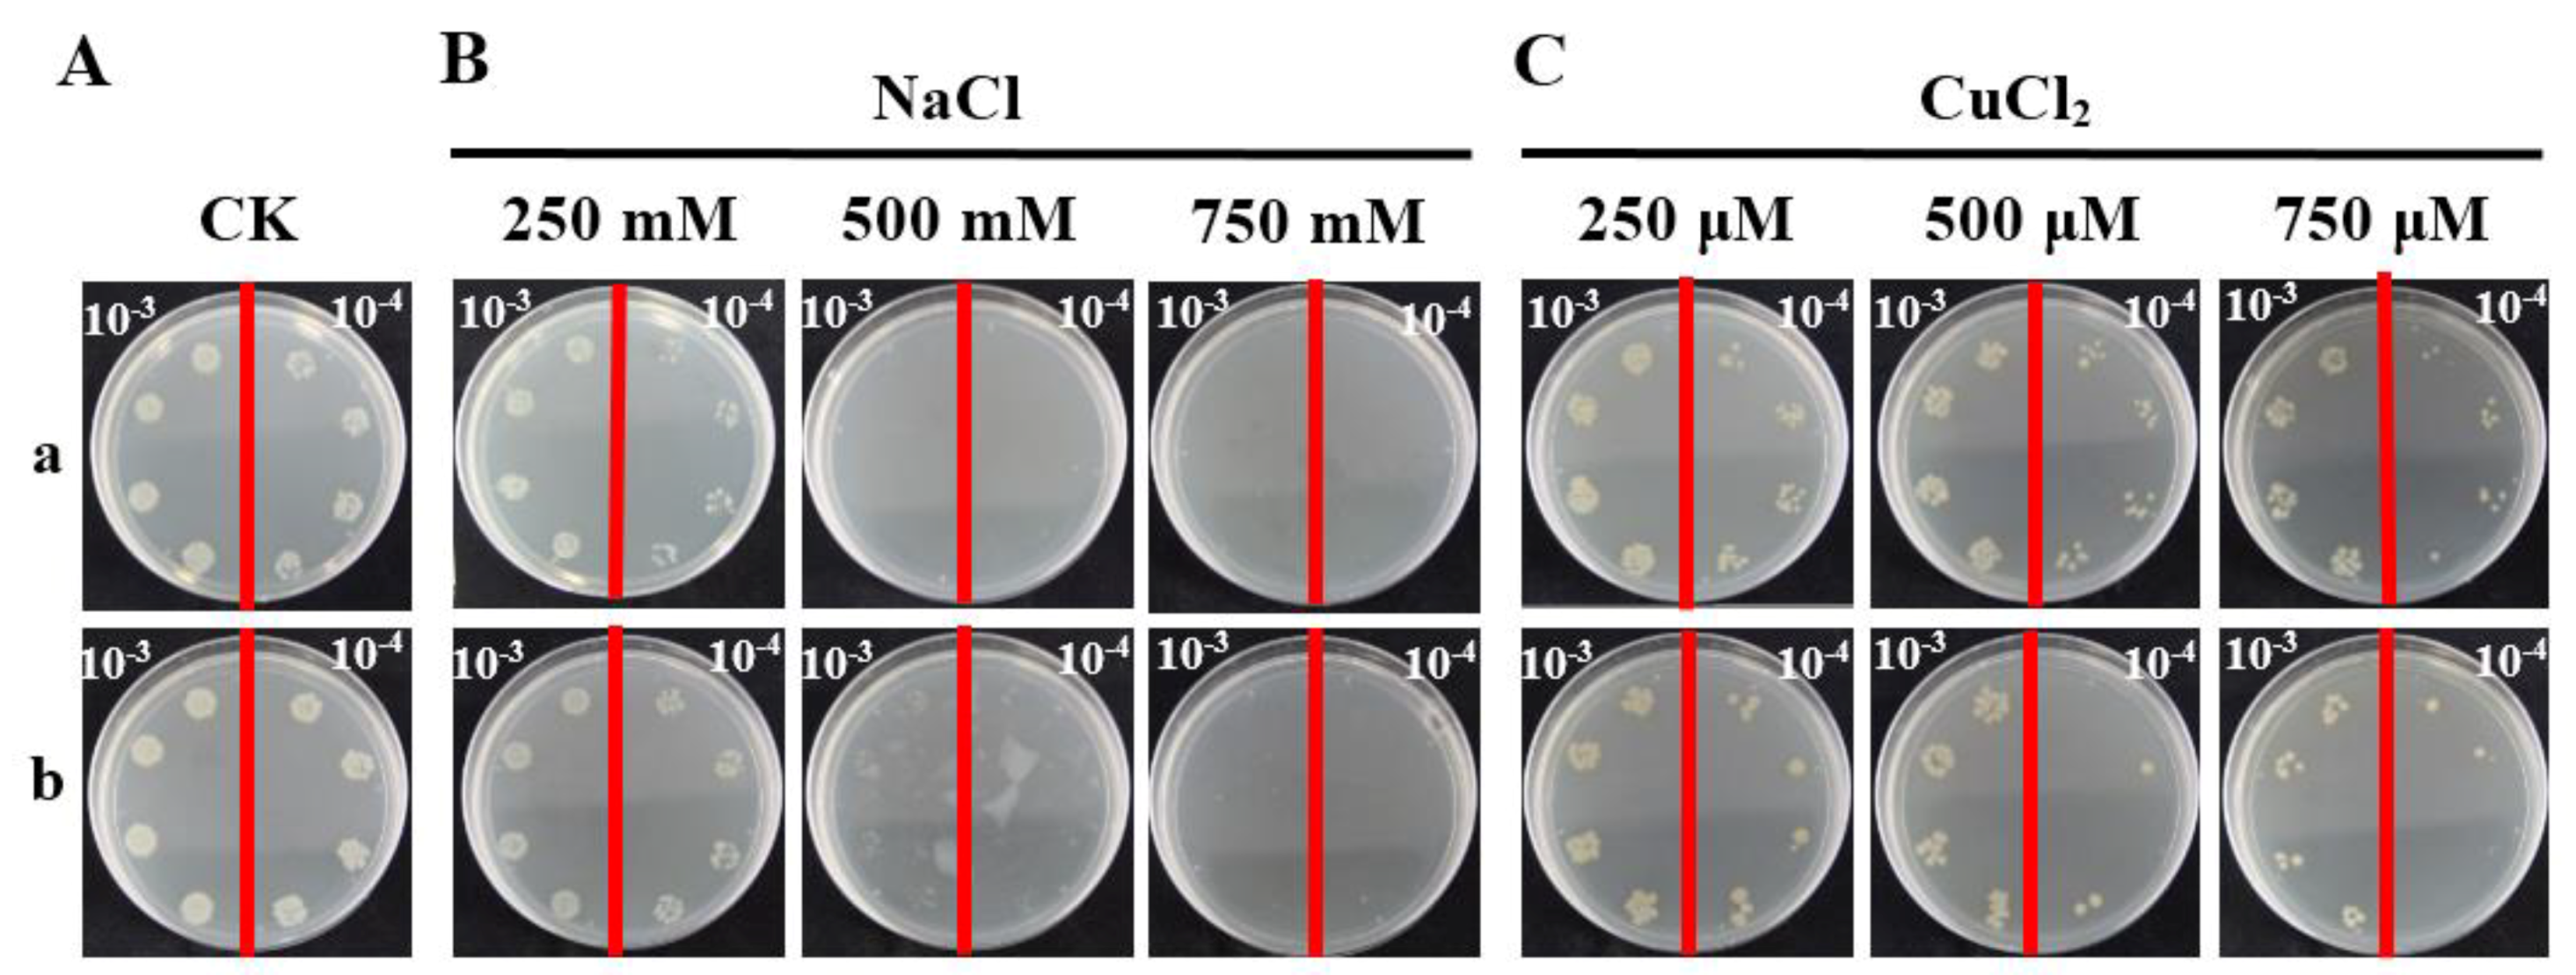
2.5. Prokaryotic Expression Analysis of ScCAT2

To investigate the response of the ScCAT2 gene to adverse environmental factors, pET-32a-ScCAT2 (Figure S2A) was transformed into E. coli Rosetta cells. Sodium dodecyl sulfate polyacrylamide gel electrophoresis (SDS-PAGE) analysis identified a recombinant protein with a molecular mass of >60 kDa after 2 h post-isopropyl β-d-thiogalactoside (IPTG) induction (Figure S2B). After culturing overnight, the colonies of Rosetta + pET-32a-ScCAT2 that were cultured on CuCl2-supplemented LB plates were nearly the same as that of the control. Interestingly, a higher number of Rosetta + pET-32a-ScCAT2 colonies were detected than the control LB plates containing NaCl (Figure 8). This result indicates that the ScCAT2 recombinant protein enhances the growth rate of the prokaryotic E. coli Rosetta strain under NaCl stress, but not under CuCl2 stress.

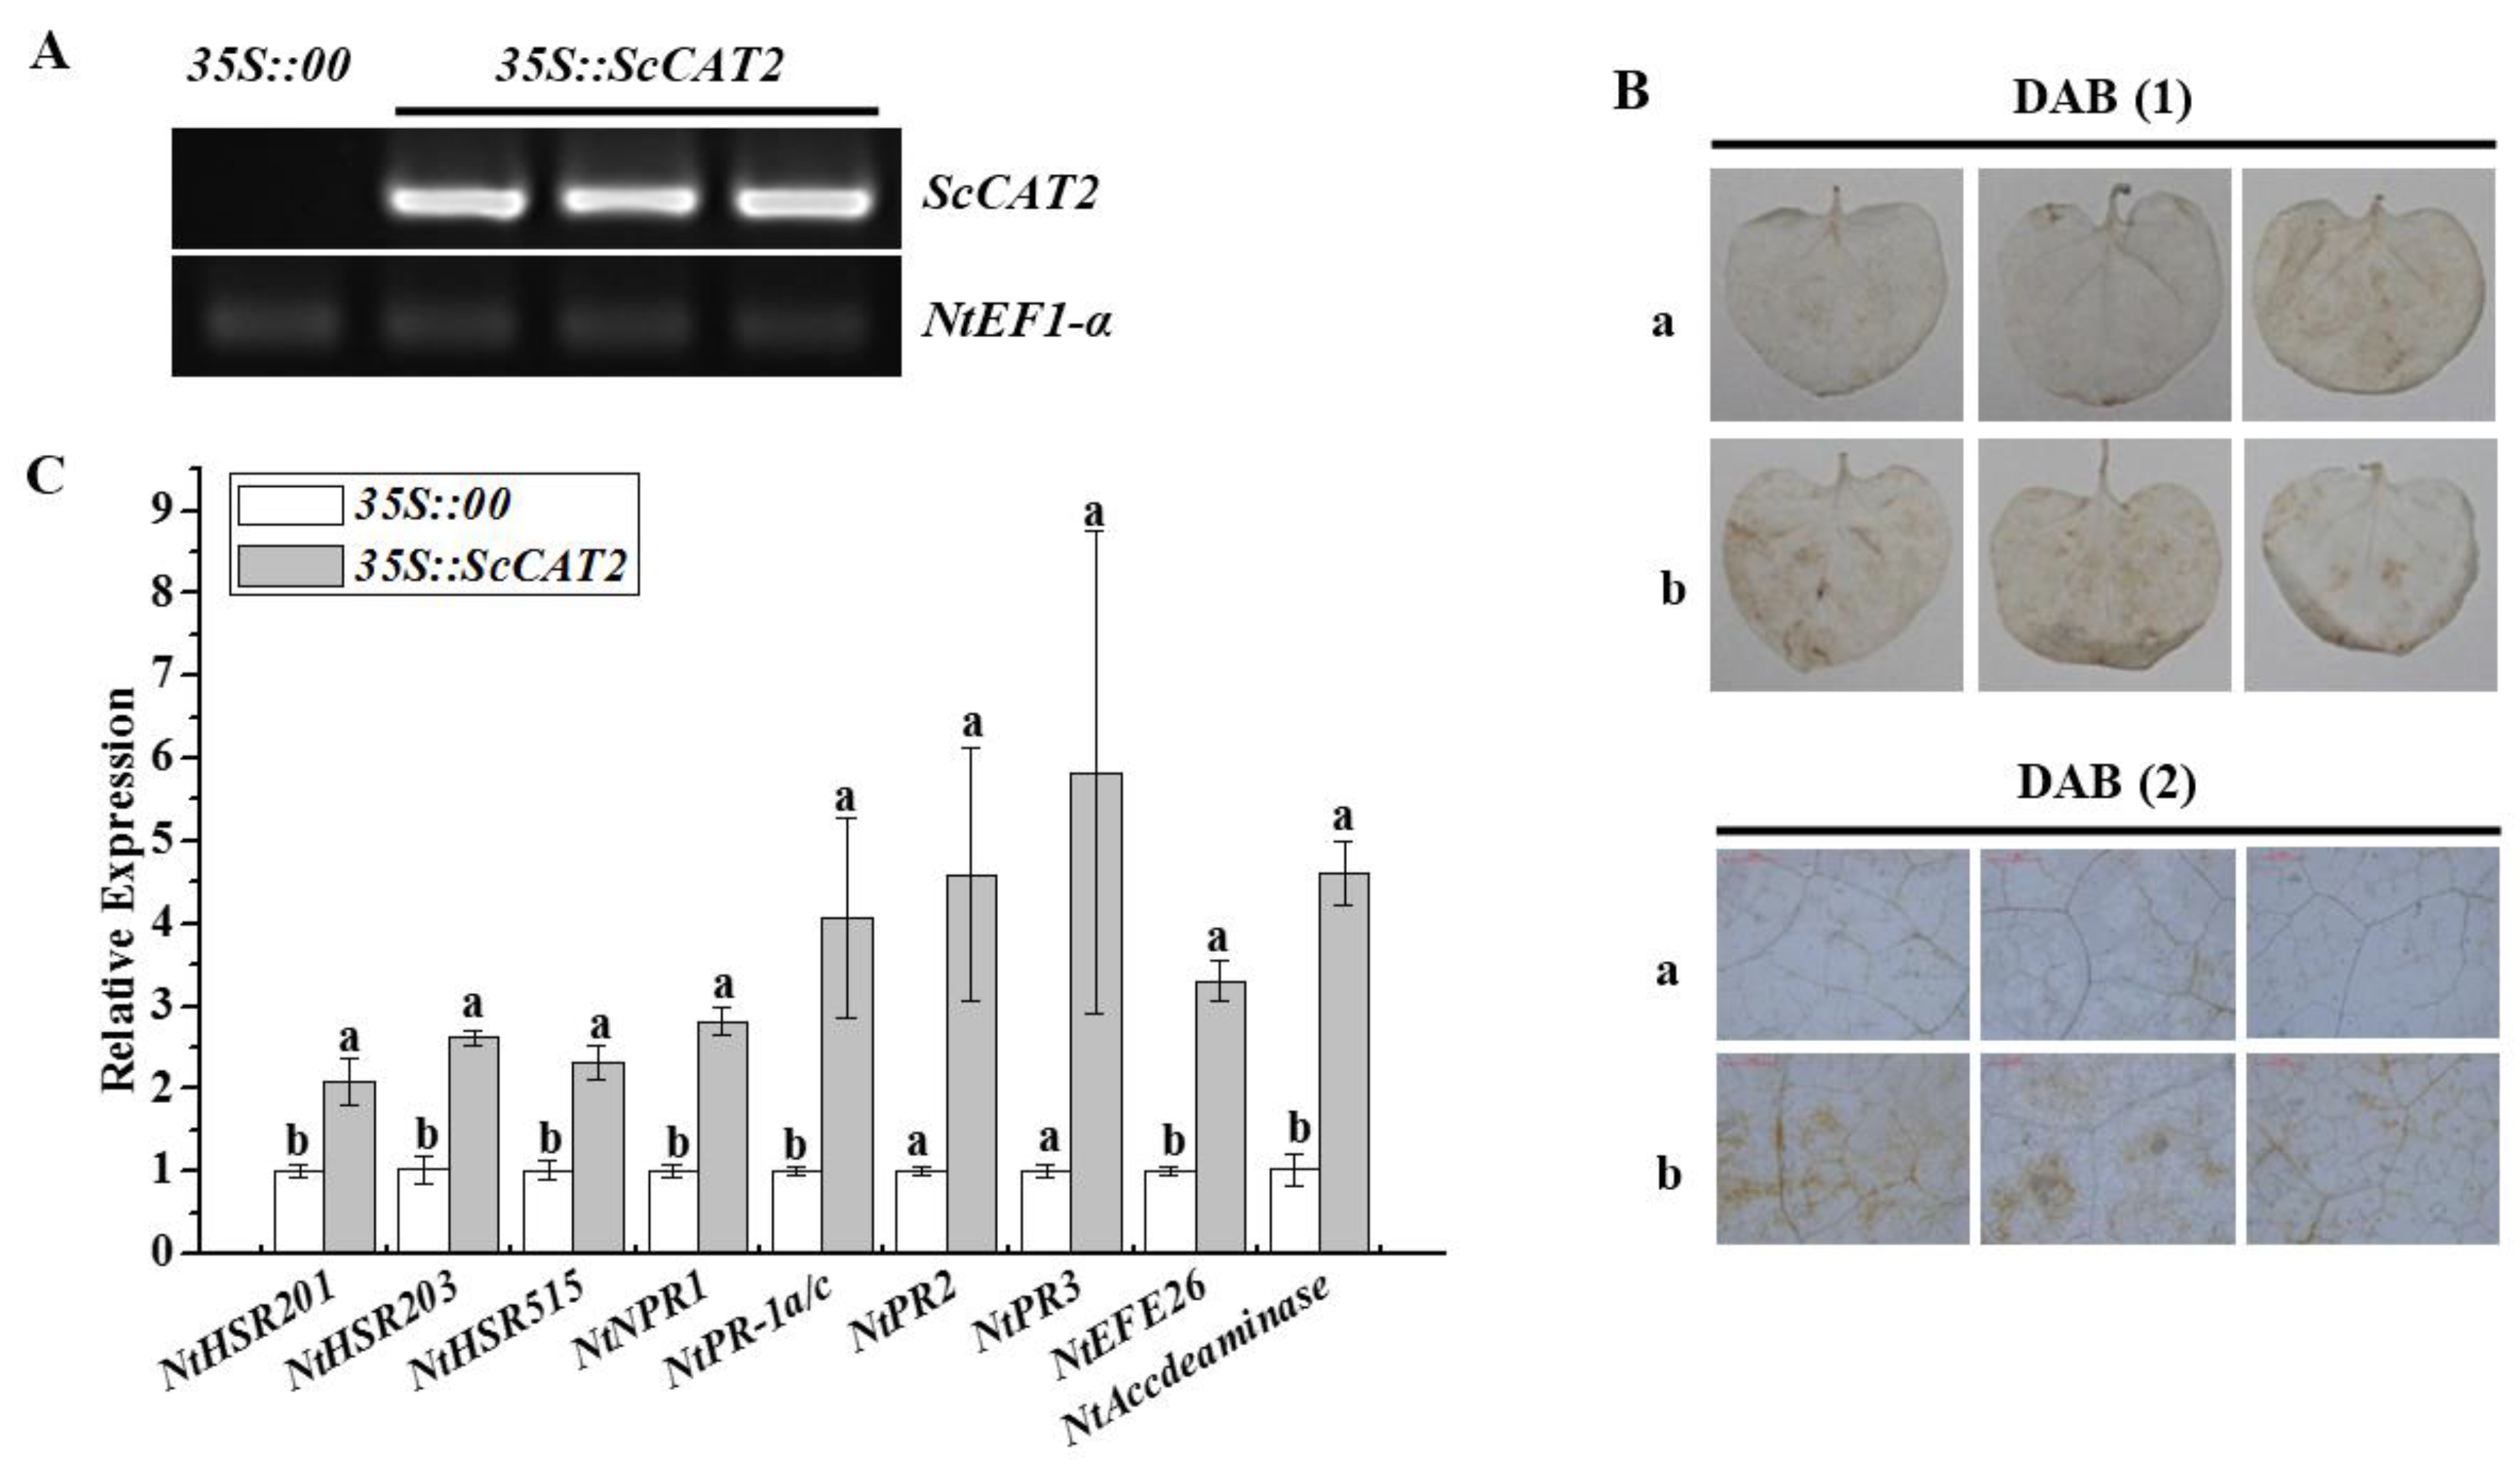
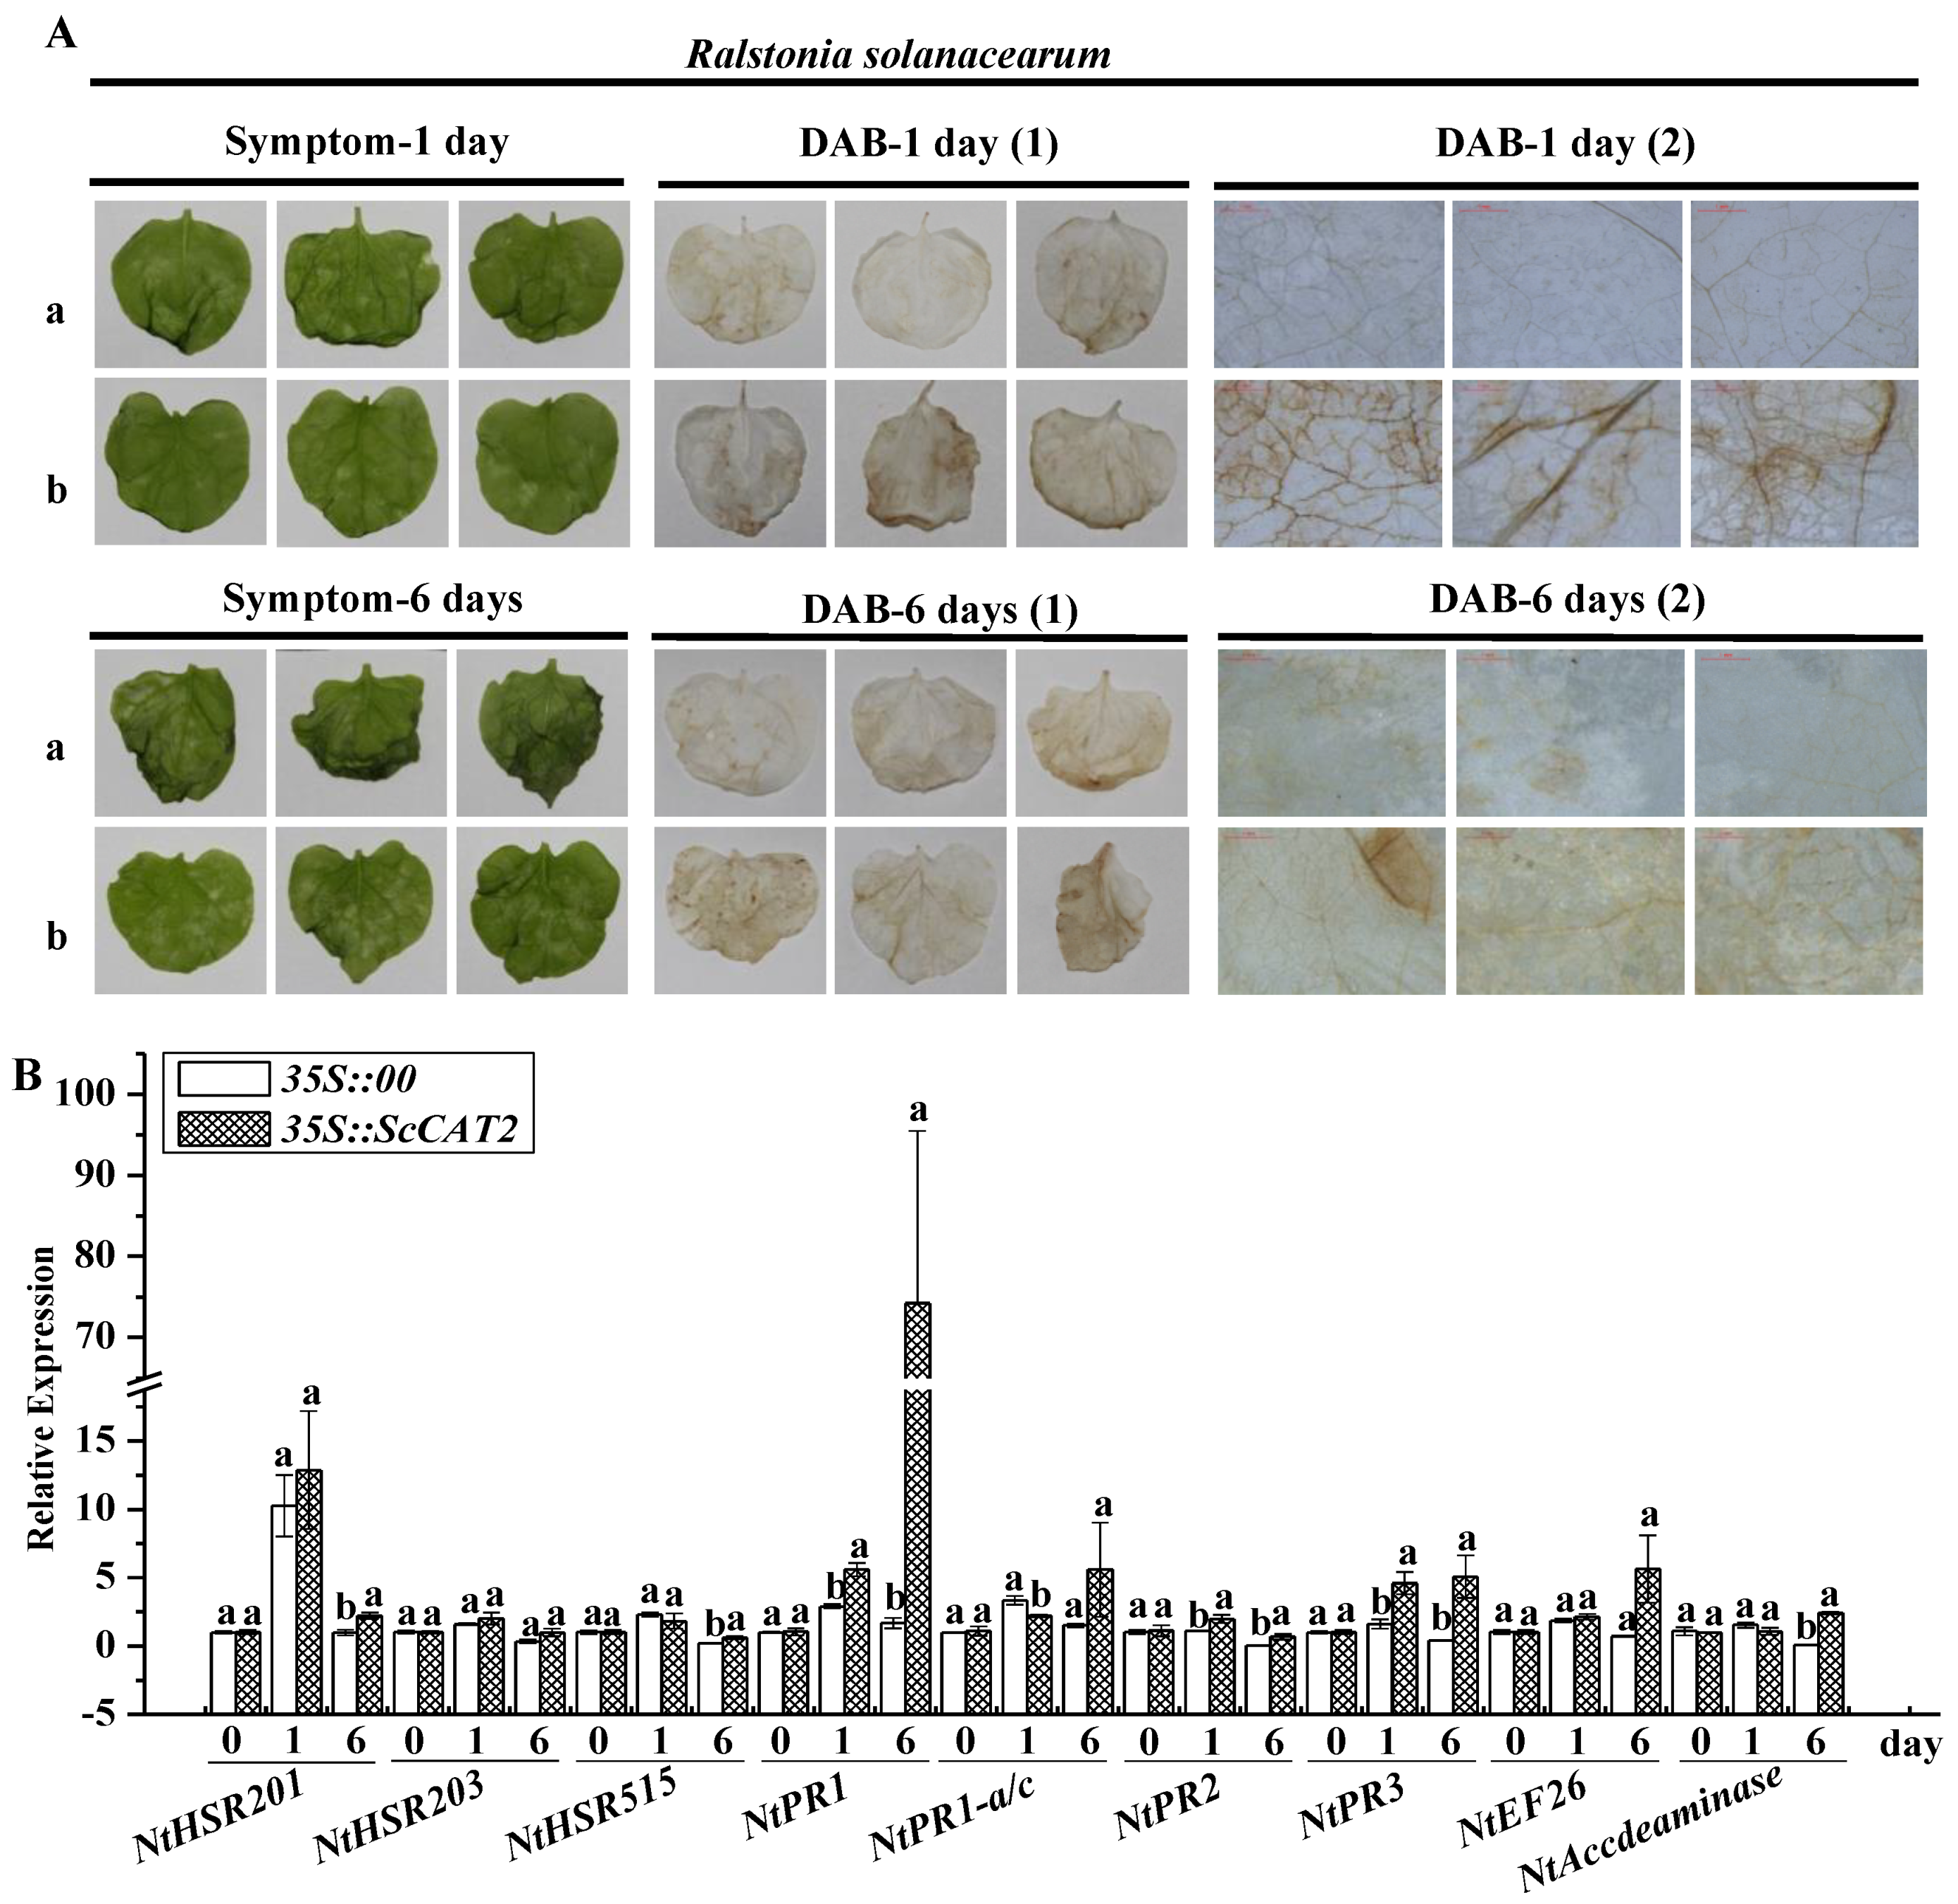
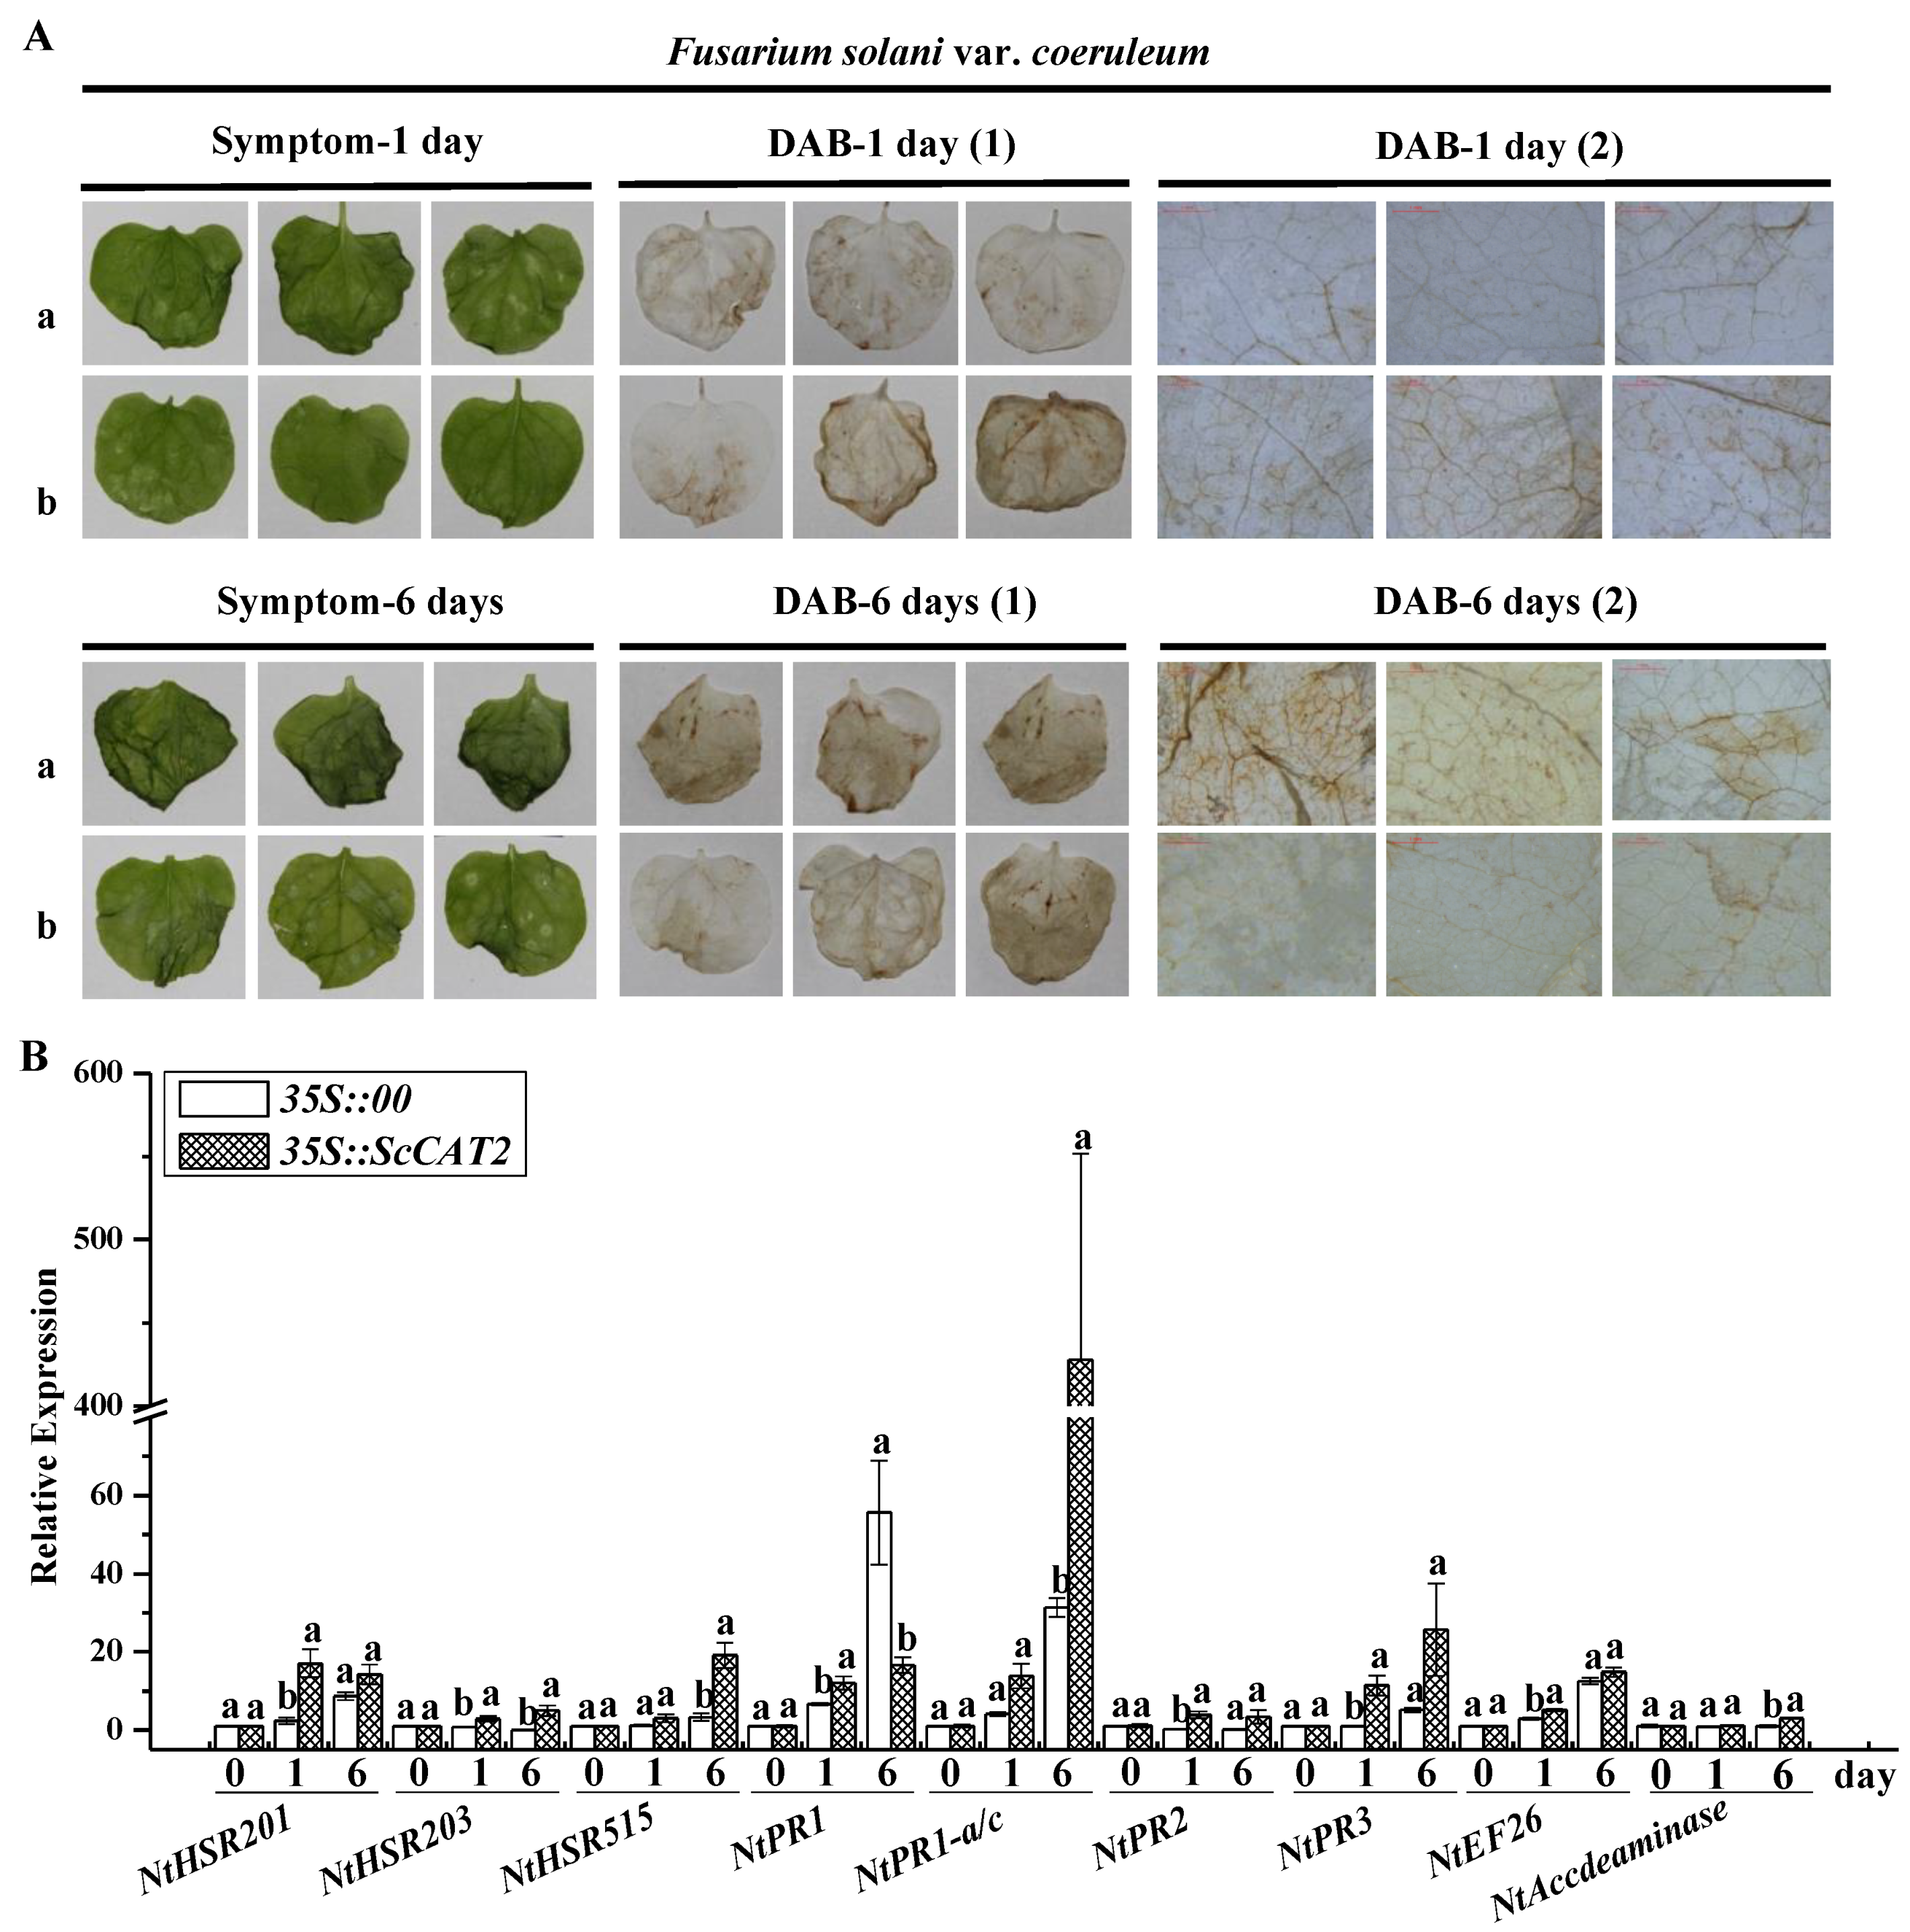
2.6. Transient Expression of ScCAT2 in N. benthamiana-Induced Plant Immune Responses

The empty vector pCAMBIA 1301 and the recombinant vector pCAMBIA 1301-ScCAT2 (Figure S3) were transformed into Agrobacterium Gv3101 and injected into N. benthamiana leaves. Figure 9A showed that at 2 days post-agroinfiltration (dpai), ScCAT2 transcript abundance increased, as indicated by RT-PCR analysis. A typical allergic reaction, as depicted by a darker 3,3′-diaminobenzidine (DAB) staining color, was observed on the leaves, in which ScCAT2 was transiently overexpressed (Figure 9B). In addition, qRT-PCR was used to analyze the expression of nine tobacco immune-related marker genes in N. benthamiana leaves at 2 dpai. The results showed that the HR marker genes NtHSR201, NtHSR203, and NtHSR515; the SA-related genes NtPR1 and NtPR-1a/c; the JA pathway-associated genes NtPR2 and NtPR3; and the ethylene (ET) synthesis-dependent genes NtEFE26 and NtAccdeaminase, were all upregulated, which were 2.07-, 2.56-, 2.28-, 2.81-, 4.07-, 4.58-, 5.80-, 3.30-, and 4.51-fold higher than the control, respectively (Figure 9C). These results indicate that the transient overexpression of ScCAT2 in the N. benthamiana leaves induces plant allergic reactions.
To test the response of the ScCAT2 gene to plant pathogens, two major tobacco pathogens, namely, Ralstonia solanacearum and Fusarium solani var. coeruleum, were separately inoculated into N. benthamiana leaves, which were infiltrated with the Agrobacterium GV3101 strain that carries 35S::00 or 35S::ScCAT2 for 1 day. After challenging with R. solanacearum for 1 day, weak symptoms of disease were observed in the control leaves as indicated by the intensity of DAB staining, whereas in the 35S::ScCAT2 leaves, a higher-intensity of DAB staining, indicative of a more severe level of disease, was observed (Figure 10A). At 6 dpai, the control leaves exhibited more severe necrotic spots, whereas the 35S::ScCAT2 leaves only showed minimal wilting. Additionally, the 35S::ScCAT2 leaves exhibited more intense DAB staining than the control. Moreover, compared to the control, the 35S::ScCAT2 leaves showed upregulated NtPR1, NtPR2, and NtPR3 levels both at 1 and 6 dpai. No changes in NtHSR201, NtHSR515, and NtAccdeaminase transcript abundance were observed at 1 dpai, but these increased at 6 dpai. The expression levels of NtHSR203 and NtEFE26 did not change at 1 and 6 dpai, and NtPR-1a/c was downregulated at 1 dpai (Figure 10B).
Similarly, after injecting with F. solani var. coeruleum and compared to the 35S::ScCAT2 leaves, the control leaves exhibited more severe disease symptom at 1 and 6 dpai. In terms of DAB staining, the 35S::ScCAT2 leaves were deeper brown at 1 dpai, and lighter brown at 6 dpai (Figure 11A). Figure 11B showed that compared to the control, NtHSR201, NtPR2, NtPR3, and NtEFE26 transcript abundance in the 35S::ScCAT2 leaves increased at 1 dpai, and showed the same level as that of the control at 6 dpai. NtHSR515, NtPR-1a/c, and NtAccdeaminase transcript expression in the 35S::ScCAT2 leaves did not change at 1 dpai, but increased at 6 dpai. NtHSR203 in the 35S::ScCAT2 leaves was upregulated at both 1 and 6 dpai. NtPR-1 was upregulated in the 35S::ScCAT2 leaves at 1 dpai and downregulated at 6 dpai.

3. Discussion

As a multigene family, CATs have been extensively studied for their participation in plant defense, growth, and development [9,11,13,15,16,17,23]. In this study, a full-length ScCAT2 gene, which encoded a polypeptide consisting of 493 amino acids, was obtained from sugarcane. At the amino acid level, the homology of ScCAT2 to previously reported sugarcane CATs, such as ScCAT1 (KF664183), SoCAT-1a (KF864224), SoCAT-1b (KF864225), SoCAT-1c (KF864231), SsCAT-1a (KF864226), SsCAT-1b (KF864227), and EaCAT-1b (KF864228), were 71.81%, 71.81%, 71.81%, 71.20%, 71.60%, 71.20%, and 71.60%, respectively. The genetic background of sugarcane is complex, as Saccharum hybrids are highly polyploid and derived from interspecific hybridization between S. officinarum and S. spontaneum, and each gene has 8–10 copies [26]. Furthermore, the catalase family also consists of different members that are homologous in sequence. In this study, amino acid sequence homology between ScCAT2 and the catalase (AGT16310.1) from Saccharum hybrid cultivar R570 (unpublished) was 99.19%, suggesting that these two genes probably represent two variants. Plant CATs in plants are mainly distributed in the cytoplasm, peroxisomes, and glyoxysomes, and trace amounts have been reported in the mitochondria of plant cells [7,8]. A previous study localized the sugarcane ScCAT1 protein to the plasma membrane and cytoplasm [23]. Iwamoto and Higo [27] predicted that the sense and antisense large CatB transcripts in rice might be distributed in the nucleus. In this study, using Agrobacterium-mediated transformation, ScCAT2::GFP was localized to the cytoplasm, plasma membrane, and nucleus (Figure 4). Phylogenetic reconstruction indicated that the ScCAT2 protein belonged to group II, and was highly homologous to OsCATA, HvCAT2, AlCAT, SiCAT, ZmCAT3, SbCAT, and SoCAT (Figure 3). The AlCAT gene in group II has been reported to play a positive role in salinity responses under NaCl treatment [28]. Normal ZmCAT3 transcript levels were observed in both pigment-deficient mutants and the wild-type, whereas the highest expression levels were observed in the leaves, suggesting that ZmCAT3 is involved in non-photosynthetic reactions [11,29]. Furthermore, Guan and Scandalios [30] reported that ZmCAT3 is downregulated in leaves after the application of ABA and osmotic stress.
Previous studies have shown that catalases exhibit tissue-specific differential expression in plants [31,32,33]. Higher NnCAT expression levels have been reported in young leaves of Nelumbo nucifera compared to other tissues, such as the roots, terminal buds, and leafstalks [31]. In A. thaliana, the expression pattern of CAT1, CAT2, and CAT3 was tissue-specific and age-dependent, unlike CAT2 and CAT3, and CAT1 was also expressed in older leaves, flowers, and seeds [33]. HuCAT3 was constitutively expressed in the mature stems, cotyledons, flowers, caulicles, roots, and fruits of Hylocereus undatus [32]. Similarly, in our study, ScCAT2 was ubiquitously expressed and showed the highest expression level in the stem skin (Figure 5), which differs from ScCAT1 as it has the highest expression level in the buds [23].
ScCAT1 positively responds to exogenous stimuli, including plant hormones stresses, such as SA, MeJA, and ABA and H2O2 oxidative stress, PEG and NaCl hyperosmotic stress, and CuCl2 abiotic elicitor or metal stress [23]. The recombinant protein expressed by ScCAT1 in E. coli Rosetta cells enhanced the tolerance of host cells to NaCl, CuCl2, and CdCl2 stresses [23]. ScCAT2 expression was downregulated under SA, MeJA, and CuCl2 stresses, but upregulated under ABA, NaCl, PEG and cold stimuli (Figure 7). Moreover, the Rosetta cells that expressed the ScCAT2 recombinant protein showed a higher growth rate under NaCl stress than that of the control, but not under CuCl2 treatment (Figure 8). ABA is a stress signal that regulates various stress-responsive genes during osmotic imbalance [34]. This finding illustrates that ScCAT2 may be involved in the response mechanism of salt and drought resistance in sugarcane, which depends on the ABA signal pathway. Similarly, CsCAT3 in Cucumis sativus was induced by different kinds of stresses, such as heat, cold, NaCl, PEG, H2O2, and ABA treatments, and its overexpression in E. coli could increase the tolerance to heat, cold, NaCl, and sorbitol conditions [35]. MaCat2, a catalase gene from banana (Musa acuminate) fruit, was upregulated by low temperature and physical damage [36]. Nie et al. [32] found that HuCAT3 was upregulated 7 days after application of drought stress, approximately eight-fold higher than that of the control, and reached a peak value after 6 h exposure to NaCl stress. ABA and osmotic stress increased ZmCAT1 expression in embryos and leaves [30]. Du et al. [9] reported that three CATs gene in A. thaliana have different functions under drought, cold, and oxidative stresses, as well as with ABA and SA treatments. AtCAT1 played an important role in all stresses, AtCAT2 was upregulated by drought and cold, and AtCAT3 was mainly upregulated by oxidative and ABA treatments. Three cDNA sequences of the CAT genes of O. sativa, OsCatA, OsCatB, and OsCatC, were cloned and exhibited variable activity in the presence of different salt stresses (i.e., NaCl, potassium chloride, lithium chloride, and magnesium chloride) at different concentrations (0–1000 mM), with OsCatC showing higher tolerance than OsCatA and OsCatB (<60 mM), whereas the opposite effects were observed when salt concentrations were >125 mM [37]. The differential expression of ScCAT2 and ScCAT1 in response to various stresses suggests that ScCAT2 and ScCAT1 may coordinately regulate plant development.
CAT genes can be regulated by abiotic stress. Ma et al. [38] found that the LsCat1 gene in Lilium sargentiae Wilson was induced after infection with Fusarium oxysporum. The expression level of CAT1 in Nicotiana tabacum L. was enhanced by TMV infection [39]. During sugarcane–S. scitamineum interaction, ScCAT1 transcript abundance in the incompatible interaction (Yacheng05-179-S. scitamineum interaction) was higher and expressed earlier than the compatible one (Liucheng03-182-S. scitamineum interaction) [23]. Here, we examined ScCAT2 expression in 10 different sugarcane genotypes post-smut pathogen inoculation (Figure 6) and found that, except for YZ03-258, ScCAT2 transcript abundance in the other four smut-resistant cultivars significantly increased compared to the control, and peaked as early as 1 dpi. However, in the three smut-medium-susceptibility cultivars and two smut-susceptible cultivars, except for the upregulation in FN40 at 1 dpi as well as in FN39 at 1–3 dpi, ScCAT2 transcript abundance significantly decreased or did not change. Taken together, the results of this study indicate that ScCAT2 is a positive responsive component of smut resistance in sugarcane, and that ScCAT2 and ScCAT1 may act synergistically against S. scitamineum.
Increased resistance to Peronospora parasitica and Erysiphe polygoni has been reported in transgenic canola (Brassica napus L.), which overexpressed bacterial catalase [40]. Yu et al. [41] indicated that overexpression of the tobacco Cat2 gene in Solanum tuberosum increases its tolerance to Phytophthora infestans. Transgenic tobacco overexpressing the maize Cat2 gene showed higher catalase activity, which was relative to plant–pathogen interactions [42]. Previous studies have demonstrated that cell death is a resistance mechanism of plants against infections, and involves a series of cellular and molecular processes, including induction of HR gene expression, increase in reactive oxygen species (ROS) production, accumulation of defense-related hormones, and increase in ion fluxes [43,44,45]. The accumulation of H2O2 has, thus, been used as indicator for local allergic reactions in plant disease [46]. DAB can react with peroxide to produce a bronze precipitate, and the intensity of staining in the leaves reflects the degree of H2O2 accumulation [43]. The gradation of DAB staining has also been employed as an index for cell death during hypersensitivity responses [43]. Agrobacterium-mediated stable transformation, including gene overexpression and RNAi, is a common method to study the functions of target genes. However, the transformation efficiency and regeneration efficiency are too low and time-consuming to characterize multiple genes. In recent years, the techniques of gene silencing and transient expression based on agroinfiltration have become important methods for gene function research, because of their short time consumption and high throughput [47,48,49]. In previous study, ScCAT1 has been shown to play a positive role in HR and immune responses by transient overexpression in N. benthamiana leaves [23]. Similarly, in our study, the control leaves post-inoculated with R. solanacearum or F. solani var. coeruleum exhibited more severe disease symptoms than the leaves that overexpressed ScCAT2 (Figure 10 and Figure 11). Furthermore, these showed more intense DAB staining, and transcript abundance of most of the tested tobacco immune-related marker genes was higher in the 35S::ScCAT2 leaves than the control (Figure 9, Figure 10 and Figure 11). These results reveal that the ScCAT2 gene plays a positive role in plant defense responses, and the overexpression of ScCAT2 in N. benthamiana leaves enhances resistance to R. solanacearum and F. solani var. coeruleum infections.
As is known, Saccharum spp., are members of a complex genus characterized by high polyploidy, frequent aneuploidy and heterozygosity, large genomes, low fertility rates, and long growth periods [26,50,51]. These factors make it a prime candidate for improvement through genetic engineering instead of traditional breeding, but at the same time, may impact the expression and heredity stabilization of target genes in transgenic sugarcane, and result in sugarcane transgenic technology with low transformation efficiency and long experimental periods [52,53,54]. Thus, whether ScCAT2 gene plays a direct causal role in defense against pathogen and/or salt, drought, and cold stimuli needs further transgenic sugarcane investigation, which can be referred to in the methods of Shen et al. [55] and Kumar et al. [56].

4. Materials and Methods

4.1. Plant Materials and Treatment Conditions

In the sugarcane–S. scitamineum biosystem, 10 sugarcane varieties, including five smut-resistant (Yacheng05-179, YZ01-1413, YT96-86, LC05-136, and YZ03-258), three smut-medium-susceptibility (ROC22, GT02-467, and FN39), and two smut-susceptible (YZ03-103 and FN40) varieties, were collected from the Key Laboratory of Sugarcane Biology and Genetic Breeding, Ministry of Agriculture (Fuzhou, China) [57]. Smut whips were harvested in the most popular cultivar ROC22 in our laboratory, and stored at 4 °C. Physically similar sugarcane stems from the 10 sugarcane varieties were collected and cut into two-bud setts. After immersing in flowing water for 1 day, the sugarcane segments were cultivated in an incubator under a light–dark regime (16 h of light and 8 h of darkness) at 32 °C. When the germinating seedlings developed buds with a height of about 2 cm, these were inoculated by acupuncture with a suspension of 5 × 10⁶ spores/mL containing 0.01% (v/v) Tween-20, whereas controls were mock-inoculated with sterile distilled water containing 0.01% (v/v) Tween-20 [58,59]. All inoculated materials were grown at 28 °C with a photoperiod of 16 h light and 8 h darkness. Five buds at time points of 0, 1, 3, and 7 dpi were harvested and immediately frozen in liquid nitrogen, and stored at −80 °C until use.
Six consistent 10-month-old sugarcane Yacheng05-179 plants showing similar growth rates were randomly selected from the fields and used in tissue-specific expression analysis. The youngest fully expanded leaf (+1 leaf) with a visible dewlap (the collar between the leaf blade and sheath), buds, white roots, stem skin, and stem pith from the sugarcane seventh or eighth nodes were collected [60]. All samples were frozen in liquid nitrogen, and then stored in a −80 °C refrigerator until RNA extraction.
Four-month-old Yacheng05-179 tissue-cultured plantlets were transferred to water for one week. The six following chemical stimuli were applied and kept at 28 °C with a photoperiod of 16 h light and 8 h darkness. The leaves of three groups of Yacheng05-179 plantlets were sprayed with 100 μM ABA, 5 mM SA (containing 0.01% Tween-20, v/v), and 25 μM MeJA (containing 0.1% ethanol and 0.05% Tween-20, v/v) [23]. The other three groups were grown hydroponically in a solution containing 250 mM NaCl, 25% PEG 8000, and 100 μM CuCl2 [23]. Whole plantlets were harvested at 0, 6, 12, and 24 h after treatment with ABA, SA, MeJA, and PEG. The other plantlets treated with NaCl or CuCl2 were collected at 0, 12, 24, and 48 h. For cold stress, the whole Yacheng05-179 plantlets were kept at a low temperature of 4 °C, with a photoperiod of 16 h light and 8 h darkness for 0, 24, 48, and 72 h. The samples were immediately frozen in liquid nitrogen and then stored at −80 °C until RNA extraction. All treatments were conducted using three biological replicates.

4.2. Total RNA Extraction and Synthesis of the First-Strand cDNA

Total RNA was extracted from the collected tissues using TRIzol™ (Invitrogen, Carlsbad, CA, USA). DNA contamination was removed using DNase I (Promega, Beijing, China). The Prime-Script™ RT Reagent Kit (TaKaRa, Dalian, China) was used to reverse transcribe RNA (1.0 μg) into first-strand cDNA.

4.3. Cloning of ScCAT2 Gene

A putative cDNA sequence of the ScCAT2 gene was assembled, in silico, using a probe sequence of the sugarcane CAT gene expressed sequence tag (GenBank Accession No. CF573140.1) in NCBI [23]. The ScCAT2 gene was amplified using the primer pair ScCAT2-cDNAF/ScCAT2-cDNAR (Table S1), based on the bud cDNA template of Yacheng05-179 in a Mastercycler (Eppendorf, Hamburg, Germany). The RT-PCR temperature conditions were 94 °C for 5 min, followed by 35 cycles of 94 °C for 30 s, 55 °C for 45 s, and 72 °C for 2 min, and an elongation step at 72 °C for 10 min. The PCR products were gel-purified, cloned into pMD18-T vector (TaKaRa, Dalian, China) and sequenced (Shenggong, Shanghai, China).

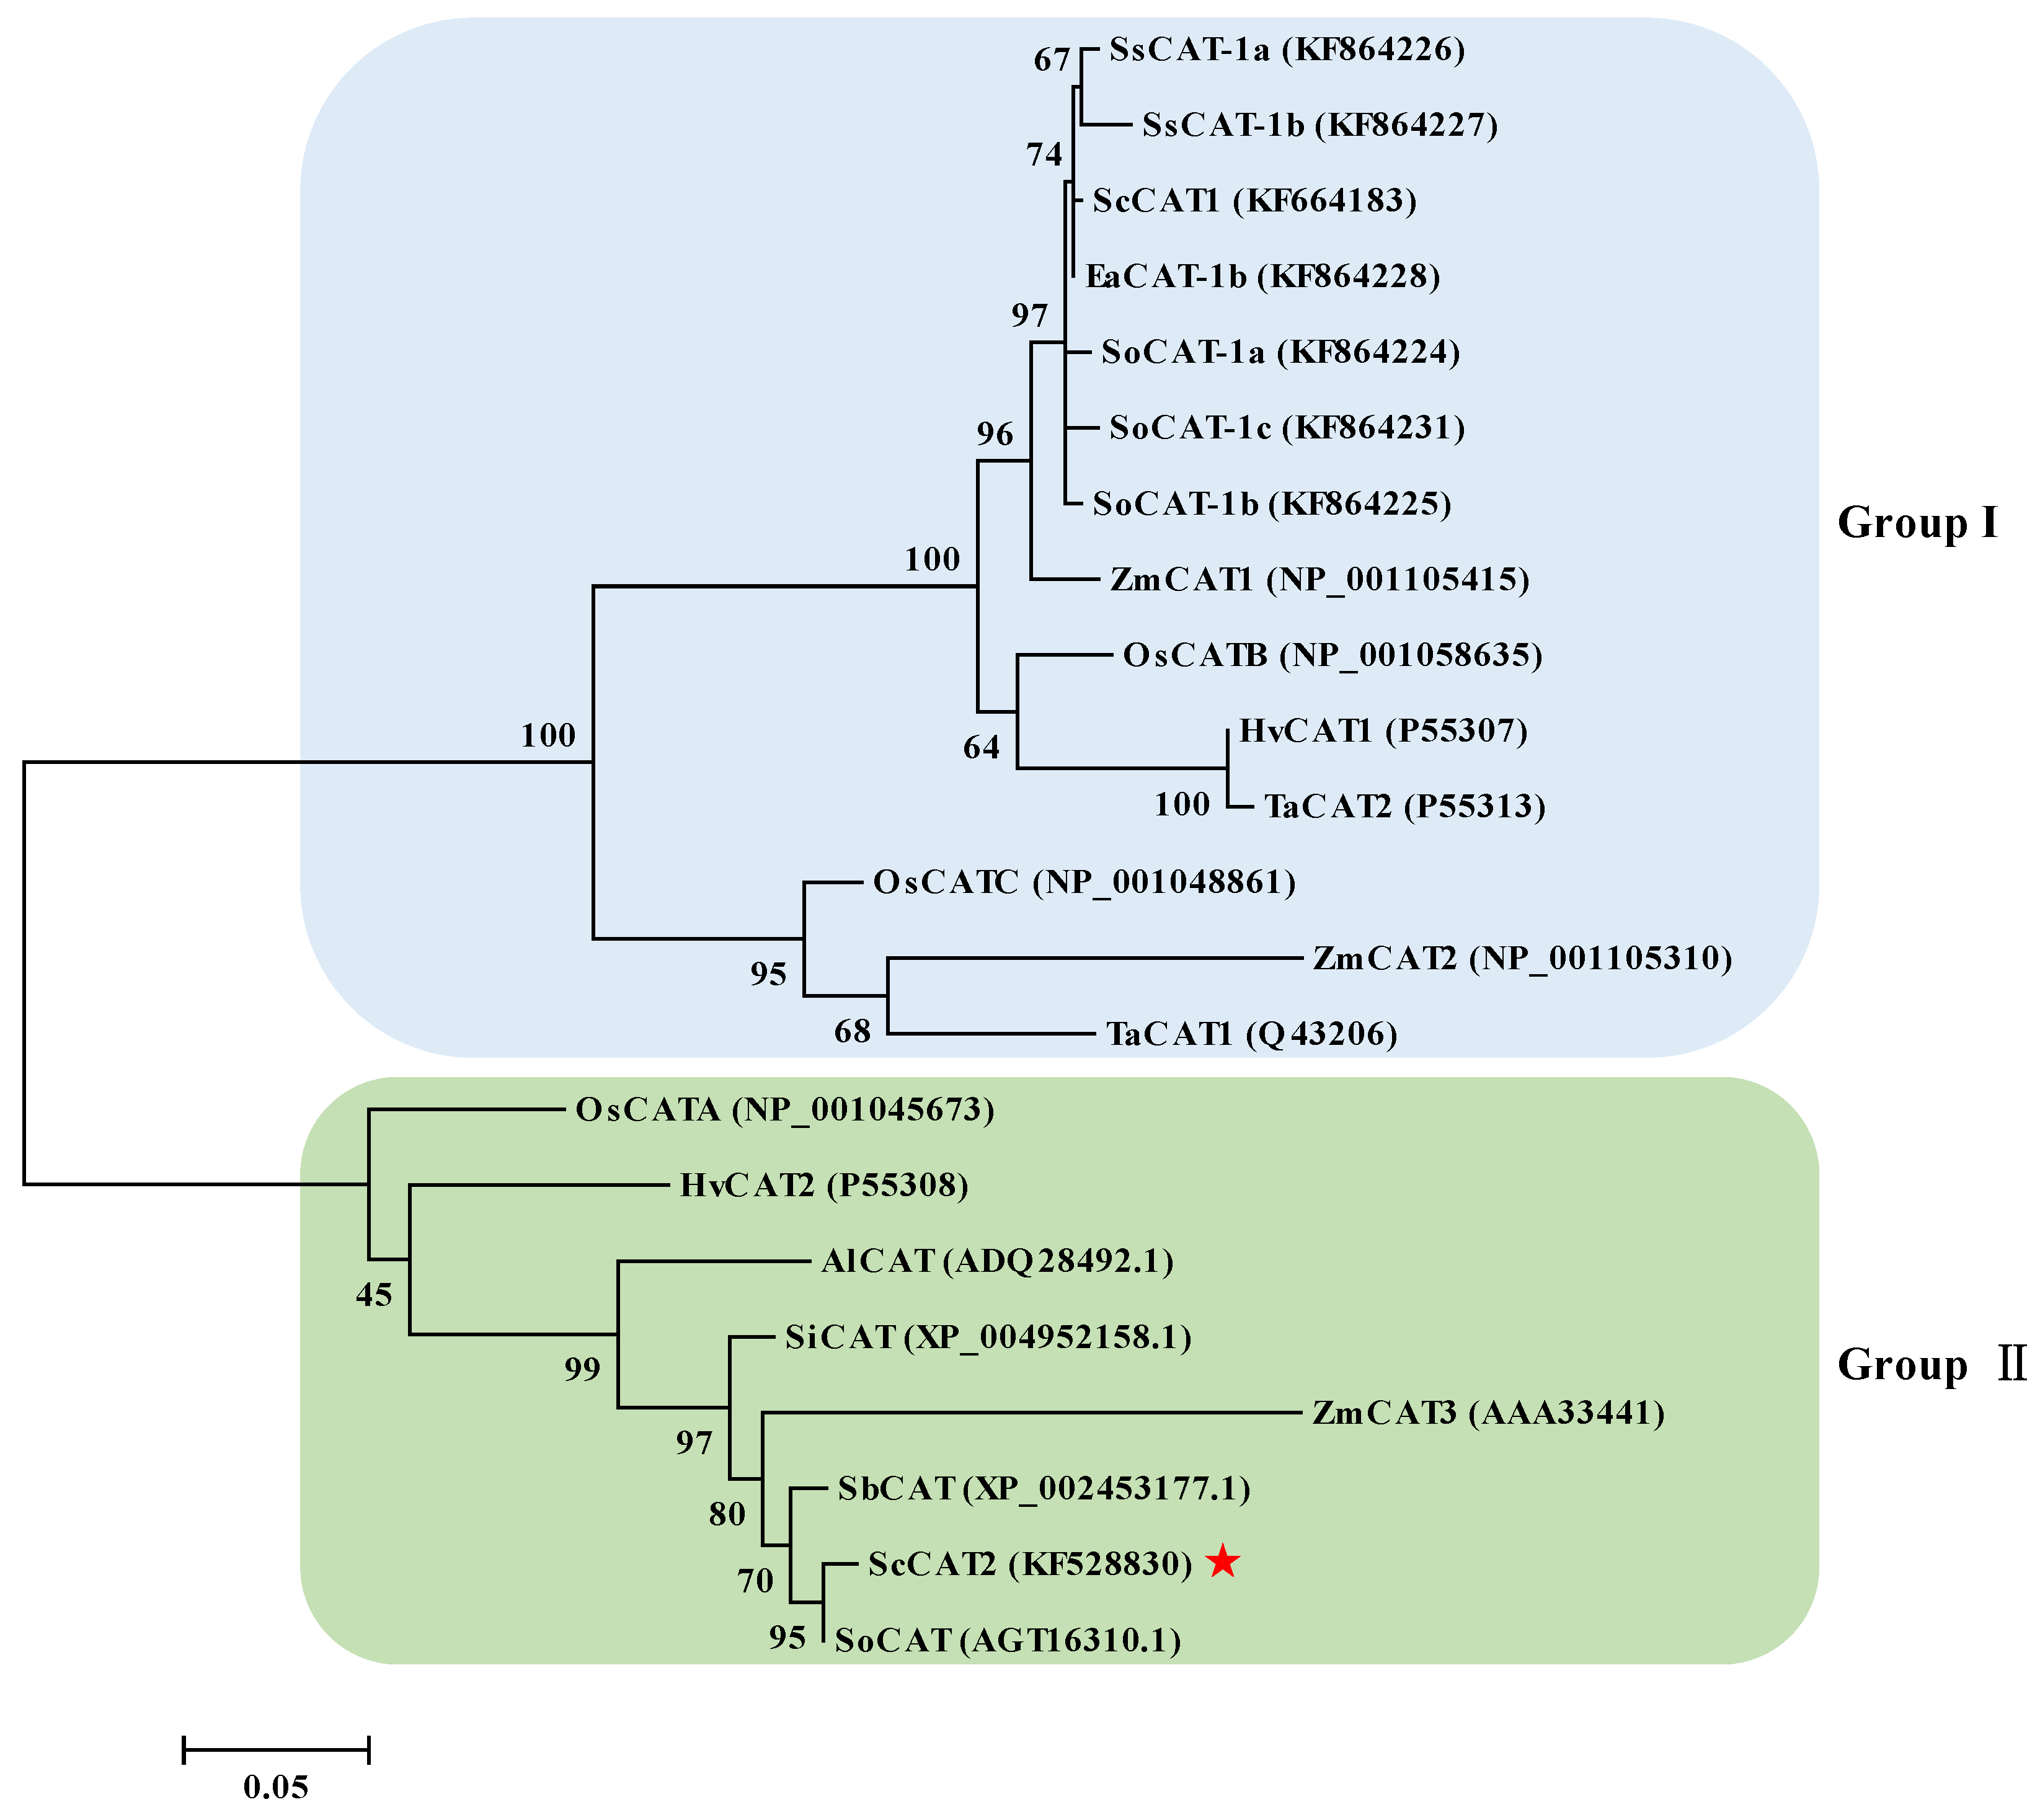
4.4. Protein Structural Analysis and Phylogenetic Reconstruction

The ORF of the ScCAT2 gene was analyzed using ORF Finder (available online: https://www.ncbi.nlm.nih.gov/orffinder/). ProtParam (available online: http://web.expasy.org/protparam), GOR IV (available online: https://npsa-prabi.ibcp.fr/cgi-bin/npsa_automat.pl?page=/NPSA/npsa_hnn.html), SignalP 4.0 Server (available online: http://www.cbs.dtu.dk/services/SignalP), ProtFun (available online: http://www.cbs.dtu.dk/services/ProtFun/), TMHMM Server v. 2.0 (available online: http://www.cbs.dtu.dk/services/TMHMM/), PSORT (available online: http://www.genscript.com/psort.html), ProtScale (available online: http://web.expasy.org/protscale/), and MOTIF Search (available online: http://www.genome.jp/tools/motif/) programs were used to predict the physical and chemical parameters, protein secondary structure, the signal peptide sequences and the precise location of the cleavage sites, the cellular role and enzyme class and Gene Ontology category, the transmembrane helices, protein subcellular localization, and the motifs in the amino acid sequences of ScCAT2. After BLAST analysis, the DNAMAN and NTI software were used to conduct multiple alignment of the deduced amino acid sequence of the ScCAT2 gene with the other catalases, including ScCAT1 (KF664183) from Saccharum hybrid cultivar Yacheng05-179, catalase (AGT16310.1) from Saccharum hybrid cultivar R570, S. bicolor catalase (XP_002453177.1), S. italic catalase (XP_004952158.1), Aeluropus litoralis catalase (ADQ28492.1), O. sativa catalase (ABN71233.2), H. vulgare catalase (BAJ92414.1), and T. aestivum catalase (ADY02963.1). The MEGA 6 software was used to construct a phylogenetic tree using the neighbor-joining (NJ) method (1000 bootstrap replicates) [61].

4.5. Subcellular Localization Assay

The plasmid PMD18-T-ScCAT2 was used as template to amplify the ORF fragment of ScCAT2 without a stop codon, using primers ScCAT2-SublocF/ScCAT2-SublocR (Table S1). Thereafter, ScCAT2 was inserted into the plant expression vector pCAMBIA 2300-GFP via restriction endonuclease (XbaI and SpeI) and T4 DNA ligase. The positive plasmid pCAMBIA 2300-ScCAT2-GFP was confirmed by enzyme digestion, and transformed into Agrobacterium tumefaciens EHA105 strain. The EHA105 cells carrying pCAMBIA 2300-ScCAT2-GFP or pCAMBIA 2300-GFP were cultured in liquid LB medium containing 50 μg/mL kanamycin and 35 μg/mL rifampicin. Then, the concentration of the suspension was adjusted to an OD600 = 0.8 using MS liquid medium containing 200 μM acetosyringone. The four-to five-week-old N. benthamiana leaves were selected for injection. After cultivating at 28 °C for 2 days (16 h light and 8 h darkness), subcellular localization of the GFP reporter protein was determined by confocal laser scanning microscopy using a Leica TCS SP5 (Wetzlar, Germany).

4.6. Quantification of ScCAT2 Expression by qRT-PCR Analysis

Changes in ScCAT2 expression in the 10 sugarcane varieties after inoculation with smut pathogen were determined by qRT-PCR. ScCAT2 transcript abundance of the inoculated material minus the gene expression level of the control group was determined at various time points to eliminate the influence of mechanical damage. The transcripts of ScCAT2 in different sugarcane tissues (leaves, buds, roots, stem skin, and stem pith) and under exogenous plant hormones (ABA, SA, and MeJA) and abiotic stresses (NaCl, PEG, and CuCl2) were also assessed using qRT-PCR. The qRT-PCR primer pair ScCAT2-QF/ScCAT2-QR (Table S1) was designed by Primer Premier 5.0. The glyceraldehyde-3-phosphate dehydrogenase (GAPDH) gene (Table S1) was used as reference [62,63]. qRT-PCR was performed on an ABI 7500 system using the SYBR-green dye method. The total volume of the qRT-PCR reaction system was 25 μL, which included 12.5 μL of the FastStart Universal SYBR Green PCR Master (ROX), 0.4 μmoL of the primer, and 2.0 μL of the template (10× cDNA diluted liquid). The qRT-PCR conditions were 50 °C for 2 min, and 95 °C for 10 min, followed by 40 cycles of 95 °C for 15 s, and 60 °C for 1 min. Each sample was assessed using three replicates, using sterile water as control. Expression levels were calculated using the 2−ΔΔCT algorithm [64].

4.7. Prokaryotic Expression Assay

The ORF fragment of ScCAT2 was amplified from plasmid PMD18-T-ScCAT2 using the primer pair ScCAT2-32aF/ScCAT2-32aR (Table S1). The PCR program was 94 °C for 4 min; followed by 35 cycles of 94 °C for 30 s, 58 °C for 30 s, 72 °C for 90 s; and then, a final steps of 72 °C for 10 min. The PCR product and the prokaryotic expression vector pET-32a (+) were digested with EcoRI and XhoI and linked by T4 DNA ligase. The recombinant vector pET-32a-ScCAT2 was confirmed by enzyme digestion and transformed into the E. coli Rosetta strain cells. Single colonies were inoculated into LB liquid medium containing 80 μg/mL ampicillin and 170 μg/mL chloramphenicol, and incubated overnight at 37 °C at 200 rpm. The E. coli Rosetta and Rosetta + pET-32a were used as blank and negative control, respectively. The next day, the amount of 1.0% bacteria cells were transferred into fresh LB liquid medium containing the corresponding antibiotics and cultivated at 37 °C at 200 rpm until its OD600 reached 0.6. The target proteins were induced by 1.0 mM IPTG at 37 °C for 2 h, and then subjected to 12% SDS-PAGE [59].
The Rosetta strains transformed with pET-32a or pET-32a-ScCAT2 were incubated in LB liquid medium (plus 170 μg/mL chloramphenicol and 80 μg/mL ampicillin). When the OD600 of the cells reached 0.6, 1.0 mM IPTG was added and incubated overnight at 28 °C at 200 rpm. Thereafter, the suspension was diluted to an OD600 = 0.6, and then to two levels of 10−3 and 10−4 with fresh LB liquid medium. Ten-microliter aliquots of the 10−3 and 10−4 dilutions were collected and spotted onto LB plates (plus 170 μg/mL chloramphenicol and 80 μg/mL ampicillin) containing NaCl (250, 500, and 750 mM) or CuCl2 (250, 500, and 750 μM). The plates were kept at 37 °C overnight, and photographed using a SONY camera (Tokyo, Japan) [59].

4.8. Transient Overexpression of ScCAT2 in N. benthamiana in Response to Pathogen Infection

The plant overexpression vector pCAMBIA 1301-ScCAT2 was constructed using primer pair ScCAT2-1301F/ScCAT2-1301R (Table S1), XbaI and SpeI restriction endonucleases, and T4 DNA ligase. The positive plasmid was transformed into A. tumefaciens Gv3101 after PCR detection and enzyme digestion verification. The Gv3101 strains carrying the recombinant plasmid pCAMBIA 1301-ScCAT2 or the empty vector pCAMBIA 1301 (control) in LB liquid medium (plus 50 μg/mL kanamycin and 35 μg/mL rifampicin) were cultured overnight at 28 °C at 200 rpm, respectively. The cultures were collected by centrifugation and resuspended in fresh MS liquid medium (plus 200 μM acetosyringone) to an OD600 = 0.8, and then injected into eight-leaf stage N. benthamiana leaves [43]. The agroinfiltrated plants were cultivated at 24 °C for 2 days for DAB staining, and relative expression level analysis of the target gene and nine tobacco immune-related marker genes (Table S1) [59]. All treatments were performed with three replicates.
To determine the inhibitory effect of ScCAT2 on the pathogens, N. benthamiana leaves that were agroinfiltrated with pCAMBIA 1301-ScCAT2 for 1 day were infected with one of two major tobacco pathogens, namely, R. solanacearum and F. solani var. coeruleum [60]. At 1 and 6 dpai, phenotypic observations, DAB staining, and transcript analysis of the tobacco immune-related marker genes were performed according to Liu et al. [65]. All treatments were performed with three replicates.

5. Conclusions

In this study, a full-length sugarcane CAT gene ScCAT2 was cloned and identified. ScCAT2 was constitutively expressed in sugarcane tissues. The ScCAT2 was localized to the cytoplasm, plasma membrane, and nucleus. The ScCAT2 transcript levels were upregulated by ABA, NaCl, PEG, and cold stress, but downregulated by SA, MeJA, and CuCl2. In the 10 different sugarcane genotypes infected with Sporisorium scitamineum, except for YZ03-258, FN40, and FN39, ScCAT2 transcript abundance in the four smut-resistant cultivars (Yacheng05-179, YZ01-1413, YT96-86, and LC05-136) significantly increased at the early stage (1 dpi), but decreased or did not change in the two smut-medium-susceptibility cultivars (ROC22 and GT02-467) and one smut-susceptible cultivar (YZ03-103), from 0 to 3 dpi. In E. coli Rosetta cells, the expression of recombinant protein of ScCAT2 enhanced their tolerance to NaCl stress, whereas the opposite was observed after treatment with CuCl2. Moreover, analysis indicated that the overexpression of ScCAT2 in the N. benthamiana leaves enhanced resistance to R. solanacearum and F. solani var. coeruleum infections. These results may be used in mining and functional identification of ScCAT family genes in sugarcane.

Supplementary Materials

Supplementary materials can be found at https://www.mdpi.com/1422-0067/19/9/2686/s1.

Author Contributions

T.S. and Y.S. conceived and designed the research. T.S. and Z.W. prepared materials. T.S., F.L., W.W., L.W. and J.L. conducted the experiments. T.S. and F.L. analyzed the data. T.S. and Y.S. wrote the manuscript. Y.Q. and L.X. helped to revise the manuscript. All authors read and approved the final manuscript.

Acknowledgments

This work was funded by the National Natural Science Foundation of China (31501363, 31101196 and 31671752), the Research Funds for Distinguished Young Scientists in Fujian Provincial Department of Education (SYC-2017), the Special Fund for Science and Technology Innovation of Fujian Agriculture and Forestry University (KFA17267A), the China Agriculture Research System (CARS-17).

Conflicts of Interest

The authors declare no conflict of interest.

References

  1. Willekens, H.; Inzé, D.; Montagu, M.V.; Camp, W.V. Catalases in plants. Mol. Breed. 1995, 1, 207–228. [Google Scholar] [CrossRef]
  2. Mhamdi, A.; Queval, G.; Chaouch, S.; Vanderauwera, S.; Van Breusegem, F.; Noctor, G. Catalase function in plants: A focus on Arabidopsis mutants as stress-mimic models. J. Exp. Bot. 2010, 61, 4197–4220. [Google Scholar] [CrossRef] [PubMed]
  3. Iwamoto, M.; Higo, H.; Higo, K. Differential diurnal expression of rice catalase genes: The 5′-flanking region of CatA, is not sufficient for circadian control. Plant Sci. 2000, 151, 39–46. [Google Scholar] [CrossRef]
  4. Redinbaugh, M.G.; Wadsworth, G.J.; Scandalios, J.G. Characterization of catalase transcripts and their differential expression in maize. Int. J. Biochem. Biophys. 1988, 951, 104–116. [Google Scholar] [CrossRef]
  5. Skadsen, R.W.; Schulze-Lefert, P.; Herbst, J.M. Molecular cloning, characterization and expression analysis of two catalase isozyme genes in barley. Plant Mol. Biol. 1996, 29, 1005–1014. [Google Scholar] [CrossRef]
  6. Saruyama, H.; Matsumura, T. Cloning and characterization of a cDNA encoding catalase in wheat. DNA Seq. 1999, 10, 31–35. [Google Scholar] [CrossRef] [PubMed]
  7. Guan, L.Q.; Scandalios, J.G. Developmentally related responses of maize catalase genes to salicylic acid. Proc. Natl. Acad. Sci. USA 1995, 92, 5930–5934. [Google Scholar] [CrossRef] [PubMed]
  8. Song, X.H. Research Progress on catalase in plants. Chin. J. Anhui Agric. Sci. 2007, 35, 9824–9827. [Google Scholar]
  9. Du, Y.Y.; Wang, P.C.; Chen, J.; Song, C.P. Comprehensive functional analysis of the catalase gene family in Arabidopsis thaliana. J. Integr. Plant Biol. 2008, 50, 1318–1326. [Google Scholar] [CrossRef] [PubMed]
  10. Scandalios, J.G.; Acevedo, A.; Ruzsa, S. Catalase gene expression in response to chronic high temperature stress in maize. Plant Sci. 2000, 156, 103–110. [Google Scholar] [CrossRef]
  11. Boldt, R.; Scandalios, J.G. Circadian regulation of the Cat3, catalase gene in maize (Zea mays L.): Entrainment of the circadian rhythm of Cat3, by different light treatments. Plant J. 1995, 7, 989–999. [Google Scholar] [CrossRef]
  12. Kwon, S.I.; Lee, H.; An, C.S. Differential expression of three catalase genes in the small radish (Rhaphanus sativus L. var. sativus). Mol. Cells 2007, 24, 37–44. [Google Scholar] [PubMed]
  13. Luna, C.M.; Pastori, G.M.; Driscoll, S.; Groten, K.; Bernard, S.; Foyer, C.H. Drought controls on H2O2 accumulation, catalase (cat) activity and cat gene expression in wheat. J. Exp. Bot. 2005, 56, 417–423. [Google Scholar] [CrossRef] [PubMed]
  14. Ma, C.L.; Wang, P.P.; Cao, Z.Y.; Zhao, Y.X.; Zhang, H. Cloning and differential gene expression of two catalases in Suaeda salsa in response to salt stress. J. Integr. Plant Biol. 2003, 45, 93–97. [Google Scholar]
  15. Guan, L.M.; Scandalios, J.G. Hydrogen-peroxide-mediated catalase gene expression in response to wounding. Free Radic. Biol. Med. 2000, 28, 1182–1190. [Google Scholar] [CrossRef]
  16. Mittler, R.; Herr, E.H.; Orvar, B.L.; Van, C.W.; Willekens, H.; Inzé, D.; Ellis, B.E. Transgenic tobacco plants with reduced capability to detoxify reactive oxygen intermediates are hyperresponsive to pathogen infection. Proc. Natl. Acad. Sci. USA 1999, 96, 14165–14170. [Google Scholar] [CrossRef] [PubMed] [Green Version]
  17. Purev, M.; Kim, Y.J.; Kim, M.K.; Pulla, R.K.; Yang, D.C. Isolation of a novel catalase (Cat1) gene from Panax ginseng and analysis of the response of this gene to various stresses. Plant Physiol. Biochem. 2010, 48, 451–460. [Google Scholar] [CrossRef] [PubMed]
  18. Lang, M.L.; Zhang, Y.X.; Chai, T.Y. Identification of genes up-regulated in response to Cd exposure in Brassica juncea L. Gene 2005, 363, 151–158. [Google Scholar]
  19. Yi, S.Y.; Yu, S.H.; Choi, D. Molecular cloning of a catalase cDNA from Nicotiana glutinosa L. and its repression by tobacco mosaic virus infection. Mol. Cells 1999, 9, 320–325. [Google Scholar] [PubMed]
  20. Yong, B.; Wang, X.Y.; Xu, P.; Zheng, H.Y.; Fei, X.T.; Hong, Z.X.; Ma, Q.Q.; Miao, Y.Z.; Yuan, X.H.; Jiang, Y.S.; et al. Isolation and abiotic stress resistance analyses of a catalase gene from Ipomoea batatas (L.) Lam. Biomed Res. Int. 2017, 2017, 6847532. [Google Scholar] [CrossRef] [PubMed]
  21. Frugoli, J.A.; Mcclung, C.R. Catalase is encoded by a multigene family in Arabidopsis thaliana (L.) Heynh. Plant Physiol. 1996, 112, 327–336. [Google Scholar] [CrossRef] [PubMed]
  22. Reilly, K.; Han, Y.; Tohme, J.; Beeching, J.R. Isolation and characterization of a cassava catalase expressed during post-harvest physiological deterioration 1. Gene Struct. Expr. 2001, 1518, 317–323. [Google Scholar] [CrossRef]
  23. Su, Y.C.; Guo, J.L.; Ling, H.; Chen, S.S.; Wang, S.S.; Xu, L.P.; Allan, A.C.; Que, Y.X. Isolation of a novel peroxisomal catalase gene from sugarcane, which is responsive to biotic and abiotic stresses. PLoS ONE 2014, 9, e84426. [Google Scholar] [CrossRef] [PubMed]
  24. Liu, Y.; Yao, Y.L.; Hu, X.W.; Xing, S.L.; Xu, L. Cloning and allelic variation of two novel catalase genes (SoCAT-1 and SsCAT-1) in Saccharum officinarum L. and Saccharum spontaneum L. Biotechnol. Biotechnol. Equip. 2015, 29, 431–440. [Google Scholar] [CrossRef]
  25. Liu, Y.; Hu, X.W.; Yao, Y.L.; Xu, L.; Xing, S.L. Isolation and expression analysis of catalase genes in Erianthus arundinaceus, and sugarcane. Sugar Tech 2016, 18, 468–477. [Google Scholar] [CrossRef]
  26. Zhang, J.S.; Zhang, Q.; Li, L.T.; Tang, H.B.; Zhang, Q.; Chen, Y.; Arro, J.; Zhang, X.T.; Wang, A.Q.; Miao, C.Y.; et al. Recent polyploidization events in three Saccharum founding species. Plant Biotechnol. J. 2018, 43, 847–852. [Google Scholar] [CrossRef] [PubMed]
  27. Iwamoto, M.; Higo, K. Accumulation of sense—Antisense transcripts of the rice catalase gene CatB under dark conditions requires signals from shoots. Gene 2006, 377, 186–194. [Google Scholar] [CrossRef] [PubMed]
  28. Modarresi, M.; Nematzadeh, G.A.; Moradian, F. Salinity response pattern and isolation of catalase gene from halophyte plant Aeluropus littoralis. Photosynthetica 2013, 51, 621–629. [Google Scholar] [CrossRef]
  29. Acevedo, A.; Williamson, J.D.; Scandalios, J.G. Photoregulation of the Cat2 and Cat3 catalase genes in pigmented and pigment-deficient maize: The circadian regulation of Cat3 is superimposed on its quasi-constitutive expression in maize leaves. Genetics 1991, 127, 601–607. [Google Scholar] [PubMed]
  30. Guan, L.Q.; Scandalios, J.G. Effects of the plant growth regulator abscisic acid and high osmoticum on the developmental expression of the maize catalase genes. Physiol. Plant. 1998, 104, 413–422. [Google Scholar] [CrossRef]
  31. Dong, C.; Zheng, X.F.; Diao, Y.; Wang, Y.W.; Zhou, M.Q.; Hu, Z.L. Molecular cloning and expression analysis of a catalase gene (Nncat) from Nelumbo nucifera. Appl. Biochem. Biotechnol. 2015, 177, 1216–1228. [Google Scholar] [CrossRef] [PubMed]
  32. Nie, Q.; Gao, G.L.; Fan, Q.J.; Qiao, G.; Wen, X.P.; Liu, T.; Peng, Z.J.; Cai, Y.Q. Isolation and characterization of a catalase gene “HuCAT3” from pitaya (Hylocereus undatus) and its expression under abiotic stress. Gene 2015, 563, 63–71. [Google Scholar] [CrossRef] [PubMed]
  33. Zimmermann, P.; Heinlein, C.; Orendi, G.; Zentgraf, U. Senescence-specific regulation of catalases in Arabidopsis thaliana (L.) heynh. Plant Cell Environ. 2006, 29, 1049–1060. [Google Scholar] [CrossRef] [PubMed]
  34. Ingram, J.; Bartels, D. The molecular basis of dehydration tolerance in plants. Annu. Rev. Plant Physiol. Plant Mol. Biol. 1996, 47, 377–403. [Google Scholar] [CrossRef] [PubMed]
  35. Zhou, Y.; Liu, S.Q.; Yang, Z.J.; Yang, Y.G.; Jiang, L.W.; Hu, L.F. CsCAT3, a catalase gene from Cucumis sativus, confers resistance to a variety of stresses to Escherichia coli. Biotechnol. Biotechnol. Equip. 2017, 31, 886–896. [Google Scholar] [CrossRef]
  36. Figueroayáñez, L.; Canososa, J.; Castaño, E.; Arroyoherrera, A.L.; Caamalvelazquez, J.H.; Sanchezteyer, F.; Lópezgómez, R.; Santosbriones, C.D.L.; Rodríguezzapata, L. Phylogenetic relationships and expression in response to low temperature of a catalase gene in banana (Musa acuminata cv. “Grand Nain”) fruit. Plant Cell Tissue Org. 2012, 109, 429–438. [Google Scholar] [CrossRef]
  37. Wutipraditkul, N.; Boonkomrat, S.; Buaboocha, T. Cloning and characterization of catalases from rice, Oryza sativa L. Biosci. Biotechnol. Biochem. 2014, 75, 1900–1906. [Google Scholar] [CrossRef] [PubMed]
  38. Ma, L.L.; Cui, G.F.; Wang, X.N.; Jia, W.; Duan, Q.; Du, W.W.; Wang, J.H. Cloning and expression analysis of catalase (Ls-Cat1) gene in Lilium sargentiae Wilson. Acta Agric. Nucl. Sin. 2017, 31, 1700–1707. [Google Scholar]
  39. Wang, S.P.; Yang, J.G.; Zhan, H.X.; Shen, L.L.; Qian, Y.M.; Wu, X.; Wang, F.L.; Li, X.H.; Chen, X.M.; Song, Y.C. Cloning of catalase gene (CAT1) and its expression patterns in Nicotiana tabacum L. Acta Tab. Sin. 2014, 20, 103–109. [Google Scholar]
  40. El-Awady, M.; Reda, E.A.M.; Haggag, W.; Youssef, S. Transgenic canola plants over-expressing bacterial catalase exhibit enhanced resistance to Peronospora parasitica and Erysiphe polygoni. Arab. J. Biotechnol. 2008, 11, 71–84. [Google Scholar]
  41. Yu, D.Q.; Xie, Z.X.; Chen, C.H.; Fan, B.F.; Chen, Z.X. Expression of tobacco class II catalase gene activates the endogenous homologous gene and is associated with disease resistance in transgenic potato plants. Plant Mol. Biol. 1999, 39, 477–488. [Google Scholar] [CrossRef] [PubMed]
  42. Polidoros, A.N.; Mylona, P.V.; Scandalios, J.G. Transgenic tobacco plants expressing the maize cat2 gene have altered catalase levels that affect plant-pathogen interactions and resistance to oxidative stress. Transgenic Res. 2001, 10, 555–569. [Google Scholar] [CrossRef] [PubMed]
  43. Choi, D.S.; Hwang, I.S.; Hwang, B.K. Requirement of the cytosolic interaction between pathogenesis-related protein 10 and leucine-rich repeat protein1 for cell death and defense signaling in pepper. Plant Cell 2012, 24, 1675–1690. [Google Scholar] [CrossRef] [PubMed]
  44. Dangl, J.L.; Dietrich, R.A.; Richberg, M.H. Death don’t have no mercy: Cell death programs in plant-microbe interactions. Plant Cell 1996, 8, 1793–1807. [Google Scholar] [CrossRef] [PubMed]
  45. Melechbonfil, S.; Sessa, G. Tomato MAPKKK epsilon is a positive regulator of cell-death signaling networks associated with plant immunity. Plant J. 2010, 64, 379–391. [Google Scholar] [CrossRef]
  46. Levine, A.; Tenhaken, R.; Dixon, R.; Lamb, C. H2O2 from the oxidative burst orchestrates the plant hypersensitive disease resistance response. Cell 1994, 79, 583–593. [Google Scholar] [CrossRef]
  47. Mani, T.; Manjula, S. Optimization of Agrobacterium-mediated transient gene expression and endogenous gene silencing in Piper colubrinum, Link. by vacuum infiltration. Plant Cell Tissue Org. 2011, 105, 113–119. [Google Scholar] [CrossRef]
  48. Hückelhoven, R.; Fodor, J.; Trujillo, M.; Kogel, K.H. Barley Mla and Rar mutants compromised in the hypersensitive cell death response against Blumeria graminis f. sp. hordei are modified in their ability to accumulate reactive oxygen intermediates at sites of fungal invasion. Planta 2000, 212, 16–24. [Google Scholar] [PubMed]
  49. Hwang, I.S.; Hwang, B.K. The pepper mannose-binding lectin gene CaMBL1 is required to regulate cell death and defense responses to microbial pathogens. Plant Physiol. 2011, 155, 447–463. [Google Scholar] [CrossRef] [PubMed]
  50. Scortecci, K.C.; Creste, S.; Calsa, T., Jr.; Xavier, M.A.; Landell, M.G.A.; Figueira, A.; Benedito, V.A. Challenges, opportunities and recent advances in sugarcane breeding. In Plant Breeding, 1st ed.; Abdurakhmonov, I., Ed.; InTech Publisher: Rijeka, Croatia, 2012; pp. 267–296. [Google Scholar]
  51. Garsmeur, O.; Droc, G.; Antonise, R.; Grimwood, J.; Potier, B.; Aitken, K.; Jenkins, J.; Martin, G.; Charron, C.; Hervouet, C.; et al. A mosaic monoploid reference sequence for the highly complex genome of sugarcane. Nat. Commun. 2018, 9, 2638. [Google Scholar] [CrossRef] [PubMed]
  52. Lakshmanan, P.; Geijskes, R.J.; Aitken, K.S.; Grof, C.L.P.; Bonnett, G.D.; Smith, G.R. Sugarcane biotechnology: The challenges and opportunities. In Vitro Cell. Dev. Biol. Plant 2005, 41, 345–363. [Google Scholar] [CrossRef]
  53. Srikanth, J.; Subramonian, N.; Premachandran, M.N. Advances in transgenic research for insect resistance in sugarcane. Trop. Plant Biol. 2011, 4, 52–61. [Google Scholar] [CrossRef]
  54. Gómez-Merino, F.C.; Trejo-Téllez, L.I.; Sentíes-Herrera, H.E. Sugarcane as a novel biofactory: Potentialities and challenges. In Biosystems Engineering: Biofactories for Food Production in the Century XXI, 2nd ed.; Guevara-Gonzalez, R., Torres-Pacheco, I., Eds.; Springer International Publishing: Cham, Switzerland, 2014; pp. 129–149. [Google Scholar]
  55. Shen, X.J.; Guo, X.W.; Guo, X.; Zhao, D.; Zhao, W.; Chen, J.S.; Li, T.H. PacMYBA, a sweet cherry R2R3-MYB transcription factor, is a positive regulator of salt stress tolerance and pathogen resistance. Plant Physiol. Biochem. 2017, 112, 302–311. [Google Scholar] [CrossRef] [PubMed]
  56. Kumar, M.; Choi, J.; An, G.; Kim, S.R. Ectopic expression of OsSta2 enhances salt stress tolerance in rice. Front. Plant Sci. 2017, 8, 316. [Google Scholar] [CrossRef] [PubMed]
  57. Su, Y.C.; Wang, Z.Q.; Xu, L.P.; Peng, Q.; Liu, F.; Li, Z.; Que, Y.X. Early selection for smut resistance in sugarcane using pathogen proliferation and changes in physiological and biochemical indices. Front. Plant Sci. 2016, 7, e84426. [Google Scholar] [CrossRef] [PubMed]
  58. Moosawijorf, S.A.; Izadi, M.B. In vitro detection of yeast-like and mycelial colonies of Ustilago scitaminea in tissue-cultured plantlets of sugarcane using polymerase chain reaction. J. Appl. Sci. 2007, 7, 3768–3773. [Google Scholar]
  59. Su, Y.C.; Xu, L.P.; Xue, B.T.; Wu, Q.B.; Guo, J.L.; Wu, L.G.; Que, Y.X. Molecular cloning and characterization of two pathogenesis-related β-1,3-glucanase genes ScGluA1 and ScGluD1 from sugarcane infected by Sporisorium scitamineum. Plant Cell Rep. 2013, 32, 1503–1519. [Google Scholar] [CrossRef] [PubMed]
  60. Liu, F.; Sun, T.T.; Wang, L.; Su, W.H.; Gao, S.W.; Su, Y.C.; Xu, L.P.; Que, Y.X. Plant jasmonate ZIM domain genes: Shedding light on structure and expression patterns of JAZ gene family in sugarcane. BMC Genom. 2017, 18, 771. [Google Scholar] [CrossRef] [PubMed]
  61. Chen, H.J.; Wu, S.D.; Huang, G.J.; Shen, C.Y.; Afiyanti, M.; Li, W.J.; Lin, Y.H. Expression of a cloned sweet potato catalase SPCAT1 alleviates ethephon-mediated leaf senescence and H2O2 elevation. J. Plant. Physiol. 2012, 169, 86–97. [Google Scholar] [CrossRef] [PubMed]
  62. Que, Y.X.; Xu, L.P.; Xu, J.S.; Zhang, J.S.; Zhang, M.Q.; Chen, R.K. Selection of control genes in real-time qPCR analysis of gene expression in sugarcane. Chin. J. Trop. Crop. 2009, 30, 274–278. [Google Scholar]
  63. Ling, H.; Wu, Q.B.; Guo, J.L.; Xu, L.P.; Que, Y.X. Comprehensive selection of reference genes for gene expression normalization in sugarcane by realtime quantitative RT-PCR. PLoS ONE 2014, 9, e97469. [Google Scholar] [CrossRef] [PubMed]
  64. Livak, K.J.; Schmittgen, T.D. Analysis of relative gene expression data using real-time quantitative PCR and the 2−∆∆CT method. Methods 2001, 25, 402–408. [Google Scholar] [CrossRef] [PubMed]
  65. Liu, F.; Huang, N.; Wang, L.; Ling, H.; Sun, T.T.; Ahmad, W.; Muhammad, K.; Guo, J.X.; Xu, L.P.; Gao, S.W.; et al. A novel l-ascorbate peroxidase 6 gene, ScAPX6, plays an important role in the regulation of response to biotic and abiotic stresses in sugarcane. Front. Plant Sci. 2018, 8, 2262. [Google Scholar] [CrossRef] [PubMed]
Figure 1. Nucleotide acid sequence and the deduced amino acid sequence of ScCAT2. Red letters represented the specific amplification primer pair for ScCAT2. Catalase active site (FARERIPERVVHARGAS) and heme-ligand (RVFAYADTQ) signatures of ScCAT2 were underlined. * represented stop codon.
Ijms 19 02686 g001
Figure 2. Protein sequence and homology of ScCAT2 with catalases from sugarcane and other plant spices. So, Saccharum officinarum; Sb, Sorghum bicolor; Si, Setaria italic; Al, Aeluropus litoralis; Os, Oryza sativa; Hv, Hordeum vulgare; and Ta, Triticum aestivum. The black foreground and white background represented non-similar residues. The blue foreground and cyan background indicated conservative residues. The black foreground and green background were blocks of similar residues. The red foreground and yellow background showed identical residues. The dark green foreground and white background depicted the weakly similar residues.
Ijms 19 02686 g002
Figure 3. Phylogenetic reconstruction of ScCAT2 with catalases from sugarcane and other plant species. The maximum-likelihood method with 1000 bootstrap replication was used. Zm, Zea mays; Os, Oryza sativa; Hv, Hordeum vulgare; Ta, Triticum aestivum; Sb, Sorghum bicolor; Si, Setaria italic; Al, Aeluropus littoralis; So, Saccharum officinarum; Ss, Saccharum spontaneum; and Ea, Erianthus arundinaceus. ScCAT2 was marked with a red asterisk.
Ijms 19 02686 g003
Figure 4. Subcellular localization of ScCAT2 and empty vector in Nicotiana benthamiana leaves after 2 days of infiltration. Images of epidermal cells captured using visible light, green fluorescence, blue fluorescence, and merged light. Red arrows 1, 2, and 3, indicated the plasma membrane, cytoplasm, and nucleus, respectively. Bar = 20 μm. DAPI (4′,6-diamidino-2-phenylindole) was used to stain the nucleus.
Ijms 19 02686 g004
Figure 5. Tissue-specific expression analysis of ScCAT2 in 10-month-old sugarcane Yacheng05-179 plants. Data were normalized to the expression level of the glyceraldehyde-3-phosphate dehydrogenase (GAPDH) gene. All data points were expressed as means ± standard error (n = 3). Different lowercase letters indicated a significant difference (p < 0.05) compared to the control, as determined with Duncan’s test.
Ijms 19 02686 g005
Figure 6. qRT-PCR analysis of the ScCAT2 expression in 10 different sugarcane genotypes after inoculation with Sporisorium scitamineum. The data were normalized to the expression level of the glyceraldehyde-3-phosphate dehydrogenase (GAPDH) gene. All data points (normalized to the control) were expressed as means ± standard error (n = 3). Different lowercase letters indicated a significant difference (p < 0.05) compared to the control, as determined with Duncan’s test. Yacheng05-179, YZ01-1413, YT96-86, LC05-136, and YZ03-258 were smut-resistant cultivars (R). ROC22, GT02-467, and FN39 were smut-medium-susceptibility cultivars (MS). YZ03-103 and FN40 were smut-susceptible cultivars (S). dpi, days post-inoculation.
Ijms 19 02686 g006
Figure 7. Relative expression of ScCAT2 after the application of exogenous plant hormone and abiotic stress. ScCAT2 transcript abundance in Yacheng05-179 tissue cultured plantlets was assessed in the presence of 100 μM ABA, 5 mM SA, 25 μM MeJA, 250 mM NaCl, 25% PEG, 100 μM CuCl2, and 4 °C low temperature. The data were normalized to the expression level of the glyceraldehyde-3-phosphate dehydrogenase (GAPDH) gene. All data points were expressed as the means ± standard error (n = 3). Different lowercase letters indicated a significant difference (p < 0.05) compared to the control, as determined with Duncan’s test. ABA, abscisic acid; SA, salicylic acid; MeJA, methyl jasmonate; NaCl, sodium chloride; PEG, polyethylene glycol; CuCl2, copper chloride; and low temperature, 4 °C cold stress.
Ijms 19 02686 g007
Figure 8. Spot assay of Rosetta + pET-32a (control) (a) and Rosetta + pET-32a-ScCAT2 (b) on LB plates with different concentrations of NaCl and CuCl2 components. The cultures of Rosetta + pET-32a-ScCAT2 and Rosetta + pET-32a were supplemented with 1.0 mM isopropyl β-d-thiogalactoside to induce the expression of recombinant protein overnight. Then, the cultures were adjusted to an OD600 = 0.6. Ten microliters from the 10−3 (left side of red line on plate) to 10−4 (right side of red line on plate) dilutions were spotted onto the LB basal plates (A) or with NaCl (250, 500, and 750 mM) (B), and CuCl2 (250, 500, and 750 μM) (C). NaCl, sodium chloride; and CuCl2, copper chloride.
Ijms 19 02686 g008
Figure 9. Transient overexpression of ScCAT2 in Nicotiana benthamiana leaves. (A) RT-PCR analysis of ScCAT2 in the N. benthamiana leaves 2 days after infiltration with Agrobacterium strain GV3101 that carried the vector 35S::00 or 35S::ScCAT2. (B) DAB staining of N. benthamiana leaves 2 days after infiltration with 35S::ScCAT2-containing Agrobacterium strain to assess H2O2 production. (C) Relative expression level of nine tobacco immune-related marker genes in 35S::ScCAT2-transiently expressing leaves at 2 days after infiltration. The tobacco immune-related marker genes included the hypersensitive response marker genes NtHSR201, NtHSR203, and NtHSR515; the salicylic acid-related genes NtPR-1 and NtPR-1a/c; the jasmonic acid pathway-associated genes NtPR2 and NtPR3; and the ethylene synthesis-dependent genes NtEFE26 and NtAccdeaminase, and using NtEF1-α for data normalization. All data points were presented as the means ± standard error (n = 3). Different lowercase letters indicated a significant difference, as determined with Duncan’s test (p < 0.05). The empty vector 35S::00 and recombinant vector 35S::ScCAT2 were indicated by a and b, respectively. (1) and (2) represented images captured using a SONY camera and microscope, respectively. Bar = 1 mm.
Ijms 19 02686 g009
Figure 10. The effect of transient overexpression of ScCAT2 in Nicotiana benthamiana leaves after inoculation with Ralstonia solanacearum. (A) The disease symptoms and DAB staining of N. benthamiana leaves at 1 day and 6 days post-inoculation with R. solanacearum. (B) Analysis of nine tobacco immune-related marker genes in the N. benthamiana leaves 1 day and 6 days after inoculation with R. solanacearum. The tobacco immune-related marker genes, which included the hypersensitive response marker genes NtHSR201, NtHSR203, and NtHSR515; the salicylic acid-related genes NtPR-1 and NtPR-1a/c; the jasmonic acid pathway-associated genes NtPR2 and NtPR3; and the ethylene synthesis-dependent genes NtEFE26 and NtAccdeaminase, and using NtEF1-α for data normalization. All data points were presented as means ± standard error (n = 3). Different lowercase letters indicated a significant difference, as determined with Duncan’s test (p < 0.05). The empty vector 35S::00 and recombinant vector 35S::ScCAT2 were indicated by a and b, respectively. (1) and (2) represented images captured using a SONY camera and microscope, respectively. Bar = 1 mm.
Ijms 19 02686 g010
Figure 11. The effect of transient overexpression of ScCAT2 in Nicotiana benthamiana leaves after inoculation with Fusarium solani var. coeruleum. (A) The disease symptoms and DAB staining of N. benthamiana leaves 1 day and 6 days after inoculation with F. solani var. coeruleum. (B) Analysis of the nine tobacco immune-related marker genes in the N. benthamiana leaves after inoculation with F. solani var. coeruleum for 1 day and 6 days, respectively. The tobacco immune-related marker genes included the hypersensitive response marker genes NtHSR201, NtHSR203, and NtHSR515; the salicylic acid-related genes NtPR-1 and NtPR-1a/c; the jasmonic acid pathway-associated genes NtPR2 and NtPR3; and the ethylene synthesis-dependent genes NtEFE26 and NtAccdeaminase, and using NtEF1-α for data normalization. All data points were means ± standard error (n = 3). Different lowercase letters indicated a significant difference, as determined with Duncan’s test (p < 0.05). The empty vector 35S::00 and recombinant vector 35S::ScCAT2 were indicated by a and b, respectively. (1) and (2) represented images captured using a SONY camera and microscope, respectively. Bar = 1 mm.
Ijms 19 02686 g011

