Article

An Analysis of the mRNA Expression of Peripheral-Blood Stem and Progenitor Cell Markers in Pancreatic Neoplastic Disorders

by
Krzysztof Dąbkowski
1,*,
Maciej Tarnowski
2,3,
Krzysztof Safranow
4,
Maria Dąbkowska
5,
Alicja Kosiorowska
5,
Kamila Pukacka
5,6 and
Teresa Starzyńska
1
1
Department of Gastroenterology, Pomeranian Medical University, 71-252 Szczecin, Poland
2
Department of Physiology in Health Sciences, Pomeranian Medical University, 71-210 Szczecin, Poland
3
Institute of Physical Culture Sciences, University of Szczecin, 70-453 Szczecin, Poland
4
Department of Biochemistry and Medical Chemistry, Pomeranian Medical University, 70-899 Szczecin, Poland
5
Independent Laboratory of Pharmacokinetic and Clinical Pharmacy, Pomeranian Medical University, 70-252 Szczecin, Poland
6
Department of Pharmaceutical Technology, Pomeranian Medical University, 70-204 Szczecin, Poland
*
Author to whom correspondence should be addressed.
Curr. Issues Mol. Biol. 2025, 47(4), 236; https://doi.org/10.3390/cimb47040236
Submission received: 15 February 2025 / Revised: 20 March 2025 / Accepted: 25 March 2025 / Published: 28 March 2025

Simple Summary

Pancreatic cancer is one of the deadliest cancers, often diagnosed at an advanced stage when treatment options are limited and not effective. This study aimed to identify specific genetic markers in the blood that could help detect pancreatic cancer. We analyzed the expression of six genes in peripheral-blood mononuclear cells from the patients with pancreatic cancer, neuroendocrine tumors, and healthy individuals. The results showed that three genes—NANOG, CK19, and INS—were significantly elevated in patients with pancreatic cancer compared to healthy controls. These genes were not elevated in patients with neuroendocrine tumors, suggesting that this phenomenon may be specific to pancreatic cancer. Additionally, CK19 was associated with inflammation, a common characteristic of pancreatic cancer. These findings underscore the importance of studying mRNA expression in peripheral blood to enhance our understanding of pancreatic neoplasms and highlight the potential for using blood-based genetic markers to improve the detection of pancreatic cancer. With further validation, this approach could pave the way for less invasive and more accessible diagnostic tools.

Abstract

Background: Our aim was to assess the expression profiles of the messenger RNA (mRNA) expression profiles of stem-cell genes (POU5F1, NANOG) and pancreatic progenitor genes (CK19, HES1, INS, PDX1) in peripheral-blood mononuclear cells (PBMCs) in selected neoplastic pancreatic diseases, such as cancer and neuroendocrine tumors, to identify neoplastic disease markers in the pancreas. Methods: In this study, 49 patients diagnosed with pancreatic neoplastic diseases (37 with cancer and 12 with neuroendocrine tumors) and 34 control patients, all of whom were hospitalized at a tertiary center, were enrolled. Venous blood samples were collected from the participants, and RNA was extracted from PBMCs. The mRNA expression levels of six stem-cell and pancreatic progenitor markers— POU5F1 (POU class 5 homeobox 1), NANOG, CK19 (keratin 19), HES1 (HES family bHLH transcription factor 1), INS (insulin), and PDX1 (pancreatic and duodenal homeobox 1)—were quantified via real-time quantitative PCR. The data were statistically analyzed to explore associations between gene-expression levels and various clinical, biochemical, and morphological parameters (including full blood count, Ca 19-9, weight, height, and BMI) via the Kruskal–Wallis test, Mann–Whitney U test, and Spearman rank correlation coefficient. Results: The results revealed that the expression of the gene associated with early stem cells, NANOG (median= 0.002, p = 0.03), as well as the genes encoding insulin INS (median = 0.004, p = 0.02) and CK19 (median 0.0003, p = 0.005), was significantly elevated in patients with pancreatic cancer. However, the gene-expression levels in patients with neuroendocrine tumors did not exhibit statistically significant differences compared to those observed in the control group. Additionally, no significant differences in gene expression were observed among patients at different stages of pancreatic cancer. Furthermore, CK19 overexpression was found to be positively correlated with inflammatory markers, specifically C-reactive protein (CRP) and WBC, in patients with pancreatic cancer. Conclusions: An elevated mRNA expression of specific stem and pancreatic progenitor genes (NANOG, INS, CK19) in PBMCs may serve as a potential markers for pancreatic cancer, reflecting the disease’s interplay with systemic inflammation.

1. Introduction

Pancreatic ductal adenocarcinoma (PDAC) is a tumor with a rising incidence that constitutes 90% of all pancreatic malignancies and is characterized by intricate interactions between genetic, epigenetic, and microenvironmental factors that contribute to an aggressive nature and late-stage diagnosis, resistance to chemotherapy, and early metastasis [1,2]. It develops from the exocrine part of the gland and is one of the deadliest solid tumors in humans. Despite the development of oncology and diagnostic methods, the prognosis for this malignancy has not changed significantly for years, and no more than 10% of patients survive 5 years from diagnosis. The poor prognosis of patients with PDAC is largely attributable to the complex interplay of factors within the tumor microenvironment (TME), which not only support tumor growth and progression but also contribute to immune evasion and resistance to conventional treatments [3].
The TME in PDAC is characterized by a dense desmoplastic stroma of activated fibroblasts, extracellular matrix components, and many immune cells that collectively create a hostile environment for therapeutic intervention. This stromal barrier is not only a passive system but also an active contributor to tumor biology, as it secretes growth factors, cytokines, and extracellular matrix proteins that promote tumor survival, invasion, and metastasis [4,5]. The stroma also serves as a physical barrier to the delivery of chemotherapeutic agents and increases the difficulty of treatment [6]. Heterogeneity within the tumor microenvironment and differential gene expression have been observed in the tumors of PDAC patients [7,8,9].
In contrast, pancreatic endocrine tumors (PNETs) are less common and often present different clinical characteristics. PNETs can range from benign, well-differentiated tumors to highly aggressive, poorly differentiated forms, which complicates their management due to variability in clinical behavior and the absence of reliable early biomarkers [10,11]. Functional PNETs that secrete hormones can lead to symptomatic presentations associated with hormone hypersecretion, whereas nonfunctional PNETs are often discovered incidentally during imaging for unrelated conditions [12,13].
Peripheral-blood mononuclear cells (PBMCs) have emerged as promising noninvasive biomarkers because of their accessibility and role in reflecting systemic changes associated with cancer. PBMCs, which include lymphocytes and monocytes, are isolated from blood via density gradient centrifugation. This technique allows a diverse array of cells to be obtained from a simple blood draw, thus providing a minimally invasive method for studying gene expression associated with various diseases, including cancer [14]. In pancreatic cancer, PBMCs provide insights into the systemic effects of tumors, particularly in terms of gene expression associated with stem cells and progenitor cells. Cancer stem cells (CSCs) are a type of tumor cell characterized by their ability to self-renew and differentiate into various cell types and play crucial roles in tumor initiation, progression, and resistance to therapy [15,16]. At the cellular level, there has been significant interest in identifying biomarkers that reflect the presence and activity of these cells. Among the most promising candidates are genes related to stemness and progenitor-cell functions, including NANOG, POU5F1, CK19, HES1, PDX1, and INS. These genes are critical not only for maintaining the pluripotency of stem cells but also for their involvement in the pathological processes of tumorigenesis, metastasis, and resistance to therapy [17,18,19]. The alterations of progenitor- and stem-cell genes and their influence on survival and treatment were previously described in different malignancies including inter alia breast, renal cell cancer, lung cancer, and seminoma [20,21,22,23,24].
The development of pancreatic malignancies is related to metabolic alterations [25]. Moreover, genetic alterations in both progenitor genes and stem-cell genes and markers have been described in patients with pancreatic neoplastic and inflammatory disorders [26,27]. The challenge of early detection is underscored by the lack of specific and reliable biomarkers that can differentiate PDAC from other pancreatic conditions, including benign neoplasms and chronic pancreatitis. Currently, the only widely accepted biomarker for pancreatic cancer is carbohydrate antigen 19-9 (Ca 19-9), which is commonly used in clinical practice to monitor disease progression and response to therapy [28]. Ca 19-9 lacks sensitivity and specificity, particularly in the early stages of the disease [29]. As a result, novel biomarkers that can facilitate early diagnosis, predict prognosis, and monitor therapeutic responses in PDAC patients are needed.
NANOG and POU5F1 are well-known transcription factors that play critical roles in maintaining the pluripotency of embryonic stem cells, and their expression has been associated with poor prognosis in various cancers, including PDAC [30]. NANOG has been shown to enhance the self-renewal capabilities of CSCs and promote resistance to chemotherapy by activating survival pathways such as the PI3K/Akt and Wnt/β-catenin signaling cascades [31,32]. POU5F1, on the other hand, has been implicated in epithelial–mesenchymal transition (EMT), a process that endows cancer cells with enhanced migratory and invasive properties, facilitating metastasis [33]. CK19, a cytokeratin typically expressed in epithelial cells, is another marker of interest in PDAC. CK19 is widely used as a diagnostic marker for PDAC, distinguishing it from other types of pancreatic neoplasms, such as acinar cell carcinoma and neuroendocrine tumors [34]. High CK19 expression has been correlated with a greater incidence of lymph node metastasis and poorer overall survival, indicating its potential role as a prognostic marker [35]. Moreover, recent studies suggest that CK19 may play a direct role in the metastatic process, possibly through interactions with the extracellular matrix and modulation of EMT pathways [36].
In addition to these well-established markers, other genes involved in pancreatic development and function, such as HES1, PDX1, and INS, have also been implicated in pancreatic tumorigenesis. HES1, which is transcriptionally repressed or regulated by the Notch signaling pathway, plays a crucial role in maintaining the undifferentiated state of pancreatic progenitor cells and has been associated with the suppression of differentiation and promotion of tumorigenesis in PDAC [37]. PDX1, another key transcription factor, is essential for the development of the pancreas and the differentiation of pancreatic progenitor cells into insulin-producing beta cells [38]. The dysregulation of PDX1 has been linked to the development of PDAC, particularly in the context of hyperinsulinemia and insulin resistance, which are recognized risk factors for pancreatic cancer [38]. INS, the gene encoding insulin, has also been implicated in the pathogenesis of PDAC, where aberrant insulin signaling and hyperinsulinemia are thought to contribute to the metabolic alterations that support tumor growth and survival [39].
While significant progress has been made in understanding the molecular mechanisms underlying PDAC, the identification of reliable biomarkers for early detection and prognosis remains a critical unmet need.
In our study, we comprehensively assessed the mRNA expression profiles of stem cell- and progenitor-cell-associated genes in peripheral-blood mononuclear cells from patients with different clinical stages of pancreatic malignancies (PDAC and PNET). By analyzing these profiles, we aimed to identify potential biomarkers or biomarker combinations that could facilitate the noninvasive diagnosis, prognosis, and monitoring of pancreatic cancer.

2. Materials and Methods

2.1. Patients and Study Design

Blood was collected from the forearm veins of patients hospitalized at the Department of Gastroenterology, Pomeranian Medical University (Szczecin, Poland), with pancreatic neoplasms (37 with cancer and 12 with neuroendocrine tumors) in different clinical stages (14 with locally advanced cancer, 23 with metastatic cancer, and 12 with operative neuroendocrine tumors) and from 34 healthy controls. The diagnosis of pancreatic neoplastic disease was confirmed with EUS-guided biopsy, and in every patient, clinical staging was assessed with abdominal computed tomography and chest X-ray. The full blood count, CRP, and Ca 19-9 were measured using standard hospital laboratory tests. The study was approved by the Bioethics Committee of Pomeranian Medical University kB-0012/43/12 (date of approval 19 May 2015). Written informed consent was obtained from all patients.

2.2. Assessment of mRNA in Peripheral Blood

Peripheral-blood samples (~20 mL) were collected from forearm veins. Red blood cells were removed from the PB samples via 1X hypotonic lysis solution BD Pharm Lyse Buffer, (BD Bioscience Pharmingen, Franklin Lakes, NJ, USA). Total nucleated cells were washed with Dulbecco’s phosphate-buffered saline (DPBS, w/o Ca2+ and Mg2+; HyClone, (GE Healthcare Life Sciences, Chicago, IL, USA) and immediately stored in RNAlater® solution (Invitrogen, Carlsbad, CA, USA at –80 °C until genetic analysis. Total RNA was isolated from lysed peripheral blood with an RNeasy Kit (Qiagen, Hilden, Germany. The RNA was reverse-transcribed with a first-strand cDNA synthesis kit and oligo-dT primers (Thermo Fisher, Waltham, MA, USA). The mRNA expression of 6 stem cell and pancreatic progenitor genes, POU5F1 (POU class 5 homeobox 1), NANOG, CK19 (keratin 19), HES1 (hes family bHLH transcription factor 1), INS (insulin), and PDX1 (pancreatic and duodenal homeobox 1), was assessed via real-time quantitative PCR on an ABI 7500 Fast (Applied Biosystems, Foster City, CA, USA). The real-time conditions were as follows: 95 °C (15 s), 40 cycles at 95 °C (15 s), and 60 °C (1 min). Melting curves were generated after each reaction to verify the melting temperature of the amplicon and only one PCR product was amplified under these conditions. In order to ensure the consistency of the qPCR measurements each sample was analyzed in two technical replicates, and mean Ct values were used for further analysis. The mRNA expression of all the genes investigated was normalized to that of the nonregulated reference housekeeping gene b-2 microglobulin (B2M). The data are presented as absolute expression values via the 2ˆdCt formula. The primers (Oligo.pl, IBB, Warsaw, Poland) used were as follows: Oct-4 (forward) 5′-CCCCTGGTGCCGTGAA-3′, (reverse) 5′-GCAAATTGCTCGAGTTCTTTCTG-3′; Nanog (forward) 5′-GCAGAAGGCCTCAGCACCTA-3′, (reverse) 5′-AGGTTCCCAGTCGGGTTCA-3′; CK19 (forward), (reverse); HES1 (forward) 5′-GCCGCGAGCTATCTTTCTTCA-3′, (reverse) 5′-ACACGACACCGGATAAACCAA-3′; INS (forward) 5′-GCAGCCTTTGTGAACCAACA-3′, (reverse) 5′-TTCCCCGCACACTAGGTAGAGA-3′; and PDX1 (forward) 5′-AACCGCGTCCAGCTGCCTTTC-3′, (reverse) 5′-CCGCTTGTTCTCCTCCGGCTC-3′.

2.3. Statistical Analysis

Since most quantitative variables, including mRNA expression, showed distributions significantly different from a normal distribution, they are presented as medians with interquartile ranges (Q1–Q3), and nonparametric tests were used: the Mann–Whitney U test for comparisons between groups and the Spearman rank correlation rank coefficient (Rs) for correlations within groups. Multivariable analysis comparing PDAC group with controls after adjustment for age and sex (with age, sex and clinical phenotype, i.e., PDAC vs. Controls as independent variables) was performed using general linear model (GLM) with effect size presented as standardized beta coefficient (β). Multivariable stepwise logistic regression with forward selection was applied to find independent markers of PDAC (PDAC vs. Control) in a set of variables containing 6 studied gene-expression levels, CRP, and Ca 19-9 serum concentrations. Gene expressions and CRP or Ca 19-9 concentrations were log-transformed before inclusion into the multivariable analyses to normalize their distributions. Odds ratio (OR) values obtained from logistic regression after such a transformation should be interpreted as an increase in odds for PDAC diagnosis per 2.72 times (natural logarithm base) increase in the corresponding marker expression or concentration. Associations with p < 0.05 were considered statistically significant. The statistical power of the study with 37 PDAC patients, 12 PNETs patients, and 34 healthy controls was sufficient to detect with 80% probability true differences between groups corresponding to ±0.68 standard deviations of the studied parameters for a comparison of PDAC vs. controls, and ±0.97 standard deviations of the studied parameters for a comparison of PNETs vs. controls.

3. Results

3.1. Patient Characteristics

We compared basic clinical data, including age, height, weight, BMI, and biochemical features, such as white blood count and platelets (PLT), erythrocytes (ERY), CRP, and Ca 19-9 counts, between patients with pancreatic cancer and neuroendocrine tumors and healthy controls. Our analysis revealed significantly greater leukocyte counts, CRP and Ca 19-9 levels in PDAC patients and lower weights, BMIs, and erythrocyte counts than in healthy controls. The PNETS patients were significantly younger than the healthy controls were. Table 1 presents the baseline characteristics of all included patients.

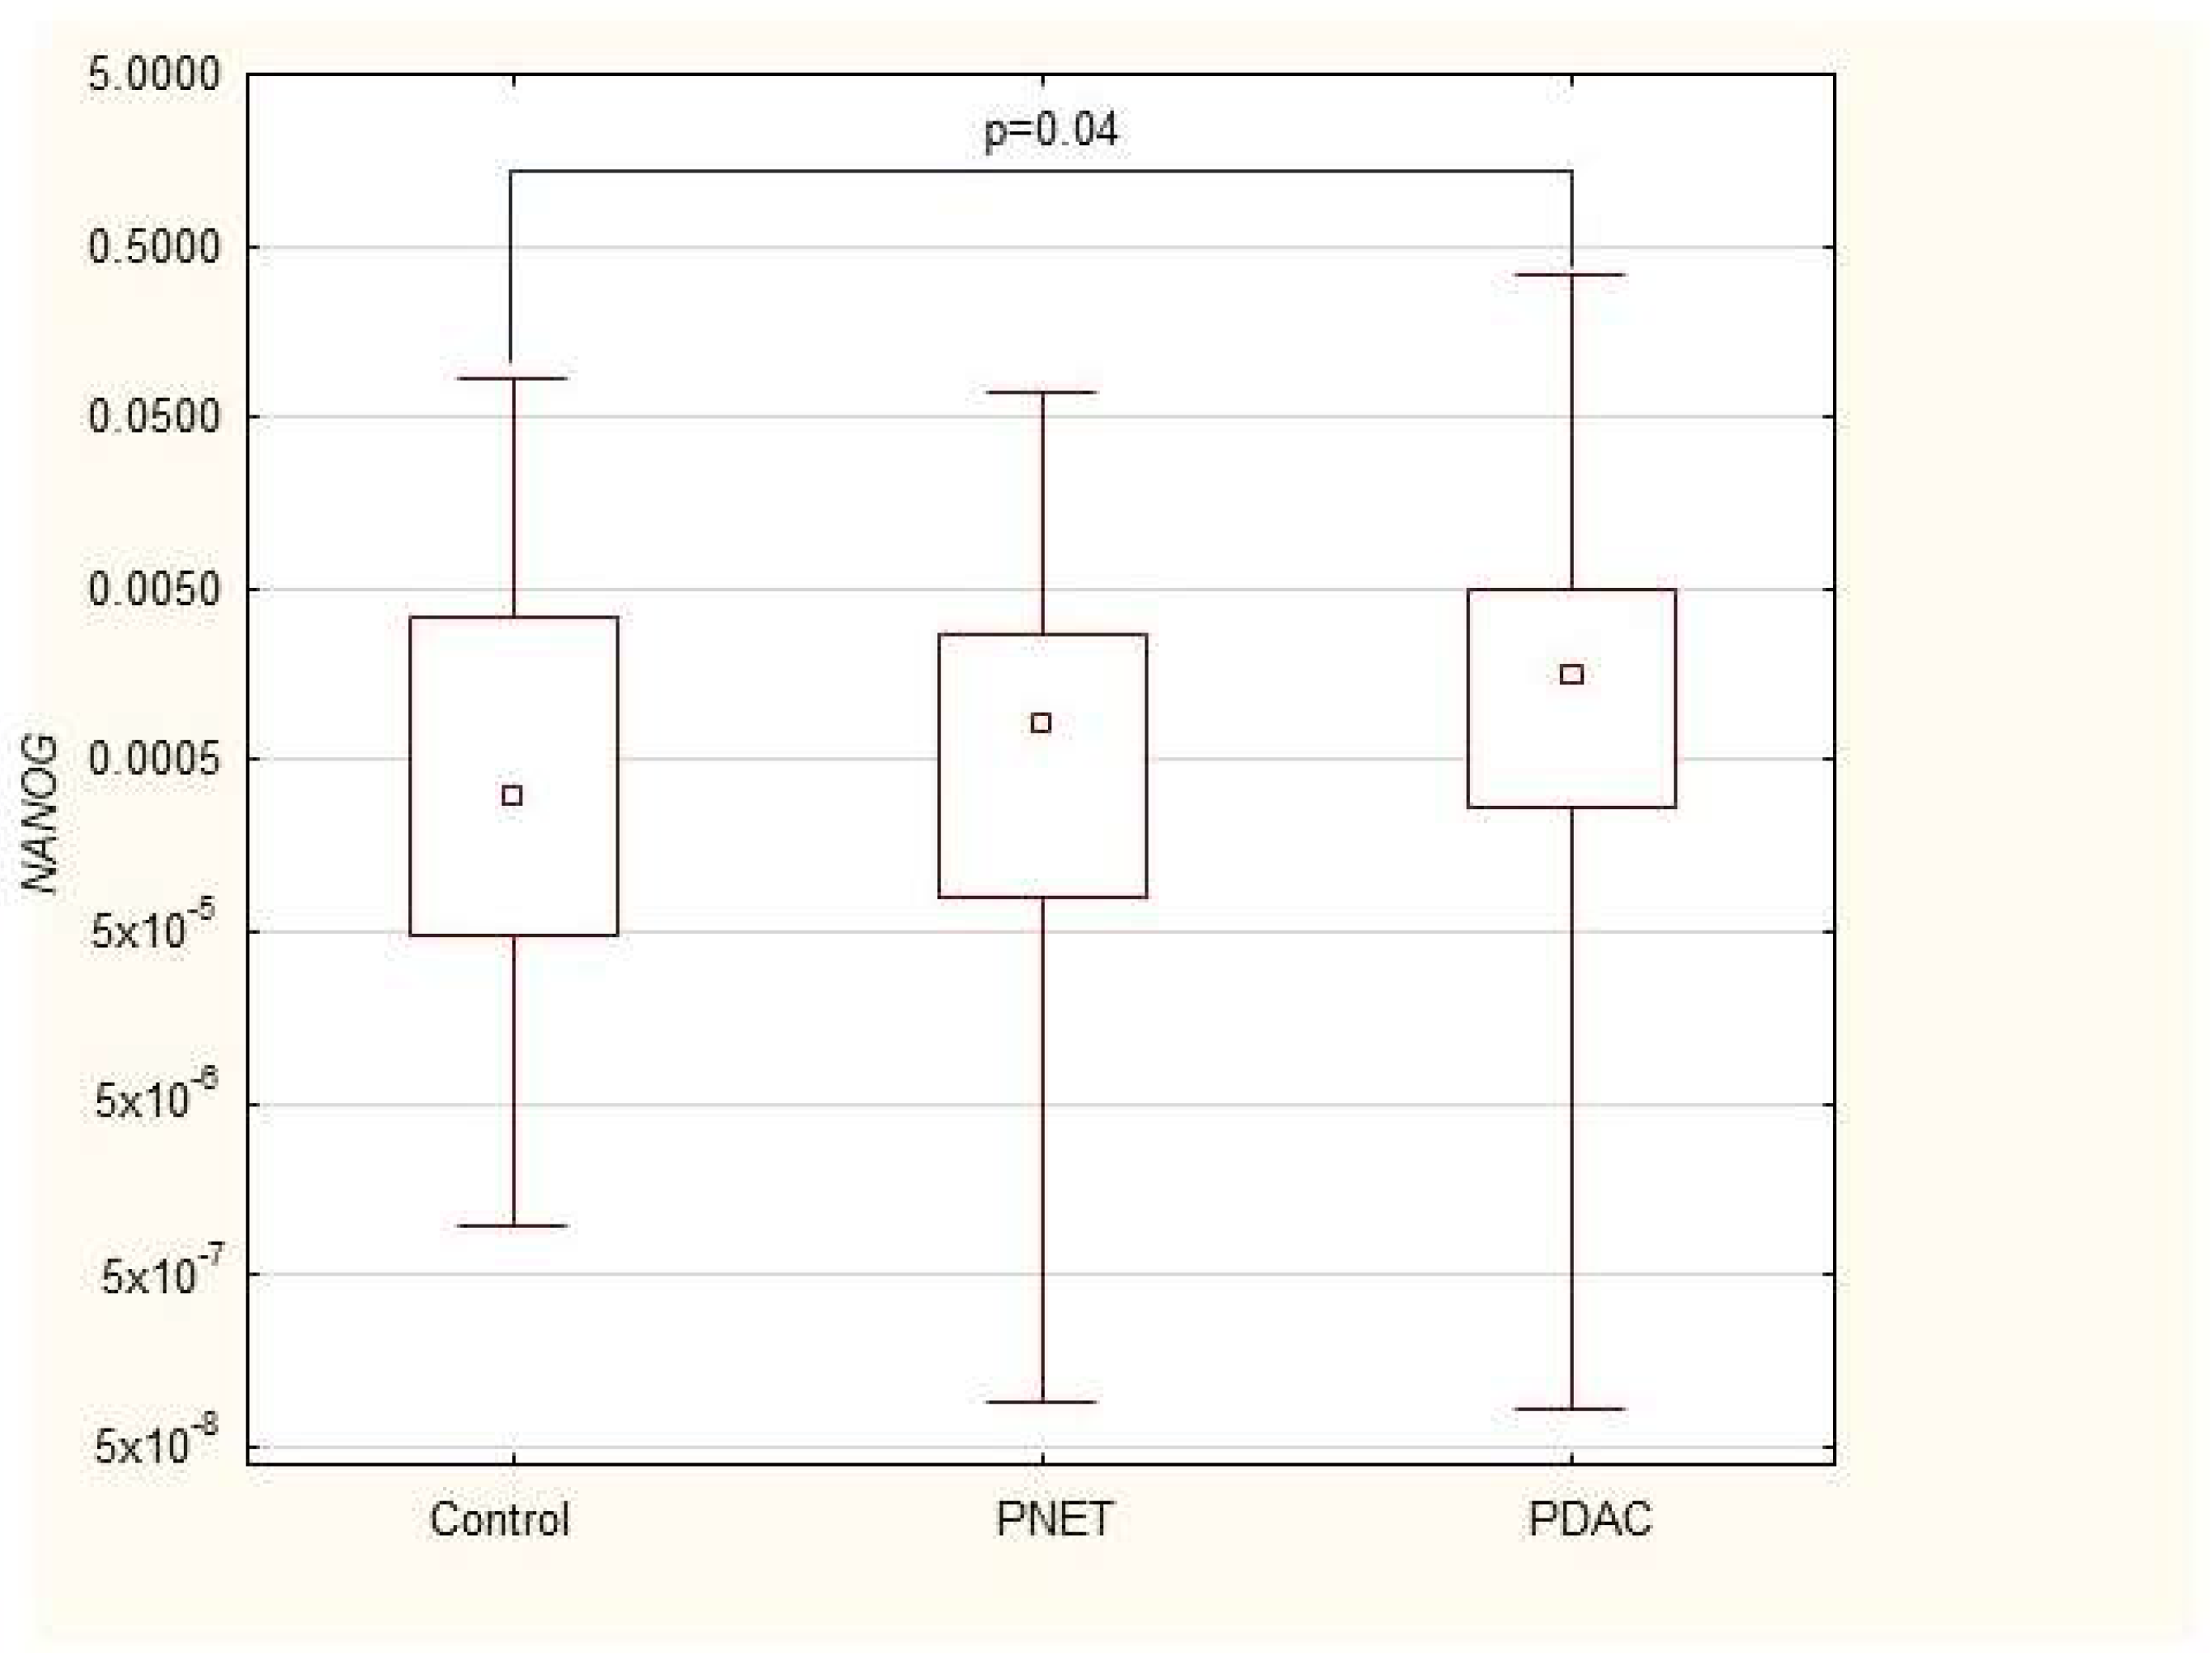
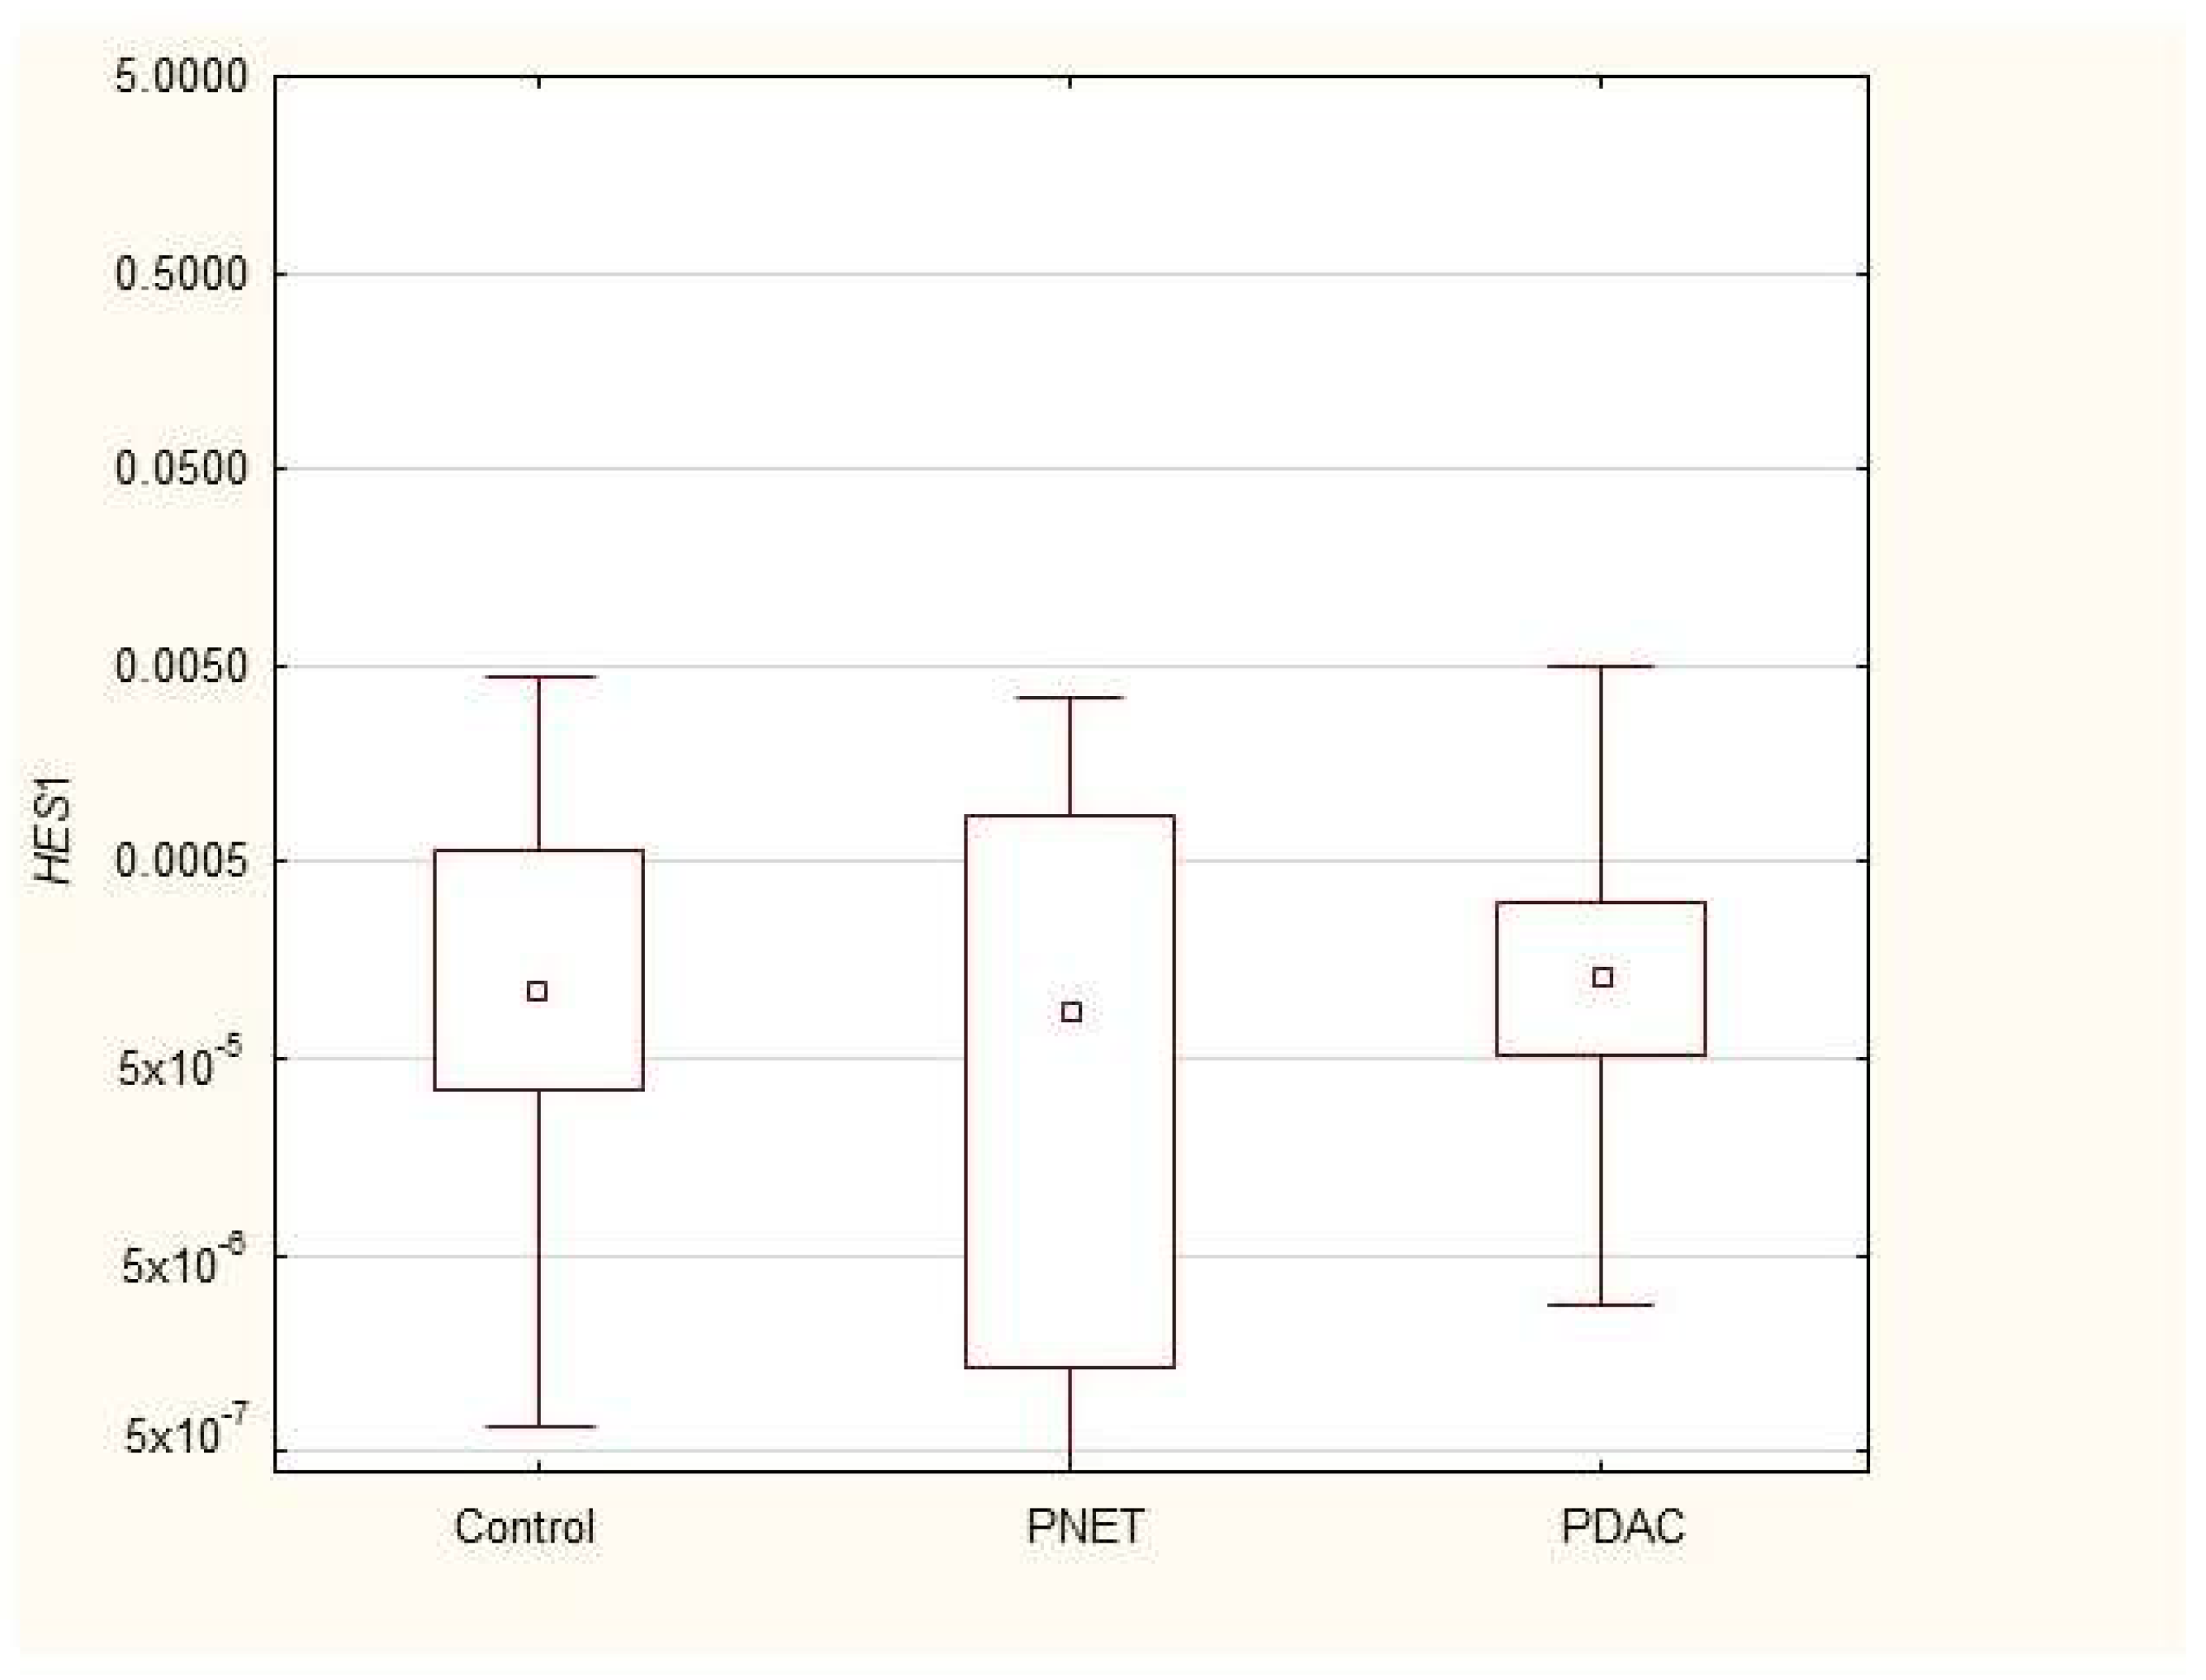
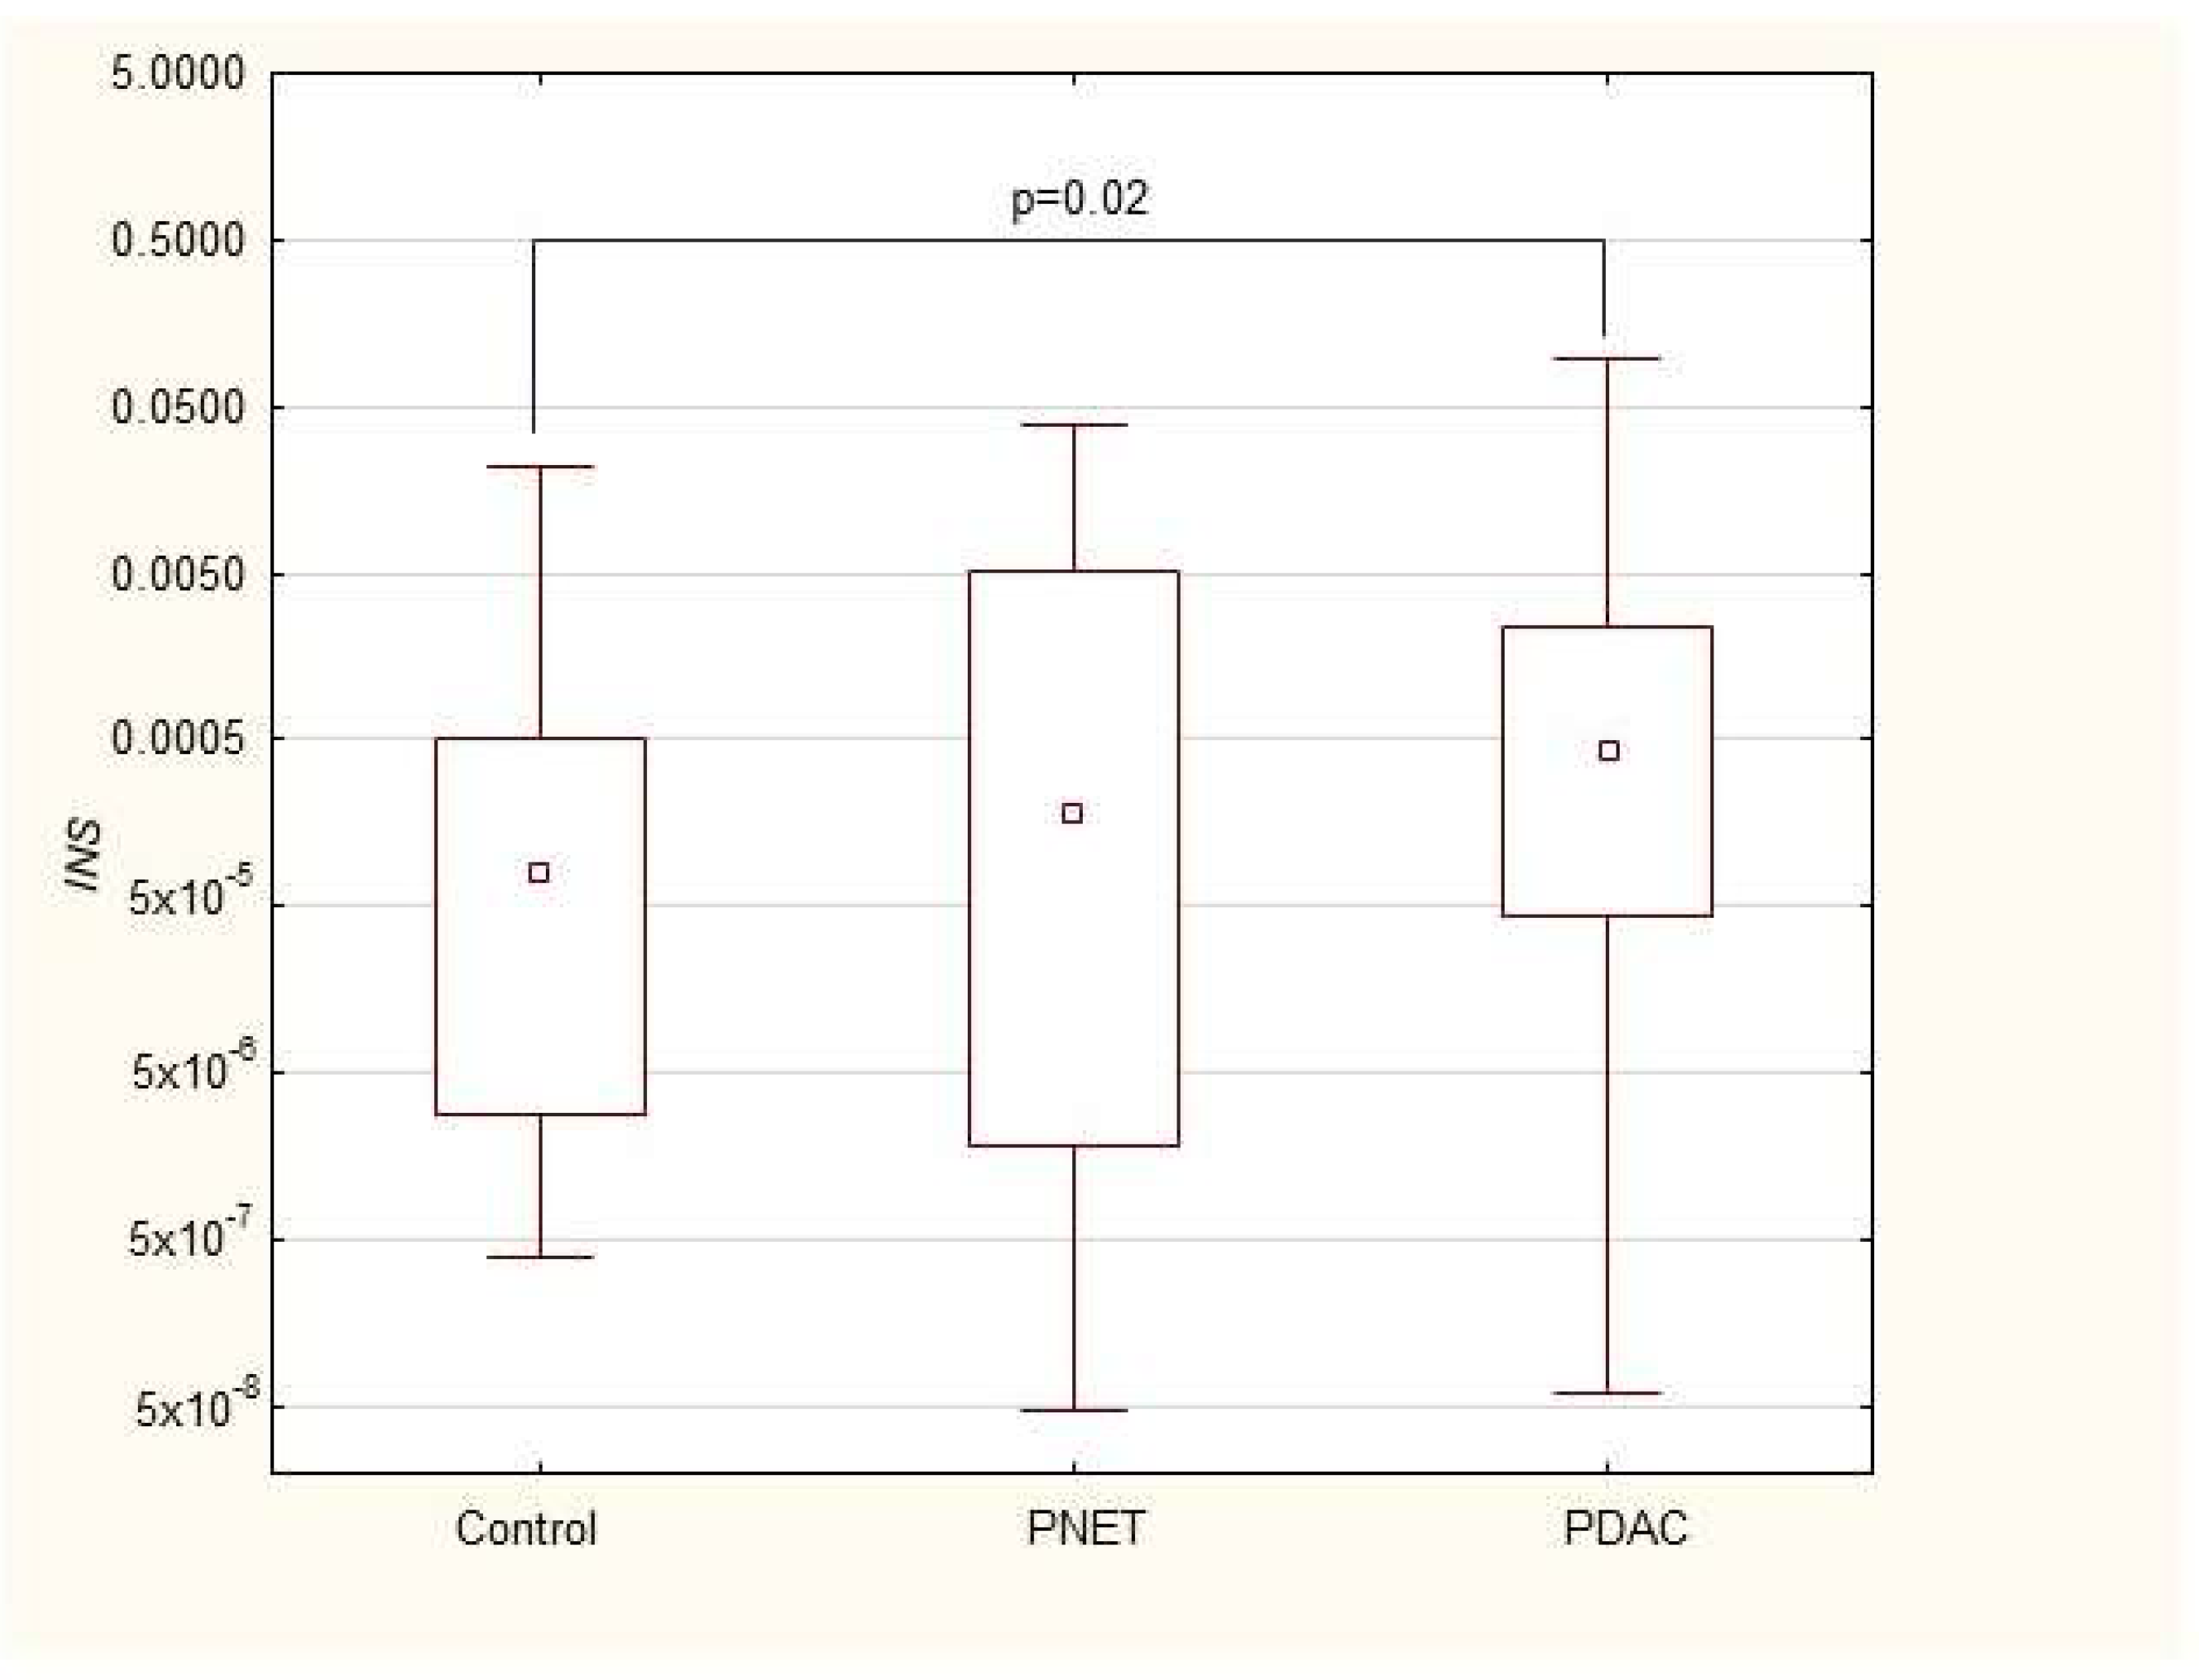
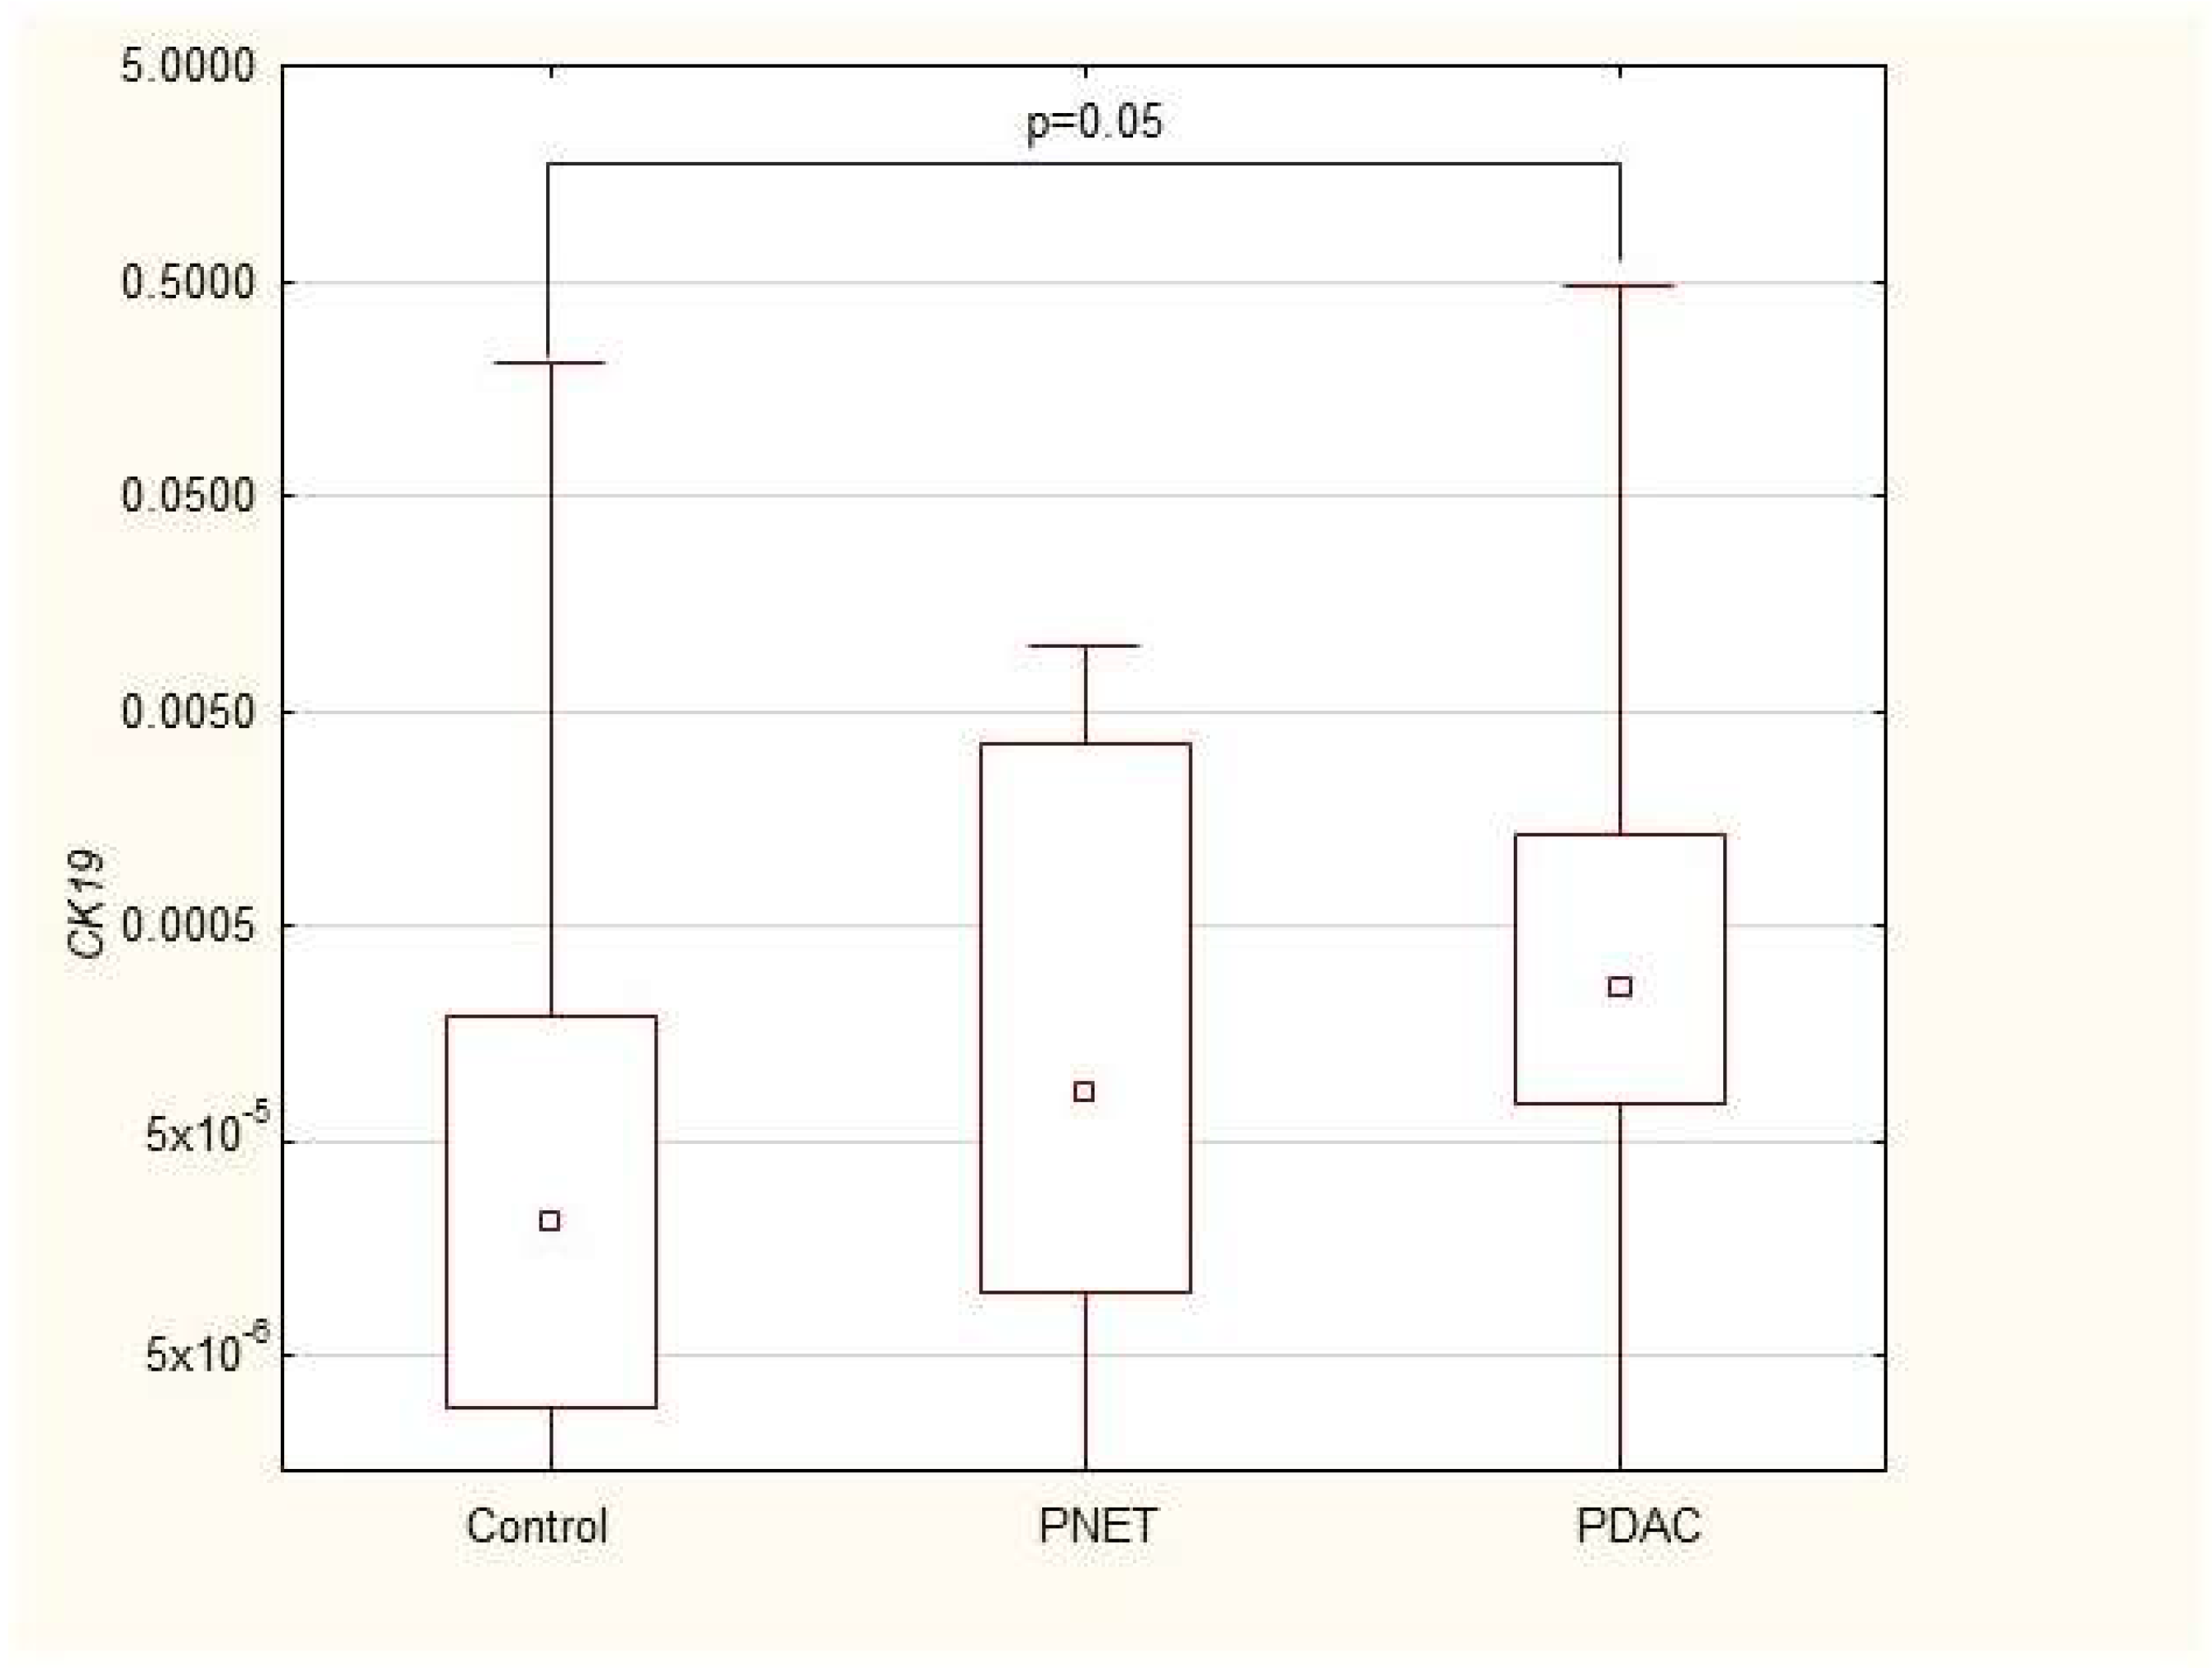
3.2. Expression of mRNAs Encoding Stem-Cell and Progenitor Pancreatic Genes in PB Patients with Pancreatic Neoplastic Disorders

We found that the expression of genes characteristic of early stem cells, NANOG (p = 0.03), and the expression of genes encoding insulin and cytokeratin 19 (INS p = 0.02, CK19 p = 0.005) were increased in pancreatic cancer patients. However, it was not significantly different under other neoplastic (neuroendocrine) conditions. Multivariable GLM analysis adjusted for patient age and sex, comparing the PDAC group with controls, showed that the association of PDAC with a higher expression of CK19 (β = +0.27, p = 0.024) and INS (β = +0.23, p = 0.048) remained significant, while for NANOG (β = +0.20, p = 0.093) the association lost significance. No significant collinearity was found between the independent variables (age, sex, and clinical phenotype) in the GLMs. There were no significant differences in genetic expression between patients with different stages of pancreatic cancer (locally advanced and metastatic). Figure 1, Figure 2, Figure 3, Figure 4, Figure 5 and Figure 6 and Table 2 present the expression of genes associated with neoplastic disorders. The gene-expression data and basic clinical characteristics of patients with locally advanced and metastatic pancreatic cancer are presented in Table 3.

3.3. Correlations

In pancreatic cancer patients; statistical analysis revealed no significant correlations between the expression of genes and clinical (height; weight; BMI) or biochemical data (WBC; ERY; PLT; CRP; and Ca 19-9); apart from CK19 overexpression; which was correlated with inflammatory markers (both CRP (Rs = +0.34; p = 0.04) and WBC (Rs = +0.51; p = 0.001) in patients with pancreatic cancer.
In neuroendocrine tumor patients, statistical analysis revealed no significant correlations between the expression of genes and clinical or biochemical data, with the exception of a positive correlation between HES1 gene expression and WBCs (Rs = +0.77, p = 0.003). The correlations between mRNA gene expression and clinical and biochemical patient characteristics are presented in Supplementary Tables S1 and S2.

3.4. Multivariable Analysis of PDAC Markers

Multivariable logistic regression was applied to find independent markers of PDAC among the PBMC expression of studied genes, serum CRP as standard inflammation marker and serum Ca 19-9 as current standard PDAC marker (all log-transformed). When only gene expression values were analyzed, high CK19 was the best marker of PDAC (OR = 1.19, 95%CI: 1.03–1.39 per 2.72-times increase, p = 0.018), and no other gene expression significantly improved the estimation when added to the logistic regression model. When CRP was included, its high concentration proved the best marker of PDAC, and NANOG expression was the only gene expression which significantly improved the estimation when added to the model (OR = 2.71, 95%CI: 1.56–4.70, p = 0.00032 for CRP and OR = 1.25, 95%CI: 1.01–1.56, p = 0.040 for NANOG in the two-variable model). The loss of significance of CK19 as PDAC marker in this model may be attributed to collinearity between CRP and CK19 (significant positive correlation described above). Finally, when Ca 19-9 was included, it proved the best marker of PDAC (OR = 3.12, 95%CI: 1.80–5.41, p = 0.000036), and neither CRP nor any gene expression significantly improved the estimation when added to the model.

4. Discussion

Pancreatic cancer continues to be one of the most significant challenges in oncology, with PDAC exhibiting a particularly dismal prognosis due to late-stage diagnosis, resistance to chemotherapy, and a lack of effective biomarkers for early detection. The five-year survival rate remains below 5%, underscoring the urgent need for novel molecular markers that could improve early diagnosis, facilitate risk stratification, and enhance therapeutic decision-making [40].
In this study, we conducted a comprehensive analysis of mRNA expression levels of key progenitor- and stem-cell-associated genes in the peripheral blood of patients with pancreatic neoplastic disorders, including PDAC and PNETs. Our findings revealed a significant overexpression of NANOG, CK19 and INS mRNA in the serum of PDAC patients compared to healthy controls, independent of disease stage. In contrast, this pattern was not observed in patients with PNETs, where expression levels of these genes were notably lower.
To our knowledge, no prior studies have investigated the expression of these genes in the serum of patients with PNETs. The observed discrepancies between PDAC and PNETs may be attributed to fundamental biological differences between these malignancies. While PDAC arises from exocrine part of the gland, PNETs originate from neuroendocrine cells of the diffuse endocrine system. The clinical behavior of PNETs is highly heterogenous, ranging from indolent, slow-growing tumors to aggressive subtypes associated with poor outcomes. Furthermore, PNETs are often diagnosed at a younger age and earlier stage than PDAC, with functional PNETs frequently presenting with hormone-related symptoms, as seen in insulinomas or gastrinomas. These biological and clinical distinctions may underlie the differential mRNA expression patterns observed in our study.
The overexpression of stem-cell markers in PDAC patients aligns with our previous findings of increased circulating stem cells in the peripheral blood of patients with pancreatic cancer [27]. NANOG is a gene that controls stem-cell pluripotency, and has been implicated in tumor progression, metastatic potential, and poor prognosis in PDAC [41]. However, in our study, no significant difference in NANOG expression was observed between patients with locally advanced and metastatic disease. This may be explained by the fact that both metastatic and inoperable locally advanced PDAC cases are associated with extensive tumor angiogenesis and the presence of circulating tumor cells.
The stage of pancreatic cancer can significantly influence mRNA expression profiles in PBMCs due to factors such as tumor burden, immune-response alterations, and systemic inflammation [42]. As the pancreatic cancer, it can modulate the immune responses, further affecting PBMC gene expression [42]. Moreover, late-stage PDAC is often characterized by hypoxia and cellular reprogramming, where hypoxia-inducible factors may alter PBMC mRNA expression [43]. Furthermore, tumors at advanced stages release increased amounts of exosomes, microRNAs, and other soluble mediators that can modify PBMC function and transcriptional activity. The elevated levels of cytokines such as IL-6, TNF-α, and TGF-β in later-stage PDAC further contribute to immune dysregulation, potentially affecting PBMC gene expression and promoting an immunosuppressive microenvironment [44]. These complex interactions between tumor progression, immune modulation, and systemic inflammation also explain the observed overexpression of NANOG in PDAC. Our previous observations, along with murine studies, suggest a crucial role of mobilized bone marrow-derived stem cells in supporting the growth metastasis [26,45]. The specificity of NANOG as a potential biomarker is further reinforced by its absence in patients with PNETs in our study. This distinction highlights its potential diagnostic use in differentiating PDAC from other pancreatic neoplasms. Furthermore, these findings build upon our earlier research, which showed the critical involvement of pluripotent stem cell in the pathogenesis of pancreatic cancer [27,46].
CK19 is a type of filament protein expressed in the epithelium of the gastrointestinal tract and is commonly associated with tumors of epithelial origin, including circulating tumor cells in the bloodstream [16]. Its expression has been observed in various types of cancers, including breast, lung, PDAC, and pancreatic neuroendocrine tumors [17,18,19]. CK19 has been consistently associated with poor prognosis, tumor progression, and metastatic development [16]. In our study, we observed that CK19 mRNA expression was elevated exclusively in the serum of pancreatic cancer patients and was positively correlated with systemic inflammation, as indicated by increased WBC and CRP levels, two commonly used clinical inflammatory markers. These findings align with the existing literature highlighting that higher CRP concentrations correlate with reduced survival rates in PDAC patients [47,48]. Similarly, increased WBC counts have been linked to tumor progression and reduced survival rates in pancreatic cancer patients [49,50,51]. Moreover, multivariable GLM analysis revealed that CK19 expression showed the strongest association with PDAC among the studied markers. However, it was also most closely correlated with CRP. Including CRP in the logistic regression model diminished the predictive value of CK19 for PDAC, suggesting that CK19 expression largely reflects inflammation severity. Interestingly, adding NANOG expression to CRP in the model enhanced PDAC prediction, possibly indicating that elevated NANOG expression reflects additional, non-inflammatory mechanisms in PDAC pathology.
The correlation between inflammation, the exosome-mediated signaling, and stem-cell expression was previously demonstrated in PDAC [27,52]. In this group of patients, complement cascade elements (C3a and C5a) play a pivotal role in stem-cell trafficking to the peripheral-blood components [17] and modulate the inflammatory environment of PDAC. They reinforce immune-cell recruitment and stimulate cytokine release, altering the distribution of CK19-positive tumor cells as circulating tumor cells [53]. This interaction highlights CK19’s dual role as both a marker of epithelial tumors and a component of inflammation-driven tumor progression in PDAC. Moreover, chronic inflammation, a hallmark of PDAC, leads to widespread immune activation, which extends beyond the tumor microenvironment to circulating immune cells, including PBMCs. Inflammatory cytokines and tumor-derived mediators released into the bloodstream interact with PBMCs, triggering intracellular signaling pathways that upregulate CK19, NANOG, and INS genes [52]. A key pathway implicated in this process is the PI3K-Akt signaling cascade, which is frequently activated in cancer. It is crucial in cellular processes’ regulation such as metabolism, growth, and survival. It ultimately leads to alterations in gene-expression patterns in PBMCs [54]. The phosphorylation-mediated inactivation of transcription factors such as FOXO1 may thus represent a mechanistic link between systemic inflammation and the upregulation of CK19 in circulation immune cells, further reinforcing its role in PDAC pathogenesis.
Additionally, cytokines such as IL-6, IL-1β, and TNF-α, play important roles in cancer initiation, growth, and metastasis development [55,56]. IL-6, for instance, activates the JAK/SSTAT3 signaling pathway, which is critical for promoting CK19 transcription and sustaining tumor-cell proliferation and invasiveness [57]. IL-6 is also known to increase CRP levels, directly linking CK19 expression with systemic inflammatory markers such as the WBC count and CRP level [58]. The desmoplastic PDAC microenvironment is complex, and the interplay between its components, including inflammatory elements, determines cancer progression [10]. In addition, TNF-α and IL-1β activate the NF-κB pathway, a master regulator of inflammation and oncogenesis in PDAC, further increasing CK19 expression. The persistent activation of NF-κB in the PDAC microenvironment results in a feedback loop that amplifies cytokine secretion, driving both tumor progression and the inflammatory response [59]. Moreover, carcinogenesis shares some similarities with the process of inflammation, and inflammation may trigger cancer development [46,60]. This is also observed clinically, including in chronic atrophic gastritis, ulcerative colitis, and chronic pancreatitis, which eventually lead to gastric cancer, colon cancer, and pancreatic cancer, respectively [60,61].
In contrast to previous studies, in which CK19 expression has been identified as a marker of poor prognosis in PNETs, particularly in advanced or metastatic cases, our study did not observe significant CK19 expression in patients with PNETs [57]. This may be explained by the characteristics of the patient population included in this study, which consisted primarily of individuals with early-stage, nonmetastatic PNETs. It is possible that CK19 expression becomes more prominent in more aggressive or advanced disease stages and thus may not be relevant in early tumor presentation. Furthermore, when PNETs are compared with PDAC, CK19 expression patterns may differ, as PDAC often presents at more advanced stages where poor prognostic markers such as CK19 are more prevalent. These findings suggest that CK19 may be more useful as a prognostic biomarker in late-stage PNETs or PDAC patients than in early, localized PNET patients.
INS is a fundamental gene involved in glucose metabolism, and its dysregulation has been implicated in the pathogenesis of several cancers, including PDAC. In the present study, we observed significantly elevated mRNA levels of INS in PBMCs from patients with PDAC compared to healthy controls. This observation aligns with previous findings that highlight the insulin/IGF signaling axis as frequently dysregulated in PDAC, contributing to both the metabolic reprogramming and stromal remodeling characteristic of this malignancy [62,63,64]. Pancreatic cancer cells secrete exosomes—nano-sized extracellular vesicles encapsulating proteins, lipids, and RNAs that can fuse with PBMCs, delivering their cargo and modulating gene expression. It other studies, it was demonstrated that pancreatic cancer-derived exosomes induce insulin resistance in recipient cells through the PI3/Akt/FOXO1 signaling pathway, highlighting their role in altering cellular function [65]. Hyperinsulinemia and insulin resistance, common features in PDAC, have been demonstrated to promote tumor growth, progression, and the development of a desmoplastic stroma [31,32,39]. The stromal microenvironment actively supports tumor progression through complex interactions between tumor and stromal cells via paracrine signaling pathways involving insulin and IGF-1 receptors. Similarly to the CK19 and NANOG, the elevated expression of INS mRNA in PBMCs was statistically significant, but the relative differences between PDAC patients and controls was modest, and the data demonstrated considerable inter-individual variability. This variability highlights the challenges of using PBMC-derived biomarkers in the context of PDAC and suggest that, although INS mRNA expression may reflect systemic metabolic changes associated with the disease, it cannot be entirely linked to tumor-specific gene expression in this study. This is in line with previous reports that have shown systemic dysregulation of the insulin/IGF pathway in PDAC, which may not directly mirror the gene-expression profiles within the tumor itself [66]. Instead, these alterations represent a systemic response to tumor-induced metabolic shifts and stromal activation, both of which contribute to the pro-tumorigenic microenvironment.
The tissue degeneration process, involving the replacement of the pancreatic parenchyma with fibrosis or the development of edema or necrosis, followed by the onset of endocrine and exocrine gland insufficiency, forms the core of pancreatitis. Unsurprisingly, disturbances in the expression of genes involved in pancreatic development, such as HES1 and PDX1, were observed in our study. These genes belong to the family of transcriptional activators. PDX1 plays crucial roles in maintaining B-cell mass, function, and identity, which are essential for the expression of insulin, somatostatin, glucokinase, islet amyloid polypeptide, and glucose transporter type 2 [67]. Its defects are responsible for pancreatic agenesis and the development of diabetes (maturity-onset diabetes of the young type 4-MODY4) [68,69]. The exact role of the HES1 protein in the adult pancreas has yet to be determined. It is expressed in the duct and centroacinar cells in the gland and is involved in the differentiation of ductal and acinar cells under normal and inflammatory conditions [37].
A key challenge in pancreatic cancer research is differentiating tumor-driven inflammation from systemic inflammatory responses associated with benign pancreatic disorders, such as acute and chronic pancreatitis. While our study demonstrates a strong correlation between CK19, NANOG, and INS mRNA expression and systemic inflammatory markers, it remains unclear whether these alterations are exclusive to PDAC or reflect a broader inflammation-associated gene-expression changes. Further studies will provide critical insights into their effectiveness to discriminate malignancy from inflammation-associated gene-expression changes.
The limitation of our study is the lack of heterogeneity among cancer patients, as only those with advanced-stage disease (metastatic or locally advanced disease) were included. Furthermore, we acknowledge the presence of considerable inter-individual variability and small differences in the analysis results. While these variations pose challenges in biomarker standardization, they also highlight the complexity of pancreatic tumor biology and underline the need for larger, prospective studies to validate these findings.
Furthermore, the identification of stage-specific biomarkers and their integration with established markers, such as Ca 19-9, may enhance the sensitivity and specificity of early pancreatic cancer detection. Given the limitations of Ca 19-9, including its elevation in benign inflammatory conditions and its low sensitivity for early-stage PDAC, incorporating mRNA expression patterns of CK19, NANOG, and INS into a multi-marker panel could improve diagnostic accuracy. Future studies should focus on determining whether the expression of these genes differs between localized and metastatic disease, thereby identifying potential markers that emerge at the earliest stages of malignancy. Moreover, longitudinal analyses of mRNA expression before and after treatment could help assess if changes in these markers correlate with therapeutic response, disease progression, or recurrence risk. Prospective trials focusing on mRNA expression in high-risk populations, such as individuals with hereditary predispositions or long-standing chronic pancreatitis, may further elucidate the clinical use of those biomarkers for early detection.
The absence of long-term survival data in our study represents another limitation. Evaluating how these gene-expression patterns correlate with clinical characteristics, including disease progression, would provide a better understanding of their prognostic significance. Moreover, the absence of publicly available dataset containing expression profiles of the genes analyzed in this study within an independent cohort of PDAC or PNET patients, further underscores the need for external validation. Establishing a well-characterized validation cohort is crucial for validation of our findings and ensuring the clinical application.
Despite these limitations, our study is the first to comprehensively assess the mRNA expression of stem cells and progenitor genes across a spectrum of neoplastic pancreatic disorders. These findings provide a strong foundation for future research aimed to focus on molecular diagnostic and prognostic tools in pancreatic cancer, ultimately improving early detection and risk stratification.

5. Conclusions

The mRNA expression of selected stem and progenitor genes (NANOG, INS, CK19) in peripheral-blood mononuclear cells has potential as a valuable marker for pancreatic cancer, with a notable correlation with coexisting inflammation. These findings underscore the importance of studying mRNA expression in peripheral blood to enhance our understanding of pancreatic neoplasms. This approach may contribute to improving detection and enabling more personalized, non-invasive strategies for managing these aggressive diseases.

Supplementary Materials

The following supporting information can be downloaded at: https://www.mdpi.com/article/10.3390/cimb47040236/s1.

Author Contributions

Conceptualization, K.D., M.T., K.S., M.D. and T.S.; Methodology, M.T., K.D. and K.S.; Software, K.S.; Data Curation, K.D., A.K. and K.P.; Writing—Original Draft Preparation, K.D., M.D., A.K., K.P. and T.S.; Writing—Review and Editing, K.D., M.T., K.S. and M.D.; Visualization, K.S. and M.T.; Supervision, T.S. All authors have read and agreed to the published version of the manuscript.

Funding

This work was funded by Pomeranian Medical University in Szczecin, WFB-409/S/2023.

Institutional Review Board Statement

The study was conducted in accordance with the Declaration of Helsinki, and approved by the Pomeranian Medical University Bioethics Committee (protocol code kB-0012/32/14, dated 17 March 2014).

Informed Consent Statement

Informed consent was obtained from all subjects involved in the study.

Data Availability Statement

The original data presented in the study are openly available in FigShare repository at https://doi.org/10.6084/m9.figshare.27921831.v1 accessed on 25 March 2025.

Conflicts of Interest

The authors declare that they have no conflicts of interest.

References

  1. Kleeff, J.; Korc, M.; Apte, M.; La Vecchia, C.; Johnson, C.D.; Biankin, A.V.; Neale, R.E.; Tempero, M.; Tuveson, D.A.; Hruban, R.H.; et al. Pancreatic cancer. Nat. Rev. Dis. Primers 2016, 2, 16022. [Google Scholar] [CrossRef] [PubMed]
  2. Bailey, P.; Chang, D.K.; Nones, K.; Johns, A.L.; Patch, A.M.; Gingras, M.C.; Miller, D.K.; Christ, A.N.; Bruxner, T.J.; Quinn, M.C.; et al. Genomic analyses identify molecular subtypes of pancreatic cancer. Nature 2016, 531, 47–52. [Google Scholar] [CrossRef] [PubMed]
  3. Ho, W.J.; Jaffee, E.M.; Zheng, L. The tumour microenvironment in pancreatic cancer—Clinical challenges and opportunities. Nat. Rev. Clin. Oncol. 2020, 17, 527–540. [Google Scholar] [CrossRef]
  4. Dougan, S.K. The Pancreatic Cancer Microenvironment. Cancer J. 2017, 23, 321–325. [Google Scholar] [CrossRef]
  5. Mercanti, L.; Sindaco, M.; Mazzone, M.; Di Marcantonio, M.C.; Piscione, M.; Muraro, R.; Mincione, G. PDAC, the Influencer Cancer: Cross-Talk with Tumor Microenvironment and Connected Potential Therapy Strategies. Cancers 2023, 15, 2923. [Google Scholar] [CrossRef]
  6. Bulle, A.; Lim, K.H. Beyond just a tight fortress: Contribution of stroma to epithelial-mesenchymal transition in pancreatic cancer. Signal Transduct. Target. Ther. 2020, 5, 249. [Google Scholar] [CrossRef] [PubMed]
  7. Galindo-Vega, A.; Maldonado-Lagunas, V.; Mitre-Aguilar, I.B.; Melendez-Zajgla, J. Tumor Microenvironment Role in Pancreatic Cancer Stem Cells. Cells 2023, 12, 1560. [Google Scholar] [CrossRef]
  8. Kopp, J.L.; von Figura, G.; Mayes, E.; Liu, F.F.; Dubois, C.L.; Morris, J.P.T.; Pan, F.C.; Akiyama, H.; Wright, C.V.; Jensen, K.; et al. Identification of Sox9-dependent acinar-to-ductal reprogramming as the principal mechanism for initiation of pancreatic ductal adenocarcinoma. Cancer Cell 2012, 22, 737–750. [Google Scholar] [CrossRef]
  9. Gidekel Friedlander, S.Y.; Chu, G.C.; Snyder, E.L.; Girnius, N.; Dibelius, G.; Crowley, D.; Vasile, E.; DePinho, R.A.; Jacks, T. Context-dependent transformation of adult pancreatic cells by oncogenic K-Ras. Cancer Cell 2009, 16, 379–389. [Google Scholar] [CrossRef]
  10. Sun, J. Pancreatic neuroendocrine tumors. Intractable Rare Dis. Res. 2017, 6, 21–28. [Google Scholar] [CrossRef]
  11. Ro, C.; Chai, W.; Yu, V.E.; Yu, R. Pancreatic neuroendocrine tumors: Biology, diagnosis, and treatment. Chin. J. Cancer 2013, 32, 312–324. [Google Scholar] [CrossRef] [PubMed]
  12. Dumlu, E.G.; Karakoç, D.; Özdemir, A. Nonfunctional Pancreatic Neuroendocrine Tumors: Advances in Diagnosis, Management, and Controversies. Int. Surg. 2015, 100, 1089–1097. [Google Scholar] [CrossRef] [PubMed]
  13. Anderson, C.W.; Bennett, J.J. Clinical Presentation and Diagnosis of Pancreatic Neuroendocrine Tumors. Surg. Oncol. Clin. N. Am. 2016, 25, 363–374. [Google Scholar] [CrossRef]
  14. Alexovič, M.; Uličná, C.; Sabo, J.; Davalieva, K. Human peripheral blood mononuclear cells as a valuable source of disease-related biomarkers: Evidence from comparative proteomics studies. Proteom. Clin. Appl. 2024, 18, e2300072. [Google Scholar] [CrossRef]
  15. Vaz, A.P.; Ponnusamy, M.P.; Seshacharyulu, P.; Batra, S.K. A concise review on the current understanding of pancreatic cancer stem cells. J. Cancer Stem Cell Res. 2014, 2, e1004. [Google Scholar] [CrossRef]
  16. MacLean, M.R.; Walker, O.L.; Arun, R.P.; Fernando, W.; Marcato, P. Informed by Cancer Stem Cells of Solid Tumors: Advances in Treatments Targeting Tumor-Promoting Factors and Pathways. Int. J. Mol. Sci. 2024, 25, 4102. [Google Scholar] [CrossRef]
  17. Li, C.; Heidt, D.G.; Dalerba, P.; Burant, C.F.; Zhang, L.; Adsay, V.; Wicha, M.; Clarke, M.F.; Simeone, D.M. Identification of pancreatic cancer stem cells. Cancer Res. 2007, 67, 1030–1037. [Google Scholar] [CrossRef] [PubMed]
  18. La Rosa, S.; Rigoli, E.; Uccella, S.; Novario, R.; Capella, C. Prognostic and biological significance of cytokeratin 19 in pancreatic endocrine tumours. Histopathology 2007, 50, 597–606. [Google Scholar] [CrossRef]
  19. Marui, S.; Nishikawa, Y.; Shiokawa, M.; Yokode, M.; Matsumoto, S.; Muramoto, Y.; Ota, S.; Nakamura, T.; Yoshida, H.; Okada, H.; et al. Context-Dependent Roles of Hes1 in the Adult Pancreas and Pancreatic Tumor Formation. Gastroenterology 2022, 163, 1613–1629.e1612. [Google Scholar] [CrossRef]
  20. Ezeh, U.I.; Turek, P.J.; Reijo, R.A.; Clark, A.T. Human embryonic stem cell genes OCT4, NANOG, STELLAR, and GDF3 are expressed in both seminoma and breast carcinoma. Cancer 2005, 104, 2255–2265. [Google Scholar] [CrossRef]
  21. Wang, D.; Lu, P.; Zhang, H.; Luo, M.; Zhang, X.; Wei, X.; Gao, J.; Zhao, Z.; Liu, C. Oct-4 and Nanog promote the epithelial-mesenchymal transition of breast cancer stem cells and are associated with poor prognosis in breast cancer patients. Oncotarget 2014, 5, 10803–10815. [Google Scholar] [CrossRef] [PubMed]
  22. Yu, B.; Cai, H.; Xu, Z.; Xu, T.; Zou, Q.; Gu, M. Expressions of stem cell transcription factors Nanog and Oct4 in renal cell carcinoma tissues and clinical significance. Artif. Cells Nanomed. Biotechnol. 2016, 44, 1818–1823. [Google Scholar] [CrossRef] [PubMed]
  23. Paterson, C.; Kilmister, E.J.; Brasch, H.D.; Bockett, N.; Patel, J.; Paterson, E.; Purdie, G.; Galvin, S.; Davis, P.F.; Itinteang, T.; et al. Cell Populations Expressing Stemness-Associated Markers in Lung Adenocarcinoma. Life 2021, 11, 1106. [Google Scholar] [CrossRef]
  24. Sodja, E.; Rijavec, M.; Koren, A.; Sadikov, A.; Korošec, P.; Cufer, T. The prognostic value of whole blood SOX2, NANOG and OCT4 mRNA expression in advanced small-cell lung cancer. Radiol. Oncol. 2016, 50, 188–196. [Google Scholar] [CrossRef] [PubMed]
  25. Skubisz, K.; Dąbkowski, K.; Samborowska, E.; Starzyńska, T.; Deskur, A.; Ambrozkiewicz, F.; Karczmarski, J.; Radkiewicz, M.; Kusnierz, K.; Kos-Kudła, B.; et al. Serum Metabolite Biomarkers for Pancreatic Tumors: Neuroendocrine and Pancreatic Ductal Adenocarcinomas-A Preliminary Study. Cancers 2023, 15, 3242. [Google Scholar] [CrossRef]
  26. Dąbkowski, K.; Łabędź-Masłowska, A.; Dołęgowska, B.; Safranow, K.; Budkowska, M.; Zuba-Surma, E.; Starzyńska, T. Evidence of Stem Cells Mobilization in the Blood of Patients with Pancreatitis: A Potential Link with Disease Severity. Stem Cells Int. 2022, 2022, 5395248. [Google Scholar] [CrossRef]
  27. Starzynska, T.; Dabkowski, K.; Blogowski, W.; Zuba-Surma, E.; Budkowska, M.; Salata, D.; Dolegowska, B.; Marlicz, W.; Lubikowski, J.; Ratajczak, M.Z. An intensified systemic trafficking of bone marrow-derived stem/progenitor cells in patients with pancreatic cancer. J. Cell. Mol. Med. 2013, 17, 792–799. [Google Scholar] [CrossRef]
  28. Ballehaninna, U.K.; Chamberlain, R.S. The clinical utility of serum CA 19-9 in the diagnosis, prognosis and management of pancreatic adenocarcinoma: An evidence based appraisal. J. Gastrointest. Oncol. 2012, 3, 105–119. [Google Scholar] [CrossRef]
  29. Amaral, M.J.; Oliveira, R.C.; Donato, P.; Tralhão, J.G. Pancreatic Cancer Biomarkers: Oncogenic Mutations, Tissue and Liquid Biopsies, and Radiomics—A Review. Dig. Dis. Sci. 2023, 68, 2811–2823. [Google Scholar] [CrossRef]
  30. Roy, S.; Dukic, T.; Keepers, Z.; Bhandary, B.; Lamichhane, N.; Molitoris, J.; Ko, Y.H.; Banerjee, A.; Shukla, H.D. SOX2 and OCT4 mediate radiation and drug resistance in pancreatic tumor organoids. Cell Death Discov. 2024, 10, 106. [Google Scholar] [CrossRef]
  31. Zhao, Y.; Qin, C.; Zhao, B.; Wang, Y.; Li, Z.; Li, T.; Yang, X.; Wang, W. Pancreatic cancer stemness: Dynamic status in malignant progression. J. Exp. Clin. Cancer Res. 2023, 42, 122. [Google Scholar] [CrossRef]
  32. Safa, A.R. Epithelial-mesenchymal transition: A hallmark in pancreatic cancer stem cell migration, metastasis formation, and drug resistance. J. Cancer Metastasis Treat. 2020, 6, 36. [Google Scholar] [CrossRef] [PubMed]
  33. Zhang, Q.; Han, Z.; Zhu, Y.; Chen, J.; Li, W. The Role and Specific Mechanism of OCT4 in Cancer Stem Cells: A Review. Int. J. Stem Cells 2020, 13, 312–325. [Google Scholar] [CrossRef] [PubMed]
  34. Menz, A.; Bauer, R.; Kluth, M.; Marie von Bargen, C.; Gorbokon, N.; Viehweger, F.; Lennartz, M.; Völkl, C.; Fraune, C.; Uhlig, R.; et al. Diagnostic and prognostic impact of cytokeratin 19 expression analysis in human tumors: A tissue microarray study of 13,172 tumors. Human. Pathol. 2021, 115, 19–36. [Google Scholar] [CrossRef]
  35. Ferrara, B.; Pignatelli, C.; Cossutta, M.; Citro, A.; Courty, J.; Piemonti, L. The Extracellular Matrix in Pancreatic Cancer: Description of a Complex Network and Promising Therapeutic Options. Cancers 2021, 13, 4442. [Google Scholar] [CrossRef] [PubMed]
  36. Raskov, H.; Gaggar, S.; Tajik, A.; Orhan, A.; Gögenur, I. The Matrix Reloaded-The Role of the Extracellular Matrix in Cancer. Cancers 2023, 15, 2057. [Google Scholar] [CrossRef]
  37. Nishikawa, Y.; Kodama, Y.; Shiokawa, M.; Matsumori, T.; Marui, S.; Kuriyama, K.; Kuwada, T.; Sogabe, Y.; Kakiuchi, N.; Tomono, T.; et al. Hes1 plays an essential role in Kras-driven pancreatic tumorigenesis. Oncogene 2019, 38, 4283–4296. [Google Scholar] [CrossRef]
  38. Oliver-Krasinski, J.M.; Stoffers, D.A. On the origin of the beta cell. Genes. Dev. 2008, 22, 1998–2021. [Google Scholar] [CrossRef]
  39. Zhang, A.M.Y.; Chu, K.H.; Daly, B.F.; Ruiter, T.; Dou, Y.; Yang, J.C.C.; de Winter, T.J.J.; Chhuor, J.; Wang, S.; Flibotte, S.; et al. Effects of hyperinsulinemia on pancreatic cancer development and the immune microenvironment revealed through single-cell transcriptomics. Cancer Metab. 2022, 10, 5. [Google Scholar] [CrossRef]
  40. Dabkowski, K.; Bogacka, B.; Tarnowski, M.; Starzynska, T. Pancreatic cancer microenvironment. Pol. Merkur. Lek. Organ. Pol. Tow. Lek. 2016, 41, 296–302. [Google Scholar]
  41. Gao, S.; Pan, Y.; Song, L.; Dong, L.; Weng, L.I.; Wang, P.; Hua, Y.; Chen, Z.; Liu, L. Nanog Predicts Poor Prognosis in Human Pancreatic Cancer and Is Downregulated by QingyihuaJi Formula in Pancreatic Cancer Stem Cells. Evid. Based Complement. Altern. Med. 2016, 2016, 7028289. [Google Scholar] [CrossRef]
  42. Baine, M.J.; Chakraborty, S.; Smith, L.M.; Mallya, K.; Sasson, A.R.; Brand, R.E.; Batra, S.K. Transcriptional profiling of peripheral blood mononuclear cells in pancreatic cancer patients identifies novel genes with potential diagnostic utility. PLoS ONE 2011, 6, e17014. [Google Scholar] [CrossRef]
  43. Jun, J.C.; Rathore, A.; Younas, H.; Gilkes, D.; Polotsky, V.Y. Hypoxia-Inducible Factors and Cancer. Curr. Sleep. Med. Rep. 2017, 3, 1–10. [Google Scholar] [CrossRef]
  44. Lippitz, B.E.; Harris, R.A. Cytokine patterns in cancer patients: A review of the correlation between interleukin 6 and prognosis. Oncoimmunology 2016, 5, e1093722. [Google Scholar] [CrossRef] [PubMed]
  45. Houghton, J.; Stoicov, C.; Nomura, S.; Rogers, A.B.; Carlson, J.; Li, H.; Cai, X.; Fox, J.G.; Goldenring, J.R.; Wang, T.C. Gastric cancer originating from bone marrow-derived cells. Science 2004, 306, 1568–1571. [Google Scholar] [CrossRef]
  46. Dabkowski, K.; Labedz-Maslowska, A.; Zuba-Surma, E.; Starzynska, T. Role of the bone marrow derived stem cells in pancreatic inflammatory disorders. Pol. Merkur. Lek. Organ Pol. Tow. Lek. 2017, 42, 137–141. [Google Scholar]
  47. Nurmi, A.M.; Mustonen, H.K.; Stenman, U.H.; Seppänen, H.E.; Haglund, C.H. Combining CRP and CA19-9 in a novel prognostic score in pancreatic ductal adenocarcinoma. Sci. Rep. 2021, 11, 781. [Google Scholar] [CrossRef]
  48. Sollie, S.; Michaud, D.S.; Sarker, D.; Karagiannis, S.N.; Josephs, D.H.; Hammar, N.; Santaolalla, A.; Walldius, G.; Garmo, H.; Holmberg, L.; et al. Chronic inflammation markers are associated with risk of pancreatic cancer in the Swedish AMORIS cohort study. BMC Cancer 2019, 19, 858. [Google Scholar] [CrossRef]
  49. Kim, H.J.; Lee, S.Y.; Kim, D.S.; Kang, E.J.; Kim, J.S.; Choi, Y.J.; Oh, S.C.; Seo, J.H.; Kim, J.S. Inflammatory markers as prognostic indicators in pancreatic cancer patients who underwent gemcitabine-based palliative chemotherapy. Korean J. Intern. Med. 2020, 35, 171–184. [Google Scholar] [CrossRef]
  50. Zhou, Q.; Lu, X.; Qian, L.; Yu, C.; Xie, J.; Kong, D. Procalcitonin, C-reactive protein, and white blood cell count levels in end-stage cancer patients: A retrospective study on inflammatory markers and their prognostic value. Medicine 2024, 103, e40792. [Google Scholar] [CrossRef]
  51. Feng, L.; Gu, S.; Wang, P.; Chen, H.; Chen, Z.; Meng, Z.; Liu, L. White Blood Cell and Granulocyte Counts Are Independent Predictive Factors for Prognosis of Advanced Pancreatic Caner. Gastroenterol. Res. Pract. 2018, 2018, 8096234. [Google Scholar] [CrossRef] [PubMed]
  52. Blogowski, W.; Deskur, A.; Budkowska, M.; Sałata, D.; Madej-Michniewicz, A.; Dąbkowski, K.; Dołęgowska, B.; Starzyńska, T. Selected cytokines in patients with pancreatic cancer: A preliminary report. PLoS ONE 2014, 9, e97613. [Google Scholar] [CrossRef]
  53. Hart, P.C.; Rajab, I.M.; Alebraheem, M.; Potempa, L.A. C-Reactive Protein and Cancer-Diagnostic and Therapeutic Insights. Front. Immunol. 2020, 11, 595835. [Google Scholar] [CrossRef]
  54. Li, X.; Gulati, M.; Larson, A.C.; Solheim, J.C.; Jain, M.; Kumar, S.; Batra, S.K. Immune checkpoint blockade in pancreatic cancer: Trudging through the immune desert. Semin. Cancer Biol. 2022, 86 Pt 2, 14–27. [Google Scholar] [CrossRef]
  55. Shadhu, K.; Xi, C. Inflammation and pancreatic cancer: An updated review. Saudi J. Gastroenterol. Off. J. Saudi Gastroenterol. Assoc. 2019, 25, 3–13. [Google Scholar] [CrossRef]
  56. Hausmann, S.; Kong, B.; Michalski, C.; Erkan, M.; Friess, H. The role of inflammation in pancreatic cancer. Adv. Exp. Med. Biol. 2014, 816, 129–151. [Google Scholar] [CrossRef]
  57. Cen, D.; Chen, J.; Li, Z.; Zhao, J.; Cai, X. Prognostic significance of cytokeratin 19 expression in pancreatic neuroendocrine tumor: A meta-analysis. PLoS ONE 2017, 12, e0187588. [Google Scholar] [CrossRef]
  58. Han, X.; Zhao, J.; Ji, Y.; Xu, X.; Lou, W. Expression of CK19 and KIT in resectable pancreatic neuroendocrine tumors. Tumour Biol. 2013, 34, 2881–2889. [Google Scholar] [CrossRef]
  59. Rex, J.; Lutz, A.; Faletti, L.E.; Albrecht, U.; Thomas, M.; Bode, J.G.; Borner, C.; Sawodny, O.; Merfort, I. IL-1β and TNFα Differentially Influence NF-κB Activity and FasL-Induced Apoptosis in Primary Murine Hepatocytes During LPS-Induced Inflammation. Front. Physiol. 2019, 10, 117. [Google Scholar] [CrossRef]
  60. Ling, S.; Feng, T.; Jia, K.; Tian, Y.; Li, Y. Inflammation to cancer: The molecular biology in the pancreas (Review). Oncol. Lett. 2014, 7, 1747–1754. [Google Scholar] [CrossRef]
  61. Lüttges, J.; Klöppel, G. Precancerous conditions of pancreatic carcinoma. J. Hepatobiliary Pancreat. Surg. 2000, 7, 568–574. [Google Scholar] [CrossRef] [PubMed]
  62. Pollak, M. Insulin and insulin-like growth factor signalling in neoplasia. Nat. Rev. Cancer 2008, 8, 915–928. [Google Scholar] [CrossRef]
  63. Cotterill, A.M.; Holly, J.M.; Wass, J.A. The regulation of insulin-like growth factor binding protein (IGFBP)-1 during prolonged fasting. Clin. Endocrinol. 1993, 39, 357–362. [Google Scholar] [CrossRef]
  64. Yang, J.; Waldron, R.T.; Su, H.Y.; Moro, A.; Chang, H.H.; Eibl, G.; Ferreri, K.; Kandeel, F.R.; Lugea, A.; Li, L.; et al. Insulin promotes proliferation and fibrosing responses in activated pancreatic stellate cells. Am. J. Physiol. Gastrointest. Liver Physiol. 2016, 311, G675–G687. [Google Scholar] [CrossRef] [PubMed]
  65. Qin, C.; Li, T.; Lin, C.; Zhao, B.; Li, Z.; Zhao, Y.; Wang, W. The systematic role of pancreatic cancer exosomes: Distant communication, liquid biopsy and future therapy. Cancer Cell Int. 2024, 24, 264. [Google Scholar] [CrossRef]
  66. Mutgan, A.C.; Besikcioglu, H.E.; Wang, S.; Friess, H.; Ceyhan, G.O.; Demir, I.E. Insulin/IGF-driven cancer cell-stroma crosstalk as a novel therapeutic target in pancreatic cancer. Mol. Cancer 2018, 17, 66. [Google Scholar] [CrossRef]
  67. Tang, Z.C.; Chu, Y.; Tan, Y.Y.; Li, J.; Gao, S. Pancreatic and duodenal homeobox-1 in pancreatic ductal adenocarcinoma and diabetes mellitus. Chin. Med. J. 2020, 133, 344–350. [Google Scholar] [CrossRef]
  68. Zhang, Y.; Fang, X.; Wei, J.; Miao, R.; Wu, H.; Ma, K.; Tian, J. PDX-1: A Promising Therapeutic Target to Reverse Diabetes. Biomolecules 2022, 12, 1785. [Google Scholar] [CrossRef]
  69. Ebrahim, N.; Shakirova, K.; Dashinimaev, E. PDX1 is the cornerstone of pancreatic β-cell functions and identity. Front. Mol. Biosci. 2022, 9, 1091757. [Google Scholar] [CrossRef]
Figure 1. Expression of POU5F1 mRNA in PDAC, PNET and control patients. Data are presented as medians with interquartile ranges (Q1–Q3), and nonparametric Mann–Whitney U test was used for comparisons between groups. Associations with p < 0.05 were considered statistically significant.
Cimb 47 00236 g001
Figure 2. Expression of NANOG mRNA in PDAC, PNET and control patients. Data are presented as medians with interquartile ranges (Q1–Q3), and nonparametric Mann–Whitney U test was used for comparisons between groups. Associations with p < 0.05 were considered statistically significant.
Cimb 47 00236 g002
Figure 3. Expression of HES1 mRNA in PDAC, PNET and control patients. Data are presented as medians with interquartile ranges (Q1–Q3), and nonparametric Mann–Whitney U test was used for comparisons between groups. Associations with p < 0.05 were considered statistically significant.
Cimb 47 00236 g003
Figure 4. Expression of PDAC mRNA in PDAC, PNET and control patients. Data are presented as medians with interquartile ranges (Q1–Q3), and nonparametric Mann–Whitney U test was used for comparisons between groups. Associations with p < 0.05 were considered statistically significant.
Cimb 47 00236 g004
Figure 5. Expression of INS mRNA in PDAC, PNET and control patients. Data are presented as medians with interquartile ranges (Q1–Q3), and nonparametric Mann–Whitney U test was used for comparisons between groups. Associations with p < 0.05 were considered statistically significant.
Cimb 47 00236 g005
Figure 6. Expression of CK19 mRNA in PDAC, PNET and control patients. Data are presented as medians with interquartile ranges (Q1–Q3), and nonparametric Mann–Whitney U test was used for comparisons between groups. Associations with p < 0.05 were considered statistically significant.
Cimb 47 00236 g006
Table 1. Characteristics of PDAC and PNET patients.
PDAC
N = 37
PNETs
N = 12
Controls
N = 34
Age
(years)
64
(57–69)
51.5
(38–58.5) *
61
(49–73)
Height
(cm)
168
(160–175)
171.5
(165.5–178.5)
166.5
(162–173)
Weight
(kg)
65
(55–74) *
70
(60–75.5)
75
(63–80)
Female/Male23/145/725/9
BMI
(kg/m2)
22.5
(20–25.8) *
23.3
(20.7–25.7)
25
(23.4–28.6)
WBC
(K/μL)
8.2
(6.5–10.2) *
6.47
(4.7–7.4)
6.2
(5.2–7.3)
Plt
(K/μL)
233
(167–276)
220
(198–327)
229.5
(185–267)
Ery
(mln/μL)
4.3
(3.7–4.7) *
4.5
(4.3–4.9)
4.7
(4.3–4.9)
CRP
(mg/L)
11
(3.46–74) *
2
(1–4.7)
2.5
(1–5)
Ca 19-9482.2
(114.8–5890) *
6.1
(3.5–9.0)
4.2
(2–8.9)
Data are presented as medians with interquartile ranges. * p < 0.05 vs. healthy controls, Mann–Whitney U test.
Table 2. Gene-expression levels of six genes (POU5F1, NANOG, HES1, PDX, INS, CK19) in the control (N = 34), PNETS (N = 12), and PDAC (N = 34) groups.
Control
N = 34
PNETs
N = 12
PDAC
N = 34
POU5F10.002
(0.0005–0.006)
0.0009
(0.0002–0.004)
0.003
(0.001–0.01)
NANOG0.0003
(0.00005–0.004)
0.0008
(0.00008–0.003)
0.002
(0.0003–0.005) *
HES10.00011
(0.00003–0.0006)
0.00009
(1.3 × 10⁻⁶–0.0009)
0.0001
(0.0003–0.0003)
PDX0.00003
(6.5 × 10⁻⁶–0.0001)
0.00003
(3.7 × 10⁻⁶–0.0005)
0.00008
(0.00002–0.0002
INS0.00008
(2.7 × 10⁻⁶–0.0005)
0.0002
(1.8 × 10⁻⁶–0.005)
0.0004
(0.00004–0.002) *
CK190.000022
(2.9 × 10⁻⁶–0.0002)
0.00008
(9.7 × 10⁻⁶–0.004)
0.0003
(0.00007–0.001) *
Data are presented as medians with interquartile ranges. * p < 0.05 vs. healthy controls, Mann–Whitney U test.
Table 3. Comparison of basic clinical characteristics and mRNA expression in patients with locally advanced and metastatic pancreatic cancer.
Locally Advanced
N = 23
Metastatic
N = 14
Age61
(55–66) *
67.7
(63–74) *
POU5F10.003
(0.0007–0.009)
0.003
(0.001–0.03)
NANOG0.002
(0.0002–0.005)
0.002
(0.0004–0.006)
HES10.0001
(0.00005–0.0003)
0.00009
(0.00003–0.0005)
PDX0.00008
(0.00001–0.0001)
0.00009
(0.00005–0.0006)
INS0.0004
(0.00004–0.002)
0.0007
(0.00004–0.004)
CK190.0002
(0.00008–0.001)
0.0003
(0.00001–0.002)
Data are presented as medians with interquartile ranges. * p < 0.05 vs. healthy controls, Mann–Whitney U test.
Disclaimer/Publisher’s Note: The statements, opinions and data contained in all publications are solely those of the individual author(s) and contributor(s) and not of MDPI and/or the editor(s). MDPI and/or the editor(s) disclaim responsibility for any injury to people or property resulting from any ideas, methods, instructions or products referred to in the content.

