Renewable Energy and Economic Growth: Evidence from European Countries

 , ,
, ,  ,
,  and
and
Abstract
:1. Introduction
2. Literature Review
2.1. Non-European Countries
2.2. European Countries
3. Data and Methods
4. Results and Discussion
- GDP denotes the gross domestic product;
- GFCF denotes the gross fixed capital formation;
- LF denotes the total labor force;
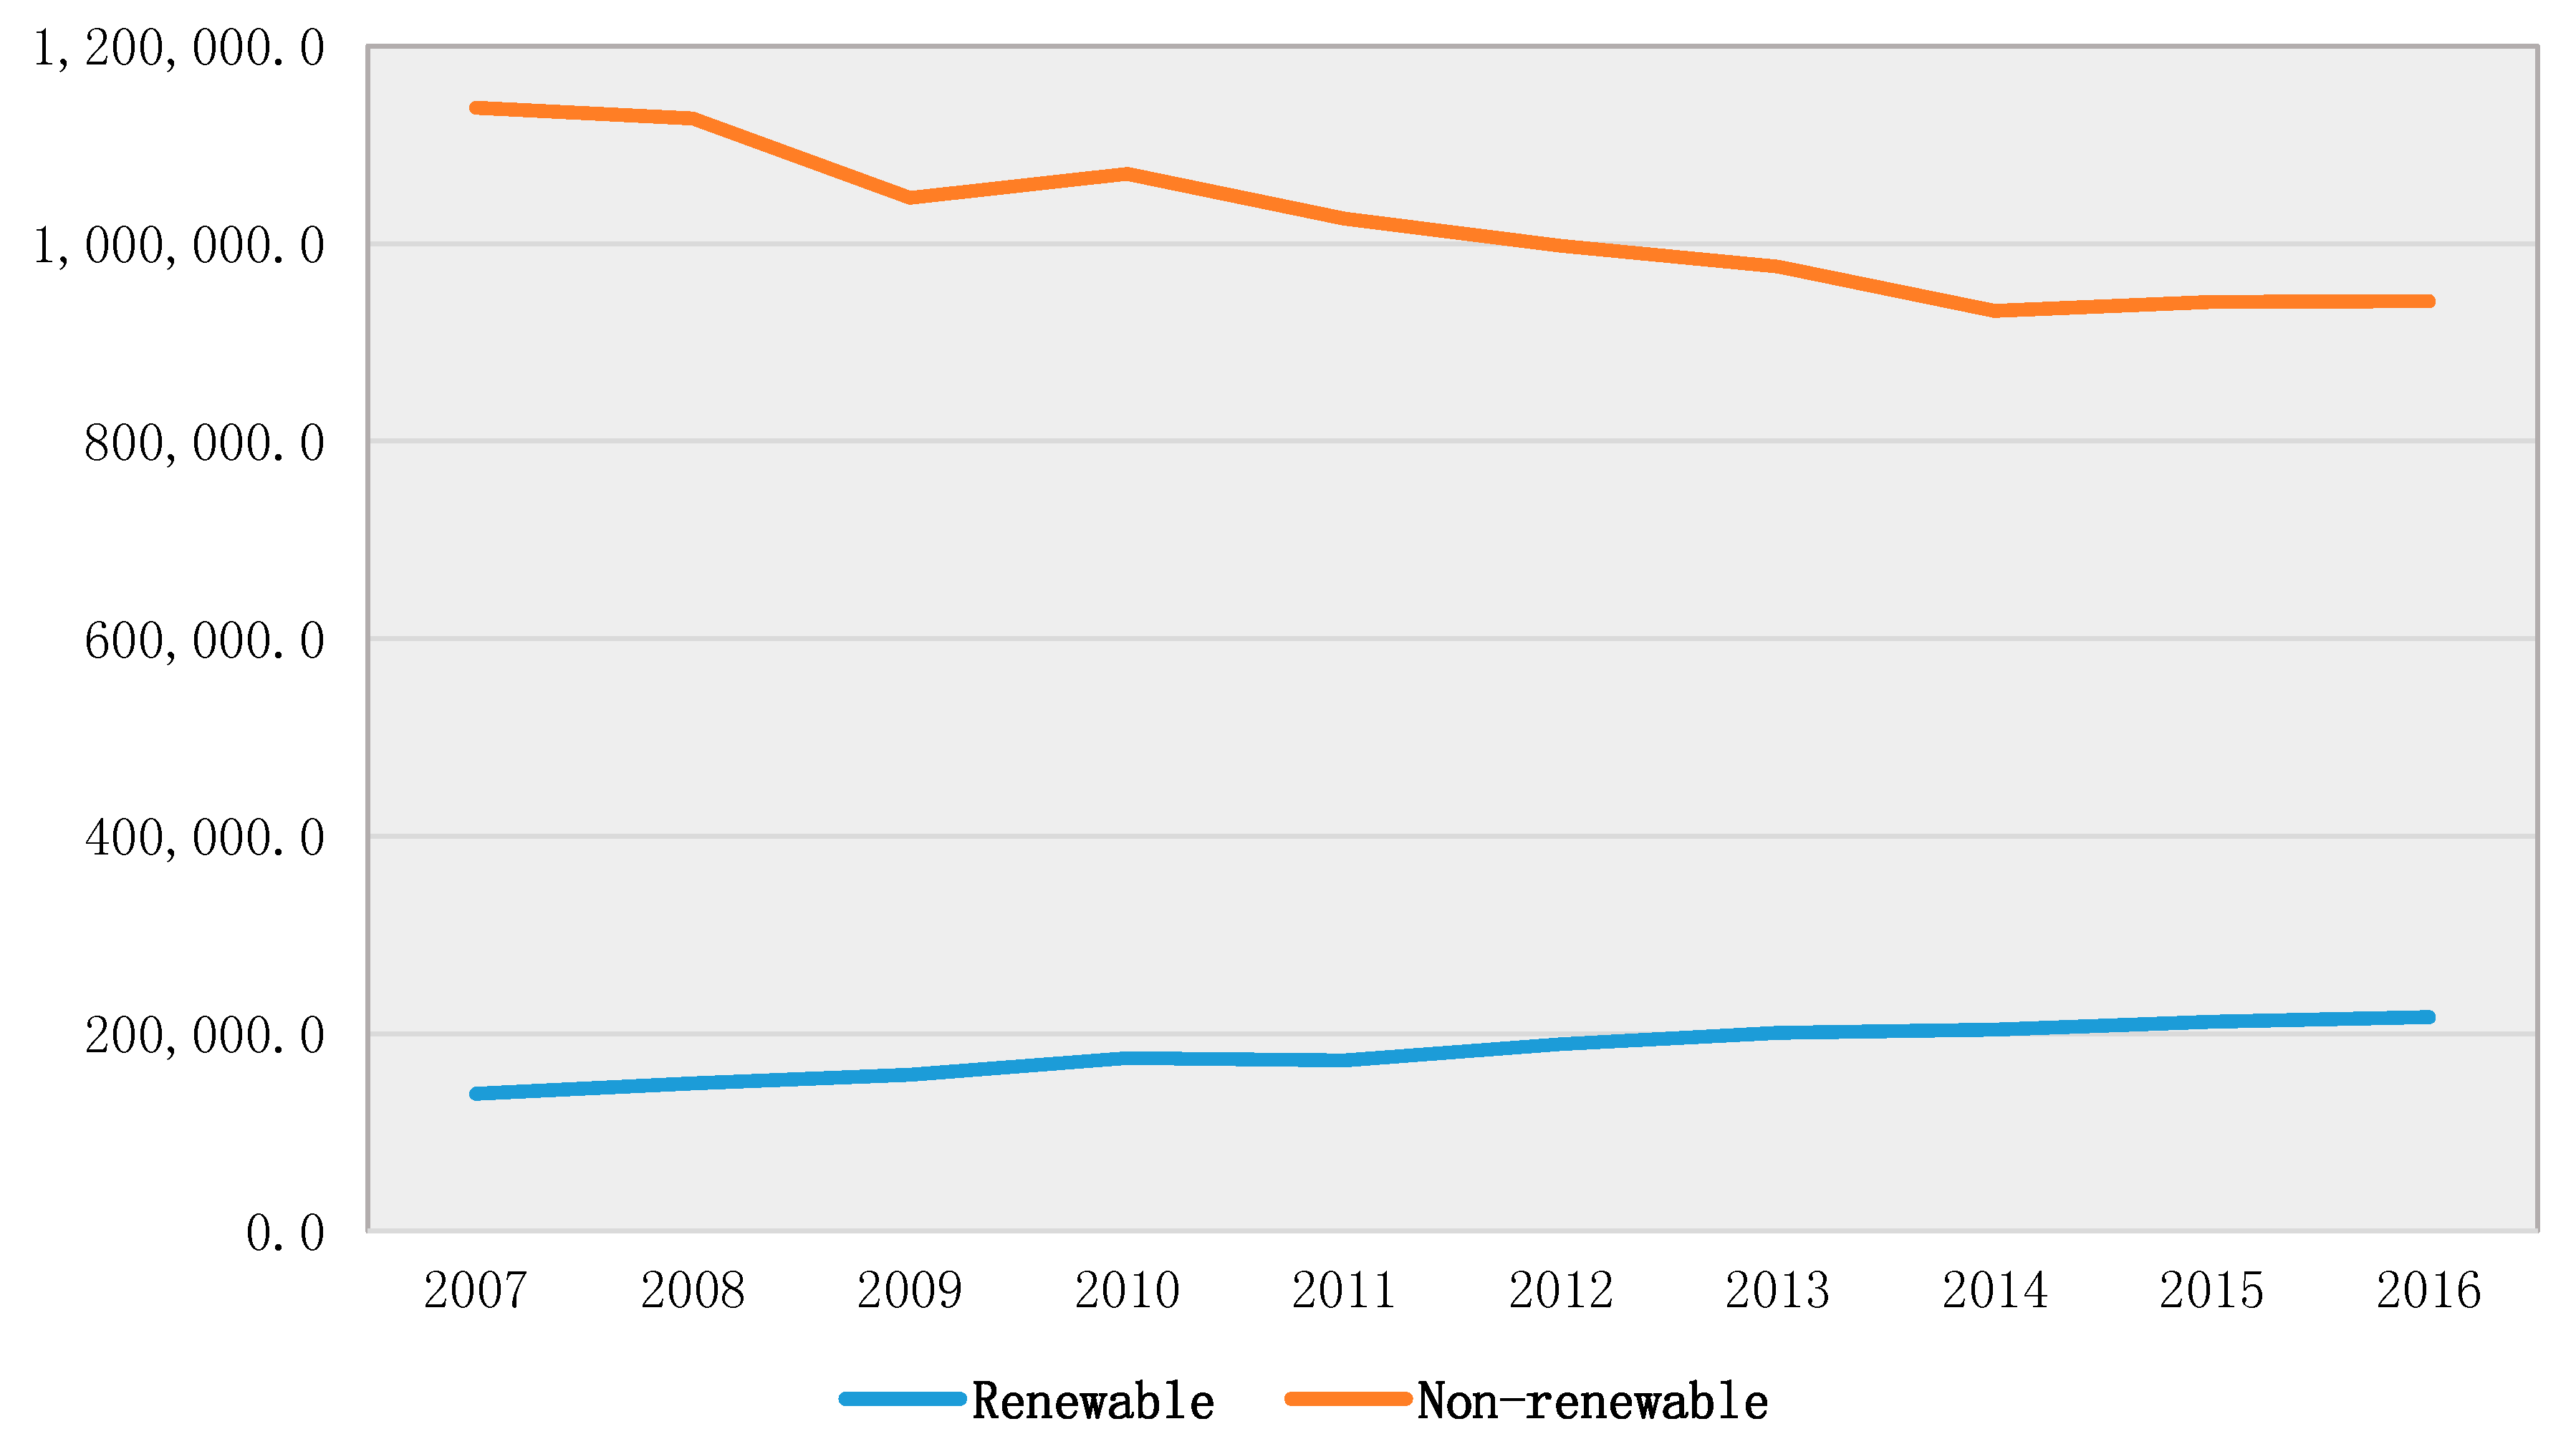
- RES denotes the renewable energy sources consumption; and
- NONRES denotes the non-renewable energy consumption
5. Conclusions
Author Contributions
Funding
Conflicts of Interest
References
- Rodríguez-Monroy, C.; Mármol-Acitores, G.; Nilsson-Cifuentes, G. Electricity generation in Chile using non-conventional renewable energy sources—A focus on biomass. Renew. Sustain. Energy Rev. 2018, 81, 937–945. [Google Scholar] [CrossRef]
- Ntanos, S.; Ziatas, T.; Merkouri, A. Renewable energy consumption, carbon dioxide emissions and economic growth: Evidence from Europe and Greece. In Proceedings of the e-RA 10 International Scientific Conference, Piraeus, Greece, 23–25 September 2015; pp. 46–56. [Google Scholar]
- Papageorgiou, A.; Skordoulis, M.; Trichias, C.; Georgakellos, D.; Koniordos, M. Emissions trading scheme: Evidence from the European Union countries. In Communications in Computer and Information Science; Kravets, A., Shcherbakov, M., Kultsova, M., Shabalina, O., Eds.; Springer International Publishing: Cham, Switzerland, 2015; pp. 222–233. [Google Scholar]
- Svenfelt, Å.; Engström, R.; Svane, Ö. Decreasing energy use in buildings by 50% by 2050—A backcasting study using stakeholder groups. Technol. Forecast. Soc. Chang. 2011, 78, 785–796. [Google Scholar] [CrossRef]
- Alper, A.; Oguz, O. The role of renewable energy consumption in economic growth: Evidence from asymmetric causality. Renew. Sustain. Energy Rev. 2016, 60, 953–959. [Google Scholar] [CrossRef]
- Apergis, N.; Danuletiu, D.C. Renewable energy and economic growth: Evidence from the sign of panel long-run causality. Int. J. Energy Econ. Policy 2014, 4, 578–587. [Google Scholar]
- Destek, M.A.; Aslan, A. Renewable and non-renewable energy consumption and economic growth in emerging economies: Evidence from bootstrap panel causality. Renew. Energy 2017, 111, 757–763. [Google Scholar] [CrossRef]
- Pao, H.T.; Fu, H.C. Renewable energy, non-renewable energy and economic growth in Brazil. Renew. Sustain. Energy Rev. 2013, 25, 381–392. [Google Scholar] [CrossRef]
- Koçak, E.; Şarkgüneşi, A. The renewable energy and economic growth nexus in Black Sea and Balkan countries. Energy Policy 2017, 100, 51–57. [Google Scholar] [CrossRef]
- Sasana, H.; Ghozali, I. The impact of fossil and renewable energy consumption on the economic growth in Brazil, Russia, India, China and South Africa. Int. J. Energy Econ. Policy 2017, 7, 194–200. [Google Scholar]
- Shahbaz, M.; Loganathan, N.; Zeshan, M.; Zaman, K. Does renewable energy consumption add in economic growth? An application of auto-regressive distributed lag model in Pakistan. Renew. Sustain. Energy Rev. 2015, 44, 576–585. [Google Scholar] [CrossRef]
- Salim, R.A.; Hassan, K.; Shafiei, S. Renewable and non-renewable energy consumption and economic activities: Further evidence from OECD countries. Energy Econ. 2014, 44, 350–360. [Google Scholar] [CrossRef] [Green Version]
- Apergis, N.; Payne, J.E. Renewable and non-renewable energy consumption-growth nexus: Evidence from a panel error correction model. Energy Econ. 2012, 34, 733–738. [Google Scholar] [CrossRef]
- Bhattacharya, M.; Paramati, S.R.; Ozturk, I.; Bhattacharya, S. The effect of renewable energy consumption on economic growth: Evidence from top 38 countries. Appl. Energy 2016, 162, 733–741. [Google Scholar] [CrossRef]
- Inglesi-Lotz, R. The impact of renewable energy consumption to economic growth: A panel data application. Energy Econ. 2015, 53, 58–63. [Google Scholar] [CrossRef]
- Omri, A.; Nguyen, D.K. On the determinants of renewable energy consumption: International evidence. Energy 2014, 72, 554–560. [Google Scholar] [CrossRef]
- Al-Mulali, U.; Fereidouni, H.G.; Lee, J.Y.; Sab, C.N. Examining the bi-directional long run relationship between renewable energy consumption and GDP growth. Renew. Sustain. Energy Rev. 2013, 22, 209–222. [Google Scholar] [CrossRef]
- Jebli, M.B.; Youssef, S.B. Output, renewable and non-renewable energy consumption and international trade: Evidence from a panel of 69 countries. Renew. Energy 2015, 83, 799–808. [Google Scholar] [CrossRef] [Green Version]
- Sadorsky, P. Renewable energy consumption and income in emerging economies. Energy Policy 2009, 37, 4021–4028. [Google Scholar] [CrossRef]
- Yildirim, E.; Saraç, Ş.; Aslan, A. Energy consumption and economic growth in the USA: Evidence from renewable energy. Renew. Sustain. Energy Rev. 2012, 16, 6770–6774. [Google Scholar] [CrossRef]
- Fang, Y. Economic welfare impacts from renewable energy consumption: The China experience. Renew. Sustain. Energy Rev. 2011, 15, 5120–5128. [Google Scholar] [CrossRef]
- Lin, B.; Moubarak, M. Renewable energy consumption—Economic growth nexus for China. Renew. Sustain. Energy Rev. 2014, 40, 111–117. [Google Scholar] [CrossRef]
- Dogan, E. The relationship between economic growth and electricity consumption from renewable and non-renewable sources: A study of Turkey. Renew. Sustain. Energy Rev. 2015, 52, 534–546. [Google Scholar] [CrossRef]
- Cambini, C.; Franzi, D. Assessing the EU Pressure for Rules Change: The Perceptions of Southern Mediterranean Energy Regulators. Mediterr. Politics 2014, 19, 59–81. [Google Scholar] [CrossRef]
- Pang, X.; Mörtberg, U.; Brown, N. Energy models from a strategic environmental assessment perspective in an EU context—What is missing concerning renewables? Renew. Sustain. Energy Rev. 2014, 33, 353–362. [Google Scholar] [CrossRef]
- Dogan, E.; Sebri, M.; Turkekul, B. Exploring the relationship between agricultural electricity consumption and output: New evidence from Turkish regional data. Energy Policy 2016, 95, 370–377. [Google Scholar] [CrossRef]
- Sutter, D. Propagandistic Research and the U.S. Department of Energy: Energy Efficiency in Ordinary Life and Renewables in Electricity Production. Econ. J. Watch 2017, 14, 103–120. [Google Scholar]
- Cherukupalli, N. Renewables Can Help Transform Lives in Rural Areas. Proc. IEEE 2015, 103, 862–867. [Google Scholar] [CrossRef]
- Haerer, D.; Pratson, L. Employment trends in the U.S. Electricity Sector, 2008–2012. Energy Policy 2015, 82, 85–98. [Google Scholar] [CrossRef]
- DeLlano-Paz, F.; Calvo-Silvosa, A.; Antelo, S.I.; Soares, I. The European low-carbon mix for 2030: The role of renewable energy sources in an environmentally and socially efficient approach. Renew. Sustain. Energy Rev. 2015, 48, 49–61. [Google Scholar] [CrossRef]
- Knopf, B.; Nahmmacher, P.; Schmid, E. The European renewable energy target for 2030—An impact assessment of the electricity sector. Energy Policy 2015, 85, 50–60. [Google Scholar] [CrossRef]
- Bolük, G.; Mert, M. Fossil and renewable energy consumption, GHGs (greenhouse gases) and economic growth: Evidence from a panel of EU (European Union) countries. Energy 2014, 74, 439–446. [Google Scholar] [CrossRef]
- Caraiani, C.; Lungu, C.; Dascălu, C. Energy consumption and GDP causality: A three-step analysis for emerging European countries. Renew. Sustain. Energy Rev. 2015, 44, 198–210. [Google Scholar] [CrossRef]
- Borkowska, B.; Klimczak, M. From a monopoly towards an imperfectly competitive electricity market in Poland. Transform. Bus. Econ. 2011, 10, 463–474. [Google Scholar]
- Tellidou, A.C.; Bakirtzis, A.G. Agent-based analysis of monopoly power in electricity markets. In Proceedings of the International Conference on Intelligent Systems Applications to Power Systems, Kaohsiung, Taiwan, 5–8 November 2007. [Google Scholar]
- Philippou, M.; Tassoulis, A.; Katsigiannakis, G. The liberalization process of the electricity market in Greece: The design of the transmission system operator’s IT infrastructure. In Proceedings of the International Conference on Electric Power Engineering, PowerTech, Budapest, Hungary, 29 August–2 September 1999; p. 15. [Google Scholar]
- Andrianesis, P.; Biskas, P.; Liberopoulos, G. An overview of Greece’s wholesale electricity market with emphasis on ancillary services. Electr. Power Syst. Res. 2011, 81, 1631–1642. [Google Scholar] [CrossRef]
- Chatzisideris, M.D.; Laurent, A.; Christoforidis, G.C.; Krebs, F.C. Cost-competitiveness of organic photovoltaics for electricity self-consumption at residential buildings: A comparative study of Denmark and Greece under real market conditions. Appl. Energy 2017, 208, 471–479. [Google Scholar] [CrossRef]
- Eurostat. Supply, Transformation and Consumption of Renewable Energies—Annual Data Supply, Transformation and Consumption of Renewable Energies—Annual Data. Available online: http://ec.europa.eu/eurostat/data/database (accessed on 1 June 2018).
- Taeyoung, J.; Jinsoo, K. Coal Consumption and Economic Growth: Panel Cointegration and Causality Evidence from OECD and Non-OECD Countries. Sustainability 2018, 10, 660. [Google Scholar] [CrossRef]
- Punj, G.; Stewart, D.W. Cluster analysis in marketing research: Review and suggestions for application. J. Mark. Res. 1983, 20, 134–148. [Google Scholar] [CrossRef]
- Kripfganz, S.; Schneider, D.C. ARDL: Stata module to estimate autoregressive distributed lag models. In Proceedings of the Stata Conference, Chicago, IL, USA, 28–29 July 2016. [Google Scholar]
- Goh, S.K.; Wong, K.N. Could inward FDI offset the substitution effect of outward FDI on domestic investment? Evidence from Malaysia. Prague Econ. Pap. 2014, 23, 413–425. [Google Scholar]
- Pesaran, M.H.; Shin, Y.; Smith, R.J. Bounds testing approaches to the analysis of level relationships. J. Appl. Econ. 2001, 16, 289–326. [Google Scholar] [CrossRef] [Green Version]
- Narayan, P.K. The saving and investment nexus for China: Evidence from cointegration tests. Appl. Econ. 2005, 37, 1979–1990. [Google Scholar] [CrossRef]
- Azam, M.; Khan, A.Q.; Zafeiriou, E.; Arabatzis, G. Socio-economic determinants of energy consumption: An empirical survey for Greece. Renew. Sustain. Energy Rev. 2016, 57, 1556–1567. [Google Scholar] [CrossRef]
- Ntanos, S.; Kyriakopoulos, G.; Chalikias, M.; Arabatzis, G.; Skordoulis, M.; Galatsidas, S.; Drosos, D. A Social Assessment of Renewable Energy Sources Usage and Contribution to Life Quality: The Case of an Attica Urban Area in Greece. Sustainability 2018, 10, 1414. [Google Scholar] [CrossRef]
- Ntanos, S.; Kyriakopoulos, G.; Chalikias, M.; Arabatzis, G.; Skordoulis, M. Public Perceptions and Willingness to Pay for Renewable Energy: A Case Study from Greece. Sustainability 2018, 10, 687. [Google Scholar] [CrossRef]
- Menanteau, P.; Finon, D.; Lamy, M.L. Prices versus quantities: Choosing policies for promoting the development of renewable energy. Energy Policy 2003, 31, 799–812. [Google Scholar] [CrossRef]
- Garcia, A.; Alzate, J.M.; Barrera, J. Regulatory design and incentives for renewable energy. J. Regul. Econ. 2012, 41, 315–336. [Google Scholar] [CrossRef]


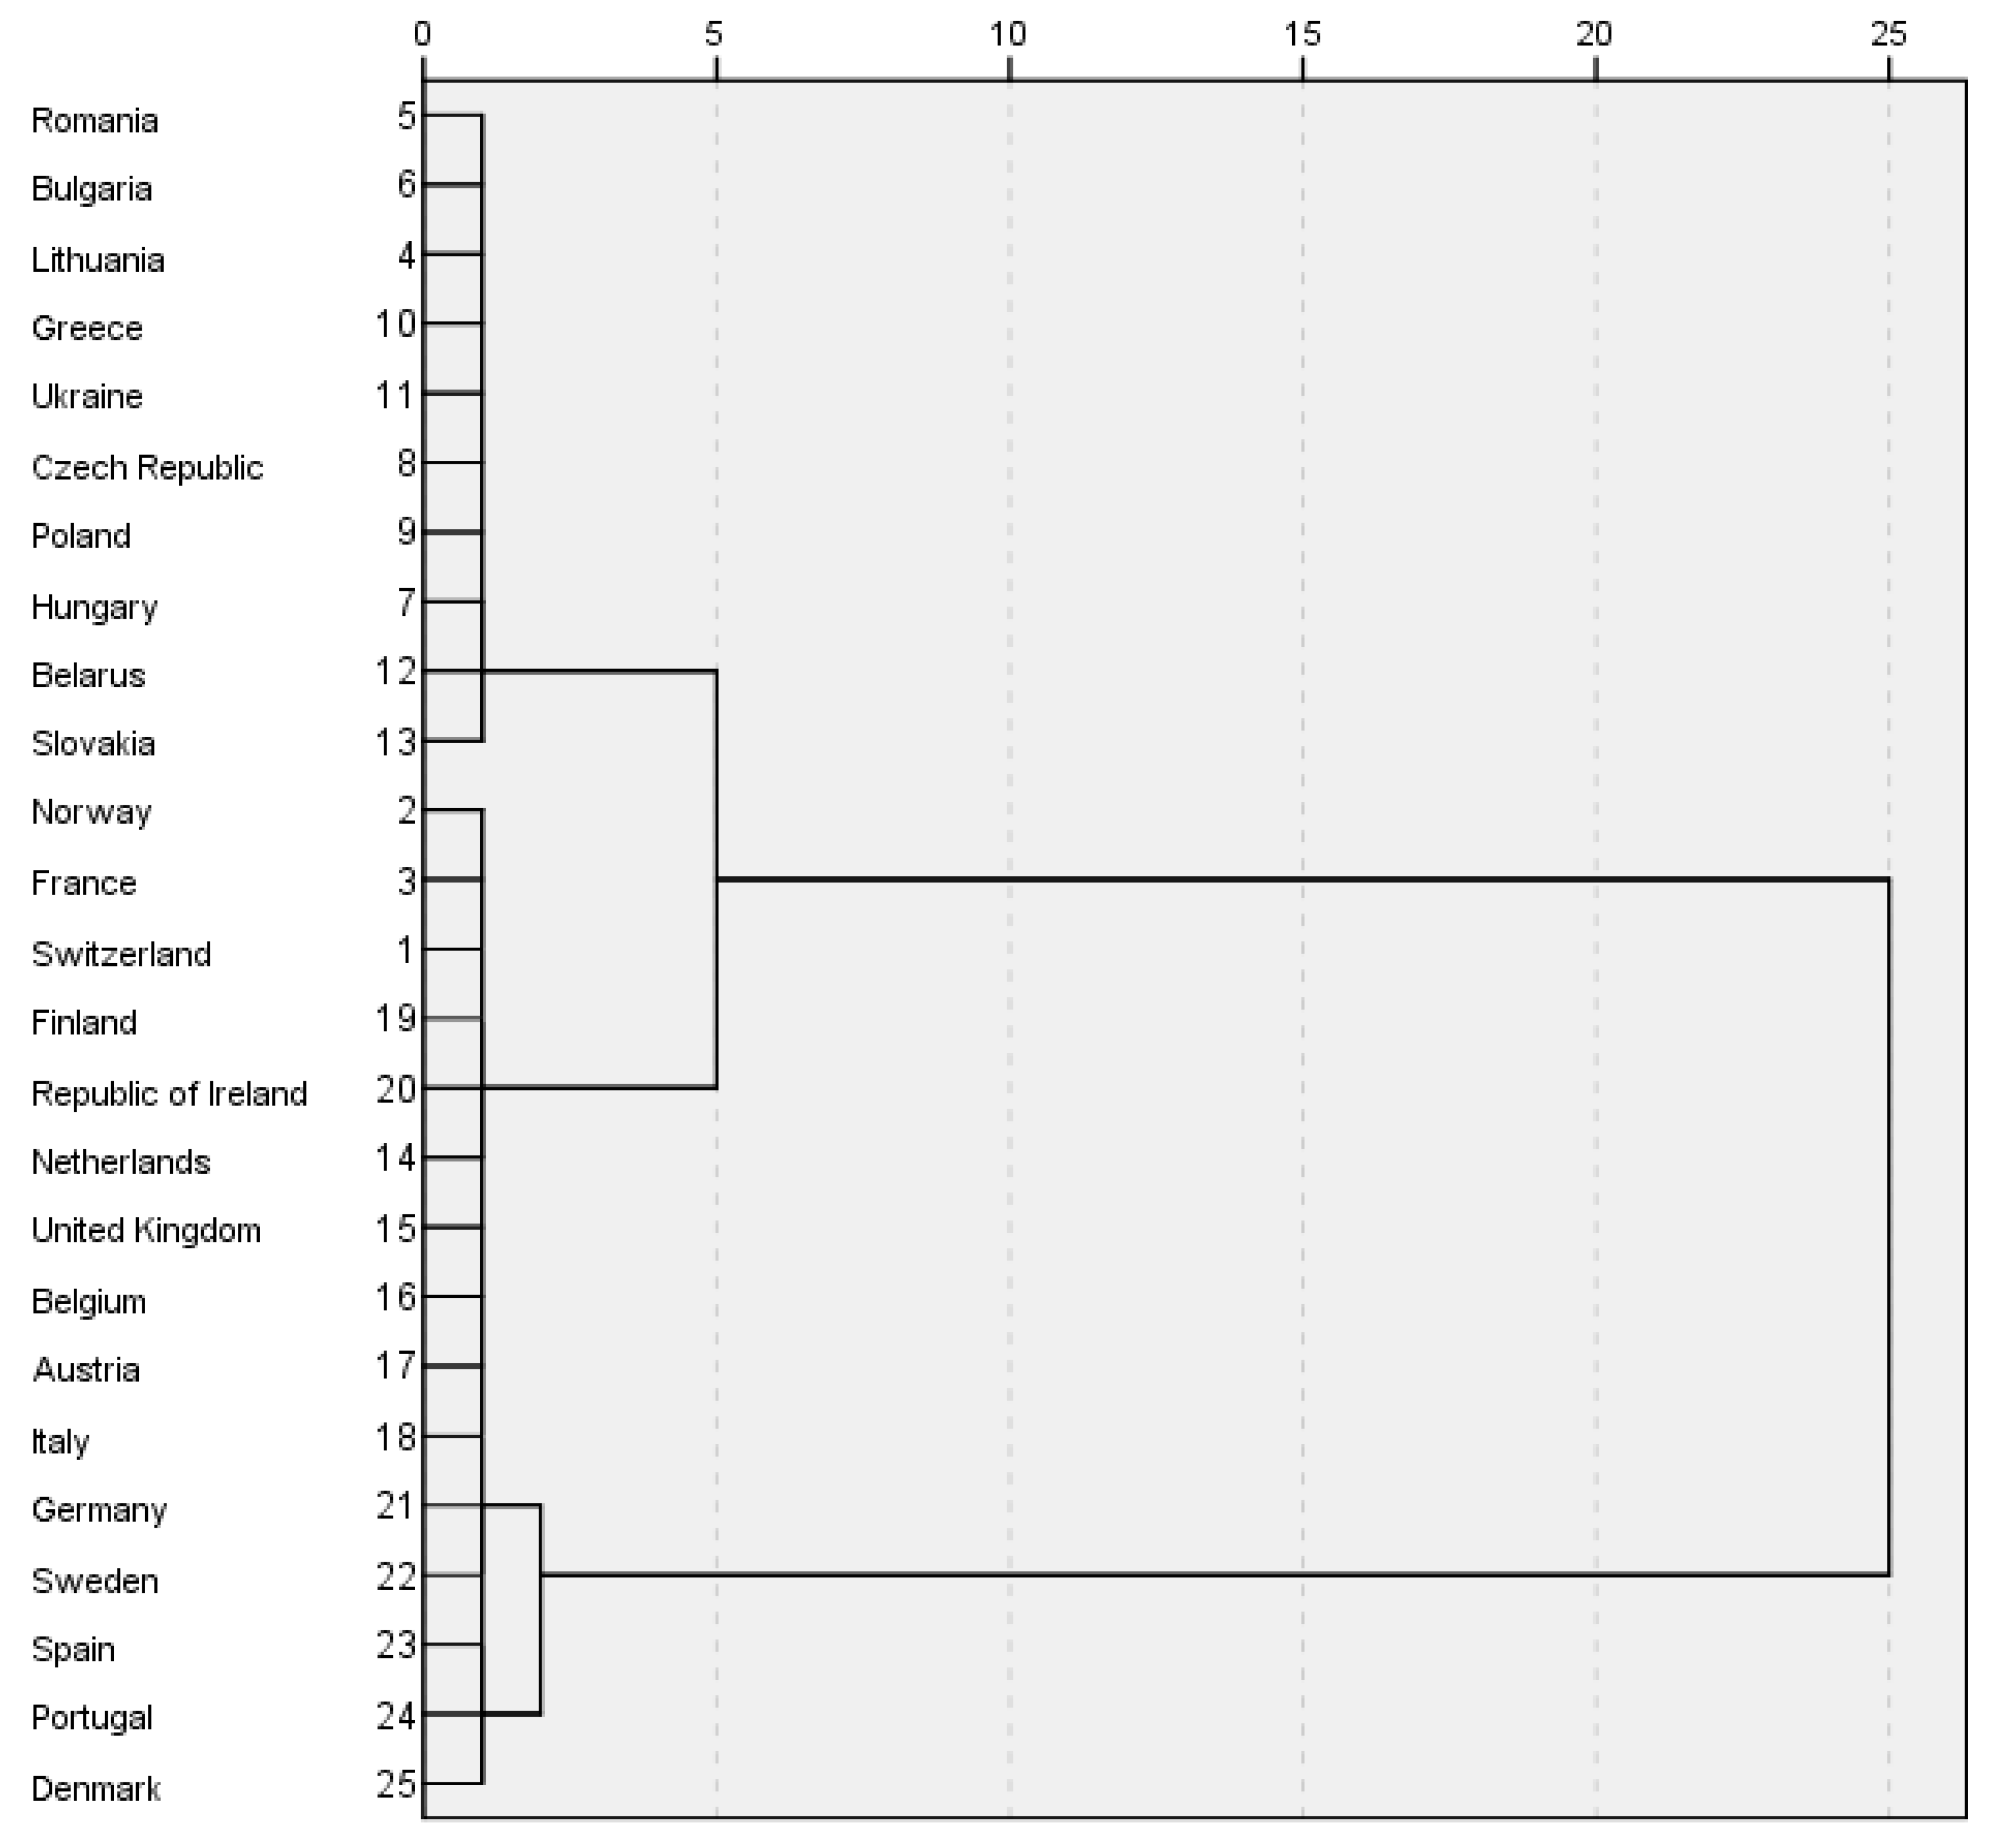
| Cluster Distribution | |||
|---|---|---|---|
| Number of Countries | % of Combined | ||
| Cluster | 1 | 10 | 40.0% |
| 2 | 15 | 60.0% | |
| Combined | 25 | 100.0% | |
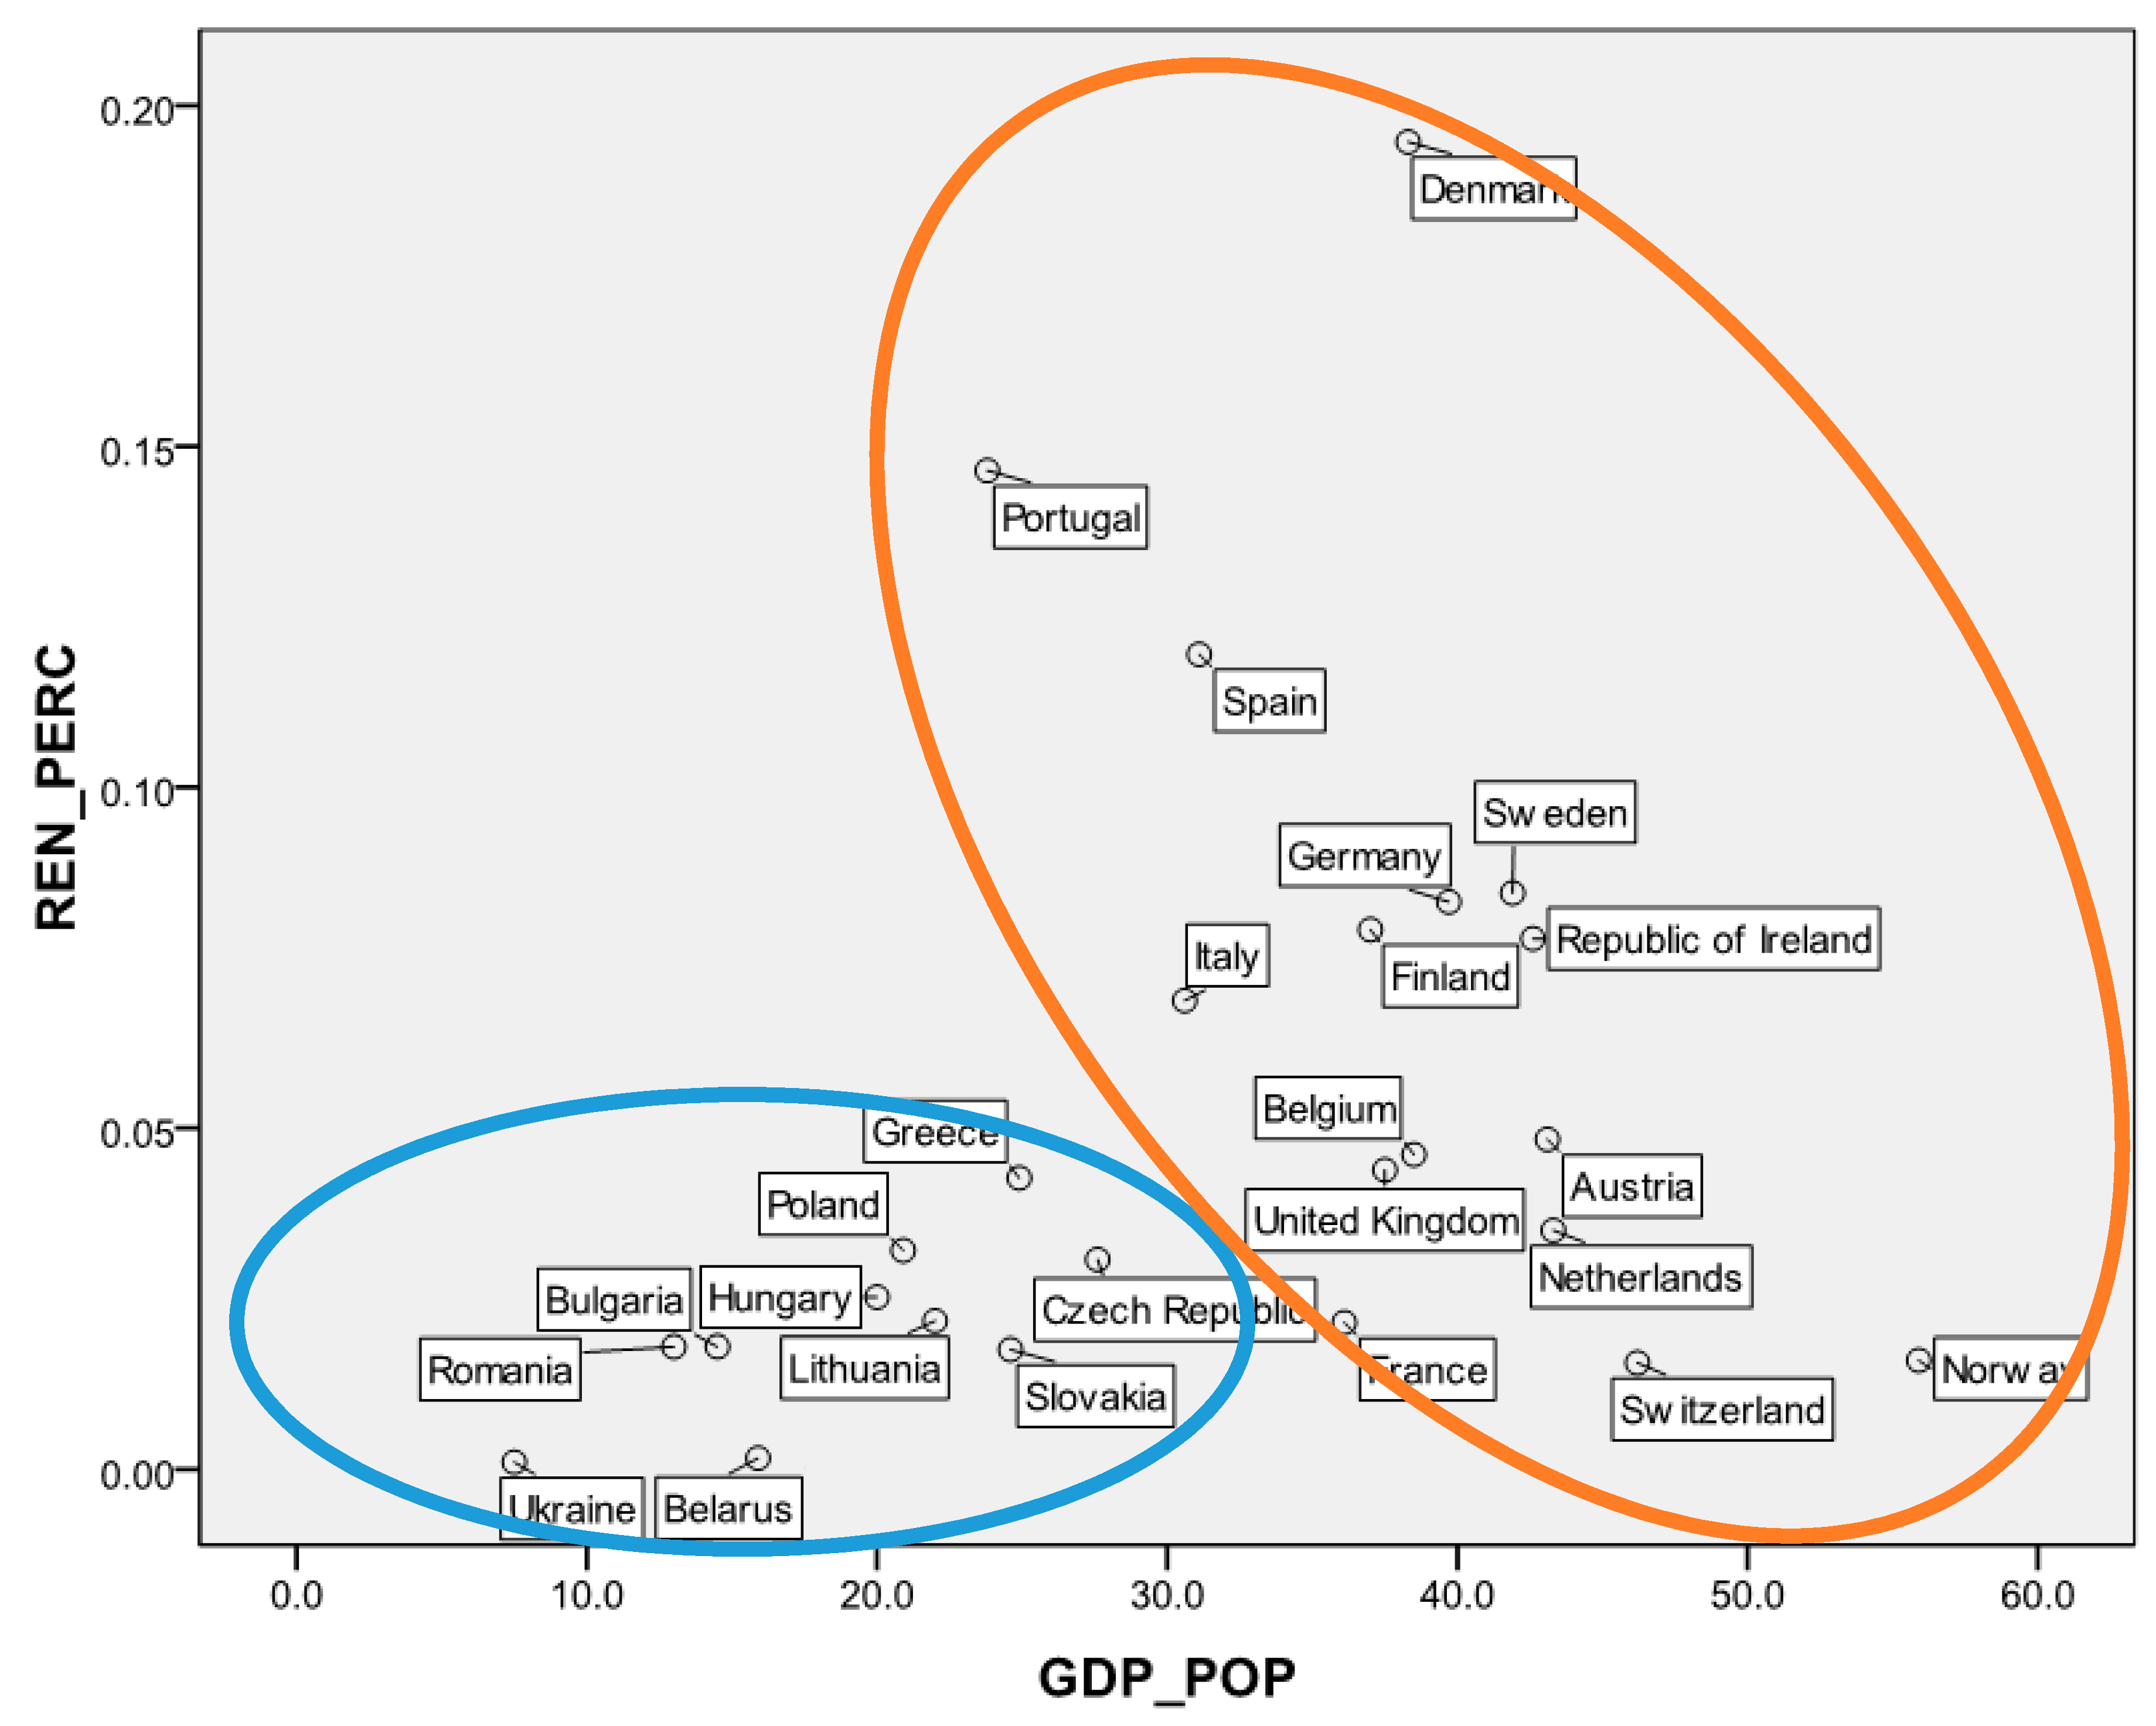
| GDP per Capita (in Thousand Euros) | RES Consumption per Capita (in TOE) | ||||
|---|---|---|---|---|---|
| Mean | Std. Deviation | Mean | Std. Deviation | ||
| Cluster | 1 | 34.548 | 7.430 | 0.254 | 0.160 |
| 2 | 16.526 | 5.760 | 0.049 | 0.039 | |
| Model | Variables in Model | Coefficient | Std. Error | F-Statistic | p-Value |
|---|---|---|---|---|---|
| Model for cluster 1 countries. Dependent: lnGDPt | Constant | 15,979.230 | 9517.702 | 6.978 | 0.000 |
| lnGFCFt | 1.760 | 2.514 | 4.929 | 0.006 | |
| lnLFt | 0.722 | 0.444 | 6.413 | 0.000 | |
| lnRESt | 0.603 | 0.231 | 20.070 | 0.001 | |
| lnNONRESt | 0.310 | 0.504 | 7.245 | 0.000 | |
| Diagnostic Tests | Test Values | p-Value | |||
| F-Statistic | 22.380 | 0.000 | |||
| Jarque-Bera | 0.194 | 0.812 | |||
| Adjusted R-squared | 0.680 | ||||
| Model for cluster 2 countries. Dependent: lnGDPt | Constant | 8848.629 | 3367.971 | 6.210 | 0.000 |
| lnGFCFt | 2.932 | 0.258 | 9.070 | 0.002 | |
| lnLFt | 0.152 | 1.074 | 7.032 | 0.008 | |
| lnRESt | 0.477 | 0.497 | 16.0766 | 0.000 | |
| lnNONRESt | 0.718 | 0.586 | 6.649 | 0.000 | |
| Diagnostic Tests | Test Values | p-Value | |||
| F-Statistic | 20.070 | 0.000 | |||
| Jarque-Bera | 0.208 | 0.753 | |||
| Adjusted R-squared | 0.738 |
© 2018 by the authors. Licensee MDPI, Basel, Switzerland. This article is an open access article distributed under the terms and conditions of the Creative Commons Attribution (CC BY) license (http://creativecommons.org/licenses/by/4.0/).
Share and Cite
Ntanos, S.; Skordoulis, M.; Kyriakopoulos, G.; Arabatzis, G.; Chalikias, M.; Galatsidas, S.; Batzios, A.; Katsarou, A. Renewable Energy and Economic Growth: Evidence from European Countries. Sustainability 2018, 10, 2626. https://doi.org/10.3390/su10082626
Ntanos S, Skordoulis M, Kyriakopoulos G, Arabatzis G, Chalikias M, Galatsidas S, Batzios A, Katsarou A. Renewable Energy and Economic Growth: Evidence from European Countries. Sustainability. 2018; 10(8):2626. https://doi.org/10.3390/su10082626
Chicago/Turabian StyleNtanos, Stamatios, Michalis Skordoulis, Grigorios Kyriakopoulos, Garyfallos Arabatzis, Miltiadis Chalikias, Spyros Galatsidas, Athanasios Batzios, and Apostolia Katsarou. 2018. "Renewable Energy and Economic Growth: Evidence from European Countries" Sustainability 10, no. 8: 2626. https://doi.org/10.3390/su10082626