Abstract
As a special zone of periodic impoundment and flooding in the Three Gorges Reservoir (TGR), the water-level fluctuation zone (WLFZ) of TGR acts as a short-term ‘sink’ for hydrophobic endocrine disrupting compounds (EDCs). This study was conducted on the adsorption/desorption kinetics and equilibriums of four target EDCs (i.e., estrone (E1), 17β-estradiol (E2), 17α-ethynylestradiol (EE2), and bisphenol A (BPA)) in soil samples (i.e., S1, S2, S3, and S4), which were collected from different elevation gradients of the WLFZ at Qingxi Town of Fulin in TGR. Under the influence of the water-level fluctuation, S1 and S2 from the frequent inundation area had smaller particle sizes with more organic matter (OM) and total nitrogen (TN) content, whereas soils S3 and S4 from the long-term exposed area had a higher fraction of sand with lower OM and TN. All four target EDCs could achieve an adsorption equilibrium within 24 h, and the kinetics of the adsorption/desorption fitted the pseudo-second-order model excellently. The adsorption/desorption isotherms of the EDCs were better described by the Freundlich equation. The adsorption capacity decreased, as 17α-ethynylestradiol (EE2) > 17β-estradiol (E2) > estrone (E1) > bisphenol A (BPA), in each tested soil. S1 and S2 exhibited a greater capacity but a lower degree of nonlinearity to adsorb the target EDCs than S3 and S4. The values of the Gibbs free energy suggested that the EDCs adsorption in the tested soils was dominated by unstable physical adsorption. The desorption hysteresis of E1, E2, and EE2 were stronger in S1 and S2, whereas the BPA exhibited weak or almost no hysteresis in all of the tested soils. The substantial water-level fluctuation imposed on the TGR would have a continuous influence on the EDCs adsorption/desorption by altering the soil properties. Thus, long-term monitoring and further research of EDCs in this region are urgent.
1. Introduction
Endocrine disrupting compounds (EDCs), which could mostly influence the endocrine system through mimicking or disrupting the functions of hormones, have drawn considerable social and scientific concern in recent years [1]. Studies suggest that exposure to EDCs is associated with male fish feminization, reproductive abnormalities, obesity, autism, cancer, cardiovascular risk, and other neurobehavioral deficits [2,3]. What deserves greater attention is its wide distribution around the world, including wastewater, surface water and sediment, groundwater, drinking water, indoor and outdoor air, soils, and foods [4,5,6,7]. Estrone (E1) and 17β-estradiol (E2), which are the major metabolites of the female sex hormone; 17α-ethynylestradiol (EE2), which is the ovulation-inhibiting synthetic hormone; and bisphenol A (BPA), which is the monomer used in the manufacture of epoxy resins and polycarbonate plastics, are examples of important environmental EDCs because of their high potencies and discharge.
E1, E2, EE2, and BPA are generally hydrophobic (low solubility and high hydrophobicity–lipophilicity); thus, they can easily accumulate in soil and sediment, and their fate and bioavailability mainly depend on interactions at solid–water interfaces [8]. Therefore, the water-level fluctuation zone (WLFZ) is an effective sink for EDCs because of the complicated material exchange and transformation processes between terrestrial and aquatic environments. With the operation of the Three Gorges Reservoir (TGR), a unique WLFZ, which has been created with a total area of 349 km2 and annual fluctuation of up to 30 m, has received considerable attention [9]. Besides the economic importance of the TGR, there are also widespread environmental concerns. Thus far, numerous research works on the WLFZ of the TGR have been conducted, mainly in terms of the loss of biodiversity and vegetation [10]; the background value and migration of heavy metals [11]; the dynamics of soil nitrogen, phosphorus, and sulfur [12,13]; and greenhouse gas emissions [14]. However, research on the distribution and migration of EDCs in the WLFZ of the TGR is lacking. Limited studies have prompted the existence of EDCs in the overlying water, soil, and sediment of the TGR [15,16,17]. Although the EDCs occur at low trace-level concentrations, such low concentrations may lead to a direct or indirect hazard to humans. The hydrological alternation between wet and dry environments implies a strong interaction between the WLFZ soil EDCs and aquatic surface water EDCs. Nevertheless, few studies have reported on the adsorption/desorption of EDCs in the WLFZ, and the effect of the WLFZ on the fate and ecological safety of EDCs in the TGR are poorly understood. The WLFZ plays a significant role in reducing the bioavailability and toxicity of many contaminations by soil buffering and filtration [18]. On the other hand, the desorption of the adsorbed EDCs from the soil can increase the bioavailability of the chemicals, thereby causing hazards to the environment and human health. Therefore, the research on EDC adsorption and desorption in the WLFZ are particularly important for the assessment and control of the health risk of EDCs in the TGR. Meanwhile, as water transfer between regions has been widely used to mitigate the crisis of water resource shortage, lots of artificial WLFZ were created in many countries. The adsorption/desorption behavior of the EDCs in the WLFZ was also essential for determining the fate of EDCs and quantifying the risk of contamination in these regions.
Thus far, the adsorption/desorption of EDCs in soil has been widely studied, and the characteristics of EDC behavior varies considerably in different cases [19,20,21,22]. According to these experimental studies, soil properties, including the particle size, specific surface area, cation exchange capacity, minerals, and organic matters (OM), all affect the adsorption/desorption of EDCs. Particularly, soil OM is one of the most important factors that affect their adsorption/desorption properties, such as the adsorption capacity and nonlinearity and desorption hysteresis. As the cohesion zone between water and land areas, frequent interactions at soil–water interfaces occur in the WLFZ of the TGR along with the water-level fluctuation pattern; thus, the adsorption and desorption of EDCs in the WLFZ may have different characteristics compared with those found in previous studies. However, very little is known about the adsorption/desorption of EDCs in soils of the WLFZ, as well as the influences of water-level fluctuation on these processes. The impoundment and discharging of the Three Gorges Dam have profound effects on the WLFZ, including inundation and drying, erosion and sedimentation processes, growth and death of plants, and redistribution of sediment, thereby ultimately changing the physical and chemical soil properties in the WLFZ [23] and further affecting the EDC adsorption/desorption and bioavailability. Recent studies have suggested that the concentrations of hydrophobic organic contaminants (HOCs), for example, polycyclic aromatic hydrocarbons in natural waters, increase when soils or sediments undergo dry–wet cycles [24]. Thus, water-level fluctuation patterns will have a continuous influence on the WLFZ, making the absorption and desorption behaviors of the EDCs in this region special and complicated, which will eventually influence the fate and transport of EDCs.
Considering the absence of data on the adsorption/desorption of EDCs in the WLFZ, we selected soils collected from different elevation gradients of a typical WLFZ of TGR as the object of this study. The present study aims to characterize periodically submerged soil samples of the WLFZ of TGR and to investigate the adsorption/desorption behaviors of E1, E2, EE2, and BPA as representatives of EDCs in the tested soils subjected to different drying and wetting cycles. This study is a further step in understanding the migration of EDCs in the WLFZ of TGR.
2. Materials and Methods
2.1. Chemicals
The standards of E1, E2, EE2, and BPA were obtained from J&K Scientific (J&K Scientific Ltd., Peking, China). HPLC grade methanol (MeOH) and acetonitrile were purchased from Fisher (Fisher Scientific Ltd., Waltham, MA, USA). Ultra-pure water (resistance = 18.2 Ω) was produced with a Milli-Q unit (Diect-Q5 UV, Millipore, Billerica, MA, USA). Stock solutions (0.5 g/L) of individual EDCs were prepared in MeOH and stored at −20 °C in the dark. The stock solutions were diluted using MeOH as a solvent to obtain standard curve with different concentrations before use.
2.2. Sampling Site and Soil Samples
The soil samples from the WLFZ located at Qingxi Town of Fulin (107°28.895′–107°28.929′ E, 29°49.444′–29°49.466′ N) were collected from different elevation gradients in April 2016, when the water level fell to approximately 150 m, and the WLFZ was mostly exposed to air. The four soil samples include S1–S4, which were collected at 150–155, 155–160, 160–165, and 165–170 m above sea level, respectively (Figure 1). At each sampling site, a Luoyang spade was used to collect the surface soil (0–10 cm). After mixing and splitting, the soil samples were taken to the laboratory in sealed plastic bags, which were placed in iceboxes, and these samples were then freeze-dried for 48 h and ground to pass through a 2 mm mesh sieve.
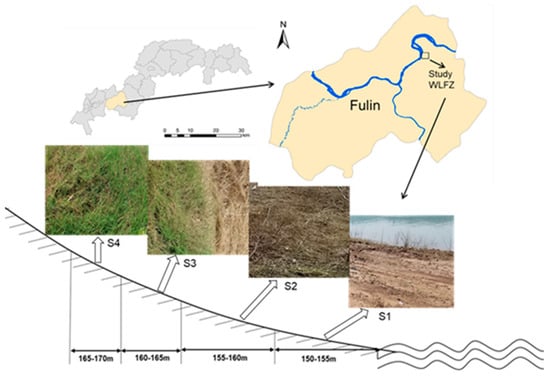
Figure 1.
Location of the sampling sites in the water-level fluctuation zone (WLFZ) of Three Gorges Reservoir (TGR) in China.
The pH of the soil samples was measured by an in situ soil pH meter (Veinasa-PH, Veinasa, Mianyang, China) during the collecting processes. The total nitrogen (TN) and total organic carbon (TOC) were measured using the Kjeldahl method and potassium dichromate-external heating method, respectively. The grain-size distribution of the soil samples was measured by a laser diffraction particle size analyzer (SALD-3101, SHIMADZU, Kyoto, Japan). The Fourier transform infrared spectra (FTIR) of the soils were obtained using a FT-IR Spectrometer (PerkinElmer Spectrum RX, PerkinElmer, Waltham, MA, USA).
2.3. Adsorption and Desorption Experiments
All of the adsorption/desorption kinetics and isotherms were executed in glass vials. According to the results from the preliminary experiments, the soil/solution ratios were set to be 1:16. The EDC aqueous solutions of the different concentrations were obtained by diluting the stock solution with a background solution, which contained 200 mg/L NaN3 as bioinhibitor and 0.01 M CaCl2 in ultra-pure water, to maintain a constant ionic strength. The MeOH content in the solution was controlled under 0.1% during dilution to minimize the co-solvent effect.
The adsorption kinetics was conducted by adding the EDC solution with an initial concentration of 2.0 mg/L into the vials with soils, according to the previous soil/solution ratio. Thereafter, all of the vials were immediately sealed and then shaken in the dark at 120 r/min and 25 °C for 0.5, 1, 2, 4, 8, 12, 16, 24, 48, and 72 h. The suspensions were then centrifuged at 5000 r/min for 5 min to obtain the supernatants.
All of the adsorption isotherms were obtained in single-solute systems using batch equilibration at 25 °C. The initial concentrations were in the range of 0.5–5.0 mg/L for E1, E2, and EE2, and 0.5–40 mg/L for BPA. On the basis of the results of the adsorption kinetics, the vials for obtaining the adsorption isotherms were shaken for 2 d, and the suspensions were then centrifuged at 5000 r/min for 5 min to obtain the supernatants.
After the adsorption experiments, the desorption experiments were immediately conducted by replacing the supernatant with an EDC-free background solution. The vials for the desorption isotherms were agitated (150 r/min) at 25 °C for 2 day and then centrifuged at 5000 r/min for 5 min. Sampling times of 2, 5, 12, 16, 24, 48, and 72 h were used to analyze the desorption kinetics.
After centrifuge, the supernatants were filtered through 0.45 μm syringe filters and then measured by an HPLC (SHIMADZU LC-2010C) with a C18 column for separation, as well as a UV spectrophotometry for detection and quantification. The operating conditions were as follows: 45/55 (v/v) mobile phase of methanol/water, 0.7 mL/min flow rate, 35 °C oven temperature, 10 μL injection volume, and 205 nm detector wavelength. The retention time for BPA, E2, EE2, and E1 were 9.2, 10.2, 13.2, and 14.8 min, respectively. All of the adsorption and desorption data points were run in duplicate or more, and the reference samples were set without soil.
2.4. Data Analysis
The amount of EDCs adsorbed in the soil at different times (Qt) and under equilibrium conditions (Qe) were calculated using Equations (1) and (2), respectively.
where Qt (mg/kg) and Qe (mg/kg) are the amount of EDC adsorbed at time t (h) and under the equilibrium conditions, respectively; C0 (mg/L) and Ce (mg/L) are the initial and equilibrium aqueous concentrations, respectively; Ct (mg/L) is the liquid-phase concentration of EDC at time t; V (mL) is the solution volume; and m (g) is the mass of soil in the vials.
The pseudo-first-order model (Equation (3)), pseudo-second-order model (Equation (4)), and Elovich model (Equation (5)) were used to stimulate the adsorption kinetics.
where Qt (mg/kg) and Qe (mg/kg) are the amount of EDC adsorbed at time t (h) and under the equilibrium conditions, respectively; k1 (1/h) is the pseudo-first-order model rate constant for the adsorption; k2 (kg/(mg·h)) is the pseudo-second-order model rate constant for adsorption; and a and b are the Elovich model constants.
Qt = a + blnt,
The isotherm data of the adsorption and desorption were arranged to fit for typical adsorption models, including the linear partition model, Langmuir model, and Freundlich model (Equations (6)–(8)).
where Ce (mg/L) and Qe (mg/kg) are the equilibrium concentrations of EDC in the aqueous phase and soil, respectively; Kd is the partition coefficient in the linear model; KF ((mg/kg)/(mg/L)n) and n are the affinity coefficient and isotherm linearity index in the Freundlich equation, respectively; and KL (L/mg) and Qm (mg/kg) are the equilibration parameter and the maximum adsorption capacity for the Langmuir model, respectively.
Qe = KdCe,
The hysteresis index (HI) was calculated for the adsorption/desorption isotherms, shown as follows:
where ndes and nads are the Freundlich exponents for the desorption and adsorption isotherms, respectively.
Based on the Gibbs equation, the standard molar Gibbs free energy change for the adsorption processes was calculated as Equation (10).
where ΔG (kJ/mol) is the standard Gibbs free energy, KF((mg/kg)/(mg/L)n) is the Freundlich constant defined by the Freundlich model (Equation (8)), T (K) is the absolute temperature, and R is the gas constant (8.314 J/(mol·K)).
ΔG = −RT lnKF,
3. Results and Discussion
3.1. Characterization of Soils
The soils of the studied WLFZ are the purple soils developed from purple gritstone, which are particularly susceptible to erosion and weathering [25]. The physiochemical properties of the soil samples from different elevation gradients of the studied WLFZ are analyzed and presented in Table 1. The results showed that the soil properties varied among the samples with different flooding–drying conditions. The pH values, which varied from 7.79 to 8.30, were all alkalescent. The silt fraction was the major fraction in the soils, which accounted for 57.29–79.68% of the total. The clay fraction was the minor fraction, accounting for 15.33–19.79% of the total, whereas the sand fraction varied apparently from 0.53% for S1 to 26.93% for S4. In total, the soils from the lower altitudes held more clay fractions, whereas the soils from the higher altitudes showed coarser fractions. The sedimentation of minor particles increased the clay fraction of soils during the long-term impoundment, whereas a loss of fine particles as a result of water and wind erosion would cause a decrease in the clay fraction upon exposure to air [26]. The significant variation of the particle size distribution among the four tested soils may be related to the difference in alternation of wetting and drying, along with the elevation.

Table 1.
Physical and chemical characteristics of the tested soils from the water-level fluctuation zone (WLFZ). TOC—total organic carbon; (TOC) TN—total nitrogen (TN).
The variability of the TOC and TN concentrations among the four tested soils was high, and the TOC and TN followed similar change trends, that is, S1 > S2 > S3 > S4. Studies have shown that the long-term waterlogged condition is beneficial to the accumulation of OM, whereas the frequently dry and wet alternating can accelerate the degradation of soil OM, mainly via continuous microbial biodegradation [23,27]. Meanwhile, the fine soil particles usually have higher OM content than the coarse particles; thus, the loss of fine particles during long-term exposure also contributes to the OM loss in soils. Moreover, water-level fluctuation not only stimulates the soil OM loss, but it also considerably promotes the soil nitrogen attenuation due to improved denitrification [28]. In this study, the TOC and TN content of the soils from the frequent flooding areas (i.e., S1 and S2) were found to be higher than the contrasting long-term exposed areas (i.e., S3 and S4). Furthermore, the TOC/TN in the soils could reflect the source of OM as the TOC/TN of advanced plants, aquatic life, zooplankton and phytoplankton, and algae were 14–23, 2.8–3.4, 6–13, and 5–14, respectively [29]. The values of TOC/TN in the tested soils were all lower than 10, indicating that the OM in the tested soils mainly came from the biological settlement in the overlying water during the flood season.
More structural information of the soils was provided by FTIR spectra. As shown in Figure 2, the absorption spectra of various functional groups, such as hydroxyl, methyl C–H, methylene C–H, C=C, and C–O were detected. The bands at 1636 cm−1 and 1434 cm−1 were attributed to aromatic C=C and R–C=C, respectively [30]. Four soils showed a similar infrared spectrum, except a noticeable difference of the absorption band of R–C=C at 1434 cm−1. The result indicated a large number of R–C=C in soil S1. The number of R–C=C is in the order of S1 > S2 > S3 > S4.
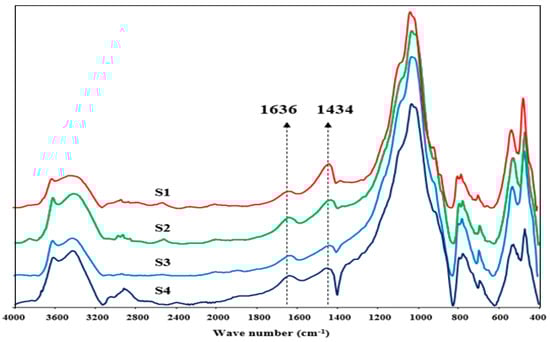
Figure 2.
Fourier transform infrared spectroscopy (FTIR) analysis of the four tested soils.
3.2. Adsorption and Desorption Kinetics
The adsorption and desorption kinetics were investigated by fitting with the Elovich, pseudo-first-order, and pseudo-second-order kinetic models. The experimental data and model-fitted parameters of the adsorption/desorption kinetics are plotted in Figure 3 and listed in Table 2 and Table 3. As shown in Figure 3, the adsorption processes were similar, containing two steps, namely, ‘fast’ and ‘slow’ adsorption. The adsorption capacity sharply increased as a rapid reaction within the initial 4 or 5 h, followed by slowly increasing until the adsorption equilibrium. All of the four EDCs could reach the adsorption equilibrium within 24 h. As shown in Table 2 and Table 3, the pseudo-second-order model could provide an accurate description of the adsorption and desorption kinetics of the EDCs in all of the studied soils, as the experimental Qe(exp) values were close to the theoretical Qe values, with the coefficients of determination (R2) ranging from 0.992 to 0.998. Recent studies have shown that the pseudo-second-order kinetic model can describe not only the chemisorption processes, but also other sorption mechanisms, because the model includes all of the steps of adsorption [31]. This well-fitting pseudo-second-order model implied that the adsorption of EDCs on the studied soils contained more than one step, including external film diffusion and internal particle diffusion [32]. Meanwhile, the adsorption/desorption processes may be governed by the availability of sorption sites on the soils [33].
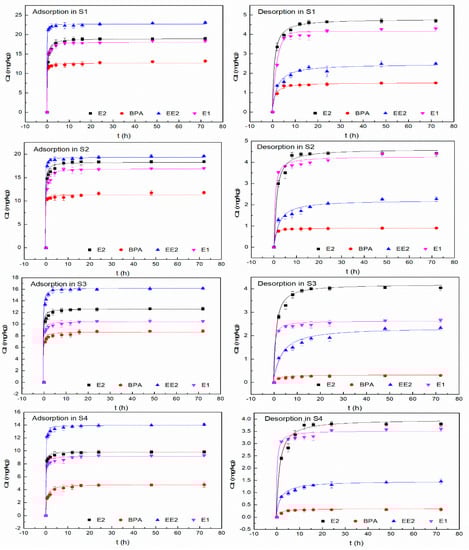
Figure 3.
Adsorption and desorption pseudo-second-order kinetic curves of endocrine disrupting compounds (EDCs) in tested soils at 25 °C, with an initial concentration of 2 mg/L.
Table 2.
Constants and coefficients of determination of adsorption kinetics models. EDC—endocrine disrupting compounds; EE2—17α-ethynylestradiol; E2—17β-estradiol (E2); E1—estrone; BPA—bisphenol A; Qe—equilibrium conditions, K—absolute temperature; R—gas constant.
Table 3.
Constants and coefficients of determination of desorption kinetics models.
According to the pseudo-second-order constants in Table 2, EE2 (0.180–0.411 kg/(mg·h)) and E2 (0.224–0.571 kg/(mg·h)) showed the higher K2, followed by E1 (0152–0.398 kg/(mg·h)), whereas BPA exhibited the lowest Qe (4.77–13.2 mg/kg) and K2 (0.152–0.282 kg/(mg·h)). The adsorption of EE2, E2, and E1 in the four tested soils could reach the equilibrium within 10 h, and it continued to increase slightly until ultimately reaching the equilibrium for the adsorption of BPA (Figure 3). The slower adsorption rate of the BPA compared with the other target EDCs may be related to its weaker hydrophobicity and higher solubility in water. At the equilibrium, the adsorption rates of the tested soils for EE2, E2, E1, and BPA were 44.0–72.2%, 30.7–59.1%, 29.1–57.4%, and 14.9–41.2%, respectively. Meanwhile, the adsorbed Qe for each EDC followed the same order, S1 > S2 > S3 > S4, which was consistent with the order of the soil TOC content.
Among the four soils, the adsorption rate constant K2 of the target EDCs in S3 and S4 were notably higher compared with the K2 values for S1 and S2. This phenomenon could be explained by the difference in physical and chemical properties among the tested soils. Several mechanisms were involved during the sorption process. The fast adsorption of organic compounds may be attributed to the adsorption of organic compounds to mineral surfaces or partitioning into a ‘rubbery’ fraction of the soil OM, whereas the slow adsorption could be related to the gradual diffusion of organic compounds into soil micropores or into highly cross-linked regions of the soil OM [34,35]. As previously discussed, S3 and S4 from long-term exposed areas had considerably coarser fractions and a lower OM content, which resulted in less micropores in the soils and, consequently, faster pore filling and diffusion of EDCs.
As shown in Figure 3, compared with the adsorption process, the desorption of the four EDCs needed more time to reach equilibrium, and the trend of delay was apparent especially for EE2. Contrary to the adsorption process, the desorption in the tested soils was considerably easier for BPA to reach equilibrium than the other three EDCs, because the K2 values for the BPA desorption were markedly higher than the others (Table 3). Moreover, the amount of desorbed EDCs was less than the total amount of adsorbed EDCs, suggesting that some amount of EDC was tightly bound to the soil and did not readily desorb. This phenomenon of desorption hysteresis is discussed further in desorption isotherms.
3.3. Adsorption Isotherms and Nonlinearity
The adsorption isotherms for the EDCs in the tested soils are presented in Figure 4, and the parameters of the model fittings are summarized in Table 4. According to the comparison among the R2 values, the isotherms of the EDC adsorption in the concentration range tested on the soils could be better fitted by the Freundlich model, which assumes that EDC adsorption occurs on a heterogeneous surface with the possibility of adsorption being multi-layered [36]. For each studied soil, the four target EDCs exhibited the following trend of adsorption capacity (KF): EE2 > E2 > E1 > BPA, which was consistent with the order of their hydrophobicity (KOW). Three intermolecular interactions, including hydrophobic interaction, hydrogen bonding, and π–π bonding, are involved in EDC adsorption mechanisms [30]. In comparison with EE2, E2, and E1, BPA had a considerably lower KOW and higher Sw value, which possibly caused its weak affinity with soil organics and its lowest amount of adsorption by the tested soils. In addition, E2 and EE2 had one more hydroxyl group than E1, which could result in stronger hydrogen bonding and a corresponding higher KF.
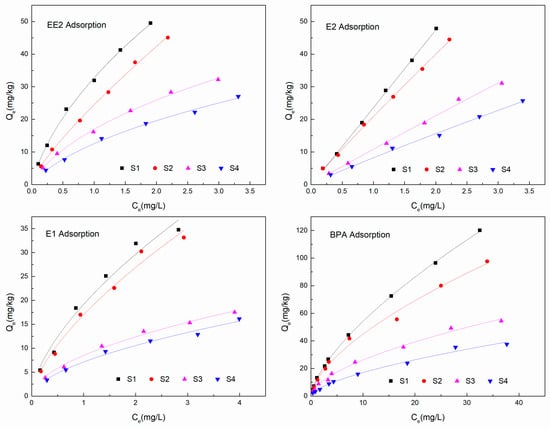
Figure 4.
Freundlich equation adsorption isotherms of target EDCs in tested soils (25 °C).
Table 4.
Parameters of model fitting of EDC adsorption in tested soils (25 °C).
As shown in Table 4, the Freundlich adsorption isotherms had a curvature index (n) that varied in the range of 0.661–0.774, 0.574–0.696, and 0.603–0.672 for EE2, E1, and BPA, respectively, exhibiting the apparent adsorption nonlinearity in the soils where high-energy sites were occupied first, followed by adsorption at lower-energy sites [37]. This phenomenon may also suggest that the adsorption for EE2, E1, and BPA would become saturated when the aqueous concentration of these EDCs increased. By contrast, all of the values of the isotherm linearity index (n, 0.903–0.976) for E2 were close to 1, indicating that the absorption of E2 on the tested soils was nearly linear and the adsorption capacity could continually increase with the aqueous concentration increasing.
A higher soil OM content usually results in a higher adsorption affinity [19]. In this study, the KF for each target EDC was in the same order, that is, S1 > S2 > S3 > S4, which was consistent with the order of the soil TOC content. This result was in general agreement with previous studies, and demonstrated again that OM was one of the most important properties of soil that affect their sorption capacity. In addition, the smaller fractions of soil generally exhibited the stronger adsorption capacity for HOCs [38]. The high adsorption capacity of S1 and S2 was also relevant to their clay fractions.
Moreover, not only the abundance but also the sources and properties of the soil OM affect the adsorption behavior of EDCs, such as the adsorption nonlinearity [39]. According to the n values in Table 4, the adsorption of each target EDCs on S3 and S4 exhibited a lower nonlinearity coefficient, and thus a stronger nonlinearity compared with S1 and S2. Previous studies have suggested that the sorption on hard carbon, especially the black carbon (BC), is dominated by nonlinear adsorption with a high adsorption affinity but limited capacity, whereas the adsorption on the soft carbon follows a partition mechanism and exhibits linear adsorption [40]. The dry and wet alternating can accelerate the degradation of soil OM; however, the water-level fluctuation condition has an advantageous role in preventing BC decomposition, and the BC in the WLFZ contained high amounts of carbon and low amounts of oxygen [41]. S3 and S4 had been exposed to air considerably longer than S1 and S2 at the sampling time, because of the operation of the TGR. Accordingly, the OM in S3 and S4 had been decayed to a further degree, with the BC remaining accumulated under the non-flood condition. The water-level fluctuation condition imposed on the TGR altered the soil organic decomposition and changed the degree of aromaticity, C/N, and H/C ratios of the OM [39,41], thereby fundamentally affecting the adsorption behavior, including the adsorption nonlinearity, of the soil. The high degrees of OM decay while retaining BC in S3 and S4 may have a close relation to their high degree of EDC adsorption nonlinearity.
Meanwhile, the obtained values of ΔG (Table 4) were all negative and considerably less than 40 kJ/mol. The EDC adsorption in the tested soils was dominated by unstable physical adsorption [42], with possible subsequent desorption back into the aquatic environment. Thus, the soil of the WLFZ should be considered as a long-term ‘source’, as well as a potential short-term ‘sink’ for EDCs.
3.4. Desorption Isotherms and Hysteresis
As the inverse process of adsorption, desorption plays an important role in determining the potential mobility of the EDCs. The desorption isotherms and the parameters are shown in Figure 5 and Table 5. The desorption of the target EDCs in the WLFZ was observed to be nonlinear, with n values of 0.446–0.822. Meanwhile, the HI measures the extent of hysteresis in the desorption step, and a larger HI corresponds to a lesser degree of hysteresis [43]. In this study, the HI values for the BPA (0.846–0.961) obtained in the tested soils were all close to 1, suggesting that weak or almost no desorption hysteresis was observed for BPA. Obvious desorption hysteresis was observed in the tested soils with values of 0.676–0.819, 0.652–0.862, and 0.576–0.682 for E1, E2, and EE2, respectively. The HI values indicated that EE2 exhibited the strongest desorption hysteresis, whereas the BPA adsorbed to the tested soils was unstable and the easiest to liberate, which was consistent with the previously discussed findings on desorption kinetics. The HI values obtained in this study were generally high, indicating the lack of high-energy combination between target EDCs and the tested soils, which was also consistent with the conclusion of physical adsorption.
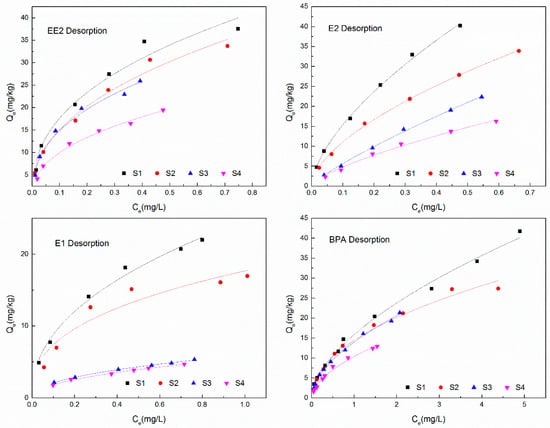
Figure 5.
Freundlich equation desorption isotherms of target EDCs in tested soils (25 °C).
Table 5.
Parameters of Freundlich desorption of EDCs in tested soils (25 °C).
Moreover, the HI values of the four EDCs were relatively lower in S1 and S2 compared with the values for the other two soils (Table 5). Pore deformation caused by the solute-diffusion through soil OM matrixes (especially in hard carbon) and porosities were suggested to be responsible for the hysteresis [44], which resulted in the pathway of desorption being different from the pathway of adsorption, and leading to entrapment of some sorbate during desorption. The difference in the degree of hysteresis among the tested soils may be attributed to the fact that S1 and S2 were of smaller particle sizes with more OM, whereas S3 and S4 were of higher fraction of sand and lower OM content.
4. Conclusions
This study discussed the adsorption and desorption of four target EDCs (i.e., E1, E2, EE2, and BPA) in periodically submerged soils collected from the WLFZ of TGR, where the rapid transfer of pollutants between water and terrain environment, caused by the cycle of water fluctuation, is of great concern. The results showed that the soil samples collected at different elevation gradients of the WLFZ varied significantly in physiochemical properties, mainly due to the different dry–wet alternate conditions, making the absorption/desorption behaviors of EDCs varied among soils. The pseudo-second-order model fitted the kinetics of the adsorption and desorption excellently, whereas the adsorption and desorption isotherms of the four EDCs could be well described by Freundlich model. Overall, EE2 exhibited the fastest adsorption rate and slowest desorption rate, whereas BPA showed the lowest adsorption rate yet was the easiest to desorb. The adsorption capacity of EDCs in each tested soil took the order of BPA < E1 < E2 < EE2, and the adsorption capacity decreased as S1 > S2 > S3 > S4 for each tested EDC. Except for E2, the adsorption of the other three EDCs exhibited apparent nonlinearity in the tested soils, with a stronger adsorption nonlinearity occurring in S3 and S4 from the long-term exposed areas. In addition, S1 and S2 from the frequent inundation areas exhibited a higher degree of desorption hysteresis for E1, E2, and EE2, whereas almost no desorption hysteresis was observed for BPA. The results from this case study suggested that water-level fluctuation may influence EDC adsorption/desorption by altering the soil physiochemical properties, and the effects would be continuous with the operation of the TGR. Long-term and intensive studies on EDC migration are essential for the sustainable management of water quality in the TGR.
Author Contributions
Y.H. and J.S. conceived and designed the experiments; Y.H. and X.M. performed most experiments; Q.Y. contributed reagents/materials/analysis tools; Y.H. and Q.C. conducted data analyses; J.F. contributed to the discussion; and Y.H. wrote the paper.
Funding
This research was funded by [the National Natural Science Foundation of China] grant number [51508056 and 51508057], [the Key Laboratory of Hydraulic and Waterway Engineering of the Ministry of Education Foundation] grant number [SLK2017B04], [the Natural Science Foundation of Chongqing of China] grant number [cstc2018jcyjAX0054], and [the Supporting Program of the Scientific Foundation Project of Chongqing Sci & Tech Committee] grant number [cstc2015jcyjBX0041].
Conflicts of Interest
The authors declare no conflict of interest.
References
- Giulivo, M.; De Alda, M.L.; Capri, E.; Barceló, D. Human exposure to endocrine disrupting compounds: Their role in reproductive systems, metabolic syndrome and breast cancer. A review. Environ. Res. 2016, 151, 251–264. [Google Scholar] [CrossRef] [PubMed]
- Hauser, R.; Skakkebaek, N.E.; Hass, U.; Toppari, J.; Juul, A.; Andersson, A.M. Male reproductive disorders, diseases, and costs of exposure to endocrine-disrupting chemicals in the European Union. J. Clin. Endocrinol. Metab. 2015, 100, 1267–1277. [Google Scholar] [CrossRef] [PubMed]
- Choi, J.; Eom, J.; Kim, J.; Lee, S.; Kim, Y. Association between some endocrine-disrupting chemicals and childhood obesity in biological samples of young girls: A cross-sectional study. Environ. Toxicol. Pharmacol. 2014, 38, 51–57. [Google Scholar] [CrossRef] [PubMed]
- Gorga, M.; Insa, S.; Petrovic, M.; Barceló, D. Occurrence and spatial distribution of EDCs and related compounds in waters and sediments of Iberian rivers. Sci. Total Environ. 2015, 503, 69–86. [Google Scholar] [CrossRef] [PubMed]
- Thomson, B.M.; Grounds, P.R. Bisphenol A in canned foods in New Zealand: An exposure assessment. Food Addit. Contam. 2005, 22, 65–72. [Google Scholar] [CrossRef] [PubMed]
- Rudel, R.A.; Perovich, L.J. Endocrine disrupting chemicals in indoor and outdoor air. Atmos. Environ. 2009, 43, 170–181. [Google Scholar] [CrossRef] [PubMed]
- Duong, C.N.; Jinsung, R.; Jaeweon, C.; Kim, S.D.; Choi, H.K. Estrogenic chemicals and estrogenicity in river waters of South Korea and seven Asian countries. Chemosphere 2010, 78, 286–293. [Google Scholar] [CrossRef] [PubMed]
- Weber, J.W., Jr.; Mcginley, P.M.; Katz, L.E. Sorption phenomena in subsurface systems: Concepts, models and effects on contaminant fate and transport. Water Res. 1991, 25, 499–528. [Google Scholar] [CrossRef]
- Bao, Y.; Gao, P.; He, X. The water-level fluctuation zone of Three Gorges Reservoir—A unique geomorphological unit. Earth Sci. Rev. 2015, 150, 14–24. [Google Scholar] [CrossRef]
- Peng, C.R.; Lang, Z.; Qin, H.J.; Li, D.H. Revegetation in the water level fluctuation zone of a reservoir: An ideal measure to reduce the input of nutrients and sediment. Ecol. Eng. 2014, 71, 574–577. [Google Scholar] [CrossRef]
- Ye, C.; Li, S.; Zhang, Y.; Zhang, Q. Assessing soil heavy metal pollution in the water-level-fluctuation zone of the Three Gorges Reservoir, China. J. Hazard. Mater. 2011, 191, 366–372. [Google Scholar] [CrossRef] [PubMed]
- Liu, J.; Jiang, T.; Huang, R.; Wang, D.; Zhang, J.; Qian, S.; Yin, D.; Chen, H. A simulation study of inorganic sulfur cycling in the water level fluctuation zone of the Three Gorges Reservoir, China and the implications for mercury methylation. Chemosphere 2017, 166, 31–40. [Google Scholar] [CrossRef] [PubMed]
- Zhang, B.; Fang, F.; Guo, J.; Chen, Y.; Li, Z.; Guo, S. Phosphorus fractions and phosphate sorption-release characteristics relevant to the soil composition of water-level-fluctuating zone of Three Gorges Reservoir. Ecol. Eng. 2012, 40, 153–159. [Google Scholar] [CrossRef]
- Zhao, Y.; Wu, B.F.; Zeng, Y. Spatial and temporal aspects of greenhouse gas emissions from Three Gorges Reservoir, China. Biogeosci. Discuss. 2012, 9, 14503–14535. [Google Scholar] [CrossRef]
- Tang, Y.M.; Junaid, M.; Niu, A.; Deng, S.; Pei, D.S. Diverse toxicological risks of PAHs in surface water with an impounding level of 175 m in the Three Gorges Reservoir Area, China. Sci. Total Environ. 2016, 580, 1085–1096. [Google Scholar] [CrossRef] [PubMed]
- Floehr, T.; Scholz-Starke, B.; Xiao, H.; Koch, J.; Wu, L.; Hou, J.; Wolf, A.; Bergmann, A.; Bluhm, K.; Yuan, X.; et al. Yangtze Three Gorges Reservoir, China: A holistic assessment of organic pollution, mutagenic effects of sediments and genotoxic impacts on fish. J. Environ. Sci. 2015, 38, 63–82. [Google Scholar] [CrossRef] [PubMed]
- Hu, T.; Zhang, J.; Ye, C.; Zhang, L.; Xing, X.; Zhang, Y.; Wang, Y.; Sun, W.; Qi, S.; Zhang, Q. Status, source and health risk assessment of polycyclic aromatic hydrocarbons (PAHs) in soil from the water-level-fluctuation zone of the Three Gorges Reservoir, China. J. Geochem. Explor. 2017, 172, 20–28. [Google Scholar] [CrossRef]
- Loffredo, E. Fate of anthropogenic organic pollutants in soils with emphasis on adsorption/desorption processes of endocrine disruptor compounds. Pure Appl. Chem. 2006, 78, 947–961. [Google Scholar] [CrossRef]
- Sun, K.; Gao, B.; Zhang, Z.Y.; Zhang, G.X.; Liu, X.T. Sorption of endocrine disrupting chemicals by condensed organic matter in soils and sediments. Chemosphere 2010, 80, 709–715. [Google Scholar] [CrossRef] [PubMed]
- Lima, D.L.; Schneider, R.J.; Esteves, V.I. Sorption behavior of EE2 on soils subjected to different long-term organic amendments. Sci. Total Environ. 2012, 423, 120–124. [Google Scholar] [CrossRef] [PubMed]
- Bonin, J.L.; Simpson, M.J. Sorption of steroid estrogens to soil and soil constituents in single- and multi-sorbate systems. Environ. Toxicol. Chem. 2007, 26, 2604–2610. [Google Scholar] [CrossRef] [PubMed]
- Stumpe, B.; Marschner, B. Dissolved organic carbon from sewage sludge and manure can affect estrogen sorption and mineralization in soils. Environ. Pollut. 2010, 158, 148–154. [Google Scholar] [CrossRef] [PubMed]
- Jia, G.; Liu, X. Soil microbial biomass and metabolic quotient across a gradient of the duration of annually cyclic drainage of hillslope riparian zone in the three gorges reservoir area. Ecol. Eng. 2017, 99, 366–373. [Google Scholar] [CrossRef]
- Reoyo-Prats, B.; Aubert, D.; Menniti, C.; Ludwig, W.; Sola, J.; Pujo-Pay, M.; Conan, P.; Verneau, O.; Palacios, C. Multicontamination phenomena occur more often than expected in Mediterranean coastal watercourses: Study case of the Têt River (France). Sci. Total Environ. 2017, 579, 10–21. [Google Scholar] [CrossRef] [PubMed]
- Li, Q.; Luo, Y.; Wang, C.; Li, B.; Zhang, X.; Yuan, D.; Gao, X.; Zhang, H. Spatiotemporal variations and factors affecting soil nitrogen in the purple hilly area of Southwest China during the 1980s and the 2010s. Sci. Total Environ. 2016, 547, 173–181. [Google Scholar] [CrossRef] [PubMed]
- Defersha, M.B.; Melesse, A.M. Effect of rainfall intensity, slope and antecedent moisture content on sediment concentration and sediment enrichment ratio. Catena 2012, 90, 47–52. [Google Scholar] [CrossRef]
- Zeng, F.Y.; Jia, G.M.; Chen, F.Q.; Cao, L. The Effect of Different Flooding Duration on Soil Organic Carbon and its Labile Fraction in the Riparian Zone of Three Gorges Reservoir Area. Adv. Mater. Res. 2013, 726, 3757–3761. [Google Scholar] [CrossRef]
- Tang, X.; Wu, M.; Li, Q.; Lin, L.; Zhao, W. Impacts of water level regulation on sediment physic-chemical properties and phosphorus adsorption–desorption behaviors. Ecol. Eng. 2014, 70, 450–458. [Google Scholar] [CrossRef]
- Zhang, B.; Guo, J.S.; Fang, F.; Li, Z.; Fu, C. Concentration of nutrients in the soil in water-level-fluctuating zone of three gorges reservoir. Ecohydrol. Hydrobiol. 2012, 12, 105–114. [Google Scholar] [CrossRef]
- Li, J.; Jiang, L.; Liu, X.; Lv, J. Adsorption and aerobic biodegradation of four selected endocrine disrupting chemicals in soil–water system. Int. Biodeterior. Biodegrad. 2013, 76, 3–7. [Google Scholar] [CrossRef]
- Martínezhernández, V.; Meffe, R.; Herrera, L.S.; De, B.I. The role of sorption and biodegradation in the removal of acetaminophen, carbamazepine, caffeine, naproxen and sulfamethoxazole during soil contact: A kinetics study. Sci. Total Environ. 2016, 559, 232–241. [Google Scholar] [CrossRef] [PubMed]
- Shen, D.Z.; Fan, J.X.; Zhou, W.Z.; Gao, B.Y.; Yue, Q.Y.; Qi, K. Adsorption kinetics and isotherm of anionic dyes onto organo-bentonite from single and multisolute systems. J. Hazard. Mater. 2009, 172, 99–107. [Google Scholar] [CrossRef] [PubMed]
- Apul, O.G.; Karanfil, T. Adsorption of synthetic organic contaminants by carbon nanotubes: A critical review. Water Res. 2015, 68, 34–55. [Google Scholar] [CrossRef] [PubMed]
- Huang, W.; Thomas, M.Y.; Mark, A.S.; Yu, H., Jr.; Weber, W.J. A Distributed Reactivity Model for Sorption by Soils and Sediments. 9. General Isotherm Nonlinearity and Applicability of the Dual Reactive Domain Model. Environ. Sci. Technol. 1996, 26, 3549–3555. [Google Scholar] [CrossRef]
- And, J.J.P.; Xing, B. Mechanisms of Slow Sorption of Organic Chemicals to Natural Particles. Environ. Sci. Technol. 1996, 30, 1–11. [Google Scholar]
- Fuentes, B.; de la Luz Mora, M.; Bol, R.; San Martin, F.; Pérez, E.; Cartes, P. Sorption of inositol hexaphosphate on desert soils. Geoderma 2014, 232–234, 573–580. [Google Scholar] [CrossRef]
- Sukul, P.; Lamshöft, M.; Zühlke, S.; Spiteller, M. Sorption and desorption of sulfadiazine in soil and soil-manure systems. Chemosphere 2008, 73, 1344–1350. [Google Scholar] [CrossRef] [PubMed]
- Thielebruhn, S.; Seibicke, T.; Schulten, H.R.; Leinweber, P. Sorption of sulfonamide pharmaceutical antibiotics on whole soils and particle-size fractions. J. Environ. Qual. 2004, 33, 1331–1342. [Google Scholar] [CrossRef]
- Fei, Y.; Xing, B.; Li, X. Changes in the adsorption of bisphenol A, 17 α-ethinyl estradiol, and phenanthrene on marine sediment in Hong Kong in relation to the simulated sediment organic matter decomposition. Environ. Pollut. 2014, 192, 139–146. [Google Scholar] [CrossRef] [PubMed]
- Pan, B.; Ning, P.; Xing, B. Part IV—sorption of hydrophobic organic contaminants. Environ. Sci. Pollut. Res. Int. 2008, 15, 554–564. [Google Scholar] [CrossRef] [PubMed]
- Hao, R.; Wang, P.; Wu, Y.; Hu, R.; Zhang, J.; Song, Y. Impacts of water level fluctuations on the physicochemical properties of black carbon and its phenanthrene adsorption-desorption behaviors. Ecol. Eng. 2017, 100, 130–137. [Google Scholar] [CrossRef]
- Oepen, B.V.; Kördel, W.; Klein, W. Sorption of nonpolar and polar compounds to soils: Processes, measurements and experience with the applicability of the modified OECD-Guideline 106. Chemosphere 1991, 22, 285–304. [Google Scholar] [CrossRef]
- Yuan, G.S.; Xing, B.S. Effects of metal cations on sorption and desorption of organic compounds in humic acids. Soil Sci. 2001, 166, 205–208. [Google Scholar] [CrossRef]
- Lesan, H.M.; Bhandari, A. Atrazine sorption on surface soils: Time-dependent phase distribution and apparent desorption hysteresis. Water Res. 2003, 37, 1644–1654. [Google Scholar] [CrossRef]
© 2018 by the authors. Licensee MDPI, Basel, Switzerland. This article is an open access article distributed under the terms and conditions of the Creative Commons Attribution (CC BY) license (http://creativecommons.org/licenses/by/4.0/).