
Article

Evaluation of the 3 Min Walk Test as a Distinct Measure of Functional Capacity in Healthy Singaporean Adults: A Cross-Sectional Analysis

1
Health and Social Sciences Cluster, Singapore Institute of Technology, Singapore 168693, Singapore
2
Allied Health, Singhealth Polyclinic, Singapore 150167, Singapore
*
Author to whom correspondence should be addressed.
These authors contributed equally to this work.
Trends Public Health 2026, 1(2), 8; https://doi.org/10.3390/tph1020008
Submission received: 10 April 2026 / Revised: 6 June 2026 / Accepted: 30 June 2026 / Published: 15 July 2026

Abstract

Background: The 6 min walk test (6MWT) is the gold standard for field-based functional assessment, yet the 3 min walk test (3MWT) offers a time-efficient alternative. However, a lack of localised normative reference values (NRV) and an over-reliance on simple 6 min extrapolation limit its clinical utility. Objectives: To establish the NRV and reference equations for the 3MWT in a healthy cohort and investigate the physiological relationship between 3 min performance and 6 min predictions. Methods: This cross-sectional study recruited healthy community-dwelling adults (aged 20 to 80, BMI < 27.5 kg/m2). Participants performed two 3MWT trials on a 30 m indoor course. Primary outcomes included the best 3MWT and physiological parameters. Reference equations were derived using multiple linear regression. Results: In total, 240 participants were recruited with an overall median 3MWT of 290 metres (m) (IQR 257.0–323.0). Males walked significantly farther than females (p = 0.002). While 3MWT remained stable across age decades in males (p = 0.225), females’ performance declined with age (p = 0.005). Older adults maintained walking distances comparable to younger cohorts by operating at a higher relative percentage of their predicted maximum heart rate and exhibiting prolonged recovery profiles. Doubling the 3MWT significantly overestimated 6 min capacity (p < 0.001), highlighting non-linear pacing strategies. Conclusions: This study provides the first age- and gender-specific NRV for the 3MWT in Singapore, supporting its use as a rapid functional walking assessment tool in healthy adults. The findings suggest that the 3MWT should not be interpreted as a direct linear surrogate for the 6MWT. Further research is required to validate these reference equations externally and determine their clinical sensitivity in disease populations.

1. Introduction

Submaximal field walking tests, such as the 6 min walk test (6MWT), are essential functional assessments to evaluate an individual’s capacity for daily activities and overall physical performance [1,2], by providing valuable insights into an individual’s endurance and functional capacity, particularly in clinical populations. Field walking tests are accessible, carry a lower risk than maximal tests [3], and are particularly beneficial for older patients [4] or those with heart failure or chronic respiratory diseases [2]. While the 6MWT remains the gold standard for assessing mortality risk and prescribing exercise intensity, establishing normative data provides a vital comparative framework for clinical practice [5]. Benchmarking walking test results against population norms enables clinicians to gauge the severity of a condition, tailor treatments, and enhance patient motivation and adherence. However, certain populations are unable to complete the 6MWT due to severe dyspnoea or fatigue, suggesting that the 3MWT may be a more feasible, time-efficient alternative.
The 3MWT correlates strongly with the 6MWT and is particularly useful for individuals with limitations that hinder completion of longer tests [6]. Its reliability and clinical applicability make it an effective tool for assessing functional capacity in diverse populations, especially among the obese [6], paediatric [7], and geriatric [8] populations, as well as those with respiratory conditions [9]. Physiologically, short-duration walking tests may place greater emphasis on early acceleration, pacing and habitual walking velocity, whereas the 6MWT is better understood as a submaximal test that reflects integrated cardiopulmonary and musculoskeletal capacity [2]. Consequently, the 3MWT is especially beneficial in clinical settings where time and patient tolerance are critical factors, providing a practical alternative to traditional walking tests.
Several studies from Belgium [7], Turkey [6], and Japan [8] have derived normative reference values (NRV) and reference equations to estimate the 3MWT in their populations. Key determinants of performance include age and height [7]. Yet these foreign models cannot be applied accurately to local contexts due to significant variations in sample characteristics and test methodologies; such differences have been shown consistently in the local context, such as in the case of 6MWT [10], incremental shuttle walk [11], and timed-up-and-go tests [12]. Culturally, habitual physical activity levels and urban environments vary drastically between European and Asian cohorts. Anatomically, distinct anthropometric differences [13], such as the characteristically shorter stature, directly alter step frequency and stride length, potentially influencing the total 3MWT distance. Furthermore, existing international studies exhibit vast methodological disparities; differences in corridor lengths [ranging from 20 to 50 metres (m)] [1,2] and varying pacing instructions (brisk versus self-paced) [14] limit their comparative validity. Crucially, much of this surrounding literature remains limited by narrow age stratification that fails to capture full lifespan trajectories, a lack of standardisation regarding trial learning effects, and an unverified assumption of linear equivalence between 3 and 6 min test durations.
Beyond these geographical disparities, existing international reference equations for the 3MWT exhibit distinct structural limitations that restrict their broader clinical utility. Many historical cohorts were constrained to narrow, isolated age bands, predominantly paediatric or geriatric groups, thereby failing to capture the non-linear functional trajectories that span the full adult lifespan. Furthermore, previous studies frequently overlooked the confounding influence of systematic learning effects between successive trials. Critically, much of the surrounding literature operates on the unverified assumption of a uniform, linear relationship with the 6MWT, mathematically extrapolating data without empirically evaluating duration-dependent pacing dynamics or acute cardiorespiratory strain. These collective methodological gaps underscore the necessity of establishing robust, lifespan-spanning reference values using highly standardised, multi-trial protocols.
To date, no local studies have investigated the NRV for the 3MWT, leaving a significant gap in the objective assessment of functional exercise capacity within the Singaporean population. Relying on foreign benchmarks or existing local 6MWT equations compromises assessment accuracy, potentially leading to over- or underestimation of functional impairment. Establishing these values is crucial for clinical application. By addressing the lack of localised anthropometric and demographic data, this study provides a vital framework for more precise, culturally relevant interpretations of 3MWT performance.
Hence, this study aims to: (1) evaluate the NRV of the 3MWT in a healthy population, stratified by gender and age groups; (2) determine the univariate correlations of demographic, anthropometric and physiological variables that influence 3MWT performance; (3) establish 3MWT reference equations applicable to healthy adults using both pre- and post-test predictive variables; (4) evaluate the clinical utility of the 3MWT by comparing age-matched local data with established 6MWT reference values.

2. Materials and Methods

2.1. Study Design

This cross-sectional study utilised convenience sampling with a targeted age-and-gender stratification framework across six decades (21 to 80 years) to evaluate community-dwelling healthy adults. Participants were recruited via community outreach, public notices, and word-of-mouth across multiple regional districts in Singapore to enhance population representation. Data collection was conducted between March 2024 and November 2025. The University Institutional Review Board granted ethical approval (RECAS-0253 & RECAS-0514). All procedures were performed in accordance with local institutional guidelines and regulations.
All participants provided voluntary written informed consent before data collection. Data collection was conducted within university facilities by trained investigators proficient in administering the 3MWT and related functional assessments. All measurements for each participant were completed within a single session, with no further follow-up required.

2.2. Participants

2.2.1. Sample Size Estimation and Justification

The sample size was determined to ensure sufficient power to develop a robust 3MWT reference equation and establish the NRV across the adult lifespan. Using a stratified sampling strategy, we aimed to recruit at least 20 participants per gender per decade across six age strata (21 to 80 years), for an ideal total target of 240 participants. While this recruitment target was fully achieved in the younger cohorts, the final sample reflected a lower field with the older stratum due to strict exclusion criteria and participant sign-up response. Despite these subgroup variations, the final aggregate sample (N = 240) remains highly robust for the primary statistical modelling. An a priori power analysis using G*Power (v3.1.9.7) for multivariable linear regression indicated that with a medium effect size (f2 = 0.15), α = 0.05 and up to 10 predictors, a sample of N = 118 is required to achieve a power of 0.95. The sample size (n = 240) comfortably exceeds the requirements, ensuring excellent model stability. The 10 independent variables were predefined based on clinical covariates known to influence walking distance (demographics, anthropometrics, and physiological responses). This satisfies the multivariable linear regression analysis (N ≥ 50 + 8k, where k is the number of predictors) [15], maintaining a 24:1 participant-to-variable ratio to prevent overfitting. Additionally, the target of n = 20 per gender cell (n = 40 per decade) provides adequate statistical precision to construct stable 95% confidence intervals for population norms, given a previously reported median 3MWT of 316 metres [Interquartile range (IQR) 282.5 to 336.8] [16]. This sample size provides sufficient precision to establish reliable clinical equations for the local population.

2.2.2. Inclusion and Exclusion Criteria

The Physical Activity Readiness Questionnaire for Everyone+ (PAR-Q+) first screened healthy adults [17], with the following inclusion criteria: (1) community-dwelling adults aged 20 to 80 years; (2) Body mass index (BMI) < 27.5 kg/m2 [18]; (3) ability to walk independently for three minutes without the use of walking aids; (4) proficiency in English to comprehend test instructions. Health status and medical history, including current medication use, were evaluated via this standardised self-report screening tool. Participants were excluded if they: (1) indicated “Yes” to any medical follow-up questions on the PAR-Q+, which included screening for regular prescription medications for chronic diseases; (2) presented with abnormal resting haemodynamic, defined as systolic blood pressure (SBP) ≤ 90 mmHg or ≥140 mmHg, and/or diastolic blood pressure (DBP) ≤ 60 mmHg or ≥80 mmHg; (3) reported any uncontrolled cardiovascular, neuromuscular, musculoskeletal, or metabolic conditions that could impair functional exercise capacity; (4) reported a fever or temporary illness within the past 24 h before testing. The BMI threshold of <27.5 kg/m2 was deliberately chosen in accordance with the World Health Organisation (WHO) guidelines for the Asian population, which define a BMI ≥ 27.5 kg/m2 as clinical obesity. Given that obesity is classified as a chronic metabolic disease by the WHO, this cut-off was essential to isolate the genuinely healthy, non-obese cohort, ensuring the derived reference values represent true normative physiological capacity. Furthermore, the resting BP cut-off aligns with contemporary international hypertension guidelines [19], thereby excluding individuals with early-stage, undiagnosed cardiovascular disease. Although the protocol allowed exclusion if data collection was terminated due to adverse reactions during the 3MWT, no participants were excluded during the study period.

2.3. 3-Min Walk Test (3MWT)

The 3MWT was conducted in accordance with established 6 min walk test guidelines [1,2], and adapted for a 3 min duration [16,19]. The test took place on a sheltered, 30 m straight walkway marked with cones at the 0 and 30 m points. Chairs were positioned at both ends and at the 15 m midpoint for participant safety and rest. Participants rested in a seated position for at least 5 min before the trial. Baseline measurements, including blood pressure (BP), pulse rate (PR), and oxygen saturation (SpO2) via pulse oximetry, were recorded. The Borg Rating of Perceived Exertion scale (RPE) [20] was explained, and initial resting scores were obtained.
The following standardised instructions were provided to all participants:
“The objective of this test is to walk as far as possible for 3 min. You will walk back and forth in this walkway. You are permitted to slow down, stop, and rest as necessary; you may sit down, but should resume walking as soon as you can. You should pivot briskly around the cones and continue back the other way without hesitation. Remember that the goal of this test is to walk as far as possible for 3 min, but do not run or jog.”
Standardised verbal encouragement was provided at 30 s intervals, using the phrases “You are doing well” and “keep up the good work” alternately. At the 2 min and 45 s mark, a final reminder of the remaining time was given to maintain consistent motivation. At the end of the test, participants were asked to stand where they stopped, and a chair was brought to them so that they could sit and rest. Two trials were administered to account for the learning effect, separated by a minimum 15 min rest period. To ensure complete physiological recovery between trials, particularly for older or less conditioned adults, the initiation of the second trial was strictly conditional upon the participant’s vital signs (heart rate and blood pressure) returning to within ±10% of their baseline resting values, alongside a subjective return to a resting Borg RPE score. An additional rest extension was provided upon request to ensure that vital signs returned to baseline before the second trial. The total distance was recorded in metres (m). For all data analyses, the greater distance achieved between the two trials (the best distance) was used.

2.4. Data Collection

Participants were instructed to attend the session in comfortable clothing and appropriate walking shoes. Before data collection, participants provided physical profiles, including PAR-Q+, anthropometric measurements, height (m) and weight [kilograms (kg)], with BMI calculated using the standard formula: BMI = weight (kg)/height (m)2. Resting haemodynamic parameters, including BP, PR, and SpO2, were measured using an Omron® portable blood pressure monitor (EZ | HEM-7183) (Omron, Kyoto, Japan) and a Nellcor® pulse oximeter (PM10N) (Nellcor, Hayward, CA, USA). To assess the physiological intensity of the test, the following cardiovascular variables were derived: Predicted Maximum HR (HRmax) calculated using HRmax = 208 − (0.7 × Age) [21]; while the HR Reserve (HRR) was calculated as the difference between HRmax and the resting HR (HRrest): HRR = HRmax − HRrest. Additionally, Percentage of Predicted Maximum Heart Rate (%predHRmax) = (Highest HR during 3MWT/HRmax) × 100%. Perceived exertion was assessed with the RPE scale [20]. To ensure validity, the scale was explained using the repeat-back method, confirming each participant’s understanding of the scoring system before recording pre- and post-test RPE values.

2.5. Pilot Trial and Reliability

A pilot trial (n = 30) was conducted using the main study’s eligibility criteria to familiarise the team with the protocol and evaluate the intra- and inter-rater reliability of the 3MWT. To assess reliability, each pilot participant underwent three 3MWT trials. Data was collected concurrently and independently by the investigators. Since the operational protocol, testing environment, and eligibility criteria were identical to those of the main study, these 30 participants were pooled in the final analysis to maximise statistical power. To ensure full methodological consistency with the full-scale cohort, only the first two trials from the pilot participants were utilised to extract the optimal walking distance for the primary analysis.

2.6. Full-Scale Study

Following the successful completion of the pilot phase, the full-scale study was initiated using the identical inclusion and exclusion criteria. All participants completed two trials of the 3MWT. For all 240 participants across both phases, the longest distance achieved between the first two standardised trials was taken as the primary outcome measure.

2.7. Statistical Analysis

Statistical analysis was performed using GraphPad Prism Version 8.4.3, with a significance level of p < 0.05. Data normality was assessed using the Shapiro–Wilk test. Descriptive statistics included the mean and standard deviation (SD), median and IQR, and 95% confidence interval (95% CI) for the median. Differences between genders were analysed using the Mann–Whitney U test, with the Point-Biserial correlation (r) as the effect size, while the Kruskal–Wallis test evaluated differences across age groups. The strength of r was categorised as very weak (0.00 to 0.19), weak (0.20 to 0.39), moderate (0.40 to 0.59), strong (0.60 to 0.79) or very strong (0.80 to 1.00). Intra- and inter-rater reliability were evaluated using two-way mixed-effects, absolute agreement, and single-measure intraclass correlation coefficients (ICC). To ensure objectivity during reliability testing, distance measurements were standardised using a pre-marked corridor and measurement wheel rounded strictly to the nearest 0.1 metre. ICC values were interpreted as follows: <0.50 indicated poor reliability; 0.50–0.75, moderate reliability; 0.75–0.90, good reliability; and >0.90, excellent reliability [22]. Spearman’s correlation coefficient (ρ) determined the strength of the relationship between 3MWT and independent variables. The strength of the correlation (ρ) was interpreted as follows: negligible (<0.30), low (0.30–0.49), moderate (0.50–0.69), high (0.70–0.89), and very high (≥0.90) [23]. Multiple linear regression analysis with a forward stepwise selection method was used to develop reference equations for the 3MWT based on pre- and post-test variables. Before final model acceptance, the regression assumptions of linearity and normality of the residuals were verified by inspecting residual plots. To avoid multicollinearity, independent variables with high conceptual and mathematical redundancy were restricted from entering the same model. To compare the measured 3MWT against two predicted distances derived from established reference equations [13,14], the Friedman test was employed, followed by Dunn’s post hoc test with Bonferroni adjustment to account for multiple comparisons and maintain the family-wise error rate at p < 0.05.

3. Results

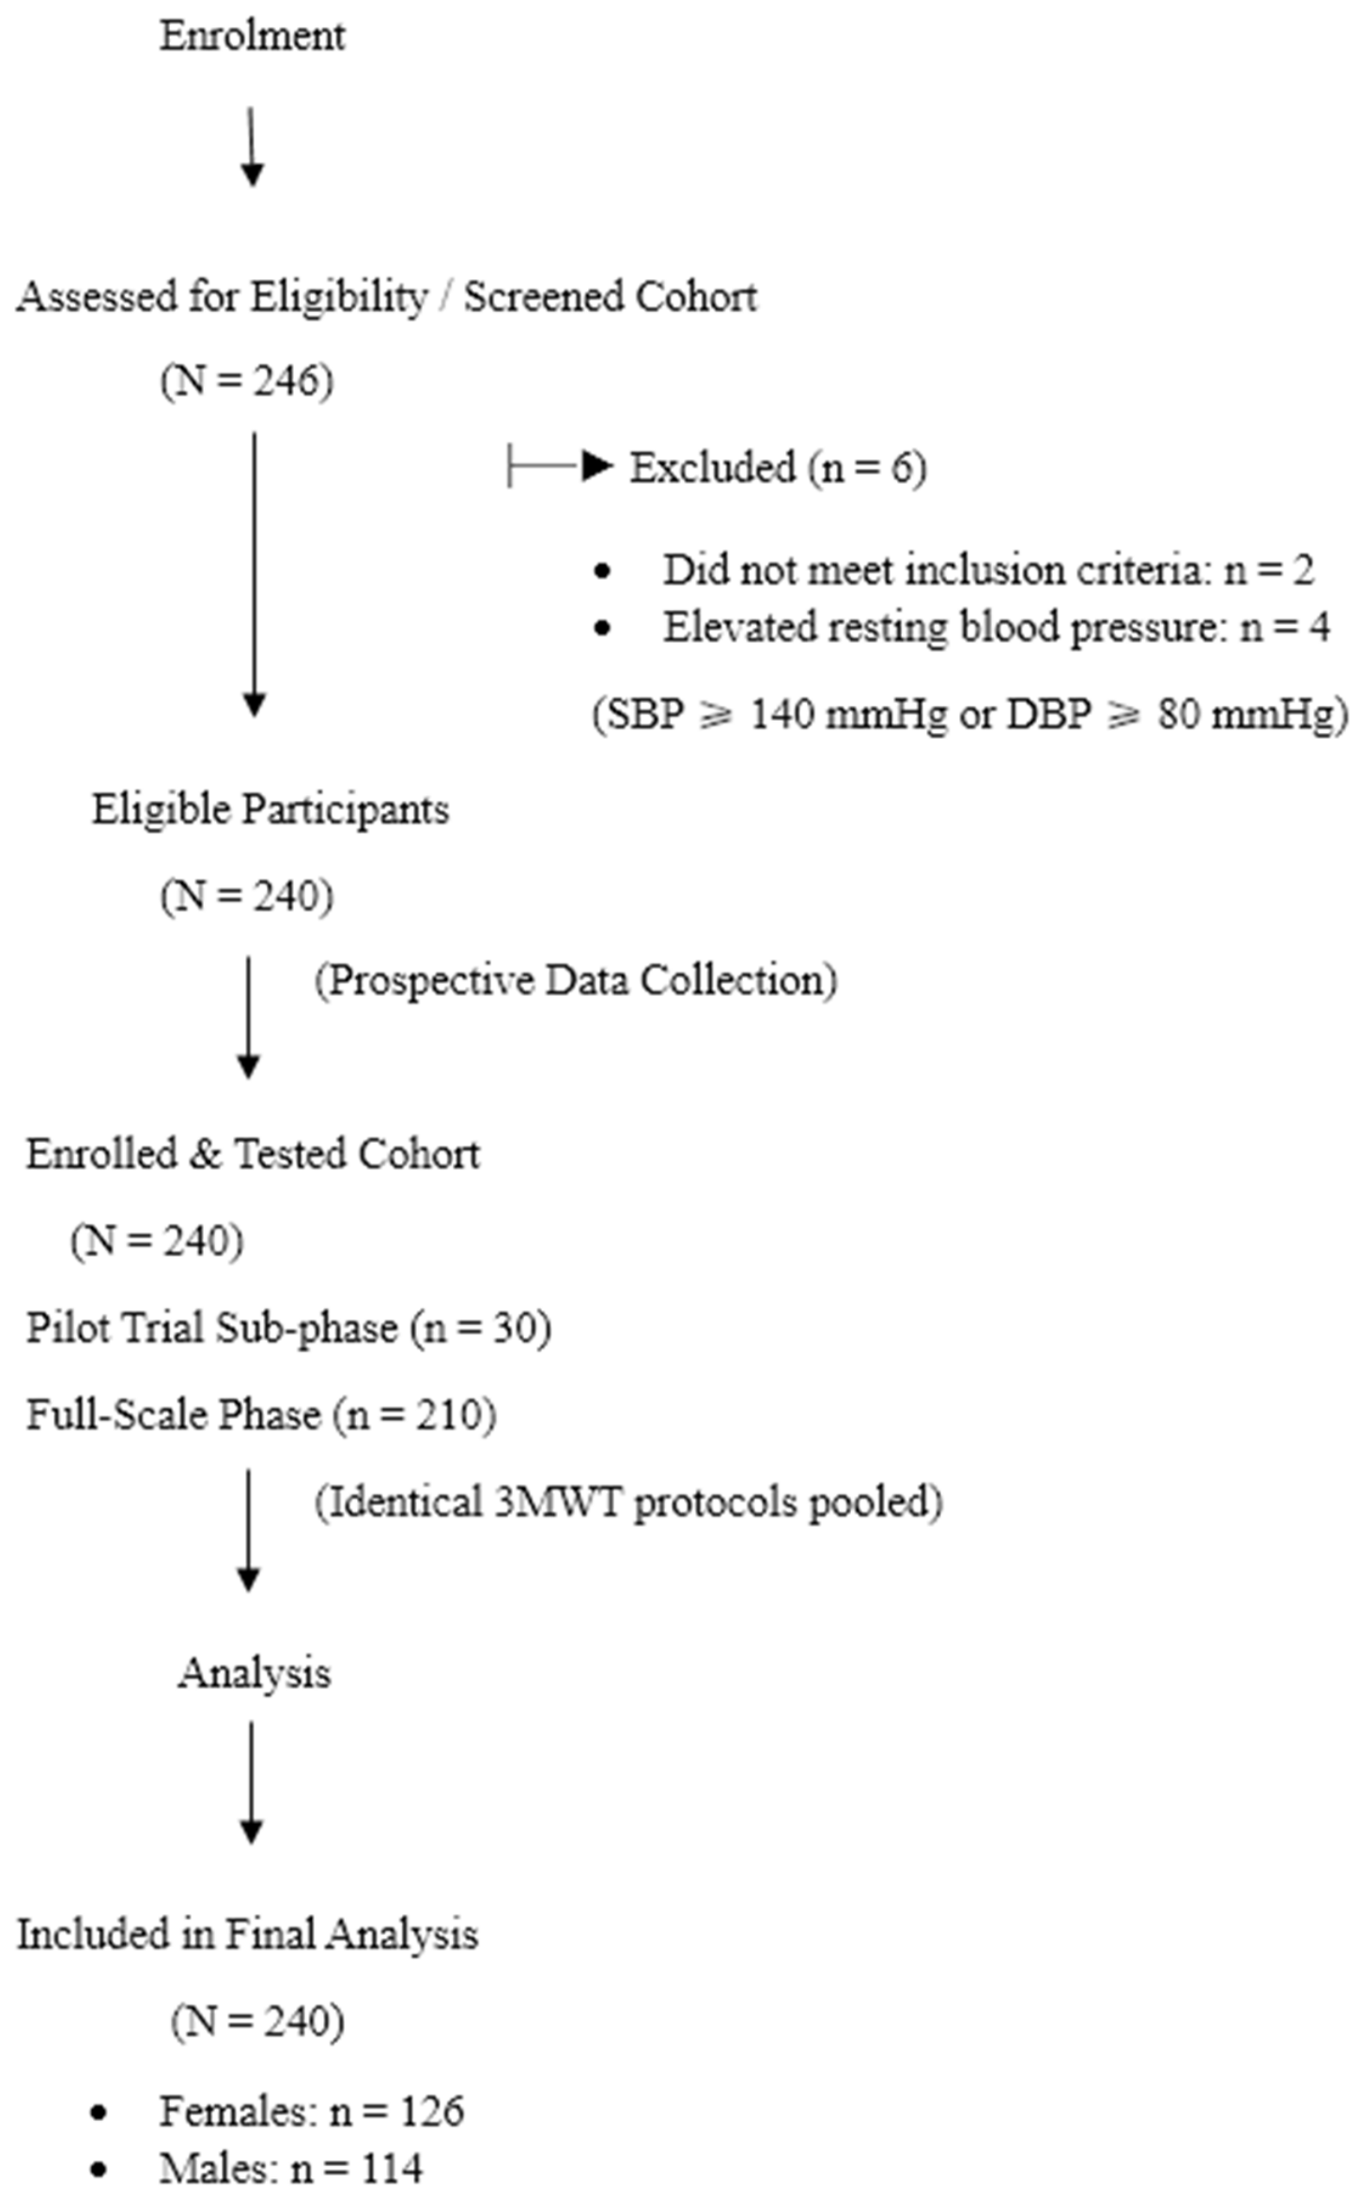
Figure 1 illustrates the participant recruitment and flow. Of the 246 participants screened, six were excluded, resulting in a final sample of 240 (males: n = 114, 47.5%; females: n = 126, 52.5%). The cohort included the pilot trial (n = 30, 12.5%) and the full trial phase (n = 210, 87.5%). There was no missing data due to the prospective study design. Detailed demographic and anthropometric characteristics are summarised in Table 1. The median age of all participants was 35.5 years (IQR 24.0 to 54.0), with an overall age range of 20 to 80 years. The 3MWT is reported as 290.0 m (IQR 257.0 to 323.0) [female: 282.0 (IQR 255.0 to 314.0); male: 302.0 (IQR 264.0 to 332.0); p = 0.002; r = 0.170]. The difference between Trials 2 and 1 is 7.0 m (IQR 0.0 to 16.0), which is approximately 2.4% of the difference between the two trials. Notably, the %predHRmax is only 38.3 (IQR 0.0 to 48.3) among these healthy participants.
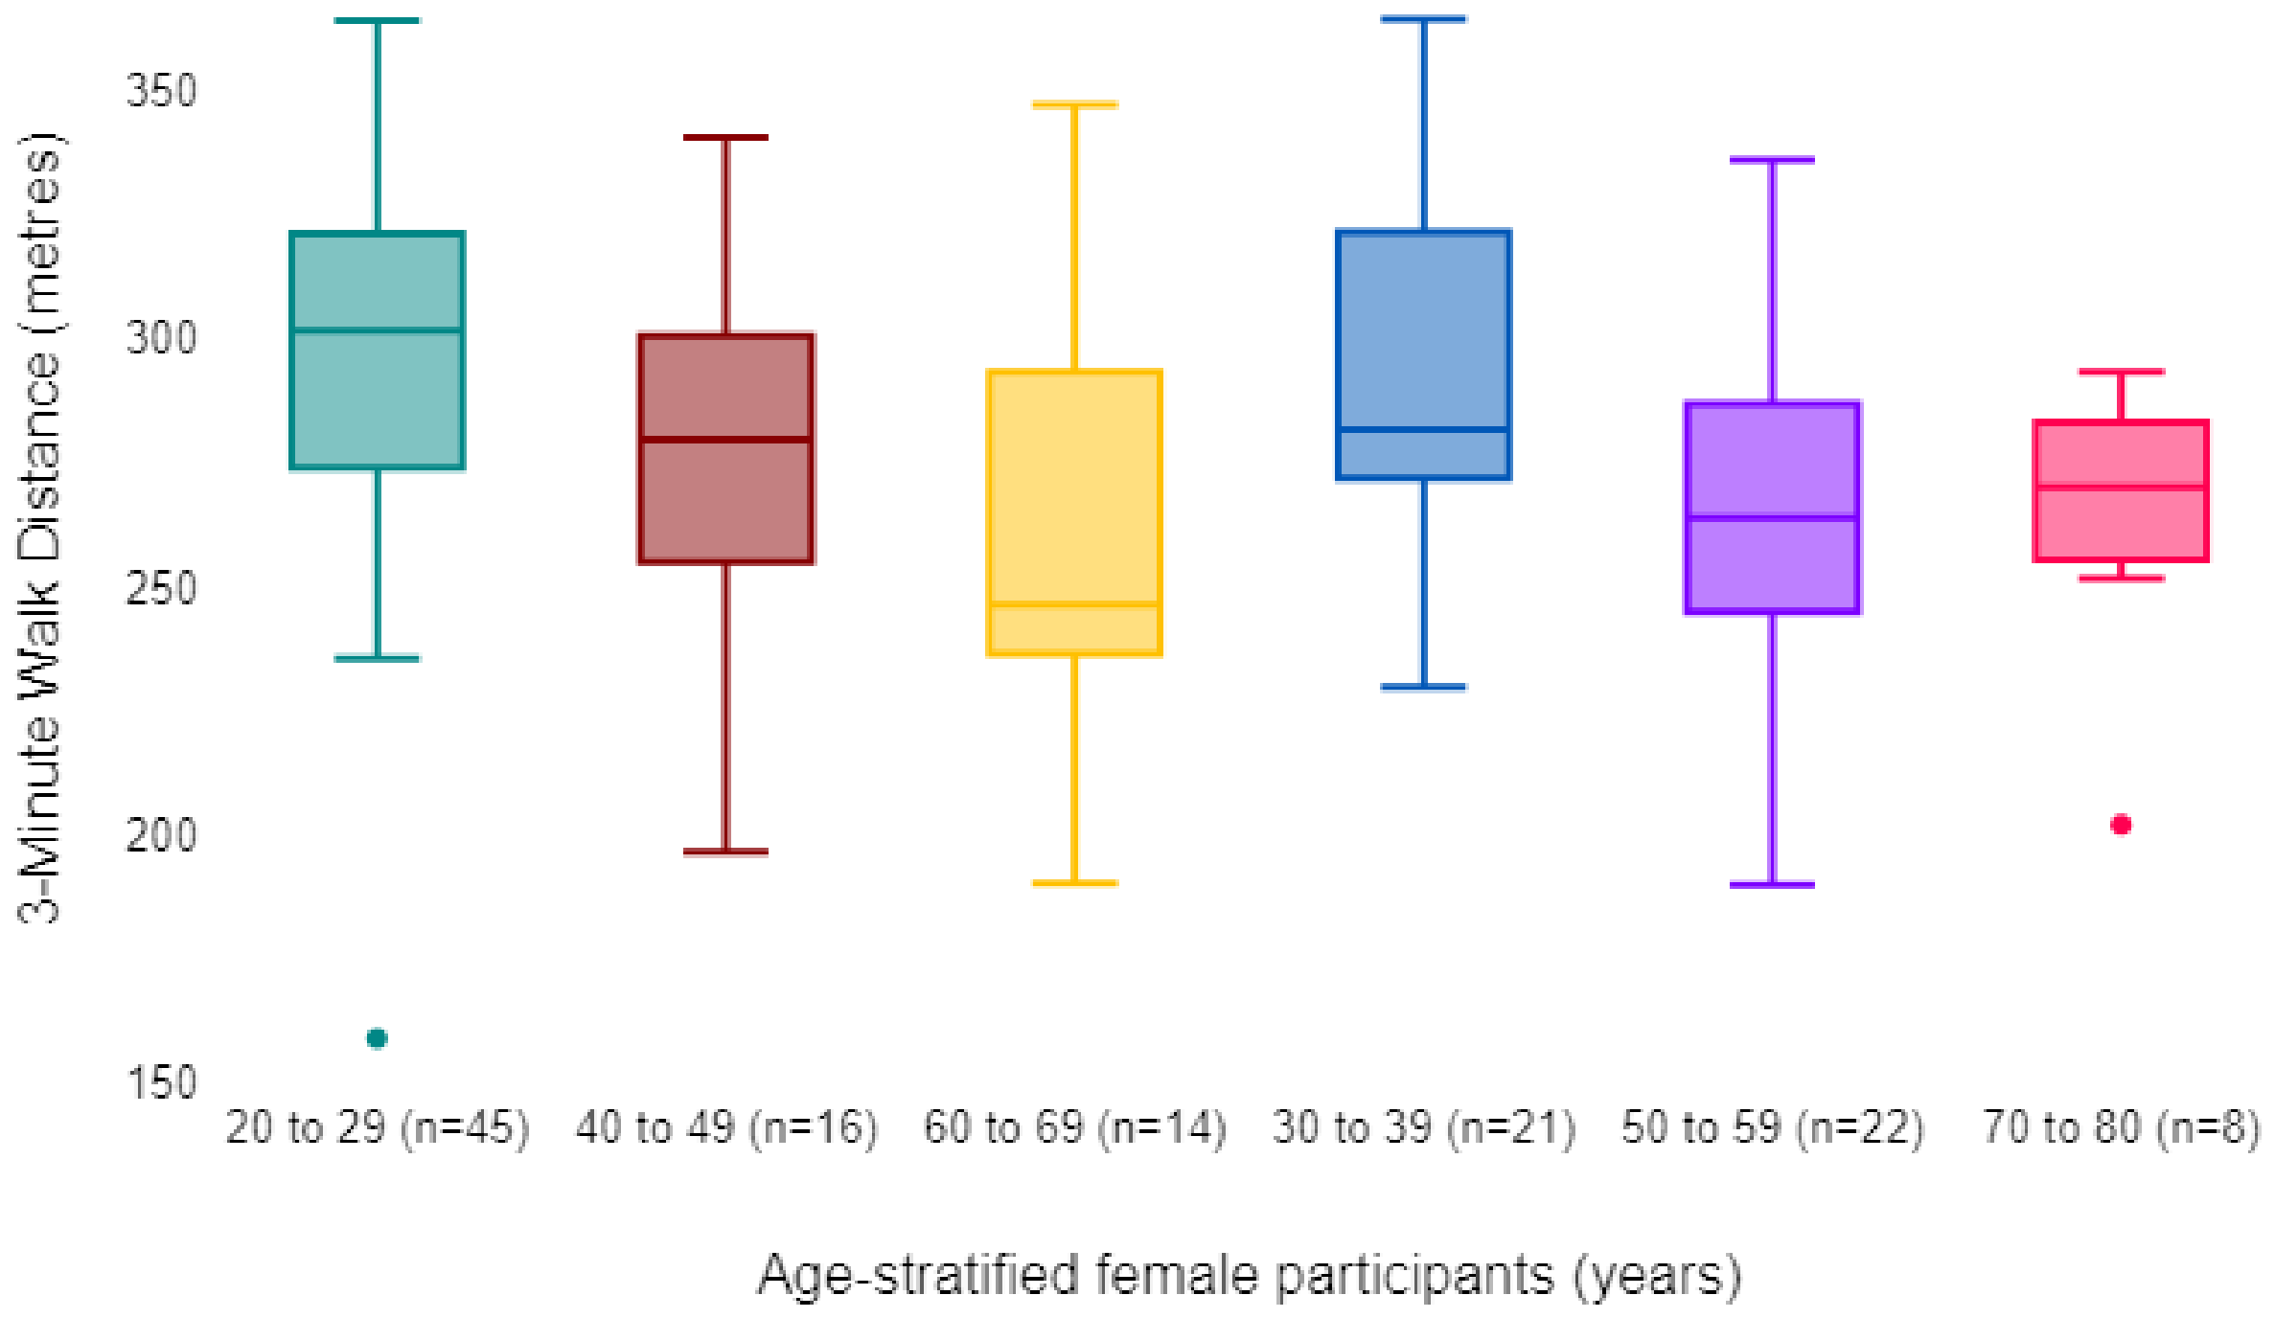
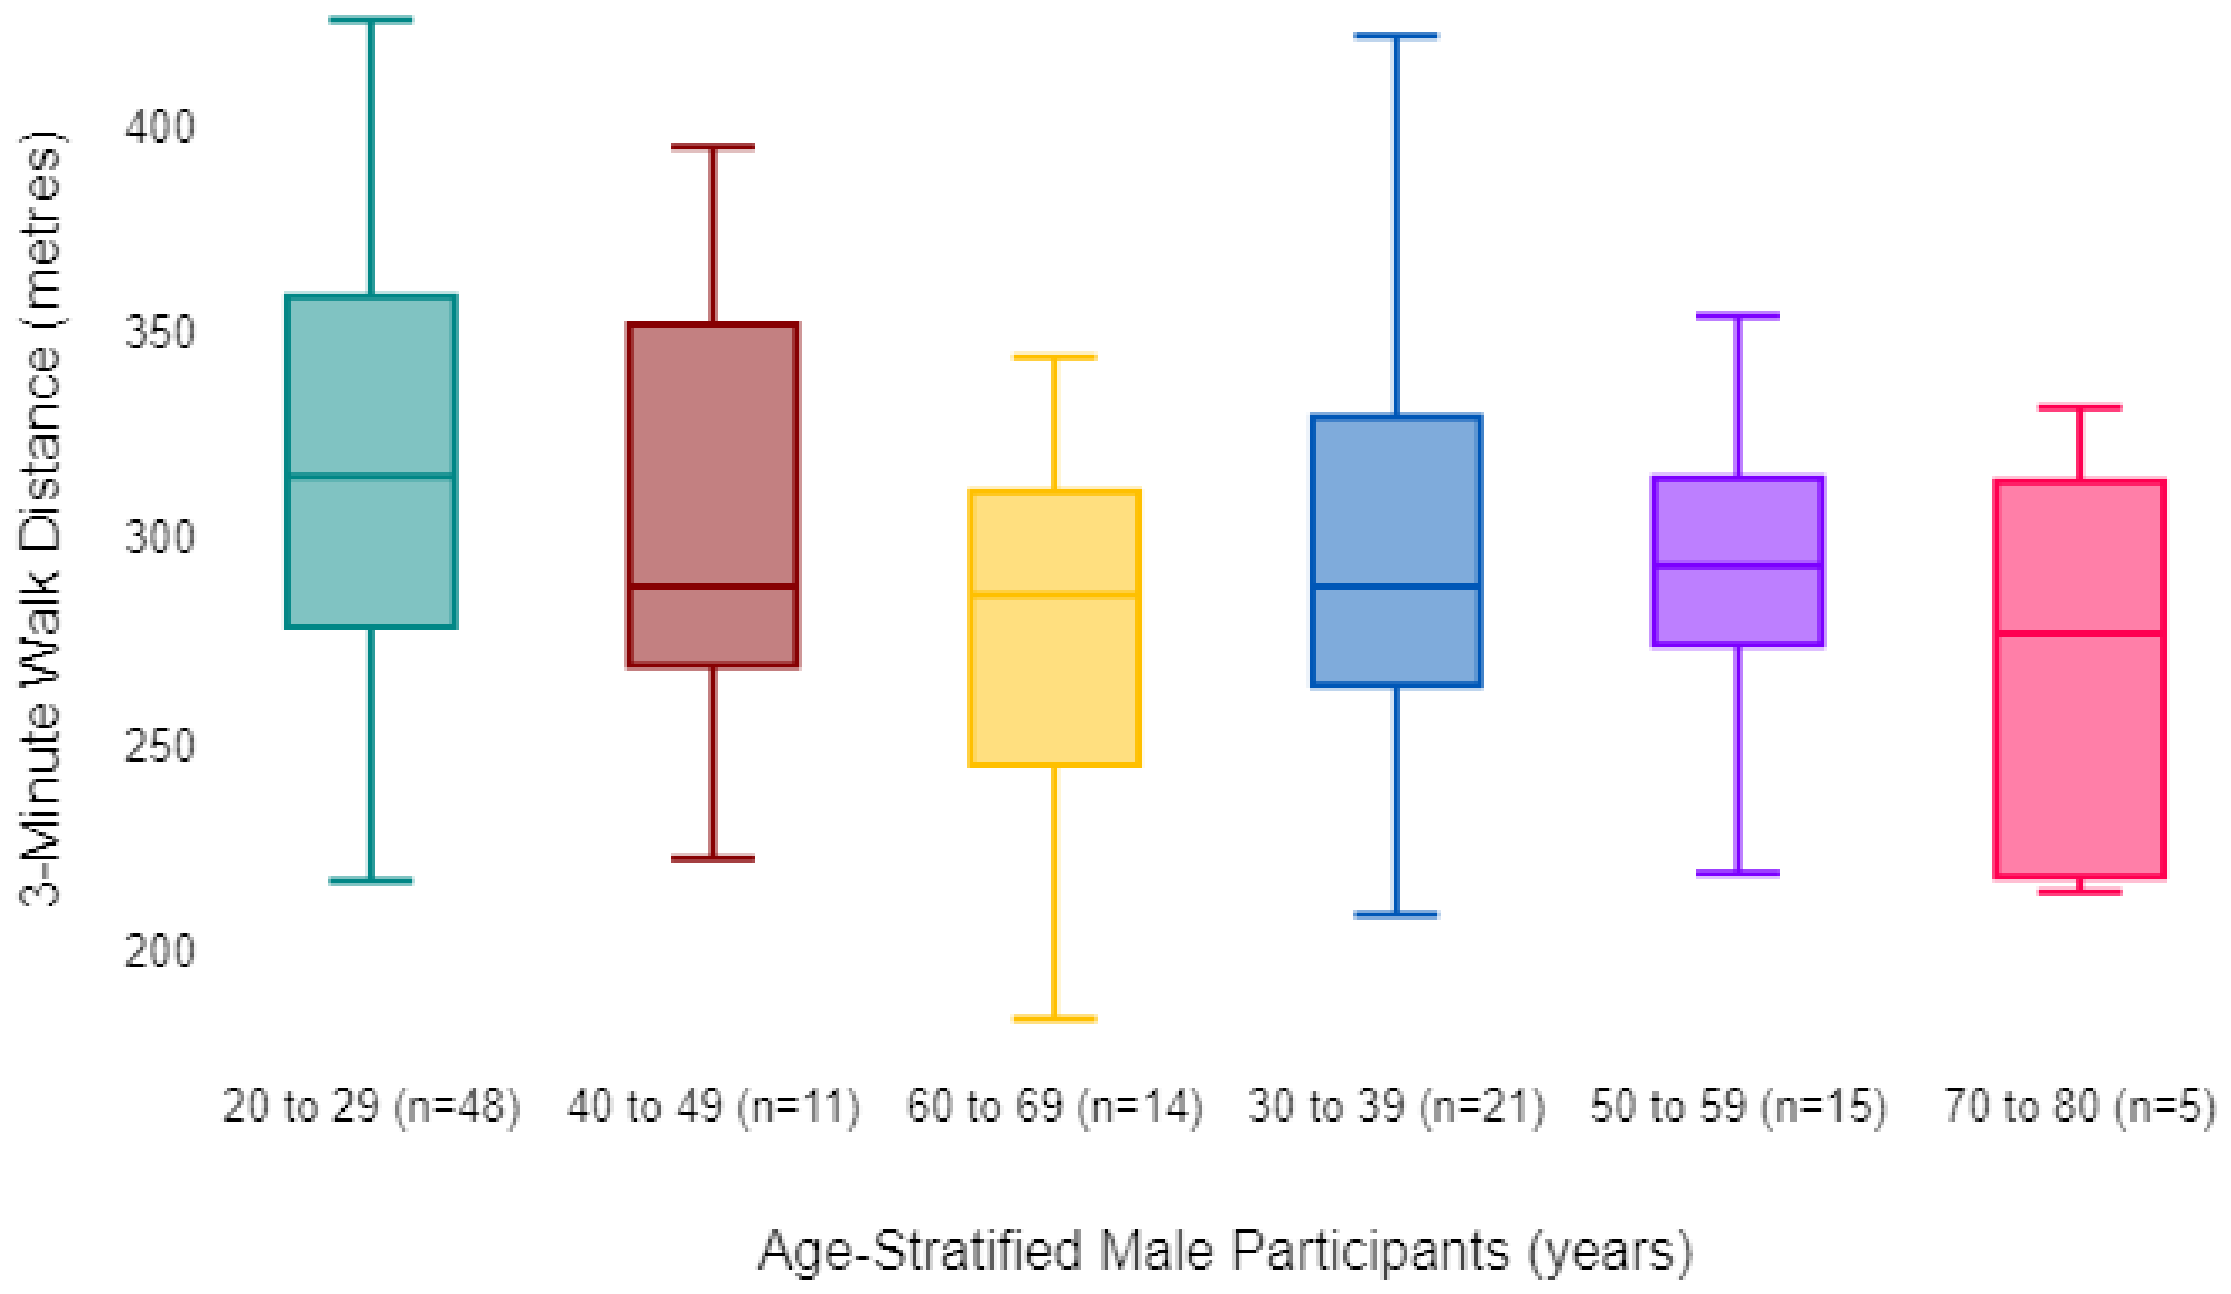
Figure 2 and Figure 3 depict the age-stratified 3MWT for female and male participants, respectively. Significant age-related differences in the 3MWT were observed in female participants (p = 0.005), with post hoc analysis showing a progressive decline in distance with increasing age. In contrast, male participants showed no significant differences in walk performance across the 20-to-80-year age span (p = 0.225), a trend also evident in the analysis of the total cohort, which showed no statistically significant differences across the age decades (p = 0.397). The 3MWT showed high intra-rater reliability (ICC = 0.921, IQR: 0.861–0.959) and perfect inter-rater reliability (ICC = 1.0, IQR: 1.000–1.000), reflecting total agreement between assessors.
Table 2 presents variables that are correlated with the 3MWT. Among all pre-test variables, age, height, and resting PR are the only ones that correlate with the 3MWT. At the same time, the net changes in BP, PR, SpO2, and RPE, together with %predHRmax, are the post-test variables that correlate. Table 3 and Table 4 present the multiple linear regression models for the determinants of 3MWT. The baseline model, including only pre-test variables, explains 16% of the variance (R2 = 0.16, p < 0.001). Predictive power improved significantly to 47% (R2 = 0.47, p < 0.001) when post-test physiological responses were included, identifying age and changes in SBP, PR, and RPE as the primary drivers. This marked increase in explained variance indicates that incorporating post-test physiological variables and perceived exertion scores substantially improves the model’s explanatory power compared to utilising baseline demographics alone.
The evaluation of the relationship between the 3MWT and established 6 min walk distance benchmarks reveals that the median of the 2 × 3MWT was 579.0 metres (514.0 to 645.0). This is significantly higher than the predicted 6 min walk distance calculated using the Poh et al. (2006) [24] [442.0 metres (IQR 354.0 to 542.0)] and Yeung et al. (2022) [10] [436.0 metres (IQR 313.0 to 480.0)] equations (Table 5). Friedman’s test showed a statistically significant difference across these measures (p < 0.001; adj p < 0.001). These results suggest that participants maintained a higher average speed during the 3 min walk test than would be predicted for a 6 min duration.

4. Discussion

To our knowledge, this is among the first studies to establish normative reference values (NRV) for the 3MWT in healthy adults spanning the full adult lifespan. While the 6MWT is the clinical gold standard [2], the 3MWT is a time-efficient alternative for busy settings or patients with limited endurance [19]. However, compared to the 6MWT, there remains a significant lack of comprehensive reference data and validated equations for the 3 min format. The study’s overall median 3MWT, 290.0 m (IQR 257.0 to 323.0), for participants aged 20 to 80 years, aligns closely with recent findings from Japan [8]. However, a more granular analysis reveals distinct age-related trends between genders. Among younger cohorts, the mean distances for females (314.8 ± 46.4 m) and males (343.3 ± 33.2 m) were slightly higher than our age-matched medians, 301.7 m (IQR 274.0 to 321.3) and 315.0 m (IQR 278.5 to 358.8), respectively. Interestingly, this performance gap appears to narrow or reverse in the older cohort (ages 70 to 80). While it was significantly lower for males (280.5 ± 44.9 m) and females (268.9 ± 24.9 m) among the Japanese participants, our cohort mostly maintained the distances, with medians of 276.9 m (IQR 218.0 to 313.8) and 270.2 m (IQR 255.5 to 283.1), respectively. These differences may stem from variations in the lifestyles, habitual occupational physical demands, or built-environment behaviours of the different populations. Furthermore, the normative values established in this study are generally higher than those reported in the obese populations [6], a predictable finding given our BMI exclusion criteria, although BMI was not a correlating variable in this study. Conversely, our distances are lower than those reported by Yeung et al. (2025) [16]. However, this difference is directly attributable to the earlier trial’s study design, which capped participation at age 64, thereby excluding the natural decline in walking performance observed in the seventh and eighth decades. Additionally, while earlier literature suggests the brief 3MWT format is highly applicable in specialised populations, care must be taken not to over-generalise early paediatric data, which has historically been limited to restricted cohorts of very young children [7].
Univariate analysis identified age, gender, height, and resting PR as significant pre-test influences on 3MWT results. However, multiple linear regression revealed that age and resting PR were the only robust pre-test predictors, whereas age, changes in SBP, PR, and RPE dominated the post-test models. Notably, the median %predHRmax during the 3MWT was only 38.3%, lower than the greater cardiovascular strain typically observed during a standard 6MWT. This lower acute cardiovascular load indicates that a 3 min walking duration may not fully challenge the aerobic maximum of healthy, community-dwelling adults. Instead, performance over this shorter duration may better reflect self-selected habitual walking speed and pacing strategy. This physiological profile helps contextually reconcile the apparent discrepancy between our statistical models in male participants. Specifically, the group-level analysis showed no significant differences in 3MWT results across individual male age decades (p = 0.225) or across the total cohort (p = 0.397). This flat cross-sectional trajectory within the male subgroups is likely a statistical artefact due to insufficient localised statistical power, particularly in the heavily screened 70–80-year-old male cell (n = 5). When evaluated as a continuous variable across the entire aggregate lifespan sample (N = 240), the superior statistical weight of the whole-cohort linear regression model successfully identifies age as a highly significant, negative determinant (β = −0.7, p < 0.001), demonstrating that functional capacity does decline progressively over the lifespan when modelled continuously.
Our results demonstrate that mathematically doubling the 3MWT significantly overestimated 6 min capacity (from 514.0 to 645.0 m), highlighting a fundamental pacing discrepancy and that exertional fatigue accumulates non-linearly over time. Participants performing the shorter 3MWT appear to adopt a more aggressive, self-regulated pacing strategy that cannot be sustained for 6 min. Consequently, these preliminary comparative findings strongly indicate that a simple doubling of the 3MWT results is methodologically inappropriate for estimating equation-predicted 6MWT benchmarks, and the two tests should not be considered interchangeable without direct, concurrent validation.
Raw data show a clear divergence between functional walking performance and the underlying physiological effort required to maintain it across age strata. While absolute 3MWT metrics appeared relatively stable across certain age groups in the categorical analysis, a clear upward trend in %predHRmax indicates that older adults require a higher relative cardiovascular effort to achieve comparable walking distances. This increased cardiorespiratory demand is accompanied by a slower post-exercise heart rate recovery profile, indicating diminished cardiovascular deceleration in the older cohorts. This exertional gap is further reflected in our subjective findings: older participants reported greater increases in perceived exertion (RPE) during recovery intervals following test cessation. Taken together, these trends indicate that although older healthy adults possess the functional capacity to sustain a competitive walking velocity for a brief 3 min period, they do so at a significantly higher physiological cost, incurring a greater relative cardiorespiratory load and requiring a longer recovery period than their younger peers.

Limitations

Several limitations warrant consideration. First, the use of single-centre convenience sampling limits the generalisability and overall representativeness of the population. Strict health screening led to a lower yield in the oldest cohort (males: n = 5; females: n = 8, aged 71–80), reducing categorical subgroup power. However, for continuous multivariable regression, our aggregated sample (N = 240) is highly robust, more than doubling the minimum size (N = 118) required by an a priori power analysis (f2 = 0.15, α = 0.05, power = 0.95) to ensure model stability across the lifespan. Second, because the reference equations were developed and evaluated within the same sample, without external or internal validation (e.g., bootstrapping), they must be applied with clinical caution until independent validation is conducted. Additionally, while our rigid distance-verification protocol yielded perfect inter-rater reliability, this level of agreement is uncommon in wider clinical practice and should be interpreted with caution as a reflection of procedural standardisation rather than typical clinical variance. Thirdly, several primary determinants of functional capacity were not controlled for. Most notably, habitual physical activity levels, baseline fitness levels, specific medication use histories and socioeconomic status were not assessed, which limits the value of the reference norms. Additionally, peripheral lower-limb muscle strength and biomechanical variables were not measured, preventing us from isolating musculoskeletal versus cardiorespiratory contributions to the final 3MWT. Furthermore, although the protocol utilised two distinct walks, a potential trial-to-trial learning effect between consecutive efforts cannot be entirely ruled out. Finally, the strict inclusion filters, requiring English proficiency and excluding individuals with obesity, comorbidities, or ambulation with aids, particularly among the older cohorts, restrict participant recruitment, thereby limiting the generalisability of these reference values to other populations. Furthermore, because the 6MWT was not directly measured in this cohort, comparisons remain limited to equation-predicted benchmarks; prospective trials utilising concurrent testing and Bland–Altman analyses are required to confirm clinical interchangeability.

5. Conclusions

This study established preliminary local normative reference values and equations for the 3MWT in healthy Singaporean adults. These localised benchmarks provide clinicians with a time-efficient tool for assessing functional capacity over a brief walking duration. Our findings suggest that the 3MWT operates at a lower acute cardiopulmonary load than longer field walk tests, which may reflect self-selected habitual walking speed and pacing strategies rather than maximum aerobic capacity. However, the observed age-related trends reveal that older adults require a higher relative cardiovascular effort and a longer recovery period to maintain absolute functional distances comparable to those of their younger peers. Ultimately, this study supports the 3MWT as a rapid functional walking assessment tool for healthy adults in Singapore’s community settings. However, because this cohort was restricted to healthy individuals and lacked an external validation arm, the clinical sensitivity and direct applicability of these reference values to specific disease populations require further investigation.

Author Contributions

M.T.Y. contributed to the study design, data analysis and interpretation, and revision and approval of the final manuscript. C.V., S.Q.N. and M.H.B.S. contributed to the study design, data analysis, and interpretation. C.V., S.Q.N., M.H.B.S., X.C.G., R.H.L. and A.C.T. contributed to data collection. C.V. contributed to the drafting of the manuscript. M.Y. contributed to the conceptualisation of the study. All authors have read and agreed to the published version of the manuscript.

Funding

This research received no external funding.

Institutional Review Board Statement

The study protocol was approved by the Singapore Institute of Technology—Institutional Review Board (approval number RECAS-0514, approval date 11 March 2024).

Informed Consent Statement

Informed consent was obtained from all subjects involved in the study.

Data Availability Statement

The datasets generated and/or analysed during the current study are available from M.T.Y. upon reasonable request.

Acknowledgments

The authors thank the participants, the Health and Social Sciences Cluster of the Singapore Institute of Technology, and the Department of Physiotherapy—Singhealth Polyclinic for their support.

Conflicts of Interest

The authors declare no conflicts of interest.

Abbreviations

The following abbreviations are used in this manuscript:
6MWT6 min walk test
3MWT3 min walk test
NRVNormative reference values
mMetres
IQRInterquartile range
PAR-Q+Physical Activity Readiness Questionnaire for Everyone
BMIBody mass index
SBPSystolic blood pressure
DBPDiastolic blood pressure
PRPulse rate
SPO2Oxygen saturation
RPERating of perceived exertion
HRmaxPredicted maximum heart rate
HRRHeart rate reserve
HRrestHeart rate resting
%predHRmaxPercentage of Predicted Maximum Heart Rate

References

  1. Enright, P.L. The six-minute walk test. Respir. Care 2003, 48, 783–785. [Google Scholar] [CrossRef] [PubMed]
  2. Holland, A.E.; Spruit, M.A.; Troosters, T.; Puhan, M.A.; Pepin, V.; Saey, D.; McCormack, M.C.; Carlin, B.W.; Sciurba, F.C.; Pitta, F.; et al. An official European Respiratory Society/American Thoracic Society technical standard: Field walking tests in chronic respiratory disease. Eur. Respir. J. 2014, 44, 1428–1446. [Google Scholar] [CrossRef] [PubMed]
  3. Liu, B.; Hu, X.; Zhang, Q.; Fan, Y.; Li, J.; Zou, R.; Zhang, M.; Wang, X.; Wang, J. Usual walking speed and all-cause mortality risk in older people: A systematic review and meta-analysis. Gait Posture 2016, 44, 172–177. [Google Scholar] [CrossRef] [PubMed]
  4. Troosters, T.; Gosselink, R.; Decramer, M. Six minute walking distance in healthy elderly subjects. Eur. Respir. J. 1999, 14, 270–274. [Google Scholar] [CrossRef] [PubMed]
  5. Shaphe, M.A.; Alshehri, M.M.; Alajam, R.A.; Ghazwani, A.; Temehy, B.F.; Sahely, A.; Alfaifi, B.H.J.; Hakamy, A.; Khan, A.; Aafreen, A.; et al. Evaluating the physiological responses to treadmill exercise based on the 6-minute walk test in individuals with COPD across severity levels. Front. Physiol. 2025, 16, 1668559. [Google Scholar] [CrossRef] [PubMed]
  6. Turan, H.; Yasaci, Z.; Elkan, H. Less Time, Same Insight? Evaluating Short Functional Tests as Substitutes for the Six-Minute Walk Test and the Reliability and Validity of the 2MWT, 3MWT, and 1MSTS in Bariatric Surgery Candidates with Obesity. Healthcare 2025, 13, 1883. [Google Scholar] [CrossRef] [PubMed]
  7. Hoskens, J.; Goemans, N.; Feys, H.; De Waele, L.; Van den Hauwe, M.; Klingels, K. Normative data and percentile curves for the three-minute walk test and timed function tests in healthy Caucasian boys from 2.5 up to 6 years old. Neuromuscul. Disord. 2019, 29, 585–600. [Google Scholar] [CrossRef] [PubMed]
  8. Kubo, H.; Asai, T.; Fukumoto, Y.; Oshima, K.; Koyama, S.; Monjo, H.; Tajitsu, H.; Oka, T. Value of the 3-min walk test and its association with motor functions in older adults. Physiother. Theory Pract. 2024, 40, 144–152. [Google Scholar] [PubMed]
  9. Pan, A.M.; Stiell, I.G.; Clement, C.M.; Acheson, J.; Aaron, S.D. Feasibility of a structured 3-minute walk test as a clinical decision tool for patients presenting to the emergency department with acute dyspnoea. Emerg. Med. J. 2009, 26, 278–282. [Google Scholar] [CrossRef] [PubMed]
  10. Yeung, M.T.; Chan, M.Y.; Huang, K.S.; Chen, T.J.; Chia, C.P.; Fong, M.M.; Ho, C.S.; Koh, D.T.; Neo, M.J.; Tan, M. Normative reference values and regression equations to predict the 6-minute walk distance in the Asian adult population aged 21–80 years. Hong Kong Physiother. J. 2022, 42, 111–124. [Google Scholar] [CrossRef] [PubMed]
  11. Azman, M.Z.B.; Huang, K.S.; Koh, W.J.; Leong, S.S.; Ong, B.; Soon, J.L.; Tan, S.W.; Chan, M.Y.; Yang, M.; Yeung, M.T. Normative reference values, determinants and regression equations for the incremental shuttle walk test (ISWT) in healthy Asian population aged 21 to 80 years. PLoS ONE 2023, 18, e0291132. [Google Scholar] [CrossRef] [PubMed]
  12. Tan, T.C.; Guo, Y.Y.; Ho, D.J.; Sanwari, N.A.B.; Quek, P.H.; Tan, R.S.; Yap, F.S.; Yang, M.; Yeung, M.T. Reference Values, Determinants and Regression Equation for the Timed-Up and Go Test (TUG) in Healthy Asian Population Aged 21 to 85 Years. Int. J. Environ. Res. Public Health 2023, 20, 5712. [Google Scholar] [CrossRef] [PubMed]
  13. Silva, A.M.; Shen, W.; Heo, M.; Gallagher, D.; Wang, Z.; Sardinha, L.B.; Heymsfield, S.B. Ethnicity-related skeletal muscle differences across the lifespan. Am. J. Hum. Biol. 2010, 22, 76–82. [Google Scholar] [PubMed]
  14. Weir, N.A.; Brown, A.W.; Shlobin, O.A.; Smith, M.A.; Reffett, T.; Battle, E.; Ahmad, S.; Nathan, S.D. The Influence of Alternative Instruction on 6-Min Walk Test Distance. Chest 2013, 144, 1900–1905. [Google Scholar] [CrossRef] [PubMed]
  15. Green, S.B. How Many Subjects Does It Take to Do A Regression Analysis. Multivar. Behav. Res. 1991, 26, 499–510. [Google Scholar] [CrossRef]
  16. Yeung, M.T.; Goh, X.C.; Lian, R.H.; Ting, A.C.; Yang, M. Reliability and interchangeability of 1-minute sit-to-stand, 3-minute chair rise, and 3-minute walk tests in assessing functional capacity. J. Sports Sci. 2025, 43, 2538–2550. [Google Scholar] [CrossRef] [PubMed]
  17. Warburton, D.E.; Jamnik, V.K.; Bredin, S.S.; Gledhill, N. The physical activity readiness questionnaire for everyone (PAR-Q+) and electronic physical activity readiness medical examination (ePARmed-X+). Health Fit. J. Can. 2011, 4, 3–17. [Google Scholar]
  18. WHO. Appropriate body-mass index for Asian populations and its implications for policy and intervention strategies. Lancet 2004, 363, 157–163. [Google Scholar] [CrossRef] [PubMed]
  19. Ibikunle, A.; Adedoyin, R.; Awotidebe, T.; Fasakin, O.; Okonji, A.; Odetunde, M.; Olawoye, A. Validation of Three-Minute Walk Test for the Assessment of Functional Capacity among Patients with Hypertension. J. Clin. Exp. Cardiol. 2020, 11, 662. [Google Scholar] [CrossRef]
  20. Borg, G.A. Psychophysical bases of perceived exertion. Med. Sci. Sports Exerc. 1982, 14, 377–381. [Google Scholar] [CrossRef] [PubMed]
  21. Tanaka, H.; Monahan, K.D.; Seals, D.R. Age-predicted maximal heart rate revisited. J. Am. Coll. Cardiol. 2001, 37, 153–156. [Google Scholar] [CrossRef] [PubMed]
  22. Liljequist, D.; Elfving, B.; Skavberg Roaldsen, K. Intraclass correlation—A discussion and demonstration of basic features. PLoS ONE 2019, 14, e0219854. [Google Scholar] [CrossRef] [PubMed]
  23. Schober, P.; Boer, C.; Schwarte, L.A. Correlation Coefficients: Appropriate Use and Interpretation. Anesth. Analg. 2018, 126, 1763–1768. [Google Scholar] [CrossRef] [PubMed]
  24. Poh, H.; Eastwood, P.R.; Cecins, N.M.; Ho, K.T.; Jenkins, S.C. Six-minute walk distance in healthy Singaporean adults cannot be predicted using reference equations derived from Caucasian populations. Respirology 2006, 11, 211–216. [Google Scholar] [CrossRef] [PubMed]
Figure 1. Participants’ recruitment flowchart.
Tph 01 00008 g001
Figure 2. Aged-stratified 3 min walk distance, female participants.
Tph 01 00008 g002
Figure 3. Aged-stratified 3 min walk distance, male participants.
Tph 01 00008 g003
Table 1. Participants’ demographics and results of the 3 min walk distance.
VariablesTotal Female Male p Valuer
Participant, n 240 126 114
Mean ± SDMedian (IQR)Mean ± SDMedian (IQR)Mean ± SDMedian (IQR)
Age, y39.8 ± 16.535.5 (24.0 to 54.0)40.6± 17.137.0 (23.0 to 57.0)39.0 ± 15.933.5 (25.0 to 51.0)0.4440.125
Height, m1.65 ± 0.091.60 (1.60 to 1.70) 1.59 ± 0.11.60 (1.60 to 1.60)1.72 ± 0.11.70 (1.70 to 1.80)<0.0010.720
Weight, kg60.9 ± 10.560.7 (53.6 to 67.1)55.4 ± 7.055.4 (49.7 to 60.7)66.9 ± 10.566.9 (61.3 to 74.7)<0.0010.483
BMI, kg/m222.3 ± 2.9022.3 (20.6 to 24.5)22.0 ± 2.422.0 (20.0 to 23.6)22.7 ± 3.223.2 (21.2 to 24.9)0.0500.130
Vital sign measurements
Resting SBP, mmHg120 ± 15.7119 (109 to 129)115.0 ± 15.7113.0 (104.0 to 125.0) 125.0 ± 13.9124.0 (116.0 to 133.0)<0.0010.360
Resting DBP, mmHg75.7 ± 9.474.0 (68.0 to 81.0)73.7 ± 9.272.0 (67.0 to 79.0)77.8 ± 9.276.0 (71.0 to 84.0)=0.0010.240
Resting PR, bpm76.6 ± 13.575.0 (67.0 to 85.0)77.4 ±14.0 75.0 (67.0 to 87.3) 75.7 ± 12.975.0 (66.8 to 82.0)0.3280.040
Resting SpO2, %97.9 ± 1.698.0 (97.0 to 99.0)98.3 ± 1.298.0 (98.0 to 98.0)97.5 ± 1.998.0 (97.0 to 98.0)<0.0010.250
Resting RPE0.16 ± 0.700.00 (0.00 to 0.00)0.10 ± 0.320.0 (0.0 to 0.0)0.2 ± 0.90.0 (0.0 to 0.0)0.1710.060
3MWT
3MWT1 280.0 ± 44.3279.0 (247.0 to 309.0) 273.0 ± 38.5275.0 (146.0 to 301.0)288.0 ± 48.9286.0 (252.0 to 322.0)0.0120.140
3MWT2290.0 ± 48.3288.0 (257.0 to 321.0)282.0 ± 39.5281.0 (255.0 to 313.0)299.0 ± 55.3300.0 (260.0 to 331.0)0.0070.140
3MWT2–3MWT110.0 ±18.27.0 (0.0 to 16.0)9.1 ± 14.97.1 (1.5 to 13.8)11.4 ± 21.39.0 (−0.3 to 19.7)0.3260.150
Best of 2 trials 292.0 ± 48.2290.0 (257.0 to 323.0) 283.0 ± 39.6282.0 (255.0 to 314.0)302.0 ± 54.6302.0 (264.0 to 332.0)0.0020.170
∆ SBP, mmHg11.4 ± 16.19.0 (1.25 to 19.0)10.2 ±14.99.0 (0.0 to 17.0)12.6 ± 17.49.5 (2.8 to 20.0)0.2430.050
∆ DBP, mmHg2.9 ± 7.13.0 (−1.0 to 7.0)2.6 ± 7.53.0 (−2.0 to 7.0)3.3 ± 6.74.0 (0.0 to 7.0)0.4010.060
∆ PR, bpm14.1 ± 15.79.5 (3.0 to 21.8)13.3 ± 14.59.0 (3.0 to 20.5)15.1 ± 16.910.0 (2.8 to 22.0)0.4000.010
∆ SpO2, %−0.1 ± 2.10.0 (−1.0 to 1.0)−0.3 ± 2.60.0 (−1.0 to 0.3)0.1 ±1.50.0 (−1.0 to 1.0)0.1960.070
∆ RPE2.6 ± 1.72.0 (1.0 to 3.0)1.7 ± 2.6 2.0 (1.0 to 3.0) 2.6 ± 1.6 2.5 (1.0 to 3.0) 0.8890.020
%predHRmax29.9 ± 24.338.3 (0.0 to 48.3)32.2 ± 24.140.1 (0.00 to 49.8)27.3 ± 24.336.1 (0.00 to 46.3)0.11
Note: SD: standard deviation; IQR: interquartile range; y: years; m: metres; kg: kilograms; kg/m2: kilograms per metre square; SBP: systolic blood pressure; DBP, diastolic blood pressure, mmHg: millimetre mercury; PR: pulse rate; bpm: beats per minute; 3MWT: 3 min walk test; ∆: change; r = Point-Biserial correlation; RPE: rate of perceived exertion; %predHRmax: Percentage of Predicted Maximum Heart Rate.
Table 2. Univariate correlation coefficients (ρ) for 3 min walk test and participants’ variables (n = 240).
Variableρ95% CIp-Values
Age, y−0.284−0.399 to −0.159<0.001
Gender−0.168−0.292 to −0.0380.009
Height, m0.1760.046 to 0.2990.006
Weight, kg0.091−0.040 to 0.2190.161
BMI, kg/m2−0.042−0.171 to 0.0890.517
Resting SBP, mmHg0.028−0.103 to 0.1250.667
Resting DBP, mmHg−0.072−0.201 to 0.0590.264
Resting PR, bpm0.1930.064 to 0.3220.003
Resting SpO2, %−0.054−0.183 to 0.0770.406
Resting RPE−0.049−0.178 to 0.0820.451
∆ SBP, mmHg0.5270.426 to 0.615<0.001
∆ DBP, mmHg0.2670.141 to 0.384<0.001
∆ PR, bpm0.4860.379 to 0.579<0.001
∆ SpO2, %0.1880.059 to 0.311<0.001
∆ RPE0.4310.319 to 0.532<0.001
%predHRmax−0.198−0.320 to −0.0700.002
Note: 95% CI: 95% confidence interval; y: years; m: metres; kg: kilograms; kg/m2: kilograms per metre square; SBP: systolic blood pressure; DBP, diastolic blood pressure, mmHg: millimetre mercury; PR: pulse rate; bpm: beats per minute; ∆: change; RPE: rate of perceived exertion; %predHRmax: Percentage of Predicted Maximum Heart Rate.
Table 3. Linear regression model and equation for predicting 3 min walk test with pre-test variables.
3MWT = 237.7 − 0.77 (Age, Years) + 0.6 (Resting PR, bpm)
R2 = 0.16CoefficientStandard Errorp-Value95% CI
Constant 237.783.50.00573.3 to 402.1
Gender −15.48.10.059−31.4 to 0.6
Height27.945.20.538−61.1 to 116.8
Age−0.770.2<0.001−1.13 to −0.41
Resting PR0.60.20.0050.18 to 1.04
Note: 95% CI: 95% confidence interval; PR: pulse rate.
Table 4. Linear regression model and equation for predicting 3 min walk test with post-test variables.
3MWT = 208.1 − 0.7 (Age, Years) + 0.6 (∆ SBP, mmHg) + 0.9 (∆ PR, bpm) + 8.4 (∆ RPE)
R2 = 0.47CoefficientStandard Errorp-Value95% CI
Constant208.168.80.00372.5 to 343.7
Gender−7.76.70.255−20.9 to 5.6
Age −0.70.17<0.001−1.1 to −0.4
Height54.937.10.141−18.3 to 128.0
Resting PR−0.20.20.287−0.60 to 0.18
∆ SBP, mmHg0.60.2<0.0010.24 to 0.91
∆ DBP, mmHg0.20.40.512−0.47 to 0.95
∆ PR, bpm0.90.2<0.0010.50 to 1.35
∆ RPE8.41.6<0.0015.31 to 11.5
%predHRmax−0.0010.130.993−0.25 to 0.25
Note: 95% CI: 95% confidence interval; SBP: systolic blood pressure; DBP: diastolic blood pressure, mmHg: millimetre mercury; PR: pulse rate; bpm: beats per minute; ∆: change; RPE: rate of perceived exertion; %predHRmax: Percentage of Predicted Maximum Heart Rate.
Table 5. Comparison of the 3MWT with the established 6MWT references in Singapore.
3MWT
Median (IQR)
2 × 3MWT
Median (IQR)
Predicted 6MWT (Poh et al., 2006) [24]
Median (IQR)
Predicted 6MWT (Yeung et al., 2022) [10]
Median (IQR)
p-ValueAdj
p-Value
290.0 (257.0 to 323.0)579.0 (514.0 to 645.0)442.0 (354.0 to 542.0)436.0 (313.0 to 480.0)<0.001<0.001
Note: IQR: interquartile range; 3MWT: 3 min walk test; 6MWT: 6 min walk test.
Disclaimer/Publisher’s Note: The statements, opinions and data contained in all publications are solely those of the individual author(s) and contributor(s) and not of MDPI and/or the editor(s). MDPI and/or the editor(s) disclaim responsibility for any injury to people or property resulting from any ideas, methods, instructions or products referred to in the content.