Article

PANDA-PLUS-Bench: A Clinical Benchmark for Evaluating the Robustness of AI Foundation Models in Prostate Cancer Diagnosis

by
Joshua L. Ebbert
and
Dennis Della Corte
*
Department of Physics and Astronomy, Brigham Young University, Provo, UT 84602, USA
*
Author to whom correspondence should be addressed.
AI Med. 2026, 1(2), 14; https://doi.org/10.3390/aimed1020014
Submission received: 30 March 2026 / Revised: 15 May 2026 / Accepted: 22 May 2026 / Published: 28 May 2026

Abstract

Artificial intelligence foundation models are increasingly deployed for prostate cancer Gleason grading, where GP3/GP4 distinction directly impacts treatment decisions (active surveillance vs. intervention). However, these models may achieve high validation accuracy by learning specimen-specific artifacts rather than generalizable biological features, limiting real-world clinical utility. We introduce PANDA-PLUS-Bench, a curated benchmark dataset derived from expertly annotated prostate biopsies designed specifically to quantify this failure mode. The benchmark comprises nine carefully selected whole slide images from nine unique patients containing diverse Gleason patterns, with non-overlapping tissue patches extracted at both 512 × 512 and 224 × 224-pixel resolutions across eight augmentation conditions. Using this benchmark, we evaluate seven foundation models (Virchow, Virchow2, UNI, UNI2, Phikon, Phikon-v2, and HistoEncoder) on their ability to separate biological signals from slide-level confounders. Our results reveal substantial variation in robustness across models: the Virchow models achieved the lowest slide-level encoding among large-scale models (slide ID accuracy: 80.7–81.0%), yet Virchow2 exhibited the lowest cross-slide accuracy (47.2%). HistoEncoder, trained specifically on prostate tissue, demonstrated the highest cross-slide accuracy (59.7%) and the strongest slide-level encoding (slide ID accuracy: 90.3%), suggesting tissue-specific training may enhance both biological feature capture and slide-specific signatures. All models exhibited measurable within-slide vs. cross-slide accuracy gaps, though the magnitude varied from 19.9 percentage points (HistoEncoder) to 26.9 percentage points (Phikon). We provide an open-source Google Colab notebook enabling researchers to evaluate additional foundation models against our benchmark using standardized metrics. PANDA-PLUS-Bench addresses a critical gap in foundation model evaluation by providing a purpose-built resource for robustness assessment in the clinically important context of Gleason grading.

1. Introduction

Foundation models for computational pathology have emerged as powerful tools for automated diagnostic support, trained on millions of whole slide images (WSIs) using self-supervised learning [1,2]. These models generate feature embeddings which are adaptable to diverse downstream tasks, promising standardized, scalable diagnostic support. However, recent evidence suggests these models may encode spurious correlations (including scanner artifacts, staining protocols, and institutional processing differences) more strongly than the biological features they are intended to capture [3,4].
The phenomenon of WSI-specific feature collapse, first characterized by Yun et al. [4], describes embedding spaces organized primarily by slide of origin rather than pathological features. De Jong et al. extended this observation, demonstrating that current foundation models encode medical center identity more strongly than cancer type across ten evaluated models [3]. Their proposed “Robustness Index,” the ratio of biological to confounding feature encoding, exceeded 1.0 for only a single model (Virchow2 [5] at 1.2).
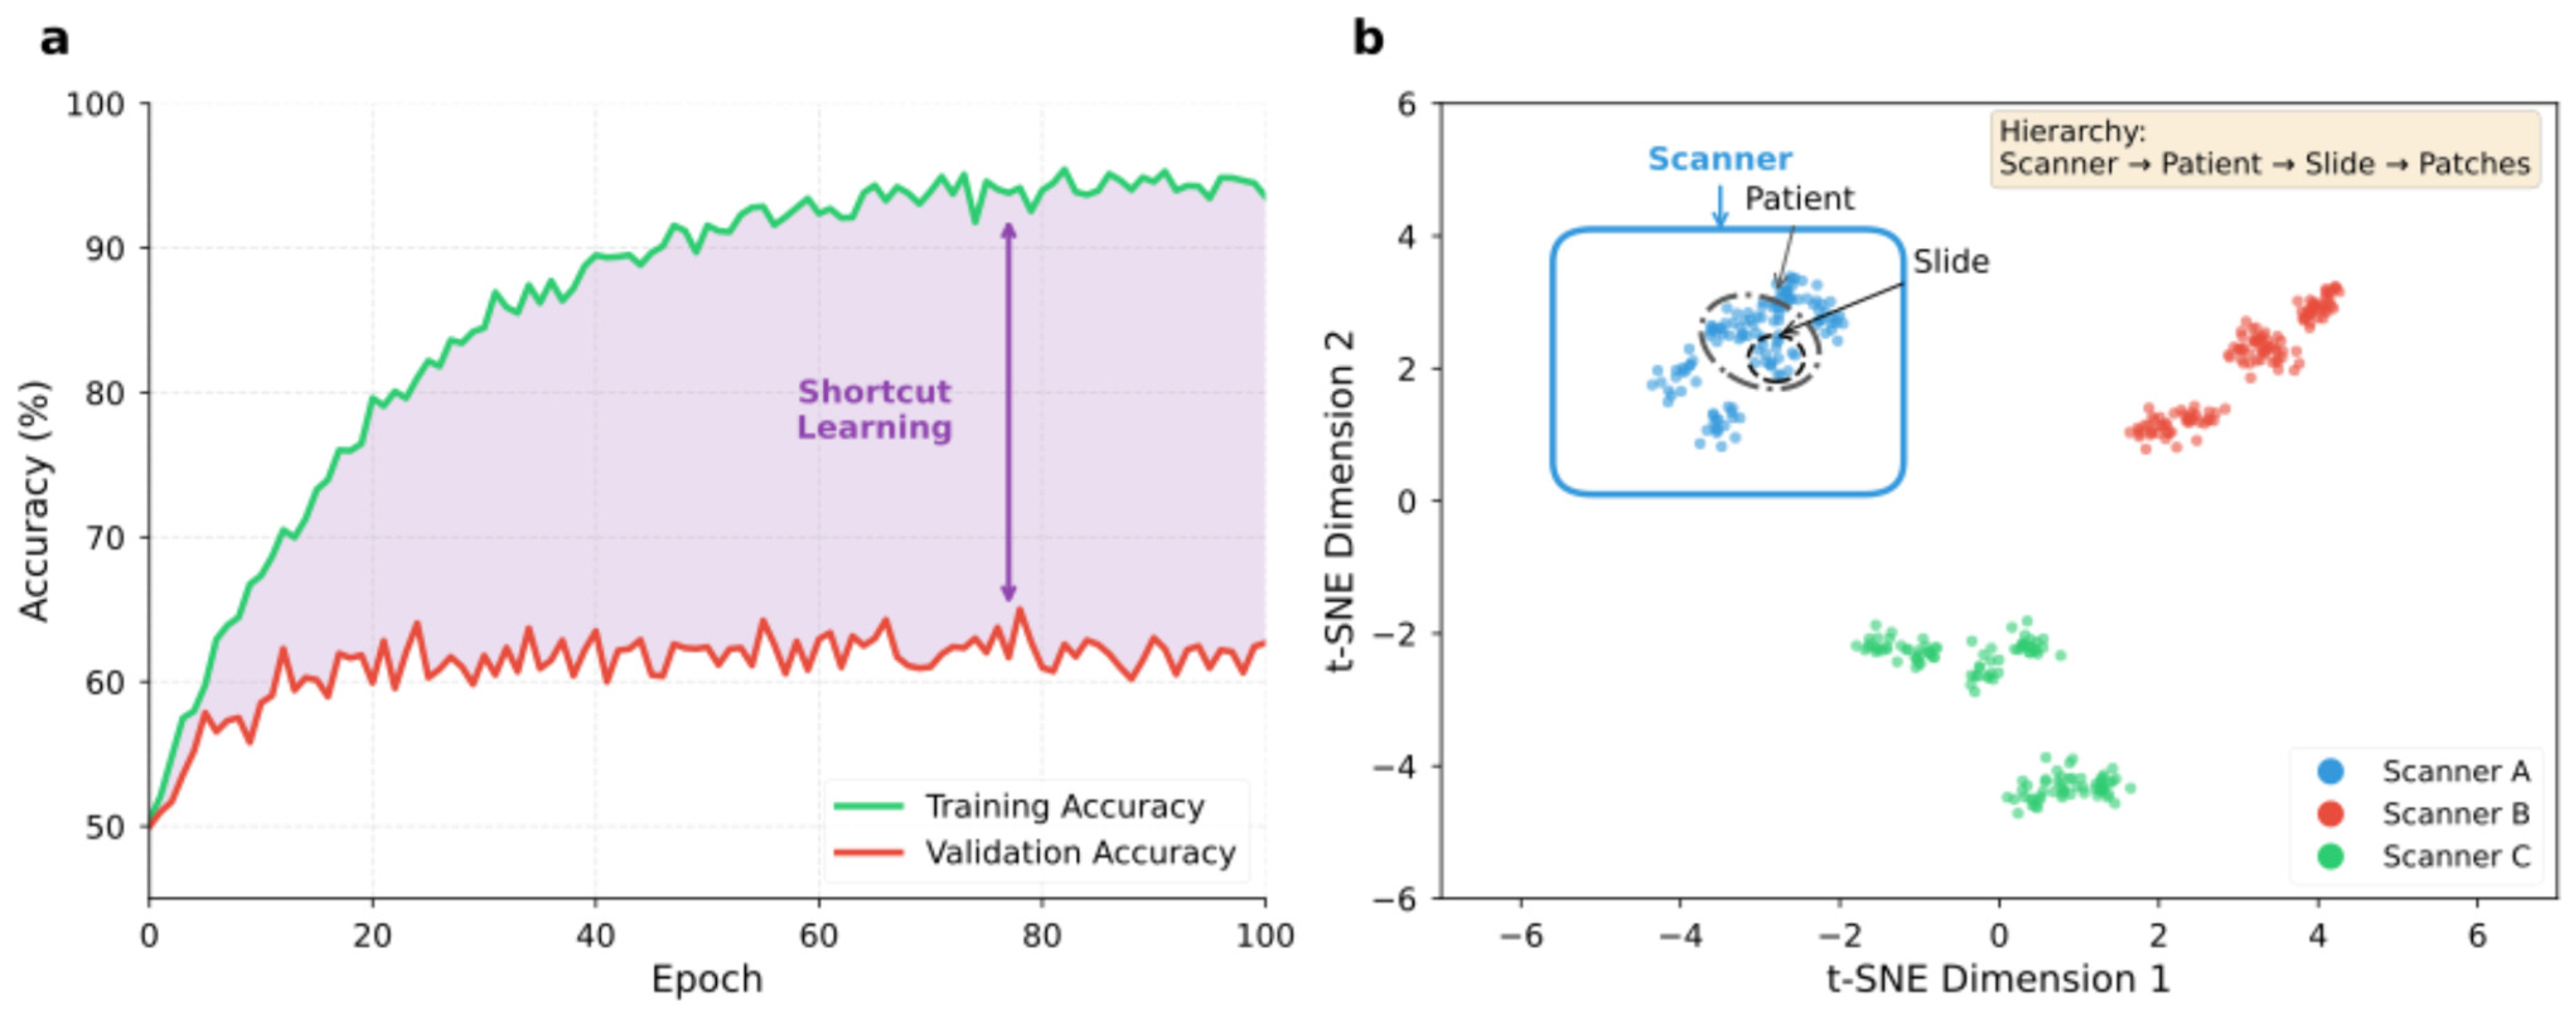
Beyond WSI-specific feature collapse, a hidden problem plagues computational pathology benchmarks: patient-level data leakage. When the same patient contributes multiple slides, common in biopsy procedures where 10–12 cores are standard, naive slide-level splitting allows patient identity to leak between train and test sets. Foundation models and downstream classifiers can exploit patient-specific signatures (tissue processing, immune infiltration patterns, stromal characteristics) rather than learning generalizable pathological features. This results in common failure modes when training classifiers on embeddings, shown in Figure 1.
This problem may contribute to inflated performance in competitions like PANDA, where winning solutions achieved scores exceeding 0.93 Quadratic Weighted Kappa (QWK) [6], a chance-corrected agreement metric that penalizes disagreements in proportion to their severity on an ordinal scale and ranges from 0 (chance agreement) to 1 (perfect agreement). Subsequent deployment studies have consistently shown degraded real-world performance, suggesting models learned dataset-specific shortcuts rather than robust Gleason pattern recognition. Critically, even “slide-level” cross-validation is insufficient when patient identity is encoded in tissue characteristics; the same patient’s slides may cluster together in embedding space regardless of their Gleason content.
Despite growing recognition of these limitations, no standardized benchmark currently exists for systematically quantifying the degree to which foundation model embeddings are organized by slide of origin rather than by pathological class, nor for comparing this failure mode across models. Existing evaluations rely on heterogeneous datasets, inconsistent splitting strategies, and non-reproducible protocols. This gap impedes: (1) fair comparison across models, (2) tracking of progress in robustness, and (3) informed model selection for clinical applications.
We address this gap by introducing PANDA-PLUS-Bench, a purpose-built benchmark for evaluating foundation model generalizability in Gleason pattern classification. Our contributions include (1) a curated multi-class benchmark dataset of nine WSIs from nine unique patients with expert pixel-level Gleason annotations, selected specifically for within-slide pattern diversity; (2) standardized evaluation protocols with defined metrics for quantifying slide-level confounding, the tendency of embeddings to organize by specimen of origin rather than by pathological class; (3) multi-resolution patches (512 × 512 and 224 × 224) enabling evaluation across model input requirements; (4) eight systematic augmentation conditions for assessing robustness to color and geometric variation; (5) comparative evaluation of seven foundation models (Virchow, Virchow2, UNI, UNI2, Phikon, Phikon-v2, HistoEncoder) spanning commercial and research licenses, general-purpose and tissue-specific training; and (6) an open-source evaluation toolkit (Google Colab notebook) enabling community benchmarking of additional models. This work is intended for AI researchers and model developers seeking a standardized resource for evaluating and improving foundation model robustness.

2. Related Work

2.1. Pathology Foundation Models Under Evaluation

We evaluate seven foundation models that span diverse training data, parameter size, and benchmarking performance. Training strategies, data scales, and licensing terms are described in Table 1. Prior Virchow benchmarking shows competitive performance in pan-cancer detection and other tasks. More recent benchmarks identify Virchow2 as among the top-performing models overall, particularly in the representation of biological features over center-specific learning [7,8]. The UNI pair of models, released under a research-only license, show strong performance on PANDA and offer diverse WSI training coverage [1]. Phikon, one of the earlier publicly released pathology foundation models, demonstrated that in-domain pre-training outperforms ImageNet pre-training [8]. Its successor, Phikon-v2, demonstrated performance on par with models trained on proprietary data, and the model won first place in the UCB-OCEAN Kaggle competition.
The seven selected models support several orthogonal comparisons that contextualize their behavior in downstream evaluations. First, they contrast commercially deployable models (Virchow, Phikon, Phikon-v2, HistoEncoder) against research-restricted counterparts (UNI, UNI2, Virchow2), and general-purpose encoders against the tissue-specific HistoEncoder. Second, they span distinct pre-training strategies (iBOT for Phikon, which combines masked image modeling with self-distillation [12], versus DINOv2 for all others, which builds on a similar combined objective but has a refined training recipe and a reliance on large-scale data curation [13]), a wide range of data scales from tens of millions of tiles to millions of WSIs, and both public (Phikon, Phikon-v2) and proprietary training corpora (Virchow, Virchow2, UNI), enabling analysis of how these factors influence robustness and transfer performance.

2.2. Foundation Model Robustness: The Medical Center Problem

Recent systematic evaluations have revealed fundamental robustness limitations in pathology foundation models. De Jong et al. evaluated ten publicly available pathology FMs and found that all models encode medical center information to a strong degree [3]. They introduced the “Robustness Index”, a metric reflecting to what degree biological features dominate confounding features, and found that only one model (Virchow2) achieved an index greater than 1.0, the threshold at which biological features are encoded as strongly as confounding features. Values above 1.0 thus indicate that the biological signal dominates, which is the desired behavior for clinically useful models. For all but one model, medical center origin could be predicted with 93–99% accuracy, and classification errors were not random, but attributable to same-center confounders.
A recent comprehensive analysis by Kömen et al. evaluated 20 foundation models and found robustness scores ranging from 0.463 to 0.877, with no model achieving full robustness [14]. They found a correlation (ρ = 0.692) between training data size and robustness and demonstrated that even combining data robustification (stain normalization) with representation robustification (batch correction) could not eliminate performance drops across medical centers. When the same model is applied to slides from different hospitals or scanners, systematic differences in tissue preparation, staining intensity, and digitization introduce non-biological variation that models may have learned to exploit, causing classification accuracy to drop on institutions not seen during training.

2.3. Data Leakage in Digital Pathology: A Systematic Problem

The problem of data leakage in digital pathology has been systematically documented. Bussola et al. demonstrated that predictive performance estimates can be inflated by up to 41% when tiles from the same patient appear in both training and validation sets [15]. Their work established that patient-wise splitting is essential. This issue is then exacerbated when fractions or subregions of slides (referred to as tiles or patches) are considered.
This concern extends to AI competitions. While the PANDA challenge organizers implemented blinded external validation on held-out cohorts from the US and EU, achieving QWK scores of 0.862 and 0.868 respectively [6], questions remain about whether patient-level separation was enforced during the competition’s development phase, when participants had access to training data. Competition environments create incentives for participants to exploit any available shortcuts, including patient-level correlations [16].
More broadly, the gap between retrospective AI performance and real-world clinical efficacy remains pronounced. Recent reviews emphasize that, although many models achieve favorable results in retrospective studies, rigorous prospective, multi-center evaluation is still rare, which in turn constrains the impact on clinical guidelines and everyday decision-making [17]. The shortcomings of available datasets may contribute to persistent performance gaps [18,19]. Our benchmark addresses the slide-level confounding problem by explicitly measuring within-slide vs. cross-slide generalization gaps, a necessary (though not sufficient) condition for robust clinical deployment. Measuring these separately allows us to distinguish models that perform well because they have learned generalizable Gleason features (low gap, high cross-slide accuracy) from those that exploit specimen-specific shortcuts (high gap, inflated within-slide accuracy). A model achieving high within-slide accuracy may still fail on new patient specimens; the cross-slide metric exposes this failure mode while the gap quantifies its magnitude.

2.4. Gleason Grading as a Robustness Test Case

Prostate cancer Gleason grading represents an ideal test case for robustness evaluation because the GP3/GP4 distinction directly influences treatment decisions (active surveillance vs. intervention). Inter-observer variability (κ = 0.43–0.67) establishes realistic performance bounds [20,21], and architectural features distinguishing patterns are subtle and easily confounded by technical artifacts [22].

3. Methods

3.1. Source Data: PANDA-PLUS

PANDA-PLUS comprises 546 whole-slide images from the PANDA challenge [6], re-annotated at pixel level through a hierarchical annotation pipeline over approximately three years. Annotations were performed by trained undergraduate pre-medical students, supervised by senior reviewers, with final verification by a board-certified pathologist (>30 years of experience). Annotators were recruited from the Brigham Young University pre-medical undergraduate population through the AI in Medicine Association and were trained in the fundamentals of prostate histology, the Gleason grading system, gland morphology, and digital annotation techniques [23,24]. Each glandular structure received a Gleason pattern classification (Benign, GP3, GP4, or GP5) at 20× magnification using QuPath [25].

3.2. Benchmark Slide Selection Criteria

To enable rigorous within-slide vs. cross-slide comparison, we applied stringent selection criteria. More than 30 patches of majority benign, GP3, and GP4 tissue were required per slide with complete, pixel-level annotations verified by an expert pathologist. GP5 was excluded from primary analyses because only one of the nine benchmark slides contained GP5 patches (slide 416, n = 58), which is insufficient for the leave-one-slide-out evaluation of this class. GP1 and GP2 are rarely annotated in contemporary practice and are not present in the PANDA dataset. The Benign/GP3/GP4 distinction was prioritized because it corresponds to the clinically consequential active surveillance versus intervention decision boundary, where labeling accuracy most directly affects patient outcomes. Slides with significant artifacts, focus issues, or tissue damage were excluded. Given that each slide in the PANDA dataset represents an independent biopsy specimen, our cross-slide evaluation inherently tests generalization beyond individual tissue samples. The within-slide vs. cross-slide accuracy gap measured therefore represents the model’s ability to generalize learned Gleason patterns to new specimens rather than memorizing specimen-specific features. From 546 PANDA-PLUS images, nine slides met all criteria (Table 2).

3.3. Patch Processing

Non-overlapping patches were extracted from annotated tissue regions at two resolutions, 224 × 224 pixels at 20× magnification (0.4862 µm/pixel), being the standard input size for most foundation models, and 512 × 512 pixels at 20× magnification (0.4862 µm/pixel) providing larger context windows for models supporting larger inputs. The 224 × 224 patches are non-overlapping subsets of the 512 × 512 patches. Each patch received a ground-truth label based on the dominant (>50%) Gleason pattern from pixel-level annotations, on average comprising 83.0% (224 × 224) and 89.3% (512 × 512) of the patch. Patches with no dominant class were excluded. Each patch was processed under eight augmentation conditions to assess robustness to technical variation, shown in Table 3.

3.4. Quantifying Augmentation Invariance

To contextualize the augmentation experiments described above, we assessed the degree to which each foundation model’s embeddings are invariant to the applied augmentations. DINOv2 and iBOT both use a student–teacher architecture in which a student network is trained to produce embeddings that match those of a slowly updated teacher network when shown differently augmented versions of the same image patch. This training objective encourages the model to treat augmentation-induced variation as uninformative and to preserve structure unrelated to the applied augmentation. As a result, models trained under these objectives are expected to produce similar embeddings for augmented and unaugmented versions of the same input, particularly for augmentation strategies that overlap with those used during pre-training [12,13]. To quantify this, we computed pairwise cosine similarity between each patch’s baseline embedding and its corresponding embedding under each augmentation condition (embedding extraction protocols are described in Section 3.6 below), sampled across 1000 randomly selected patches per model. High cosine similarity (approaching 1.0) indicates that the augmentation has minimal effect on the learned representation, while lower similarity indicates that the augmentation perturbs the embedding beyond the model’s learned invariances.

3.5. Embedding Extraction

For each of the seven foundation models, embeddings were extracted from all image patches under every augmentation setting according to model-specific preprocessing protocols. Virchow and Virchow2 produced 2560-dimensional representations obtained by concatenating the CLS token with the mean of patch tokens, whereas UNI and UNI2 yielded 1024-dimensional CLS-token embeddings, all using ImageNet normalization. Phikon generated 768-dimensional CLS-token embeddings from its ViT-B backbone, and Phikon-v2 generated 1024-dimensional CLS-token embeddings from its ViT-L backbone, both with ImageNet normalization, while HistoEncoder features were derived following the official repository guidelines.

3.6. Primary Metrics: Within-Slide vs. Cross-Slide Accuracy

The primary evaluation metrics contrasted within-slide and cross-slide performances. Within-slide accuracy was computed by treating each slide independently, applying a stratified 80/20 train-test split using k-nearest neighbors (k = 5) classification, and averaging accuracy across slides. Cross-slide accuracy was estimated using leave-one-slide-out cross-validation, training on eight slides and testing on the held-out slide, then averaging accuracy over all held-out slides. The accuracy gap was defined as within-slide minus cross-slide accuracy, with larger gaps interpreted as evidence of stronger slide-level confounding. The within—cross-slide gap measured is intended to reflect the degree to which specimen-specific signatures are encoded, even when the model generalizes well within a specimen. Cohen’s kappa was not calculated, as applying kappa to model predictions against verified ground truth would imply model outputs to be as epistemically valid as the expert annotations. Additional metrics are described in Table 4.
The benchmark includes standardized visualizations: t-SNE projections colored by class and by slide, centroid distance matrices showing within-slide vs. cross-slide distances, per-slide accuracy heatmaps identifying challenging cases, robustness radar plots for multi-model comparison, and accuracy hierarchy diagrams illustrating the leakage problem.

4. Results

4.1. Quantifying Augmentation Invariance

The degree of augmentation invariance varied by model and augmentation strategy (Table 5). Photometric transformations showed an average cosine similarity ranging from 0.799 to 0.985. Cosine similarity exceeded 0.97 for all models under the color jitter and HED augmentation strategies. The greatest dissimilarity is observed under the heavy geometric and combined aggressive augmentation strategies. Additionally, the greatest model variation is observed under these conditions: Virchow embeddings have cosine similarities of 0.424 and 0.410, respectively, while HistoEncoder reports similarities of 0.839 and 0.777.

4.2. Multi-Model Comparison: Primary Metrics

Classification performance varied substantially across the seven foundation models (Table 6). Within-slide accuracy ranged from 0.715 (Virchow, UNI2) to 0.796 (HistoEncoder), while cross-slide accuracy ranged from 0.472 (Virchow2, Phikon-v2) to 0.597 (HistoEncoder) under baseline conditions. HistoEncoder achieved both the highest cross-slide accuracy (0.597) and the smallest accuracy gap (0.199), while Phikon exhibited the largest gap (0.269) despite mid-range within-slide performance (0.746).
All seven models demonstrated positive accuracy gaps, indicating consistently higher performance when training and testing on patches from the same slide compared to leave-one-slide-out cross-validation. The Virchow and Virchow2 models, which share identical architectures but differ in training data scale (1.5M vs. 3.1M WSIs), showed similar within-slide accuracy (0.715 vs. 0.718) but divergent cross-slide performance (0.508 vs. 0.472).
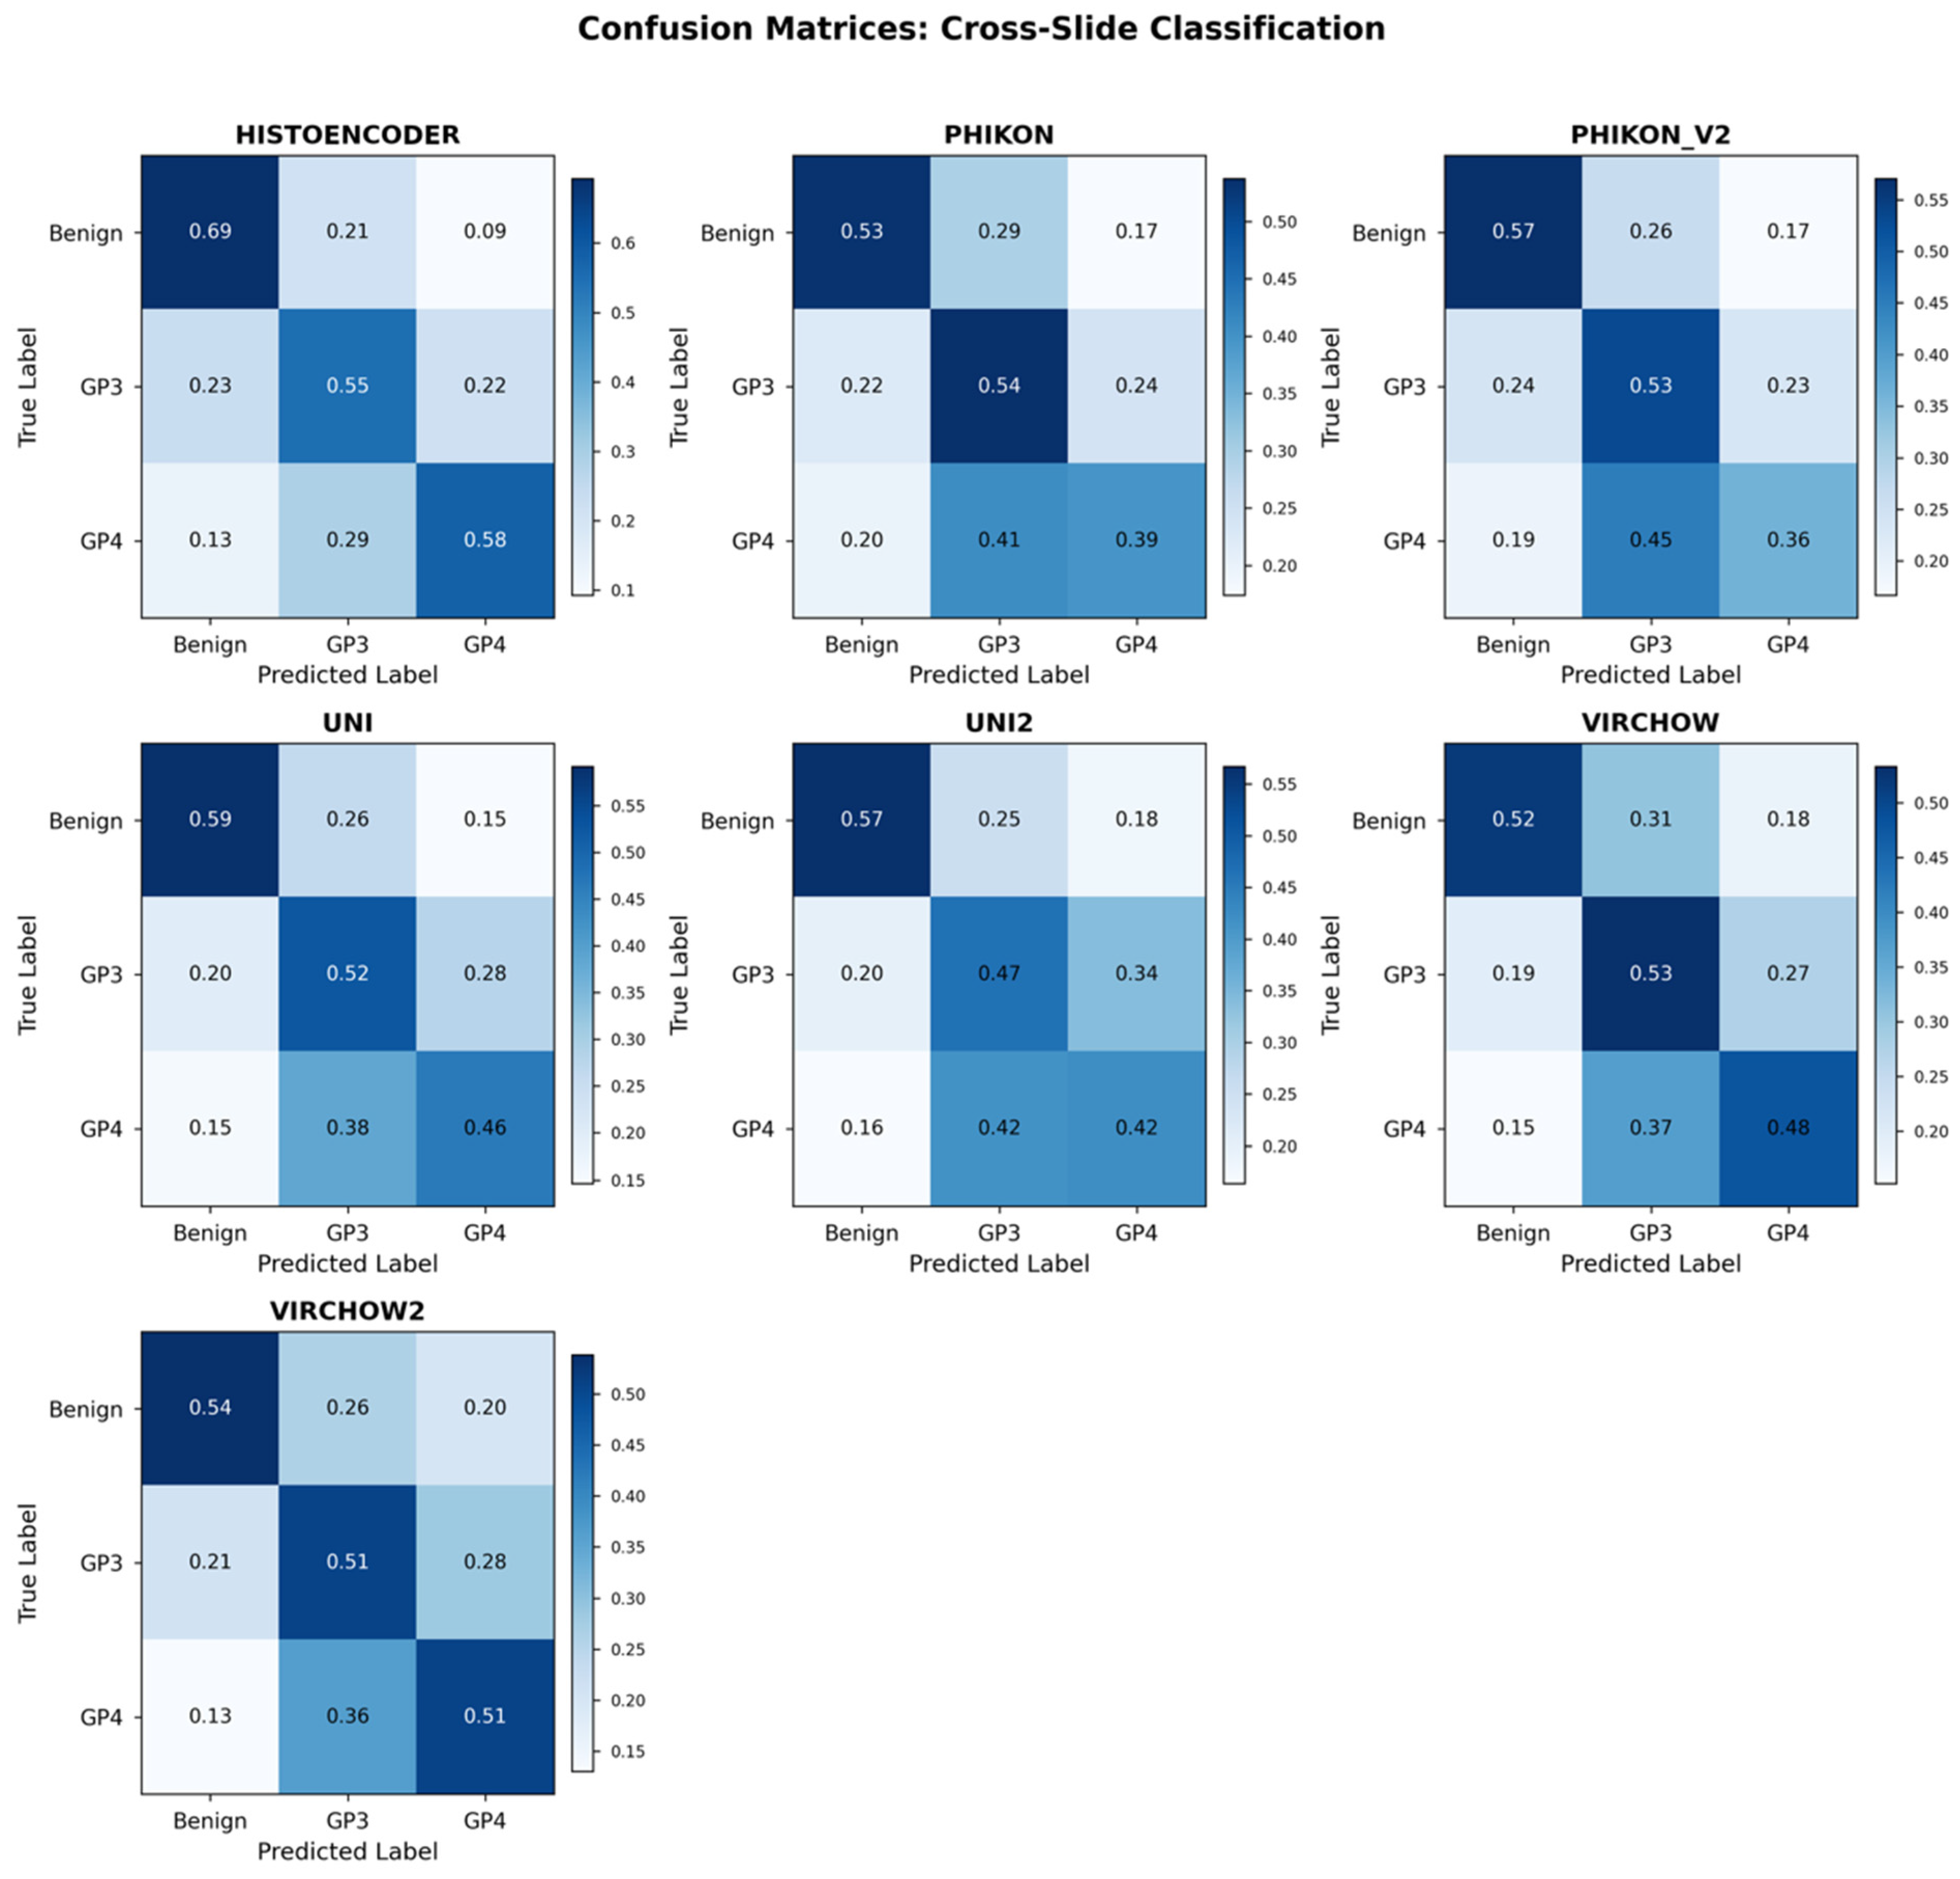
Confusion matrices (Figure 2) revealed distinct error patterns across models. Benign-versus-tumor discrimination was strongest for all models, while GP3-GP4 boundary errors were more frequent. HistoEncoder showed proportionally fewer cross-class errors between benign and tumor tissue compared to general-purpose models.
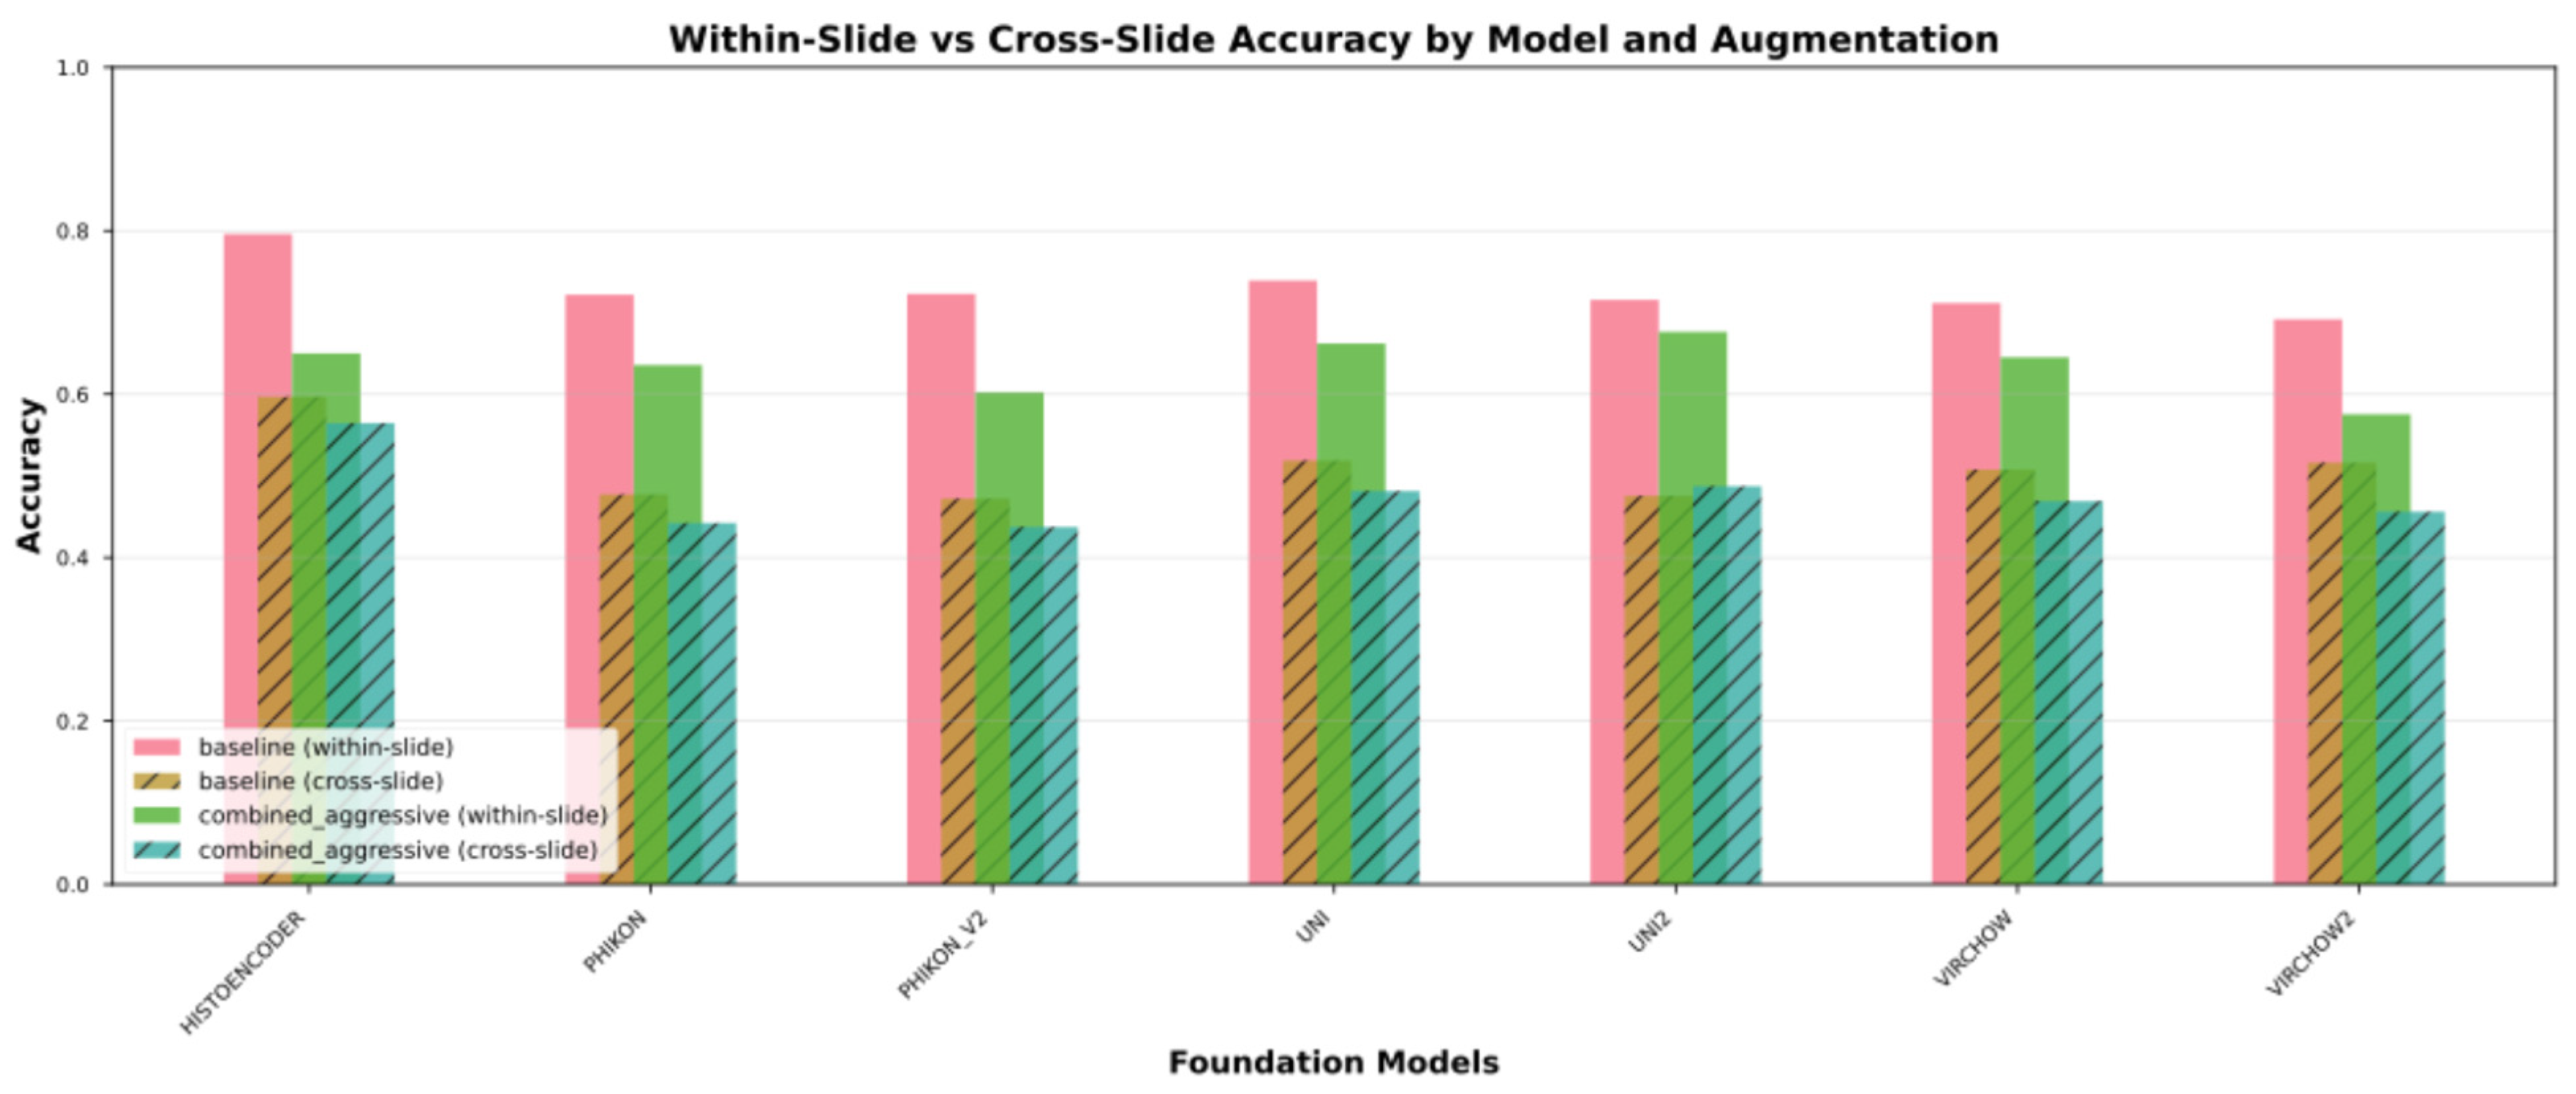
Across all seven models, baseline within-slide accuracy exceeded cross-slide accuracy and combined aggressive augmentation reduced both metrics (Figure 3). HistoEncoder maintained the highest cross-slide performance under both conditions, while the Virchow models showed the largest absolute drops in cross-slide accuracy when moving from baseline to combined aggressive augmentation. UNI2 was the sole model to exhibit a higher cross-slide accuracy under the combined aggressive augmentation relative to baseline.

4.3. Multi-Model Comparison: Robustness Metrics

Slide-level encoding strength varied markedly across models (Table 7). Slide ID prediction accuracy ranged from 0.807 (Virchow) to 0.903 (HistoEncoder), substantially exceeding the chance baseline of 0.111 (1/9 slides). The kNN same-slide fraction metric, which measures the proportion of k = 50 nearest neighbors originating from the same slide, ranged from 0.553 (Virchow2) to 0.638 (Phikon), compared to an expected chance value of 0.111.
Silhouette scores computed using class labels were near-zero or slightly negative for all models (range: −0.016 to 0.015), indicating substantial overlap in the embedding space between Gleason pattern classes. In contrast, silhouette scores computed using slide IDs were consistently positive (range: 0.018 to 0.091), with HistoEncoder showing the highest slide-based clustering (0.091).
The Virchow models achieved the lowest slide ID accuracies (0.807–0.810) among large models and the lowest kNN same-slide fraction (0.553–0.579) overall, with Virchow2 simultaneously showing near-zero class silhouette scores (0.001) and low slide silhouette scores (0.021). HistoEncoder exhibited the strongest slide-level encoding (slide ID accuracy 0.903, silhouette score 0.091) alongside the highest cross-slide classification performance.
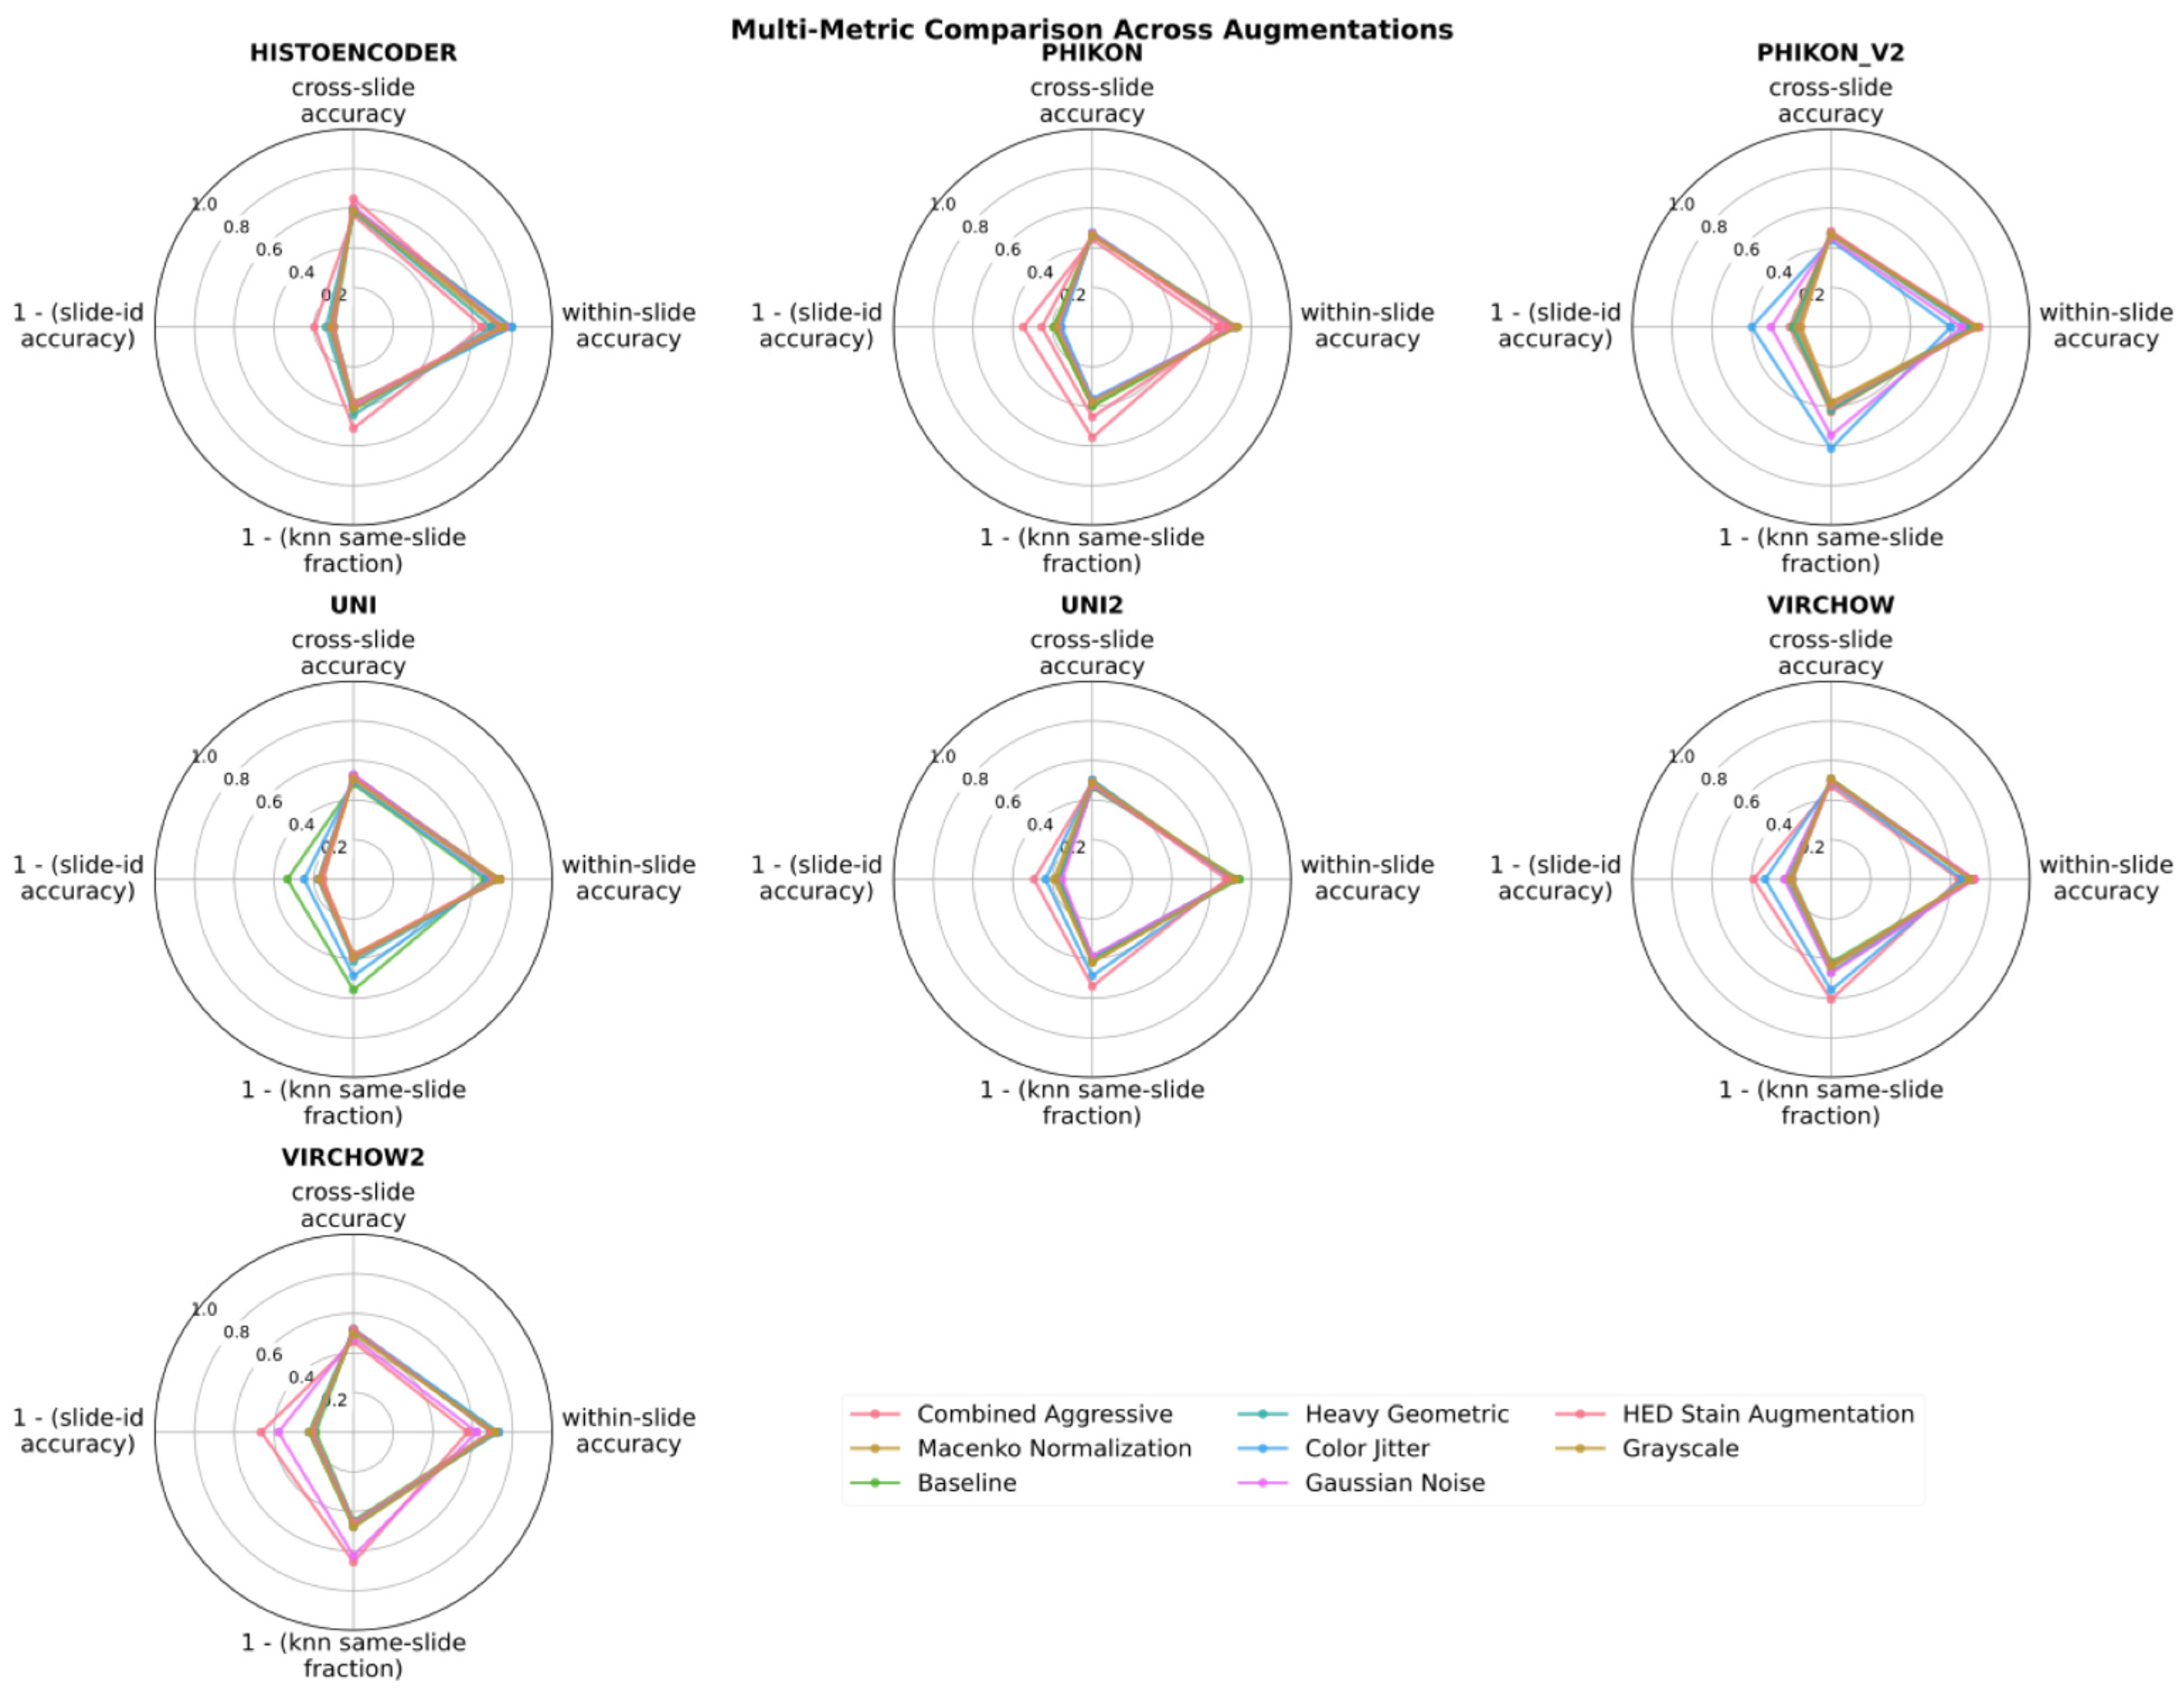
Figure 4 radar plots compare models across four metrics simultaneously: cross-slide accuracy, within-slide accuracy, kNN same-slide fraction (inverted), and slide ID accuracy (inverted). Models with larger polygons demonstrate more balanced robustness profiles.

4.4. Effect of Augmentation on Model Rankings

Model performance and rankings shifted under different augmentation conditions (Figure 4). Under baseline conditions, HistoEncoder ranked first in cross-slide accuracy (0.597), followed by UNI (0.519) and Virchow (0.508). Grayscale conversion, which eliminates all color information, reduced cross-slide accuracy for all models, with reductions ranging from 0.5 to 4 percentage points.
Heavy geometric augmentation (180° rotation, horizontal and vertical flips) produced variable effects across models. Color jitter augmentation, simulating lighting variation through brightness, contrast, saturation, and hue perturbations, decreased cross-slide accuracy by 0.5 to 3 percentage points relative to baseline across models.
Stain normalization methods (Macenko, HED augmentation) showed model-specific responses. Phikon and Phikon-v2, both trained on public TCGA data with standardized staining protocols, exhibited different sensitivity patterns to stain perturbations compared to models trained on proprietary multi-institutional data. The combined aggressive augmentation condition, applying all transformations sequentially, resulted in the largest performance degradation across all models, with cross-slide accuracy declining to 0.437–0.565.
Accuracy gap magnitude (within-slide minus cross-slide) remained relatively stable across augmentation conditions for most models, varying by less than 0.06 for all but HistoEncoder and Phikon-v2. HistoEncoder maintained the smallest gap (0.09–0.21) across all eight augmentation conditions.

4.5. Resolution Effects (224 × 224 vs. 512 × 512)

Among the evaluated models, HistoEncoder was the only architecture operating on 512 × 512 patches, while all other foundation models were assessed at 224 × 224 resolution. Under these conditions, HistoEncoder achieved the highest within-slide (0.796) and cross-slide (0.597) accuracy, the smallest accuracy gap (0.199), and the highest slide ID prediction accuracy (0.903) among all models in the benchmark.

4.6. Training Method Comparison

Phikon (iBOT pretraining) and Phikon-v2 (DINOv2 pretraining) provide a controlled comparison of self-supervised learning strategies, both trained on public TCGA data. Phikon achieved higher cross-slide accuracy (0.477) compared to Phikon-v2 (0.472) under baseline conditions, despite Phikon-v2’s larger model size (300M vs. 86M parameters) and substantially larger training dataset (460M tiles vs. 40M tiles).
Phikon-v2 demonstrated lower within-slide accuracy (0.722 vs. 0.746) and a smaller accuracy gap (0.250 vs. 0.269) relative to Phikon. Slide-level encoding metrics were nearly identical between the two models, with a slide ID accuracy of 0.846 (Phikon) versus 0.850 (Phikon-v2), and silhouette scores for slide clustering of 0.041 versus 0.042.
Under grayscale augmentation, Phikon-v2 showed a near identical cross-slide performance compared to a slight performance decrease by Phikon (−1.9 percentage points). Under all stain normalization conditions except combined aggressive and heavy geometric (Macenko, HED, etc.), both models showed similar robustness, with cross-slide accuracy shifting less than 2.7 percentage points.

4.7. Embedding Space Visualization

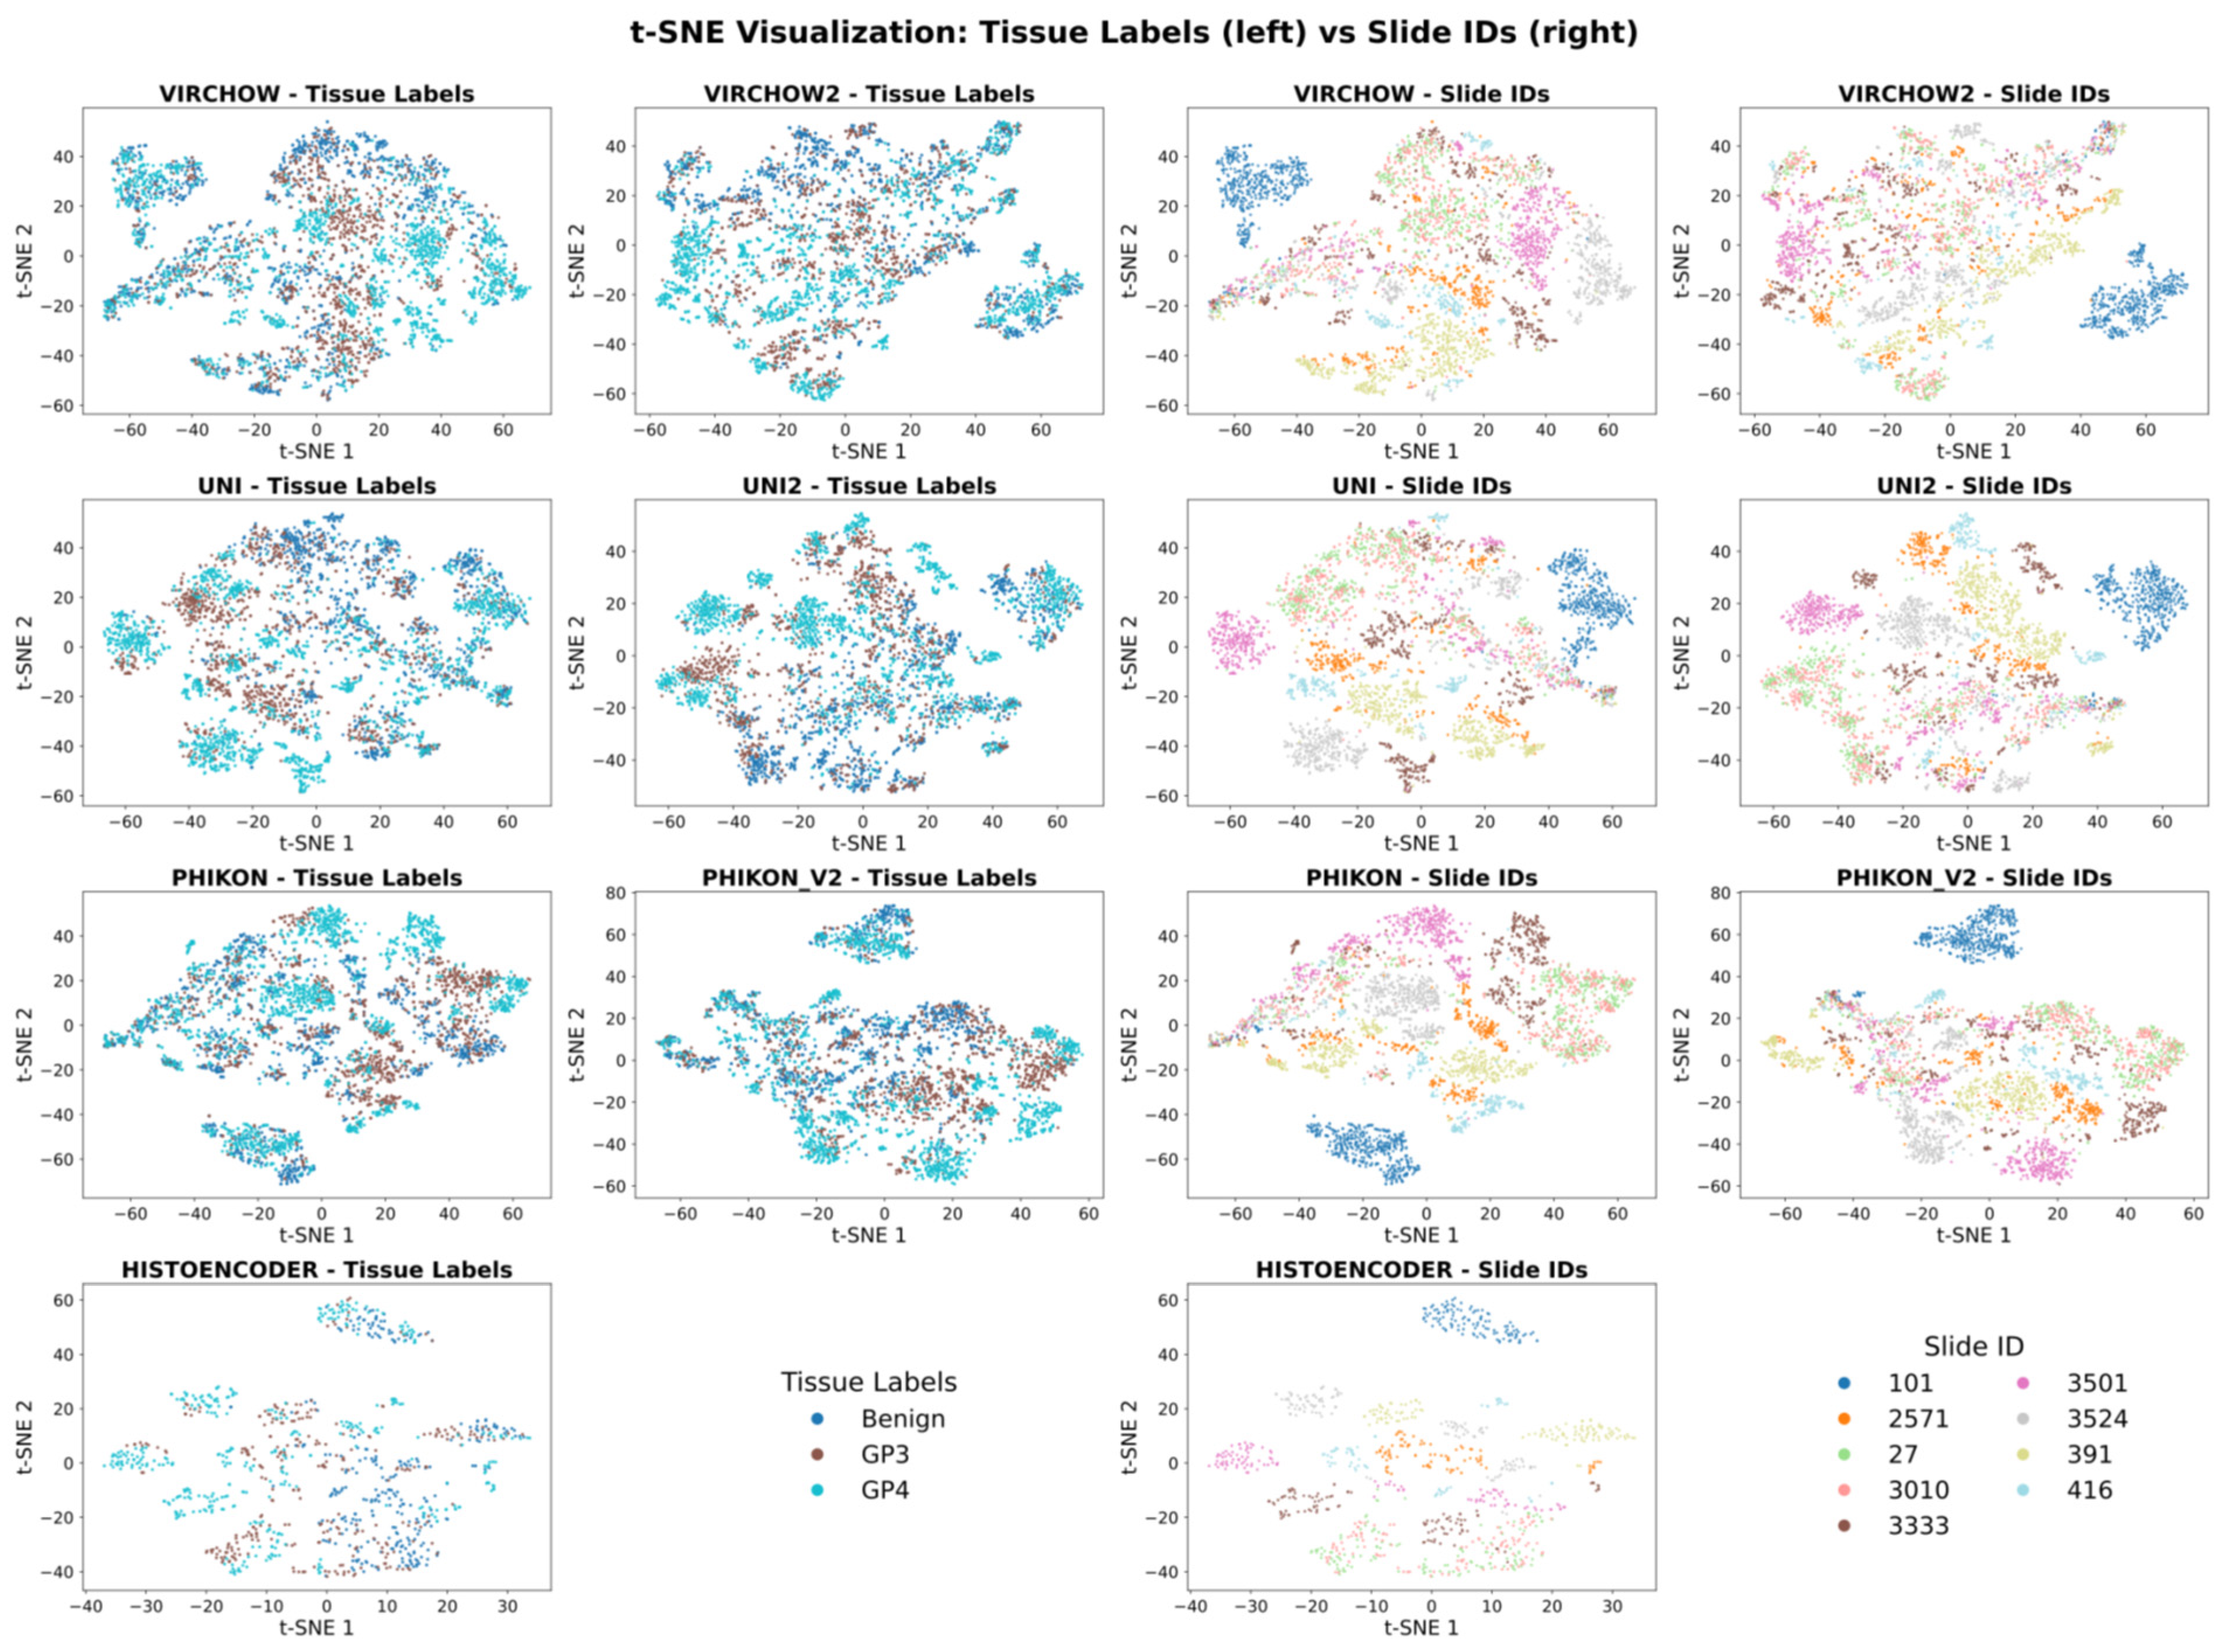
HistoEncoder embeddings showed the most pronounced slide-based clustering. Virchow2 embeddings exhibited the least visible slide-based structure in t-SNE space, corresponding to its second lowest slide ID accuracy (0.810). Class separation, measured qualitatively by visual cluster distinctness in t-SNE plots (Figure 5), was weakest for the GP3-GP4 boundary across all models. Benign tissue showed partial separability from tumor classes (GP3, GP4), but with considerable overlap.

4.8. Per-Slide Analysis

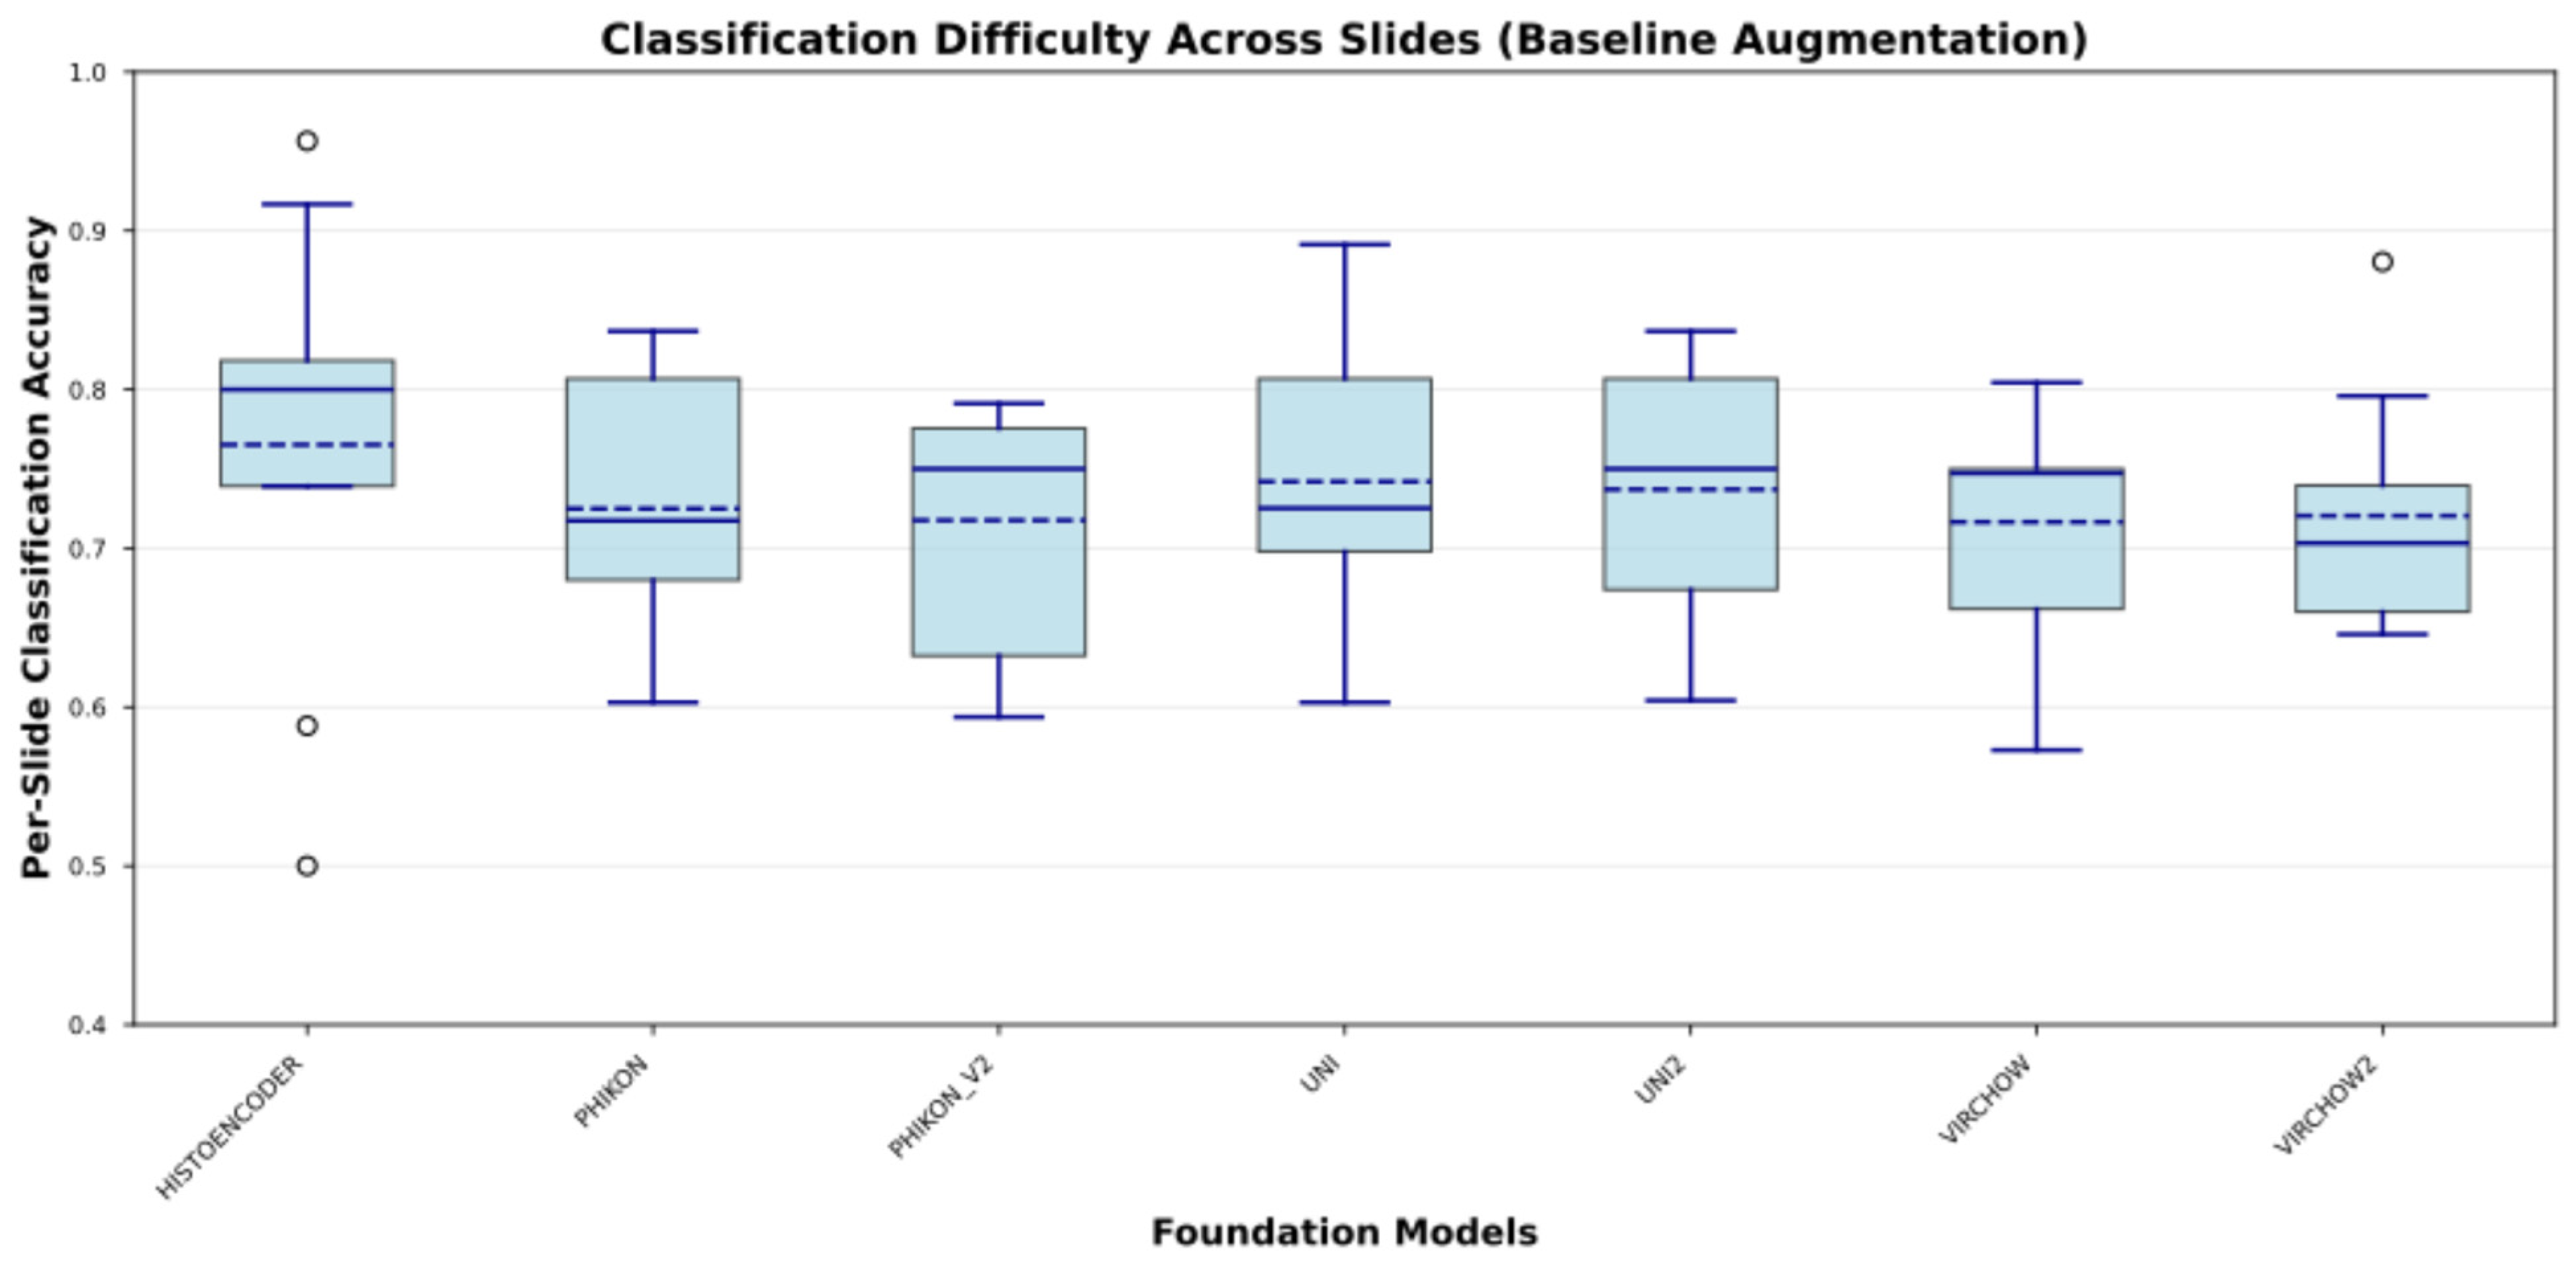
Across slides, median cross-slide accuracy ranged from approximately 0.7 to 0.8 depending on the model, with substantial variability in performance between slides (Figure 6). HistoEncoder showed the highest median per-slide accuracy and the narrowest interquartile range with several low-accuracy outliers corresponding to particularly challenging slides, whereas general-purpose models exhibited wider spreads.

5. Discussion

5.1. Quantifying Augmentation Invariance

Given the discriminative self-supervised pretraining inherent to DINOv2 and iBOT paradigms, it would be expected that foundation models demonstrate a level of augmentation invariance. This is largely observed for the photometric augmentations color jitter and HED stain augmentation: with cosine similarities greater than 0.97, these augmentations are effectively inert. Model-to-model variation is most dramatic under the geometric transformations; HistoEncoder maintains 0.839 cosine similarity for heavy geometric while Virchow drops to 0.424. The high dissimilarity under these conditions suggests a gap in learned geometric invariance, not a loss of biologically significant features: the tissue content is unchanged, but the embedding drifts because the model has not been trained to treat these orientations as equivalent.
Our results demonstrate that post hoc augmentation during embedding extraction does not remediate WSI-specific feature collapse. For augmentations where invariance is high, the embeddings do not meaningfully shift and thus augmentation does not offer a strategy for remediation. For augmentations where embeddings do shift substantially, slide-level confounding persists, suggesting that slide identity is encoded in features orthogonal to that which effective augmentations target.
This finding has important implications: because post hoc augmentation during inference does not remediate slide-level confounding—whether augmentations leave embeddings unchanged or substantially perturb them, confounding persists—improving model robustness requires interventions applied during pre-training, such as using diverse multi-institutional training data, incorporating stain augmentation during pre-training, or adopting architectural constraints that discourage the encoding of specimen-specific signatures. This finding motivates our use of within-slide vs. cross-slide accuracy as the primary robustness metric rather than augmentation sensitivity alone.

5.2. Model Rankings and Trade-Offs

Across the seven evaluated models, HistoEncoder achieved the highest cross-slide accuracy under the baseline condition and exhibited the smallest within–cross accuracy gap, suggesting comparatively stronger generalization across held-out slides in this prostate-specific task. General-purpose foundation models trained on large, heterogeneous datasets (Virchow, Virchow2, UNI, UNI2, Phikon, Phikon-v2) displayed lower cross-slide accuracy than HistoEncoder and uniformly positive gaps, with Phikon showing the largest gap despite mid-range within-slide performance. Licensing status did not align with robustness: both commercially deployable and research-only models appeared across the spectrum of cross-slide accuracy and gap magnitudes, with no consistent separation by license category in primary or robustness metrics. Training data scale likewise showed no monotonic relationship with robustness in this benchmark; for example, Virchow2, trained on more WSIs than Virchow, achieved similar within-slide accuracy but lower cross-slide accuracy in the baseline setting, and Phikon-v2, trained on many more tiles than Phikon, did not surpass it on cross-slide accuracy. Relative to its predecessor, Phikon-v2’s public-data-only training did not confer an advantage on the primary cross-slide metric under baseline conditions; the two models showed closely matched slide-encoding indicators and similar responses to stain-focused augmentations. On the prostate-specific task, HistoEncoder outperformed general-purpose encoders in both within- and cross-slide accuracy while also presenting the highest slide ID accuracy, reflecting a distinct trade-off profile relative to general-purpose counterparts. However, its superior performance cannot be unambiguously attributed to its architecture or training corpus alone, as it is also the only model evaluated at 512 × 512 resolution. The larger patch size provides substantially more spatial context per inference, which may independently contribute to higher classification accuracy.
Our results provide complementary evidence to the cross-center robustness findings of de Jong et al. [3]. While their Robustness Index measures the dominance of biological features (cancer type) over institutional confounders across medical centers, our metrics quantify slide-level confounding within a single institution. Notably, Virchow2’s highest Robustness Index (1.20) in their multi-center evaluation corresponds to the second lowest slide ID accuracy (81.0%) among comparable models in our benchmark, suggesting consistency in reduced confounding across evaluation contexts. However, the relationship between their Robustness Index and our cross-slide accuracy is non-monotonic: Virchow (Index: 0.93) achieved higher cross-slide accuracy (50.8%) than Virchow2 (47.2%), despite Virchow2’s superior Robustness Index. This dissociation suggests that the reduced encoding of confounders is necessary but insufficient for robust task-specific performance, and that different types of confounding (institutional vs. slide-level) may require distinct mitigation strategies.

5.3. The Persistence of Slide-Level Confounding

All models demonstrated higher within-slide than cross-slide performance, and slide ID could be predicted from embeddings well above chance for every model, indicating persistent slide-level signatures in representation space. These findings suggest that, even when classification accuracy is moderate at the patch level, embeddings retain substantial information specific to individual slides, sufficient to predict slide identity with high accuracy, indicating that slide-level signatures represent a prominent component of the learned representation space rather than a minor artifact. This is further supported by positive slide-based silhouette scores and t-SNE visualizations showing distinct slide clusters across models. This failure mode is distinct from classic overfitting, for a model can generalize perfectly within a slide while entirely failing to transfer to a new specimen.

5.4. Benchmark Limitations and Future Extensions

This study focuses on a single organ site (prostate), includes primarily one contributing institution, and evaluates nine slides selected for stringent annotation quality and class coverage, which may not capture the full spectrum of specimen and acquisition variability. From a clinical deployment perspective, our benchmark evaluates specimen-level robustness but not patient-level robustness (multiple specimens per patient), institution-level robustness (cross-center generalization), or temporal robustness (performance stability as protocols evolve). All benchmark slides originate from Radboud University Medical Center, meaning that cross-slide variation in our benchmark reflects within-institution specimen variability but does not capture cross-institutional difference in staining protocols, scanner hardware, or tissue preparation. While specimen-level generalization is necessary for clinical utility, it is not sufficient; models must also generalize across these additional hierarchies before deployment in diverse clinical settings. In addition, it should be noted that the nine-slide composition of the present benchmark limits the statistical precision of pairwise model comparisons, and that observed differences between similarly performing models should be interpreted as indicative of relative rankings rather than definitive performance differences.

5.5. Implications for Competition Design and Benchmark Reporting

The results underscore the necessity of rigorous data splitting strategies when evaluating pathology foundation models. While our benchmark measures slide-level generalization, the consistent accuracy gaps observed (20–27 percentage points) demonstrate that even specimen-level confounding poses substantial challenges for current models.
Competition organizers and benchmark creators should implement hierarchical splitting strategies that match their data structure: patient-level splits when multiple samples per patient exist, slide-level splits when slides represent independent specimens, and institution-level splits when evaluating cross-center generalization. Leaderboards should report performance at each relevant level of hierarchy separately (e.g., within-patient vs. cross-patient, within-slide vs. cross-slide, within-institution vs. cross-institution), as divergence between these metrics reveals susceptibility to shortcut learning at different granularities.
Benchmarks should incorporate multi-institutional data with explicit stratification to guard against center-specific shortcuts and should invest in expert re-annotation where label quality is uncertain, with inter-observer agreement statistics made explicit. We propose a robustness-first reporting standard that requires: (1) demonstration that test performance generalizes beyond the finest grain of data collection (patches → slides → patients → institutions → scanners), (2) quantification of accuracy gaps at each hierarchical level, and (3) measurement of slide/patient/institution encoding strength using metrics such as those presented here (slide ID accuracy, kNN same-slide fraction, silhouette scores). Such standards would better align evaluation with the intended deployment contexts and expose models that achieve high aggregate accuracy through the memorization of specimen-specific or institutional signatures rather than robust biological feature learning.

5.6. Clinical Implications

Our findings have direct implications for deploying AI-assisted Gleason grading in clinical workflows. The 20–27 percentage point accuracy gaps between within-slide and cross-slide performance suggest that models validated on retrospective datasets may underperform on new patient specimens by similar margins. For HistoEncoder, the best-performing model, 59.7% cross-slide accuracy falls below the lower bound of inter-observer agreement (κ = 0.43–0.67), indicating that current foundation models cannot yet match pathologist-level reliability when generalizing to new specimens.
The persistent slide-specific encoding across all models (81–90% slide ID accuracy) poses risks for clinical deployment. If deployed models rely on specimen-specific signatures, they may fail when scanning protocols, tissue processing, or staining methods change, common occurrences in clinical laboratories. This failure mode would be particularly problematic for the GP3/GP4 boundary, where our confusion matrices show the highest error rates and where clinical consequences (treatment selection) are most significant.
The tissue-specific HistoEncoder model’s superior cross-slide performance (59.7% vs. 47–52% for general-purpose models) suggests that organ-specific foundation models may offer better clinical utility than general-purpose alternatives for diagnostic tasks with narrow pathological scope. However, its high slide encoding (90.3% slide ID accuracy) indicates that even specialized training cannot eliminate specimen-specific confounding without explicit architectural or training interventions.
These findings suggest that current foundation models do not yet meet the performance thresholds required for autonomous clinical use in Gleason grading, requiring task-specific fine-tuning with robust validation protocols before clinical integration. Institutions should prioritize models demonstrating strong cross-specimen performance on internal validation cohorts over those achieving high accuracy on public benchmarks, where data leakage may inflate performance estimates.

5.7. Recommendations for Practitioners

Before deployment, practitioners should establish evaluation protocols that match their intended use case. At minimum, this requires splits that prevent data leakage at the finest grain of data collection, slide-level separation when slides represent independent specimens, patient-level separation when multiple samples per patient are collected, and institution-level separation for cross-center deployment. Our benchmark demonstrates that even slide-level separation, a less stringent requirement than patient-level separation, reveals substantial performance gaps of 20–27 percentage points (pp) across state-of-the-art foundation models.
Accuracy alone is insufficient for robustness evaluation. Practitioners should complement classification metrics with structural assessments of the embedding space: (1) accuracy gaps between within-group and cross-group performance quantify the magnitude of confounding, (2) slide/patient ID prediction accuracy reveals how strongly specimen identity is encoded, (3) kNN same-slide/patient fraction measures local clustering by non-biological variables, and (4) silhouette scores computed using both biological labels and confounding variables assess the relative strength of desired versus undesired structure. Models showing high slide ID accuracy (>70%) despite moderate classification performance should be treated as potentially encoding shortcuts rather than biological features.
Reported competition or retrospective performance should be interpreted cautiously unless validation methodology is transparent. Specifically, practitioners should verify: (1) whether data splitting prevented leakage at all hierarchical levels (patch/tile, slide, patient, institution), (2) whether reported metrics reflect cross-group generalization or within-group performance, and (3) whether augmentation strategies were applied during training (potentially beneficial) versus only during inference (minimally effective, as our results demonstrate). The gap between PANDA competition performance (QWK ~0.93) and subsequent real-world deployment studies suggests that shortcuts exploitable during development may not transfer to clinical settings.
When baseline robustness is inadequate for the intended application, practitioners should consider: (1) tissue-specific foundation models when available (HistoEncoder achieved 59.7% cross-slide accuracy vs. 47–52% for general-purpose models in our prostate-specific task), (2) task-specific fine-tuning with carefully designed splits and augmentation strategies applied during training, and (3) ensemble approaches that explicitly combine models with different robustness profiles. Evaluation protocols should mirror the deployment setting, including institutional diversity, scanner heterogeneity, and staining protocol variation when relevant.
Existing models should be audited for potential hierarchical leakage before clinical use. This audit should: (1) verify that training data splits prevented all forms of leakage (patient, institution, scanner), (2) measure cross-group generalization performance on held-out data matching the deployment context, (3) quantify slide/patient/institution encoding strength using structural metrics, and (4) assess robustness to expected technical variation through systematic augmentation testing. Models failing these audits require retraining with corrected splits or architectural modifications before deployment.

6. Conclusions

We introduce PANDA-PLUS-Bench, a purpose-built benchmark for evaluating WSI-specific feature collapse in pathology foundation models. Using this benchmark, we evaluated seven foundation models representing diverse training strategies, data scales, and licensing terms, and found that all models exhibited substantial slide-level encoding (slide ID prediction accuracy 81–90% vs. 11% chance), with accuracy gaps between within-slide and cross-slide performance ranging from 20 to 27 percentage points. Tissue-specific training (HistoEncoder) achieved the highest cross-slide accuracy (59.7%) but also the strongest slide-specific signatures, while general-purpose models trained on larger datasets showed more variable robustness profiles with no consistent relationship between training scale and cross-slide generalization.
Our results demonstrate that current pathology foundation models, despite strong within-slide performance, exhibit persistent susceptibility to slide-level confounding that cannot be remediated through inference-time augmentation alone. Post hoc color normalization, geometric transformations, and complete grayscale conversion preserved high slide ID prediction accuracy, indicating that slide identity is encoded through texture, compression artifacts, and structural patterns learned during pre-training. The benchmark and evaluation toolkit are available on GitHub and HuggingFace, enabling standardized robustness evaluation as foundation models continue to evolve. For clinical adoption, our results suggest that current foundation models require: (1) explicit validation on held-out specimens from the target institution, (2) monitoring for performance degradation when scanning or processing protocols change, and (3) consideration of tissue-specific models when available. The benchmark and evaluation toolkit we provide enable institutions to perform these validations systematically before deployment. We encourage the community to benchmark additional models using our open-source framework and contribute to understanding and ultimately solving the challenge of slide-level confounding in computational pathology.


Author Contributions

Conceptualization, D.D.C.; methodology, D.D.C.; software, D.D.C. and J.L.E.; validation, D.D.C. and J.L.E.; formal analysis, D.D.C. and J.L.E.; investigation, D.D.C. and J.L.E.; resources, D.D.C.; data curation, D.D.C. and J.L.E.; writing—original draft preparation, D.D.C. and J.L.E.; writing—review and editing, D.D.C. and J.L.E.; visualization, D.D.C. and J.L.E.; supervision, D.D.C.; project administration, D.D.C.; funding acquisition, D.D.C. All authors have read and agreed to the published version of the manuscript.

Funding

This research received no external funding.

Data Availability Statement

The complete benchmark dataset, including an executable Google Colab notebook, is available at https://github.com/dellacortelab/panda-plus-bench and https://huggingface.co/datasets/dellacorte/PANDA-PLUS-Bench.

Conflicts of Interest

D.D.C. is cofounder of Pathtools.ai, a digital pathology company. J.L.E. declares no conflict of interest.

References

  1. Chen, R.J.; Ding, T.; Lu, M.Y.; Williamson, D.F.; Jaume, G.; Song, A.H.; Chen, B.; Zhang, A.; Shao, D.; Shaban, M. Towards a general-purpose foundation model for computational pathology. Nat. Med. 2024, 30, 850–862. [Google Scholar] [CrossRef] [Scilit] [PubMed]
  2. Vorontsov, E.; Bozkurt, A.; Casson, A.; Shaikovski, G.; Zelechowski, M.; Severson, K.; Zimmermann, E.; Hall, J.; Tenenholtz, N.; Fusi, N. A foundation model for clinical-grade computational pathology and rare cancers detection. Nat. Med. 2024, 30, 2924–2935. [Google Scholar] [CrossRef] [Scilit]
  3. de Jong, E.D.; Marcus, E.; Teuwen, J. Current pathology foundation models are unrobust to medical center differences. arXiv 2025, arXiv:2501.18055. [Google Scholar] [CrossRef] [Scilit]
  4. Yun, J.; Hu, Y.; Kim, J.; Jang, J.; Lee, S. EXAONEPath 1.0 patch-level foundation model for pathology. arXiv 2024, arXiv:2408.00380. [Google Scholar] [CrossRef] [Scilit]
  5. Zimmermann, E.; Vorontsov, E.; Viret, J.; Casson, A.; Zelechowski, M.; Shaikovski, G.; Tenenholtz, N.; Hall, J.; Klimstra, D.; Yousfi, R. Virchow2: Scaling self-supervised mixed magnification models in pathology. arXiv 2024, arXiv:2408.00738. [Google Scholar] [CrossRef] [Scilit]
  6. Bulten, W.; Kartasalo, K.; Chen, P.-H.C.; Ström, P.; Pinckaers, H.; Nagpal, K.; Cai, Y.; Steiner, D.F.; Van Boven, H.; Vink, R. Artificial intelligence for diagnosis and Gleason grading of prostate cancer: The PANDA challenge. Nat. Med. 2022, 28, 154–163. [Google Scholar] [CrossRef] [Scilit]
  7. Ma, J.; Xu, Y.; Zhou, F.; Wang, Y.; Jin, C.; Guo, Z.; Wu, J.; Tang, O.K.; Zhou, H.; Wang, X. PathBench: A comprehensive comparison benchmark for pathology foundation models towards precision oncology. arXiv 2025, arXiv:2505.20202. [Google Scholar] [CrossRef] [Scilit]
  8. Campanella, G.; Chen, S.; Singh, M.; Verma, R.; Muehlstedt, S.; Zeng, J.; Stock, A.; Croken, M.; Veremis, B.; Elmas, A. A clinical benchmark of public self-supervised pathology foundation models. Nat. Commun. 2025, 16, 3640. [Google Scholar] [CrossRef] [Scilit]
  9. Filiot, A.; Ghermi, R.; Olivier, A.; Jacob, P.; Fidon, L.; Mac Kain, A.; Saillard, C.; Schiratti, J.-B. Scaling self-supervised learning for histopathology with masked image modeling. medRxiv 2023. [Google Scholar] [CrossRef] [Scilit]
  10. Filiot, A.; Jacob, P.; Mac Kain, A.; Saillard, C. Phikon-v2, a large and public feature extractor for biomarker prediction. arXiv 2024, arXiv:2409.09173. [Google Scholar] [CrossRef] [Scilit]
  11. Pohjonen, J.; Batouche, A.-O.; Rannikko, A.; Sandeman, K.; Erickson, A.; Pitkanen, E.; Mirtti, T. HistoEncoder: A digital pathology foundation model for prostate cancer. arXiv 2024, arXiv:2411.11458. [Google Scholar] [CrossRef] [Scilit]
  12. Zhou, J.; Wei, C.; Wang, H.; Shen, W.; Xie, C.; Yuille, A.; Kong, T. iBOT: Image BERT pre-training with online tokenizer. arXiv 2021, arXiv:2111.07832. [Google Scholar]
  13. Oquab, M.; Darcet, T.; Moutakanni, T.; Vo, H.; Szafraniec, M.; Khalidov, V.; Fernandez, P.; Haziza, D.; Massa, F.; El-Nouby, A. DINOv2: Learning robust visual features without supervision. arXiv 2023, arXiv:2304.07193. [Google Scholar]
  14. Kömen, J.; de Jong, E.D.; Hense, J.; Marienwald, H.; Dippel, J.; Naumann, P.; Marcus, E.; Ruff, L.; Alber, M.; Teuwen, J. Towards robust foundation models for digital pathology. arXiv 2025, arXiv:2507.17845. [Google Scholar] [CrossRef] [Scilit]
  15. Bussola, N.; Marcolini, A.; Maggio, V.; Jurman, G.; Furlanello, C. AI slipping on tiles: Data leakage in digital pathology. In International Conference on Pattern Recognition; Springer: Cham, Switzerland, 2021. [Google Scholar]
  16. Whitehill, J. Climbing the Kaggle Leaderboard by Exploiting the Log-Loss Oracle. In Proceedings of the AAAI Workshops, New Orleans, LA, USA, 2–7 February 2018. [Google Scholar]
  17. Rajih, E.; Bakhsh, A.; Borhan, W.M.; Alqahtani, S.A.M. Utilization of artificial intelligence in prostate cancer detection: A comprehensive review of innovations in screening and diagnosis. Front. Immunol. 2025, 16, 1670671. [Google Scholar] [CrossRef] [Scilit] [PubMed]
  18. Hart, T.; Hart, C.E.; Hopson, S.; Urie, P.M.; Della Corte, D. Overcoming limitations in artificial intelligence-based prostate cancer detection through better datasets and a Bayesian approach to aggregate panel predictions. arXiv 2024, arXiv:2406.06801. [Google Scholar] [CrossRef] [Scilit]
  19. Hart, T.; Hart, C.E.; Frewing, A.S.; Urie, P.; Della Corte, D. Towards a Clinically Useful AI Tool for Prostate Cancer Detection: Recommendations from a PANDA Dataset Analysis. J. Clin. Case Rep. Med. Images Health Sci. 2023, 5, 1216. [Google Scholar]
  20. Mikami, Y.; Manabe, T.; Epstein, J.I.; Shiraishi, T.; Furusato, M.; Tsuzuki, T.; Matsuno, Y.; Sasano, H. Accuracy of Gleason grading by practicing pathologists and the impact of education on improving agreement. Hum. Pathol. 2003, 34, 658–665. [Google Scholar] [CrossRef] [Scilit]
  21. Egevad, L.; Swanberg, D.; Delahunt, B.; Ström, P.; Kartasalo, K.; Olsson, H.; Berney, D.M.; Bostwick, D.G.; Evans, A.J.; Humphrey, P.A. Identification of areas of grading difficulties in prostate cancer and comparison with artificial intelligence assisted grading. Virchows Arch. 2020, 477, 777–786. [Google Scholar] [CrossRef] [Scilit]
  22. Frewing, A.; Gibson, A.B.; Robertson, R.; Urie, P.M.; Della Corte, D. Don’t fear the artificial intelligence: A systematic review of machine learning for prostate cancer detection in pathology. Arch. Pathol. Lab. Med. 2024, 148, 603–612. [Google Scholar] [CrossRef] [Scilit]
  23. Hopson, S.; Mildon, C.; Hassard, K.; Kubalek, C.; Laverty, L.; Urie, P.; Della Corte, D. Enhancing AI literacy in undergraduate pre-medical education through student associations: An educational intervention. BMC Med. Educ. 2025, 25, 999. [Google Scholar] [CrossRef] [Scilit]
  24. Hopson, S.; Mildon, C.; Hassard, K.; Urie, P.M.; Della Corte, D. Equipping Future Physicians with Artificial Intelligence Competencies through Student Associations. Int. Med. Educ. 2024, 3, 388–394. [Google Scholar] [CrossRef] [Scilit]
  25. Bankhead, P.; Loughrey, M.B.; Fernández, J.A.; Dombrowski, Y.; McArt, D.G.; Dunne, P.D.; McQuaid, S.; Gray, R.T.; Murray, L.J.; Coleman, H.G. QuPath: Open source software for digital pathology image analysis. Sci. Rep. 2017, 7, 16878. [Google Scholar] [CrossRef] [Scilit]
  26. Macenko, M.; Niethammer, M.; Marron, J.S.; Borland, D.; Woosley, J.T.; Guan, X.; Schmitt, C.; Thomas, N.E. A method for normalizing histology slides for quantitative analysis. In 2009 IEEE International Symposium on Biomedical Imaging: From Nano to Macro; IEEE: Piscataway, NJ, USA, 2009. [Google Scholar]
Figure 1. Typical problems when training AI models on confounded embeddings. (a) Shortcut learning in foundation models and (b) encoding implicit hierarchical information in WSI embeddings.
Aimed 01 00014 g001
Figure 2. Confusion matrices by model for predicted versus true Gleason pattern scores. Darker blue indicates greater alignment.
Aimed 01 00014 g002
Figure 3. Within-slide versus cross-slide accuracy by model for baseline and combined aggressive augmentation conditions.
Aimed 01 00014 g003
Figure 4. Multi-metric robustness profiles for seven pathology foundation models across eight augmentation conditions. Radar plots show within-slide accuracy, cross-slide accuracy, slide-id error rate ( 1 s l i d e _ i d _ a c c u r a c y ) , and kNN different-slide fraction ( 1 k N N _ s a m e _ s l i d e _ f r a c t i o n ) for each model, with larger polygons indicating higher cross-slide performance and weaker slide-specific encoding under the corresponding augmentation.
Aimed 01 00014 g004
Figure 5. t-SNE visualizations of foundation model embedding spaces colored by tissue label (left subplots) and slide ID (right subplots) for Virchow, Virchow2, UNI, UNI2, Phikon, Phikon-v2, and HistoEncoder under the baseline condition. Each panel shows two-dimensional projections of patch embeddings, enabling the qualitative assessment of biological class separation versus slide-specific clustering for each model.
Aimed 01 00014 g005
Figure 6. Per-slide classification difficulty across foundation models under baseline augmentation. Box plots show the distribution of leave-one-slide-out cross-slide accuracies for each model across the nine benchmark slides, with solid lines indicating the median, and dashed lines indicating the mean per-slide accuracy.
Aimed 01 00014 g006
Table 1. Foundation models evaluated in this study. * Robustness Index from de Jong et al. [3] where available.
ModelArchitectureLicenseParametersTraining DataRobustness Index *
Virchow [2]ViT-HApache 2.0632M1.5M WSIs0.93
Virchow2 [5]ViT-HCC-BY-NC-ND 4.0632M3.1M WSIs1.20
UNI [1]ViT-LCC-BY-NC-ND 4.0307M100K WSIs0.88
UNI2 [1]ViT-L/HCC-BY-NC-ND 4.0~632M350K+ WSIs0.93
Phikon [9]ViT-BOwkin Non-Commercial License86M40M tiles (TCGA)0.84
Phikon-v2 [10]ViT-LOwkin Non-Commercial License300M460M tiles0.74
HistoEncoder [11]ViT-S/BApache 2.0~85M48M tiles (prostate)---
Table 2. Benchmark slide characteristics.
Slide IDBenignGP3GP4GP5TotalInstitution
2771135136342Radboud
10111337226376Radboud
3915015437241Radboud
41632487558213Radboud
2571559385233Radboud
30108013657273Radboud
33336844223335Radboud
35015047280377Radboud
35245068262380Radboud
Total5697621381582770
Note: Column totals are in bold.
Table 3. Augmentation conditions in PANDA-PLUS-Bench.
ConditionDescriptionRationale
BaselineNo augmentation; original patch content is preserved (only standard tensor conversion)Control condition
Color JitterRandom color perturbation: brightness ±0.2, contrast ±0.2, saturation ±0.3, hue ±0.04Simulates scanner and illumination variability in routine slide acquisition.
GrayscaleConvert RGB patch to grayscale while keeping three channelsTests reliance on color information versus morphology/texture alone
Gaussian NoiseAdd pixel-wise Gaussian noise with standard deviation 0.05, with valid-range clippingSimulates acquisition/compression noise and general image-quality degradation
Heavy GeometricRandom rotation (up to 180°) with independent horizontal/vertical flipsEvaluates orientation robustness and invariance to tissue rotation/reflection.
MacenkoStain normalization to a fixed H&E reference profile [26]Reduces stain intensity/composition differences across slides and sites
HED AugmentationPerturb hematoxylin and eosin channel intensities by approximately ±20%Simulates biologically plausible staining variation during histology processing.
Combined AggressiveSequentially apply stronger color jitter + heavy geometric transforms + Gaussian noiseStress-test condition to evaluate model robustness under compounded perturbations
Table 4. Robustness metrics in PANDA-PLUS-Bench.
MetricDefinitionInterpretation
kNN Same-Slide FractionFraction of k = 50 nearest neighbors from same slideExpected by chance: 11.1%
Slide ID Accuracy5-fold CV accuracy predicting slide from embeddingHigh accuracy (>>11.1% chance) indicates strong slide encoding
Silhouette ScoreMean silhouette coefficient computed using either slide IDs or class labels as cluster assignmentsNear-zero class values indicate overlapping class structure; positive slide values indicate residual slide-level clustering.
Table 5. Cosine similarity to baseline condition.
ModelColor JitterGrayscaleGaussian NoiseHeavy GeometricMacenko NormHED Aug.Combined Aggressive
Virchow0.971 ± 0.0550.860 ± 0.0780.789 ± 0.1300.424 ± 0.1130.919 ± 0.1450.980 ± 0.0320.410 ± 0.129
Virchow20.986 ± 0.0270.894 ± 0.0770.777 ± 0.0970.625 ± 0.2030.914 ± 0.1280.985 ± 0.0230.438 ± 0.182
UNI0.975 ± 0.0540.813 ± 0.0570.791 ± 0.0890.728 ± 0.1110.914 ± 0.0900.990 ± 0.0120.543 ± 0.131
UNI20.971 ± 0.0740.868 ± 0.0570.788 ± 0.1040.711 ± 0.1140.895 ± 0.0900.984 ± 0.0240.586 ± 0.128
Phikon0.976 ± 0.0200.862 ± 0.0400.873 ± 0.0690.851 ± 0.0700.902 ± 0.0780.988 ± 0.0140.726 ± 0.086
Phikon-v20.972 ± 0.0370.789 ± 0.0560.632 ± 0.0680.690 ± 0.1160.881 ± 0.1020.983 ± 0.0160.495 ± 0.094
HistoEncoder0.981 ± 0.0180.867 ± 0.0380.941 ± 0.0130.839 ± 0.0580.923 ± 0.0800.986 ± 0.0170.777 ± 0.064
Average0.976 ± 0.0050.850 ± 0.0340.799 ± 0.0880.695 ± 0.1340.907 ± 0.0140.985 ± 0.0030.568 ± 0.129
Table 6. Primary classification metrics across foundation models (Baseline condition).
ModelWithin-Slide AccCross-Slide AccGap
Virchow0.7150.5080.208
Virchow20.7180.4720.202
UNI0.7670.5190.249
UNI20.7150.4760.240
Phikon0.7460.4770.269
Phikon-v20.7220.4720.250
HistoEncoder0.7960.5970.199
Table 7. Robustness metrics across foundation models (Baseline condition).
ModelSilh. Score (Class)Silh. Score (Slide)Slide ID AcckNN Same-Slide
Virchow−0.0160.0180.8070.579
Virchow20.0010.0210.8100.553
UNI0.0020.0280.8460.621
UNI20.0000.0180.8500.614
Phikon−0.0020.0410.8460.638
Phikon-v2−0.0020.0420.8500.622
HistoEncoder0.0150.0910.9030.619
Disclaimer/Publisher’s Note: The statements, opinions and data contained in all publications are solely those of the individual author(s) and contributor(s) and not of MDPI and/or the editor(s). MDPI and/or the editor(s) disclaim responsibility for any injury to people or property resulting from any ideas, methods, instructions or products referred to in the content.