1. Introduction
Complete blood count (CBC) testing is among the most frequently performed investigations in clinical laboratory medicine and plays a central role in diagnostic assessment, risk stratification, and clinical triage across many clinical settings. CBC-derived phenotypes such as anemia status and subtype, leukocyte abnormalities, and platelet abnormalities are routinely assigned using deterministic rule-based thresholds defined by reference intervals or clinical guidelines.
Rule-based phenotyping is transparent, interpretable and remains the foundation of routine laboratory reporting. However, hard decision boundaries implicitly assume that measured laboratory values are stable representations of the underlying biological state. In practice, laboratory measurements are affected by analytical variability, pre-analytical influences, and rounding effects [
1,
2,
3]. As a result, values close to clinical decision thresholds may change with small fluctuations, which can lead to inconsistent phenotype assignments across repeated measurements.
Machine learning approaches have increasingly been applied to CBC data to support disease classification and clinical decision making. Several studies have focused on differentiating anemia etiologies using supervised learning methods. Tepakhan et al. applied random forest and gradient boosting models to distinguish iron-deficiency anemia from thalassemia using routine hematological parameters, with ground truth labels derived from clinical diagnosis and confirmatory testing rather than direct thresholding of CBC values [
4]. Similarly, Wang et al. developed an interpretable ensemble learning model for thalassemia detection in pregnant women, where reference labels were based on established diagnostic criteria incorporating clinical context beyond CBC measurements alone [
5].
Other studies have used CBC parameters for broader clinical prediction tasks. Lin et al. investigated early sepsis detection in emergency settings using CBC data combined with clinical variables, with outcome labels defined by retrospective clinical diagnosis [
6]. Kamalzadeh et al. focused on predicting iron-deficiency anemia using reticulocyte maturation indices, again relying on diagnosis-based reference labels [
7]. In these approaches, machine learning models are primarily evaluated on predictive performance against clinically defined outcomes.
In contrast to disease-oriented prediction, some work has addressed post-analytical laboratory workflows. Zhu et al. applied machine learning to improve the MDS-CBC score in order to optimize peripheral blood smear review. In this setting, labels were linked to expert laboratory review decisions rather than disease diagnosis, and the model was used to support workflow prioritization [
8].
Related work has used machine learning to detect specimen misidentification through multi-analyte delta checks [
9,
10], and broader perspectives have argued that artificial intelligence in laboratory medicine is most valuable as decision support rather than as autonomous diagnosis [
11,
12]. A parallel literature in clinical machine learning emphasizes the importance of well-calibrated probabilities [
13,
14] and explicit uncertainty quantification [
15,
16,
17,
18] when models are used in safety-critical decision pathways.
Despite this growing body of literature, comparatively little attention has been paid to the robustness of rule-based CBC phenotyping itself. In routine laboratory workflows, phenotypes defined by fixed thresholds are typically treated as stable categorical outcomes. Instability near decision boundaries is rarely quantified, and binary classification outputs do not convey information about the reliability of individual assignments. Consequently, laboratories lack systematic tools to identify borderline cases that may warrant additional review or contextual interpretation [
19,
20].
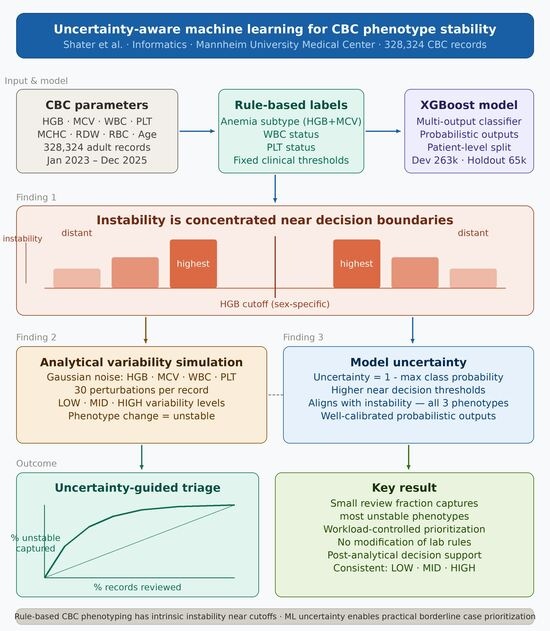
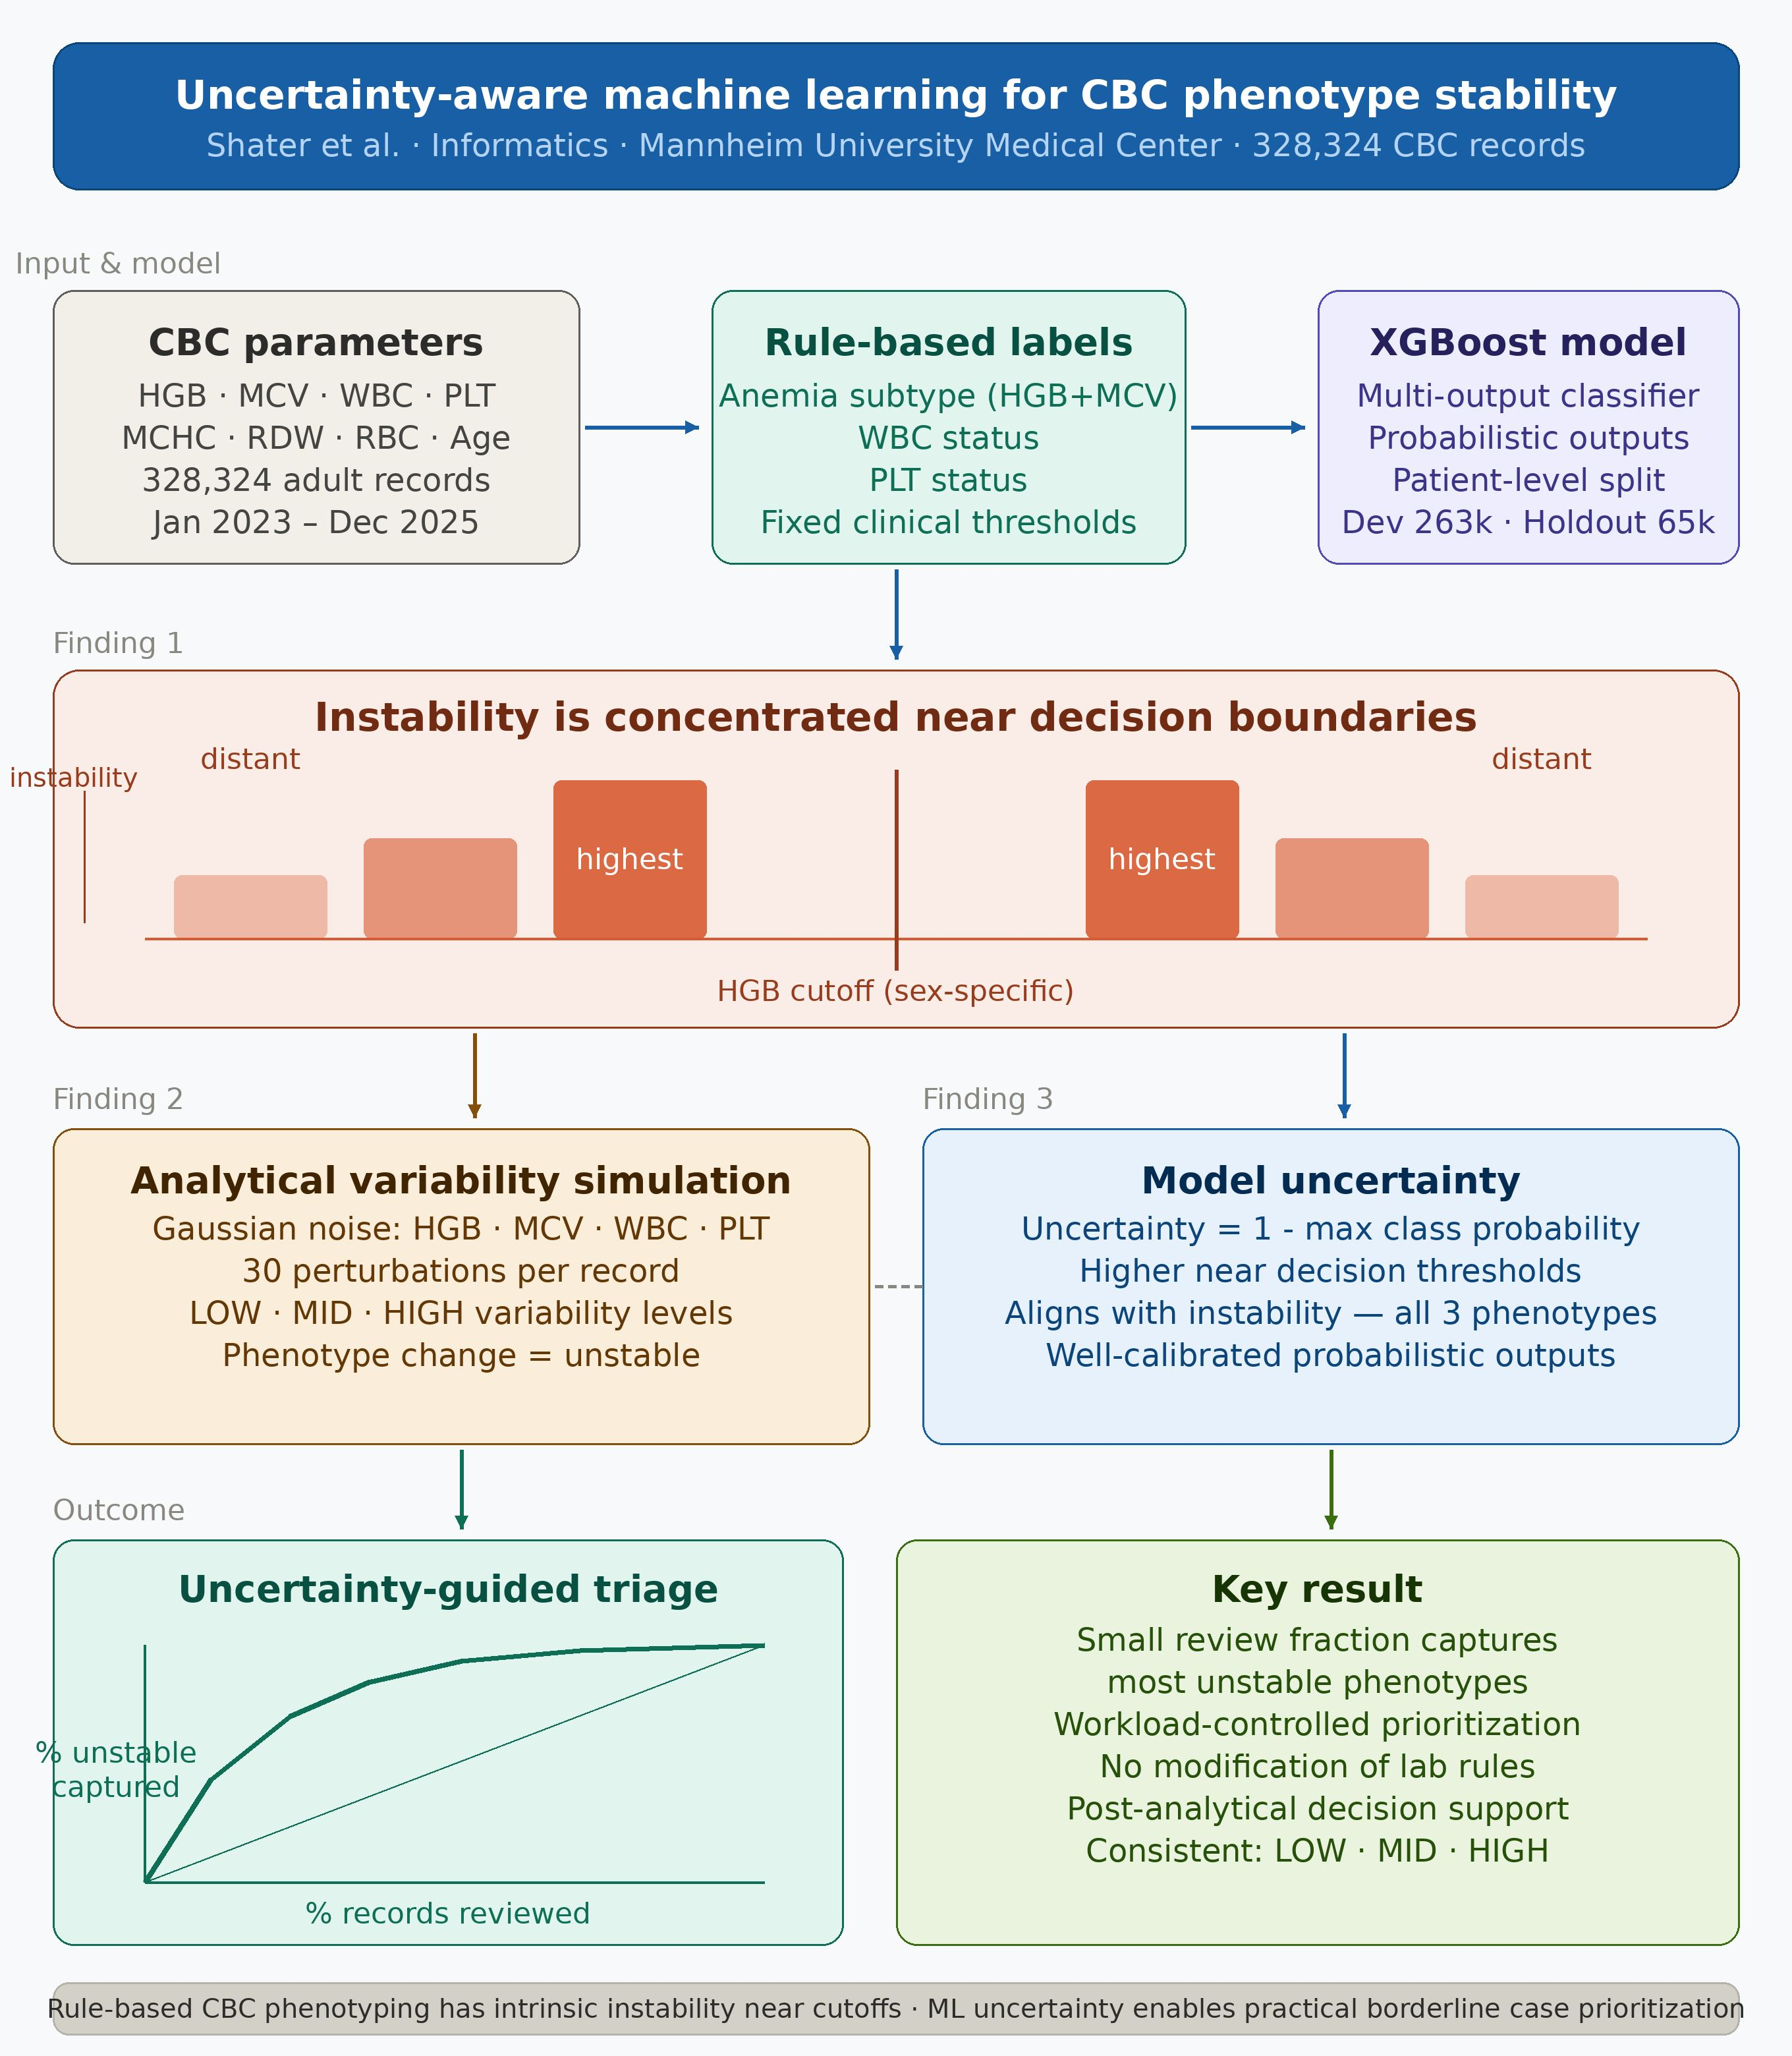
In this study, we focus on the intrinsic stability of rule-based CBC phenotyping under realistic analytical variability. We do not propose new diagnostic criteria and we do not replace existing laboratory rules. Instead, we quantify how phenotype instability relates to proximity to clinical decision thresholds. We further investigate whether probabilistic outputs from machine learning models can be used to operationalize this instability by supporting workload-controlled prioritization of borderline cases within established laboratory workflows.
2. Materials and Methods
2.1. Dataset and Study Design
We conducted a retrospective observational study using routine complete blood count (CBC) measurements extracted from the hospital laboratory information system of Mannheim University Medical Center. Data were collected for the period from January 2023 through December 2025. In total, 803,617 CBC records were initially retrieved.
Only adult patients aged 18 years or older at the time of sampling were included. Age and sex were used exclusively for eligibility filtering and for rule-based phenotype assignment according to standard laboratory thresholds. No additional clinical, diagnostic, or biochemical variables beyond those contained in the CBC panel were used for the analyses.
After application of eligibility criteria and phenotype labeling, the final analytic dataset comprised 328,324 CBC records. To prevent information leakage arising from repeated measurements, all analyses were performed using a patient-level split into a development cohort and an independent holdout cohort. All CBC records from a given patient were assigned exclusively to a single cohort.
The development cohort consisted of 263,331 CBC records and was used for model training and internal analyses. The holdout cohort comprised 64,993 CBC records and was reserved exclusively for evaluation of phenotype stability, calibration, and uncertainty-guided triage. No rebalancing or downsampling was applied prior to cohort splitting, and the holdout cohort therefore reflects the real-world distribution of CBC phenotypes observed in routine laboratory practice.
This study was conducted using pseudonymized laboratory data and was approved by the Ethics Committee of the Medical Faculty Mannheim, Heidelberg University (approval no. 2023-893).
2.2. Rule-Based Phenotyping
Each CBC record was assigned three parallel phenotype outputs rather than a single mutually exclusive label. The phenotype dimensions were anemia subtype, white blood cell (WBC) status, and platelet (PLT) status. All labels were derived exclusively from routinely reported numerical CBC measurements and patient sex using predefined deterministic thresholds.
Anemia status was defined using sex-specific hemoglobin (HGB) cutoffs, with anemia assigned for HGB concentrations below 13.0 g/dL in males and below 12.0 g/dL in females. For records meeting anemia criteria, anemia subtype was further classified based on mean corpuscular volume (MCV) as microcytic (MCV < 80 fL), normocytic (MCV 80–100 fL), or macrocytic (MCV > 100 fL). Records not meeting anemia criteria were assigned to the non-anemic category.
WBC status was categorized as low, normal, or high using absolute leukocyte count thresholds of <4.0 × 10⁹/L, 4.0–11.0 × 10⁹/L, and >11.0 × 10⁹/L, respectively. Platelet status was analogously classified as low (<150 × 109/L), normal (150–450 × 109/L), or high (>450 × 109/L).
No manual adjudication or expert revision of phenotype assignments was performed. The rule-based labels were applied uniformly across all records and served as fixed reference phenotypes for all subsequent analyses. Records with missing values in any required labeling parameter and samples from pediatric patients younger than 18 years were excluded prior to analysis.
2.3. Machine Learning Model
We employed a multi-output gradient boosting classifier based on the XGBoost framework to model CBC-derived phenotypes. We trained the model exclusively on the development cohort using the rule-based phenotype assignments defined in
Section 2.2 as target outputs. The purpose of the model was not to replace deterministic laboratory rules or to perform disease diagnosis, but to generate probabilistic outputs associated with rule-based phenotype assignments for subsequent uncertainty and stability analyses.
We formulated the task as a multi-output classification problem with three parallel output dimensions corresponding to anemia subtype (4 classes), WBC status (3 classes), and PLT status (3 classes). The multi-output framework was implemented as three independent XGBoost classifiers wrapped in scikit-learn’s MultiOutputClassifier, with one classifier per phenotype head; class probabilities were obtained head-wise from each underlying classifier. For each output dimension, the model produced class probability estimates for all possible categories.
The input feature set consisted of a predefined subset of routinely reported numerical complete blood count (CBC) parameters available at the time of laboratory analysis. These included HGB, MCV, mean corpuscular hemoglobin concentration (MCHC), red cell distribution width (RDW), red blood cell count (RBC), WBC, and PLT. Patient age was included as an additional numerical feature. No clinical diagnoses, outcome variables, expert annotations, or non-CBC laboratory measurements were used as predictors.
Model hyperparameters were selected by nested cross-validation on the development cohort using StratifiedGroupKFold (5 outer × 3 inner folds; patient identifier used as the group to prevent leakage) with 12 iterations of RandomizedSearchCV per inner fold. The search space comprised n_estimators ∈ {200, 300, 450}, max_depth ∈ {4, 6, 8}, learning_rate ∈ {0.05, 0.08, 0.12}, subsample ∈ {0.8, 0.9, 1.0}, colsample_bytree ∈ {0.8, 0.9, 1.0}, and reg_lambda ∈ {0.5, 1.0, 2.0}. The configuration selected by majority vote across outer folds was n_estimators = 200, max_depth = 6, learning_rate = 0.05, subsample = 1.0, colsample_bytree = 0.9, reg_lambda = 1.0, with objective = “multi:softprob”, eval_metric = “mlogloss”, and tree_method = “hist”. The nested cross-validation procedure yielded an outer-fold mean exact-match accuracy of 0.993 ± 0.002 on the development cohort. After hyperparameter selection, a single final model was trained on the full development cohort using the selected parameter set. Patient-level holdout splitting used GroupShuffleSplit (test_size = 0.20). All random operations (splitting, perturbation noise generation, subsampling) used numpy.random with random_state = 42 unless otherwise specified. The analysis was performed in Python 3.11 with scikit-learn 1.5, XGBoost 2.0, NumPy 1.26, pandas 2.2, and matplotlib 3.8.
After training, we applied the final model to the independent holdout cohort to generate probabilistic predictions. We used these probabilities for calibration assessment, perturbation-based stability analysis, and uncertainty-guided triage. All results reported in this study are derived from this single model trained on the development cohort with the real-world data distribution.
2.4. Simulation of Analytical Variability and Stability Analysis
To assess the robustness of rule-based CBC phenotypes under analytically plausible variability, we performed a perturbation-based stability analysis on the independent holdout cohort. Analytical variability was simulated by applying additive Gaussian perturbations to selected CBC parameters in the independent holdout cohort.
Perturbations were applied to hemoglobin (HGB), mean corpuscular volume (MCV), white blood cell count (WBC), and platelet count (PLT), the four parameters directly involved in rule-based phenotype assignment. For each CBC record, additive Gaussian noise with zero mean was applied independently to each parameter. Three perturbation regimes (LOW, MID, HIGH) were defined to span a clinically meaningful range of analytical variability, informed by published analytical performance specifications for hematological parameters [
2,
19,
21] and in broad alignment with typical analyzer-performance data reported in the recent literature [
22]. The parameter-specific standard deviations were: for HGB, 0.10 g/dL (LOW), 0.20 g/dL (MID), and 0.30 g/dL (HIGH); for MCV, 0.50 fL (LOW), 1.00 fL (MID), and 1.50 fL (HIGH); for WBC, 0.15 × 10
9/L (LOW), 0.30 × 10
9/L (MID), and 0.45 × 10
9/L (HIGH); and for PLT, 5 × 10
9/L (LOW), 10 × 10
9/L (MID), and 15 × 10
9/L (HIGH). LOW approximates state-of-the-art analytical imprecision routinely achievable on modern hematology platforms; MID corresponds to typical operating conditions; HIGH represents a deliberate stress test under degraded analytical performance for the parameters governing rule-based CBC phenotyping.
For each record and perturbation level, 30 independent perturbation realizations were generated. After each perturbation, phenotype labels were recomputed using the same rule-based thresholds described in
Section 2.2, without any modification of cutoff values or classification logic. No retraining or recalibration of the machine learning model was performed during the perturbation process.
A record was defined as unstable if at least one phenotype assignment (anemia subtype, WBC status, or PLT status) differed from the original unperturbed assignment in any perturbation realization. Records for which all phenotype assignments remained unchanged across all perturbations were classified as stable. Stability analyses were conducted exclusively on the holdout cohort, which was not used for model training or hyperparameter selection, to ensure unbiased estimation of instability rates.
For computational efficiency, the stability analysis was limited to a random subset of up to 50,000 holdout records when the full holdout cohort exceeded this size.
2.5. Distance to Decision Boundaries
To contextualize phenotype instability, we quantified the proximity of each CBC record to relevant clinical decision thresholds. We focused on anemia phenotyping, where deterministic cutoffs define discrete categories and where instability is expected to be most pronounced near threshold values.
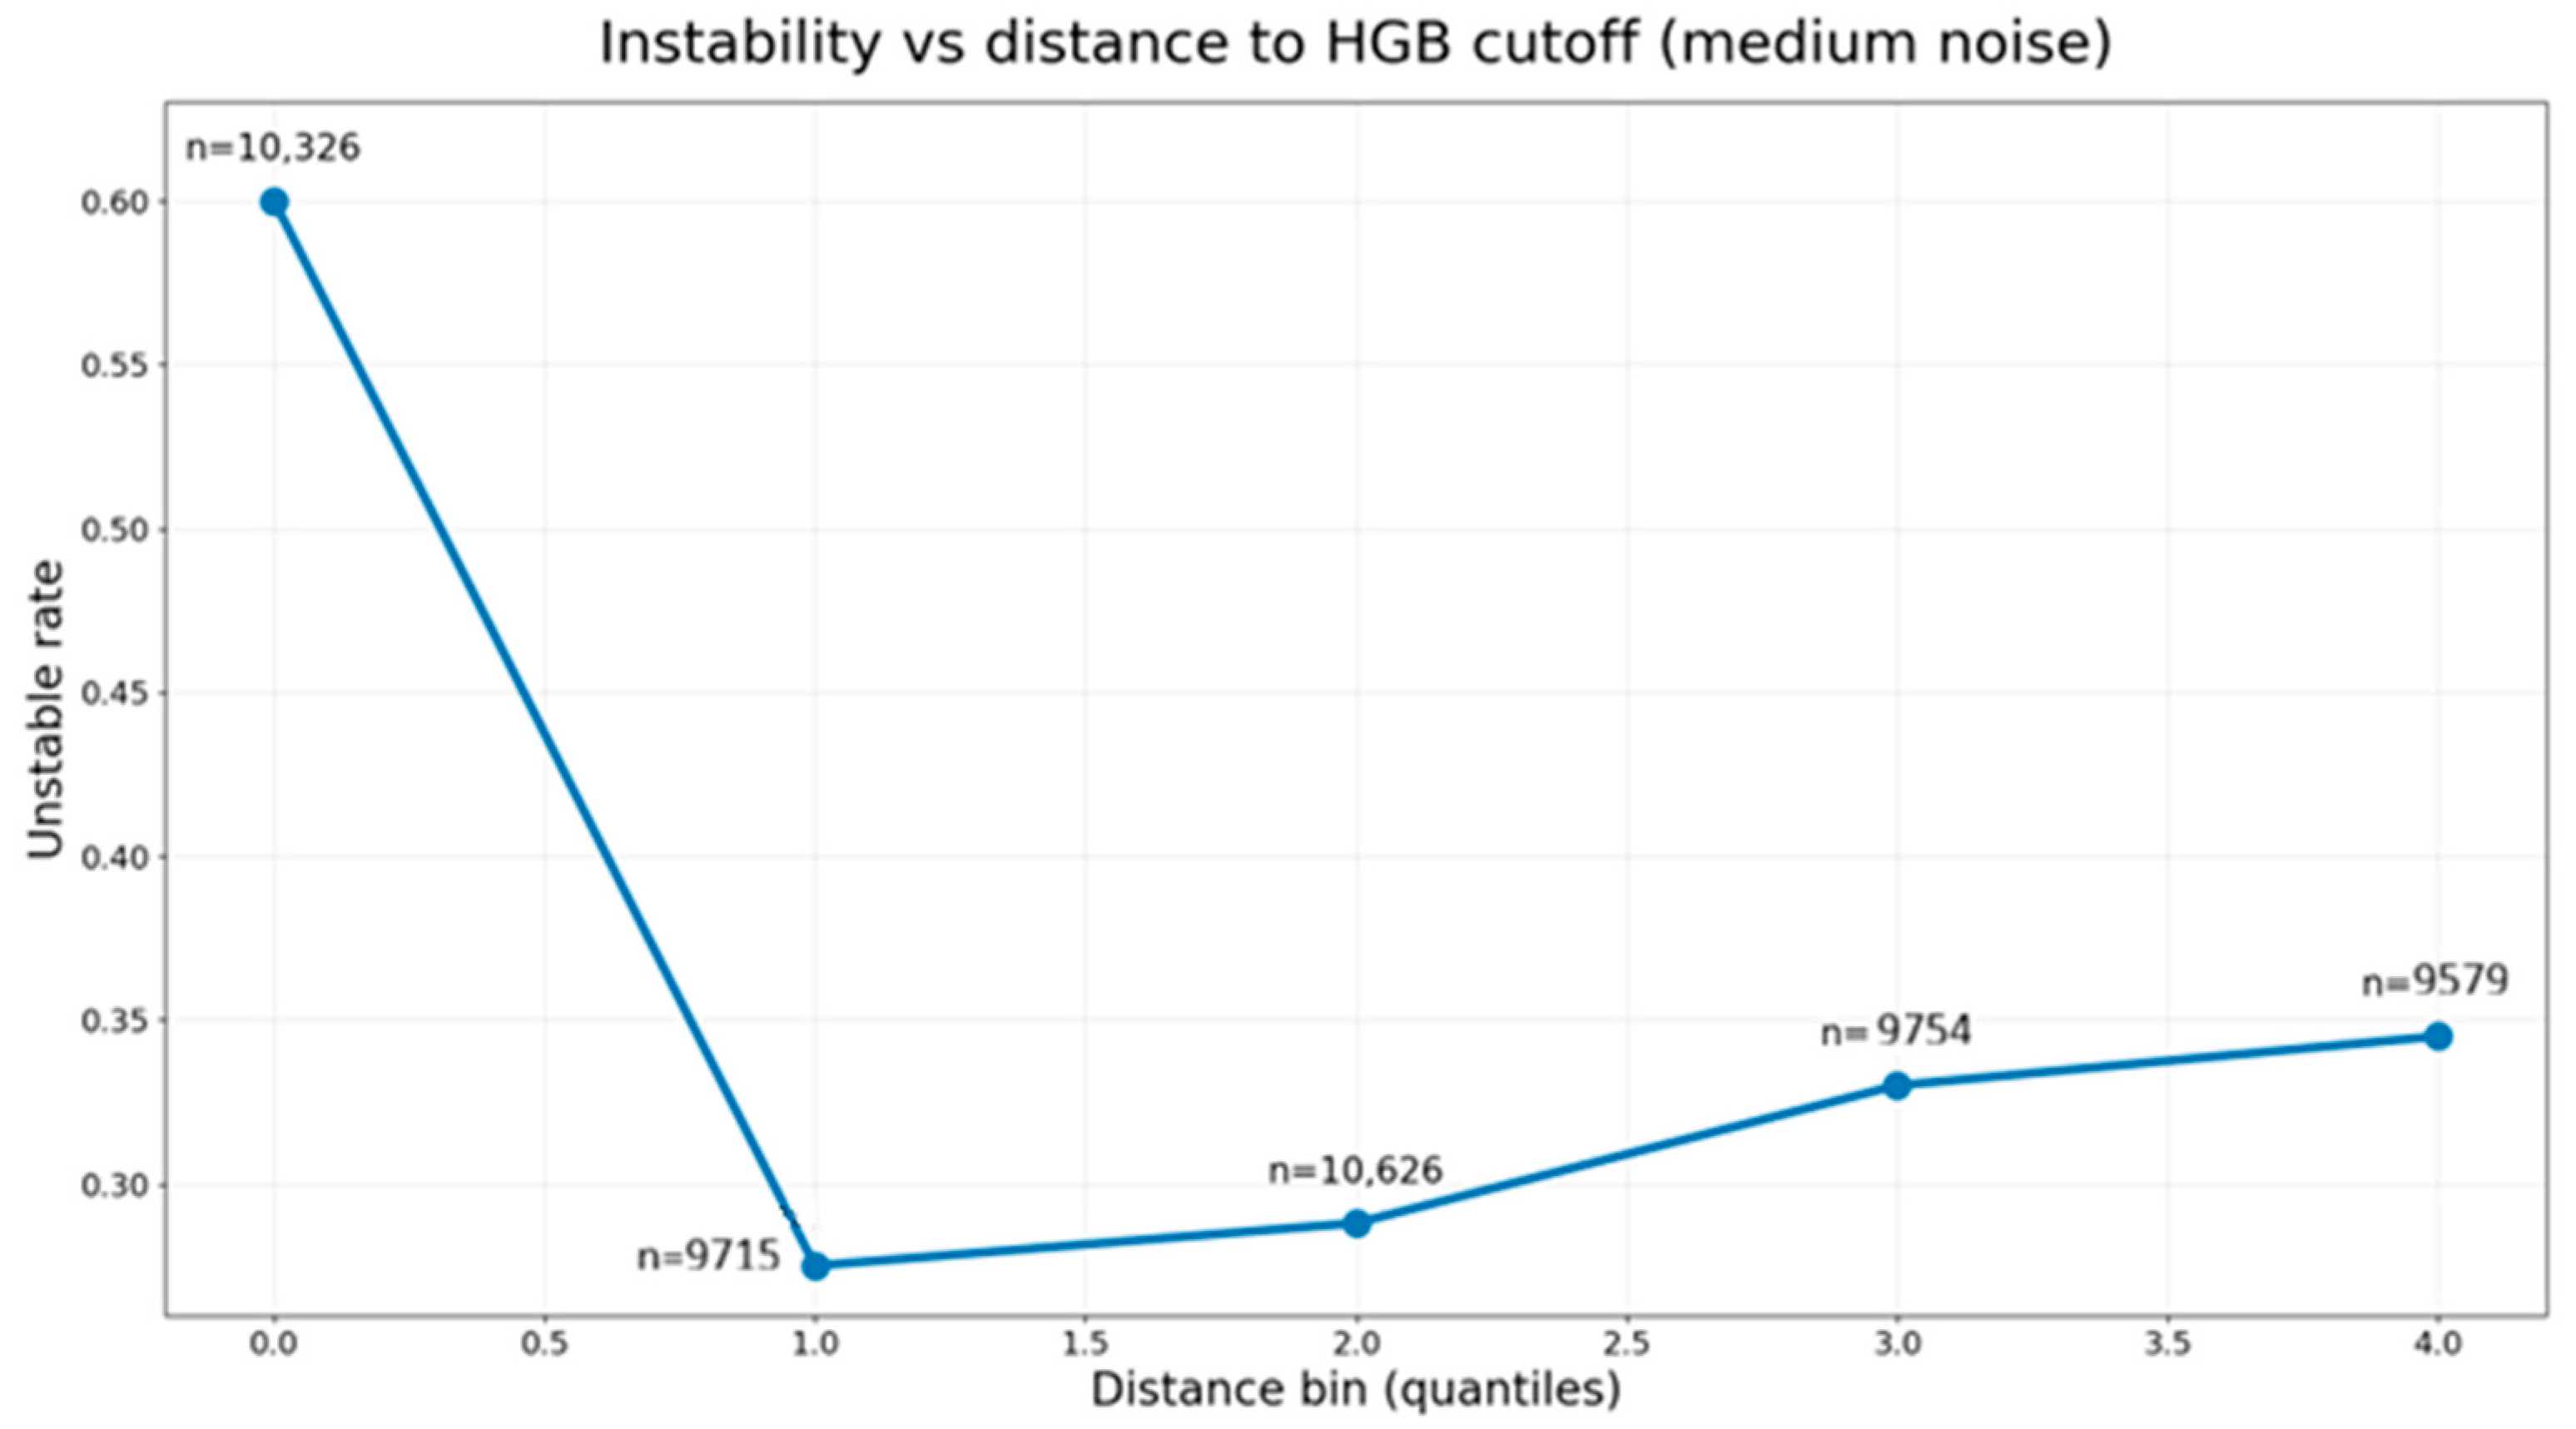
For each record in the holdout cohort, we computed the absolute distance between the measured hemoglobin concentration and the nearest sex-specific anemia decision threshold. This distance served as a continuous measure of proximity to the rule-based cutoff used for phenotype assignment. Distance calculations were performed using the original, unperturbed CBC values.
To enable robust comparison across the full measurement range and to avoid sparsity effects at extreme distances, we stratified records into quantile-based distance bins. Each bin therefore contained approximately equal numbers of records. This approach was chosen to characterize monotonic relationships between proximity to decision boundaries and phenotype instability, rather than to define absolute clinical distance thresholds.
Instability rates were summarized within each distance bin and used to evaluate how phenotype robustness varied as a function of proximity to the decision boundary. These bin-wise summaries formed the basis for subsequent analyses linking instability patterns to model-derived uncertainty and triage performance.
2.6. Uncertainty-Guided Triage
We used model-derived probabilistic outputs to quantify uncertainty associated with rule-based phenotype assignments. For each phenotype dimension d ∈ {anemia, WBC, PLT}, per-record uncertainty was defined as U_d = 1 − max_c p_d(c), where p_d(c) denotes the model-predicted probability of class c within dimension d. Higher values therefore indicated lower model confidence in the rule-based assignment. To support a single workload-controlled review queue across phenotypes, an aggregate uncertainty score was computed as U_agg = max(U_anemia, U_WBC, U_PLT), equivalently U_agg = 1 − min(max_c p_anemia(c), max_c p_WBC(c), max_c p_PLT(c)). This conservative aggregation flags a record for review whenever at least one phenotype head produces a low-confidence prediction. U_agg was used as the ranking score for all triage analyses spanning the three phenotype dimensions; per-dimension triage was performed using the corresponding per-dimension U_d.
Uncertainty estimates were computed exclusively on the independent holdout cohort using the final model trained on the development cohort. We did not recalibrate or retrain the model using holdout data. Uncertainty values were used to rank CBC records from highest to lowest uncertainty.
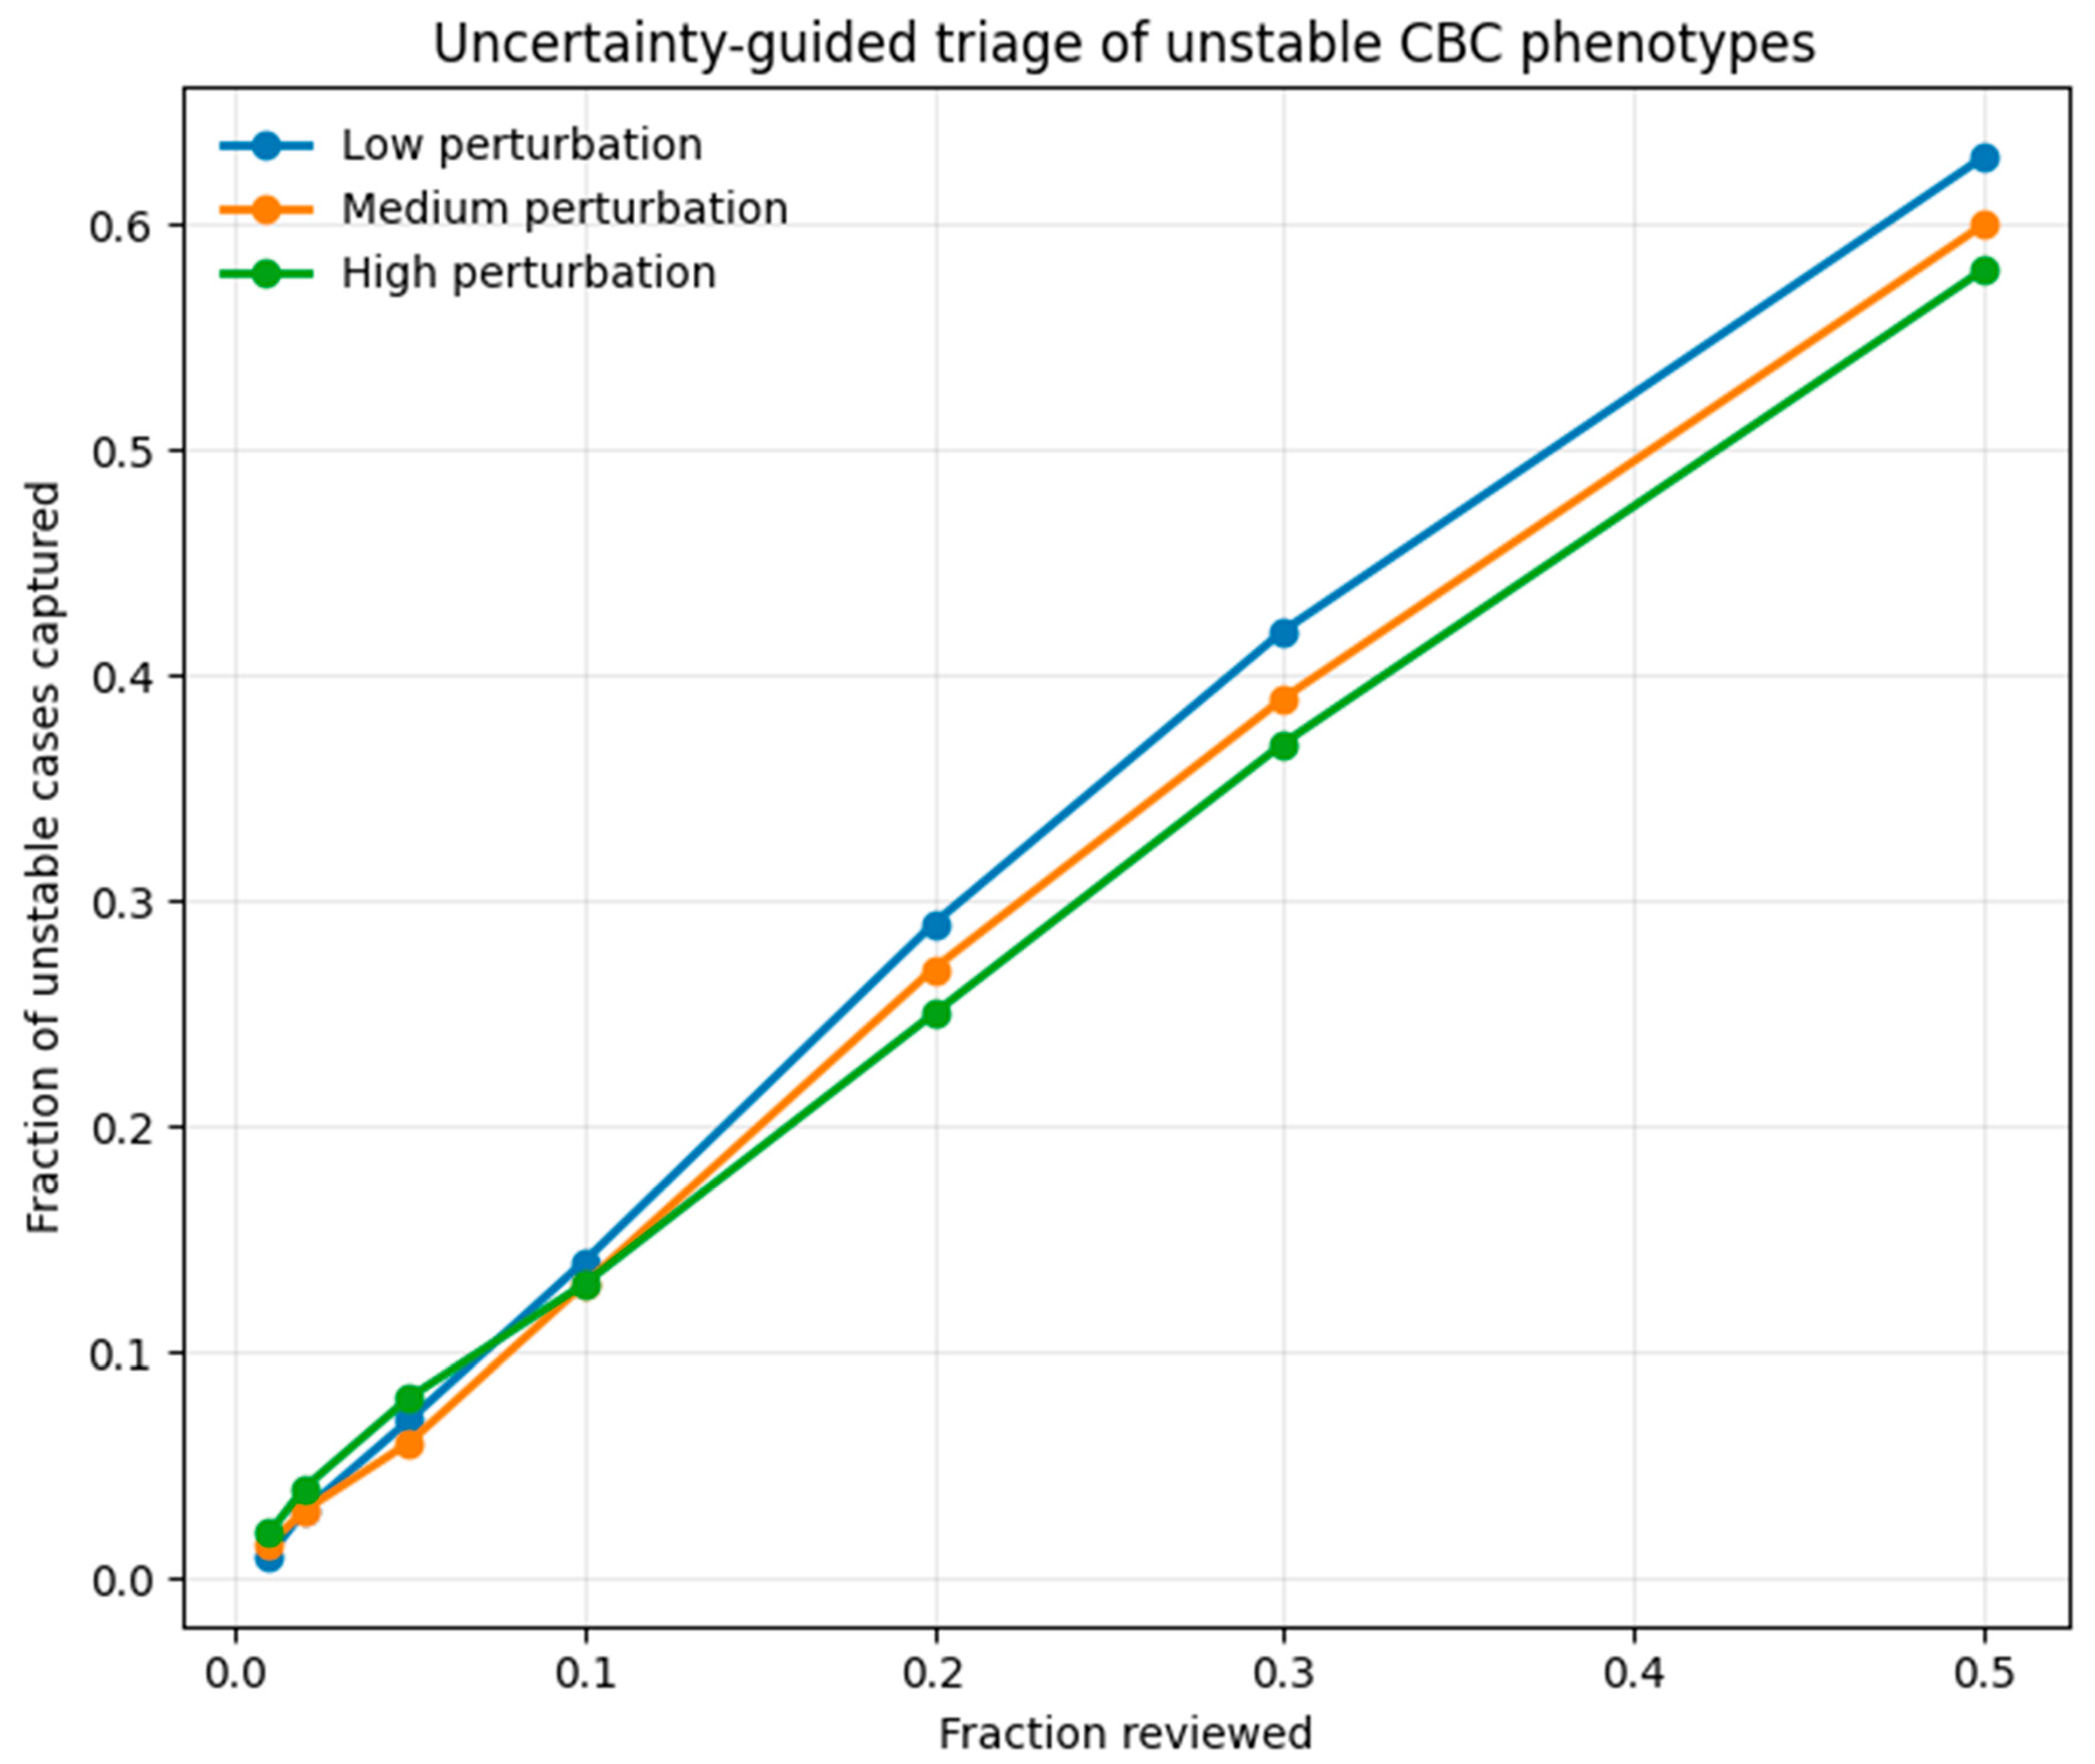
To assess the operational utility of uncertainty estimates, we performed a triage analysis in which increasing fractions of records were selected for review based on descending uncertainty. For each review fraction, we calculated the proportion of unstable records captured within the selected subset.
Triage performance was summarized using cumulative capture curves, relating the fraction of reviewed records to the fraction of unstable cases identified. These analyses were performed separately for each phenotype dimension and in aggregate, enabling assessment of uncertainty-guided prioritization across different CBC-derived phenotypes.
4. Discussion
In this study, we systematically analyzed the stability of rule-based complete blood count (CBC) phenotypes under analytically plausible perturbations and demonstrate that instability is an intrinsic and structured property of threshold-based laboratory interpretation. We further show that model-derived uncertainty provides a principled and operationally feasible mechanism to identify and triage borderline cases without modifying existing laboratory decision rules.
4.1. Intrinsic Instability of Rule-Based CBC Phenotypes
Our results demonstrate that rule-based CBC phenotyping is not uniformly stable across the measurement space. Instead, instability is concentrated in a subset of records whose numerical values lie close to predefined clinical decision thresholds. This behavior was most pronounced for anemia phenotyping, where sex-specific hemoglobin cutoffs define discrete categorical outcomes, whereas white blood cell and platelet classifications exhibited comparatively lower instability rates. These differences likely reflect broader reference intervals and larger distances between physiological values and decision boundaries for leukocyte and platelet counts.
Importantly, no manual relabeling or subjective adjudication was applied at any stage. Instability emerged solely from analytically plausible perturbations applied to numerical measurements, indicating that such instability is not a modeling artifact but a structural consequence of deterministic thresholding. This observation is consistent with established principles of analytical and biological variation in laboratory medicine [
1,
2,
23], and with the broader recognition that hard cutoffs interact poorly with measurement variability when the underlying distribution has appreciable mass near the cutoff [
19,
20].
4.2. Distance to Decision Thresholds as a Determinant of Instability
We observed a strong and structured relationship between phenotype instability and proximity to clinical decision boundaries. Records closest to the hemoglobin cutoff exhibited the highest instability rates, with instability decreasing progressively as distance from the threshold increased. This pattern was consistent across perturbation levels and followed a smooth gradient rather than an abrupt transition.
This finding provides a mechanistic explanation for why borderline laboratory results are disproportionately prone to interpretive variability, a phenomenon well recognized in routine laboratory practice but rarely quantified systematically [
1,
19,
20]. Moreover, it indicates that instability is not random noise but a predictable function of measurement geometry relative to decision thresholds. The quantile-based distance stratification used in this study enabled this relationship to be demonstrated in a distribution-agnostic manner, independent of absolute measurement scales.
4.3. Calibration of Model-Derived Probabilities Across Phenotype Dimensions
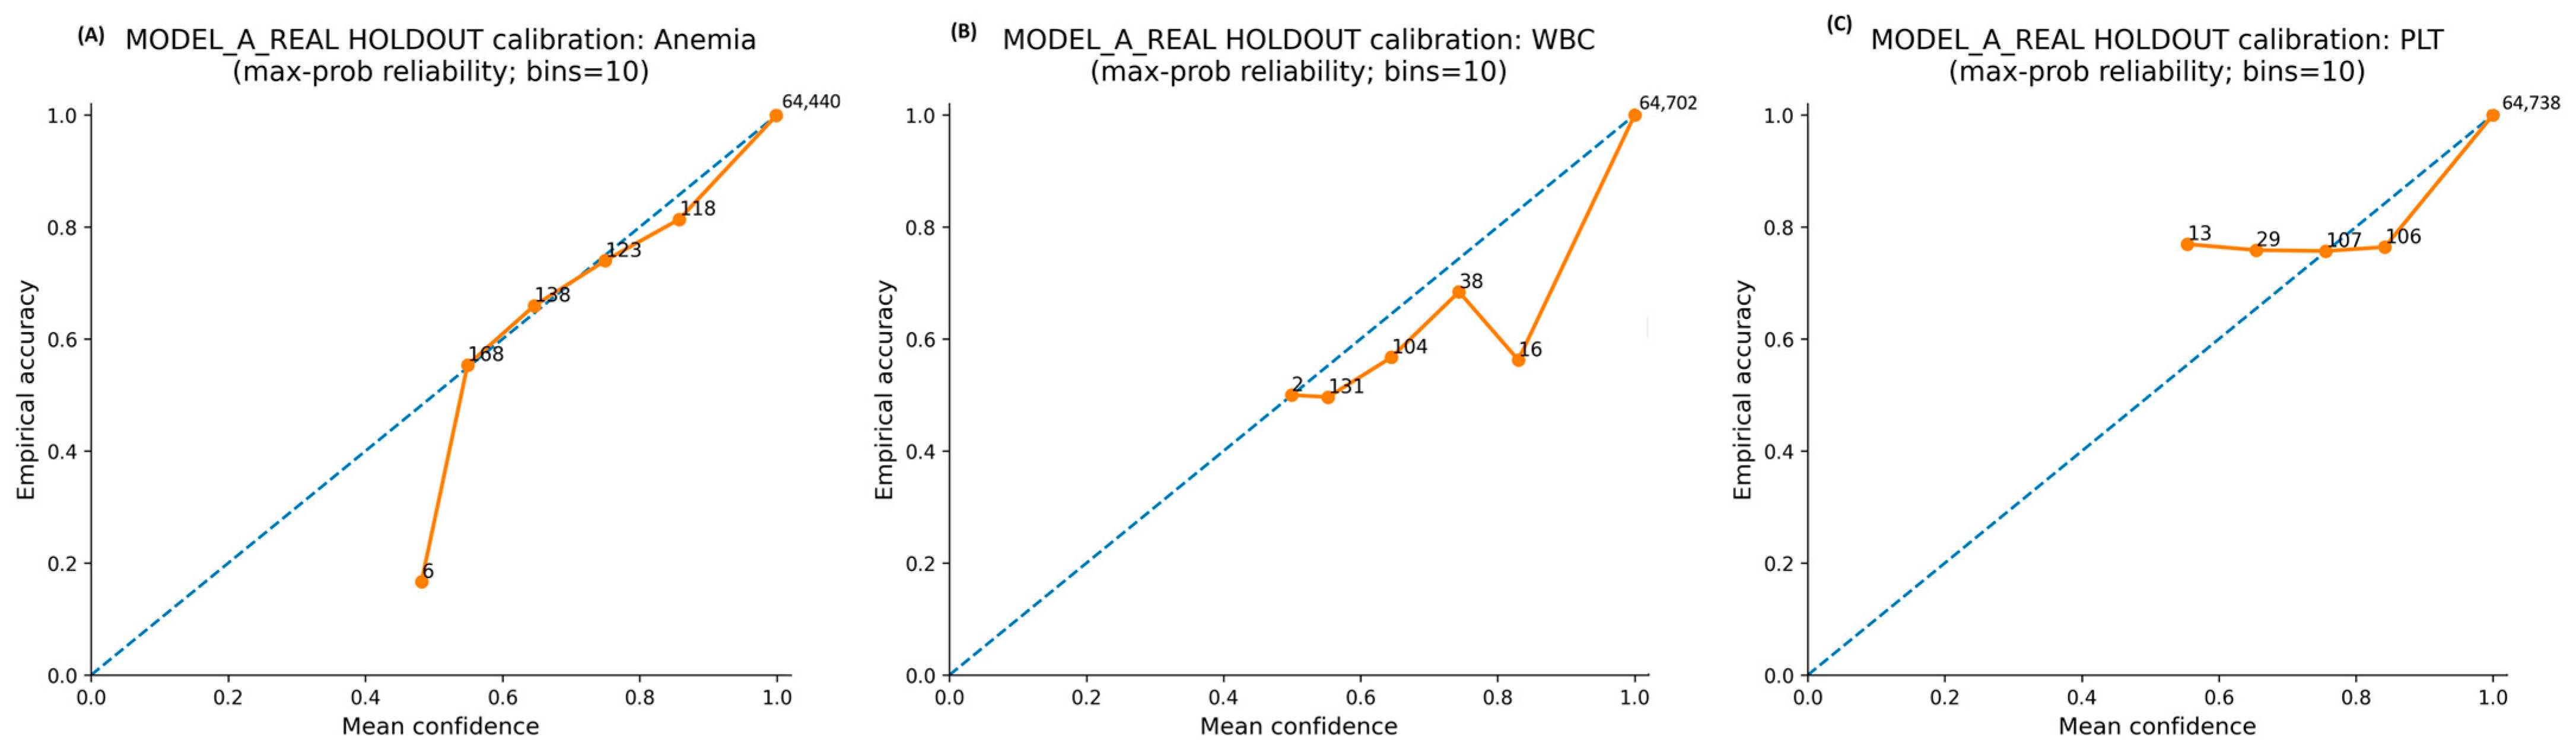
The gradient boosting model trained on rule-based phenotype labels produced well-calibrated probabilistic outputs across anemia, WBC, and platelet phenotypes, as demonstrated by reliability curves in the independent holdout cohort (
Figure 2). Predicted confidence values showed close agreement with empirical outcome frequencies, particularly in high-confidence regions corresponding to stable phenotype assignments [
24].
Deviations from perfect calibration were primarily observed in intermediate confidence ranges, which coincided with regions of increased instability and proximity to clinical decision thresholds. This alignment supports the interpretation that model uncertainty captures meaningful ambiguity inherent in the data rather than model miscalibration.
We chose U = 1 − max_c p(c) for three practical reasons. Firstly, it is model-agnostic and post hoc, which is necessary because gradient-boosted trees do not natively admit Monte Carlo dropout or variational approximations. Secondly, in a well-calibrated multi-class classifier, it directly estimates the expected misclassification probability for the assigned label, which is the quantity of interest for triage [
13,
14]. Finally, it is a validated baseline for misclassification detection across multiple domains [
15]. Alternative metrics such as Shannon entropy, deep ensembles [
17], and Bayesian or MC-dropout approximations [
18] could provide finer epistemic decomposition but at substantially higher training and inference cost.
4.4. Uncertainty as a Tool for Operational Triage Rather than Label Replacement
A central contribution of this work is the demonstration that calibrated model-derived uncertainty estimates can be used to prioritize unstable records for review in a workload-controlled manner. Cumulative capture analyses showed that ranking records by aggregate uncertainty consistently enriched the reviewed subset for unstable cases across all three perturbation regimes (
Figure 3). The steep initial slope of the capture curves indicates that instability is highly concentrated among records with the highest uncertainty scores.
Crucially, this approach does not seek to replace or override established laboratory decision rules. Instead, it augments existing workflows by selectively flagging cases where deterministic interpretation is most vulnerable to analytical variability. This positioning aligns with recent work emphasizing the role of machine learning as decision support in laboratory medicine rather than as an autonomous diagnostic system [
8].
4.5. Clinical and Laboratory Implications
The instability rates reported here are clinically meaningful, not just statistical. Under the desirable analytical performance regime (MID), roughly one in three CBC records would receive a different rule-based phenotype assignment under analytically plausible measurement variation. Such reclassifications concentrate on the situations where the assigned phenotype directly determines downstream action: borderline anemia near the sex-specific hemoglobin cutoffs, which triggers diagnostic workup and longitudinal follow-up, and borderline WBC or platelet status, which influences hematology referral, preoperative clearance, and dosing decisions for cytotoxic or anticoagulant therapy. Uncertainty-guided triage provides a workload-controlled mechanism to surface this subset for contextual review before the rule-based result drives further clinical action.
From a laboratory medicine perspective, these findings provide a quantitative framework for understanding and managing borderline results. Rather than treating all results equally, uncertainty-guided triage allows laboratories to focus expert review on cases where interpretive instability is most likely, thereby optimizing resource allocation. This is particularly relevant in high-throughput environments, where manual review capacity is limited and indiscriminate flagging may contribute to alert fatigue.
More broadly, this framework reframes uncertainty as a useful signal rather than an undesirable by-product of modeling. By explicitly quantifying ambiguity, laboratories can move toward more nuanced result interpretation while preserving established reference ranges and regulatory-compliant decision thresholds.
4.6. Limitations and Future Directions
Several limitations should be acknowledged. Firstly, this study focused on routine CBC parameters and predefined phenotype rules; extension to other laboratory domains and more complex interpretive algorithms warrants further investigation. Secondly, perturbations were designed to reflect analytical variability but did not explicitly model biological within-subject variation over time, which is known to contribute substantially to total measurement uncertainty [
1,
2]. Incorporating longitudinal data may further refine instability assessment. Because phenotype labels are deterministically derived from CBC parameters, the model is expected to recover rule structure; the added value here is calibrated uncertainty for borderline cases rather than improved diagnostic accuracy. Finally, while this study demonstrates operational feasibility, prospective evaluation of uncertainty-guided triage in real-world laboratory workflows will be necessary to assess its impact on efficiency and clinical outcomes.
4.7. Conclusions
In conclusion, rule-based CBC phenotypes exhibit predictable and structured instability near clinical decision thresholds. This instability can be quantified and operationally managed using model-derived uncertainty and proximity to decision thresholds without altering existing laboratory rules. Together, these signals provide a transparent, scalable, and clinically compatible approach to prioritizing borderline laboratory results and represent a practical step toward uncertainty-aware laboratory medicine.