1. Introduction
Dementia and cognitive impairment in aging populations have posed significant and growing global health challenges all over the world. Mild cognitive impairment (MCI) is widely regarded as an intermediate clinical state between normal aging and dementia; its progression is highly heterogeneous, with 20–40% of MCI patients transitioning to Alzheimer’s disease within three years [
1]. This heterogeneity makes early identification of individuals at high risk of cognitive decline particularly challenging yet clinically critical.
Researchers are continuously investigating promising biomarkers for prediction, prognosis, and prevention of cognitive decline. Despite substantial progress, no single biomarker has achieved sufficient accuracy or lead time for reliable prediction of cognitive deterioration in community-dwelling older adults.
This unpredictability stems from the fact that dementia is not a single disease entity but a heterogeneous syndrome affecting multiple physiological systems, ranging from vascular and metabolic dysregulation to neuroinflammation driven by complex, multifactorial causal pathways that remain largely undiscovered [
2,
3].
Current diagnostic standards, such as amyloid positron emission tomography (PET) and cerebrospinal fluid (CSF) analysis provide valuable pathophysiological insights but are invasive and costly, and restricting scalable screening as they often require specialized facilities and trained personnel [
4,
5]. Consequently, there remains a critical unmet need for a scalable. minimally invasive, and interpretable biomarkers that can support early risk stratification and monitoring of cognitive decline.
Recent advances in artificial intelligence (AI) have offered a transformative path toward precision medicine [
6,
7] by enabling the integration of large-scale multimodal data, including biobanks, electronic health records, medical imaging, omics technologies, and data from wearable sensors [
8]. Biomarkers are defined as measurable properties that represent biological or pathogenic processes, or responses to interventions [
9]. In the era of large multimodal cohorts and high-throughput technologies, the main challenge in discovering novel biomarkers has shifted from data availability to extracting clinically meaningful and interpretable patterns from complex datasets [
10]. Machine learning approaches have been increasingly used to predict cognitive decline using multidomain data.
Importantly, existing machine learning studies often rely on a single-step classification framework that directly links baseline features to a final diagnostic category, rather than modeling the stepwise clinical progression from normal cognition to mild cognitive impairment (MCI) and dementia, as outlined in established clinical frameworks [
11]. Such single-step models may overlook stage-specific biological and behavioral mechanisms that emerge during cognitive decline and may limit both interpretability and clinical relevance.
Hierarchical or staged modeling approaches offer a clinically relevant alternative because they reflect real-world diagnostic processes, where individuals are first screened for abnormal cognitive status and subsequently evaluated for severity. However, relatively few studies have systematically implemented explainable, stage-aware machine learning frameworks for predicting cognitive decline using multimodal, minimally invasive data. The lack of interpretability in many existing models remains a significant barrier to clinical translation [
12].
In this study, we conducted an exploratory secondary analysis of a prospective, community-based cohort of older adults in Japan to identify baseline multimodal biomarkers associated with cognitive status at 18 months. Cognitive outcomes were evaluated using the Mini-Mental State Examination (MMSE), developed by Marshal Folstein, which can provide a standardized, longitudinal measure of global cognitive function suitable for tracking neurodegeneration [
13]. We developed a two-stage, explainable machine learning framework based on imbalanced-learn Random Forest and penalized logistic regression models, in which cognitively normal individuals were first distinguished from those with Abnormal cognition, followed by severity stratification between Possible MCI and Impaired cognitive states.
Baseline predictors spanned multiple biological and behavioral domains, including routine clinical chemistry, targeted metabolomics with chiral amino acid profiling, gut microbiome indices, and wearable-derived physical activity measures. To ensure interpretability in these complex black-box machine learning models, SHapley Additive exPlanations (SHAP) analysis was applied to quantify feature contributions at each stage of classification, offering transparent explainable insights into stage-dependent biomarker signatures [
14]. This integration of explainable AI with scalable multimodal data can enable robust biomarker discovery, paving the way for accessible, non-invasive early detection systems and integrative analysis of complex diseases, including dementia, for biomarker discovery [
15].
2. Materials and Methods
2.1. Original Cohort Study Design
The present analysis utilized data from a prospective, non-randomized controlled cohort study conducted in the Ajisu region of Yamaguchi city, Japan. The primary objective of the original cohort study was to evaluate whether multidomain exercise and yogurt-based nutritional interventions could attenuate decline in cognitive and motor function over 18 months compared with a usual-care control group.
Participants were allocated to three groups (Exercise+, Yogurt+, Control) by preference and feasibility, and all procedures, assessments, and follow-up schedules were predefined in the original protocol and approved by the institutional ethics committee.
The cohort design included extensive baseline data collection across multiple biological systems, including biochemistry, metabolomics, chiral amino acids and glycine, gut microbiome, and physical activity. This comprehensive dataset provides a valuable foundation for subsequent investigations into biomarkers predictive of cognitive outcomes as a secondary endpoint.
2.2. Participants
Participants in the cohort study were recruited from Ajisu, a district in Yamaguchi city, Yamaguchi Prefecture, Japan. Eligible participants were community-dwelling older adults aged 75 to 83 years who were able to provide written informed consent after receiving a comprehensive explanation of the study procedures. All participants were required to be free from any serious medical conditions.
Exclusion criteria included: (1) suspected dementia, defined as a Mini-Mental State Examination (MMSE) score of 23 or lower; (2) certification as requiring nursing care at level 2 or higher; or (3) any condition deemed unsuitable for participation as determined by the investigators. Such conditions include inability to stand unassisted, neurological or musculoskeletal disorders, serious medical illnesses (e.g., cancer or renal failure), or regular use of antibiotics at the time of recruitment. In addition, participants in the exercise group were excluded if they had contraindications to physical activity, including epilepsy, hernia, recent surgery, or joint prostheses. Participants undergoing standard treatment for chronic conditions, including diabetes, hypertension, and dyslipidemia, were eligible to remain in this study.
Initially, 104 volunteers expressed interest in participating in the 18-month intervention study. Four individuals withdrew from this study prior to enrollment due to procedural difficulties (
n = 2) or medical requirements (
n = 2). During this study, one participant voluntarily withdrew, and one participant died, resulting in 98 individuals who completed this study. The inclusion and exclusion criteria are shown in
Table 1.
2.3. Ethical Committee Review
The study protocol, informed consent forms, and related documentation were reviewed and approved by the Ethics Review Committee of Yamaguchi University. This study was conducted in accordance with the Declaration of Helsinki and the Japanese Ethical Guidelines for Medical and Health Research Involving Human Subjects, including the guidelines on human genome and genetic analysis research. This study was registered in the University Hospital Medical Information Network Clinical Trials Registry (UMIN-CTR) prior to participant recruitment.
2.4. Secondary Analysis Framework
The current study constitutes an exploratory secondary analysis using data from the original cohort. We included all participants with complete baseline predictors and Mini-Mental State Examination (MMSE) scores assessed at 18 months after baseline. The analysis aimed to identify baseline biomarkers associated with subsequent cognitive status, defined by MMSE outcomes at 18 months. Participants were categorized into three cognitive groups—Normal, Possible MCI, and Impaired—and these categories were used as outcome variables in a supervised machine learning framework.
A two-stage binary classification approach was applied. In Stage 1, the model distinguished Normal from Possible MCI or Impaired. In Stage 2, the model further classified Possible MCI versus Impaired. Classification was performed using the Imbalanced Random Forest algorithm and Logistic Regression algorithm. Given the relatively small sample size, we adopted Leave-One-Out Cross-Validation (LOOCV) to estimate model performance. Bayesian hyperparameter optimization was used to tune model parameters, and SHapley Additive exPlanations (SHAP) values were computed to evaluate feature importance and interpretability.
Importantly, the set of explanatory variables included not only the original study group assignments (Exercise+, Yogurt+, Control) but also a wide range of baseline multimodal features collected at month 0. This comprehensive feature set enabled the model to assess the potential contribution of both intervention exposure and individual baseline characteristics to future cognitive outcomes.
2.5. Data
We included a range of baseline predictors in the model, spanning demographic, intervention, biochemical, behavioral, and microbiome-related data.
Demographic predictors included age and sex.
Intervention-related information consisted of group assignments in the original Ajisu cohort study: Exercise+ (n = 40), Yogurt+ (n = 20), and Control (n = 40). The Exercise Group was given structured 90-min group sessions conducted once weekly at a local health and welfare center. Participants in the Yogurt Group were instructed to consume one cup (100 g) of yogurt per day. These groups were added as predictors and treated as categorical variables.
Biochemical and metabolic predictors were derived from 55 mL of fasting venous blood collected at baseline. Measurements included general blood biochemistry (liver and kidney function, lipid profile, glucose metabolism, anemia and targeted metabolites), and plasma concentrations of 24 chiral amino acids and Glycine: DL-Alanine (DL-Ala), L-Arginine (L-Arg), DL-Asparagine (DL-Asn), L-Aspartic acid (L-Asp), L-Citrulline (L-Cit), L-Glutamine (L-Gln), L-Glutamate (L-Glu), Glycine (Gly), L-Histidine (L-His), L-Isoleucine (L-Ile), L-Leucine (L-Leu), L-Lysine (L-Lys), L-Methionine (L-Met), L-Ornithine (L-Orn), L-Phenylalanine (L-Phe), DL-Proline (DL-Pro), DL-Serine (DL-Ser), L-Threonine (L-Thr), L-Tryptophan (L-Trp), L-Tyrosine (L-Tyr), and L-Valine (L-Val). These were quantified using chiral tandem liquid chromatography-tandem mass spectrometry (LC-MS/MS).
Cognitive function was evaluated using the standard Mini-Mental State Examination (MMSE) questionnaire at both baseline and 18 months.
Physical activity was recorded from 83 participants using wearable accelerometers (HJA-750C, OMRON Healthcare) worn for one month at the beginning of this study.
Gut microbiome profiles were obtained from fecal samples collected using FS-0007 collection kits (TechnoSuruga Laboratory Co., Ltd., Shizuoka, Japan). DNA libraries were sequenced across four lanes of an Illumina NovaSeq 6000 platform (Illumina, Inc., San Diego, CA, USA) with paired-end 150 bp reads.
2.6. Cognitive Outcome Classification Based on the MMSE
Cognitive status at 18 months was categorized into three groups based on MMSE scores: Normal (MMSE > 26), Possible MCI (24 < MMSE ≤ 26) or a drop in score more than 3 or equal from the initial time point to end time point, and Impaired (MMSE ≤ 23). This classification yielded 73 Normal, 20 Possible MCI, and 5 Impaired cases. These thresholds capture clinically meaningful cutoffs commonly used to characterize cognitive severity in older adults, and were used to define outcome labels for supervised machine learning (
Table 2). However, the MMSE alone has limited sensitivity for subtle cognitive changes and there is no universally accepted standard for defining MCI based solely on the MMSE. Accordingly, our outcome categories should be viewed as pragmatic severity strata rather than definitive clinical diagnoses within a cohort that may already include individuals with mild baseline impairment, rather than incident conversion from entirely normal cognition.
2.7. Biological Rationale for Selected Predictors
A range of multimodal predictors, including biochemical markers, chiral amino acids, metabolites, physical activity metrics, gut microbiome alpha diversity, and β-amyloid, was selected to capture complementary biological, behavioral, and pathological pathways that may jointly influence cognitive status. These features were considered suitable for predicting MMSE-based cognitive categories due to their mechanistic relevance to cognitive decline.
Systemic metabolic dysfunction and low-grade inflammation, assessed via routine blood panels (e.g., lipids, glucose, renal function, uric acid, and leukocyte-derived ratios), are linked to amyloid burden and cognitive impairment. Their inclusion enables the identification of vascular, metabolic, and immunologic contributors to cognitive changes.
Targeted plasma concentrations of chiral amino acids and related metabolites provide insights into neurotransmitter pathways (e.g., glutamate/GABA and tryptophan-kynurenine), host microbiome co-metabolism, and oxidative stress. These pathways are directly related to cognitive and mood regulation and provide sensitive molecular signatures for cognitive phenotyping [
16,
17,
18,
19].
Physical activity metrics, such as daily steps, metabolic equivalents of tasks (METs), and exercise volume, are objectively associated with preserved cognitive function and represent modifiable behavioral signals that complement static clinical measures. Physical activity also interacts with vascular risk, metabolic regulation, and inflammatory processes [
20,
21,
22,
23].
Lastly, gut microbiome alpha diversity (e.g., Shannon index) and microbial community composition have been associated with cognitive performance and future cognitive trajectories, providing a gut–brain axis that complements both blood biomarkers and behavioral metrics [
24].
2.8. Data Preprocessing
2.8.1. Variable Scaling
All predictor variables were standardized prior to model training to align their distributions and ensure comparability across features with different units and scales. Standardization adjusts each feature to have zero mean and unit variance, which prevents variables with large absolute magnitudes from disproportionately influencing model fitting. This procedure improves numerical stability, facilitates convergence during optimization, and enhances performance for scale-sensitive algorithms by ensuring balanced gradients.
2.8.2. Encoding of Categorical Variables
Categorical variables were encoded using one-hot encoding. This encoding is broadly compatible with tree-based machine learning models, which can inherently handle sparse and non-ordinal inputs without requiring additional normalization.
2.8.3. Missing Data Handling
Missing values were imputed using the median strategy, which is robust to outliers and skewed distributions, which are common in small, heterogeneous clinical datasets. Unlike the mean or model-based approaches, the median preserves central tendency without being distorted by extreme values, making it a reliable baseline for multimodal data imputation in low-sample settings.
2.9. Machine Learning Model Architecture
We developed a two-stage classification model to predict 18-month cognitive outcomes, as assessed by MMSE scores, based on baseline multimodal data. The classification was structured to reflect the clinical progression of cognitive impairment. In the first stage, the model identified cognitively normal participants from those with any abnormality (Possible MCI or Impaired). In the second stage, it further differentiated between Possible MCI and Impaired cases. This stepwise approach reduces misclassification between adjacent cognitive categories and allows each stage to be optimized for its specific clinical trade-offs.
The MMSE-derived categories exhibit ordinal structure and clinically subtle boundaries, particularly between Normal and Possible MCI. A staged formulation helps isolate this boundary uncertainty by first separating broad abnormality before learning finer distinctions within a pre-filtered subgroup. Prior studies have shown that addressing class imbalance through resampling or class weighting improves model performance in small clinical datasets with skewed label distributions.
To address the marked class imbalance, particularly the low prevalence of Impaired cases, a Random Forest-based model with integrated resampling was employed and in penalized logistic regression class weights were utilized. This approach improves stability and sensitivity to minority classes, especially in small, heterogeneous datasets. In this high-dimensional, low-sample setting, overfitting and instability of model estimates are important concerns, particularly for non-linear models. To mitigate these risks, we combined tree-based ensembles with feature subsampling and class rebalancing, and we used penalized logistic regression as a complementary linear baseline to provide implicit variable selection under Leave-One-Out Cross-Validation.
2.10. Validation Strategy
To evaluate model performance under the limited sample size, we applied Leave-One-Out Cross-Validation (LOOCV) for both stages and for both the Random Forest and logistic regression classifiers. In this framework, each iteration trains the model on all but one participant and evaluates it on the held-out individual, cycling through all samples so that every participant serves once as an independent test case. Using the same LOOCV scheme across models ensured directly comparable performance estimates and approximates the intended clinical use case, in which predictions must generalize to previously unseen individuals with similar baseline assessments.
2.11. Hyperparameter Optimization
Bayesian optimization was used for hyperparameter tuning in both classification stages and for both model families, as it efficiently identifies high-performing configurations with fewer evaluations, which is particularly advantageous under LOOCV, where each evaluation is computationally intensive. For the Imbalanced-Learn Random Forest, a 1000-iteration search was conducted in Stage 1; LOOCV accuracies converged around 0.77–0.78 while macro-level precision, recall, and F1 fluctuated more, and the final model favored a relatively shallow forest with entropy splitting, max_depth = 19, and max_features = sqrt. In Stage 2, the Random Forest search converged within approximately 32 iterations, with optimization-stage LOOCV accuracy exceeding 0.96 and precision and recall approaching 0.92–0.98, leading to the selection of a deeper tree ensemble (max_depth = 17, n_estimators = 256) that evaluates all features at each split. During these searches we relied on the internal resampling strategy of Balanced Random Forest Classifier and did not specify additional class weights, allowing the algorithm’s built-in balancing to handle label skew while hyperparameters were tuned. For the logistic regression baselines, separate Bayesian searches were run in each stage over regularization strength (C), penalty type, and class-weighting schemes, yielding in Stage 1 an L1/Lasso-based penalized model with moderate regularization (C ≈ 1.48) and no explicit class weighting, and in Stage 2 a weakly regularized L1/Lasso-based model (C ≈ 634.35) with manual up-weighting of the minority Impaired class (class_weight = {Impaired: 3.0, Possible MCI: 1.0}). Hyperparameter search and performance estimation were both conducted within the same LOOCV framework without additional nested cross-validation or bootstrap resampling because further partitioning the data or extensive resampling (e.g., nested CV or bootstrap) would have resulted in extremely small and unstable training folds, particularly for the small classes. The resulting LOOCV metrics represent internally optimized, exploratory estimates of model performance rather than fully unbiased external validation. Optimization trajectories and the final tuned parameters for both Random Forest and logistic regression models are summarized in
Table 3.
2.12. Feature Attribution via SHAP Analysis
To interpret model predictions and identify contributing features, we applied SHAP (Shapley Additive Explanations) in both classification stages. For the Imbalanced-Learn Random Forest models, we used the TreeExplainer module, and for the logistic regression baselines we used the LinearExplainer module, allowing SHAP values to be computed in a manner tailored to each model class while retaining a common additive framework. SHAP provides feature-wise attribution scores that quantify the contribution of each input variable to individual predictions, supporting both local interpretability at the participant level and global feature importance ranking across the cohort.
2.13. Post Hoc Group Comparison
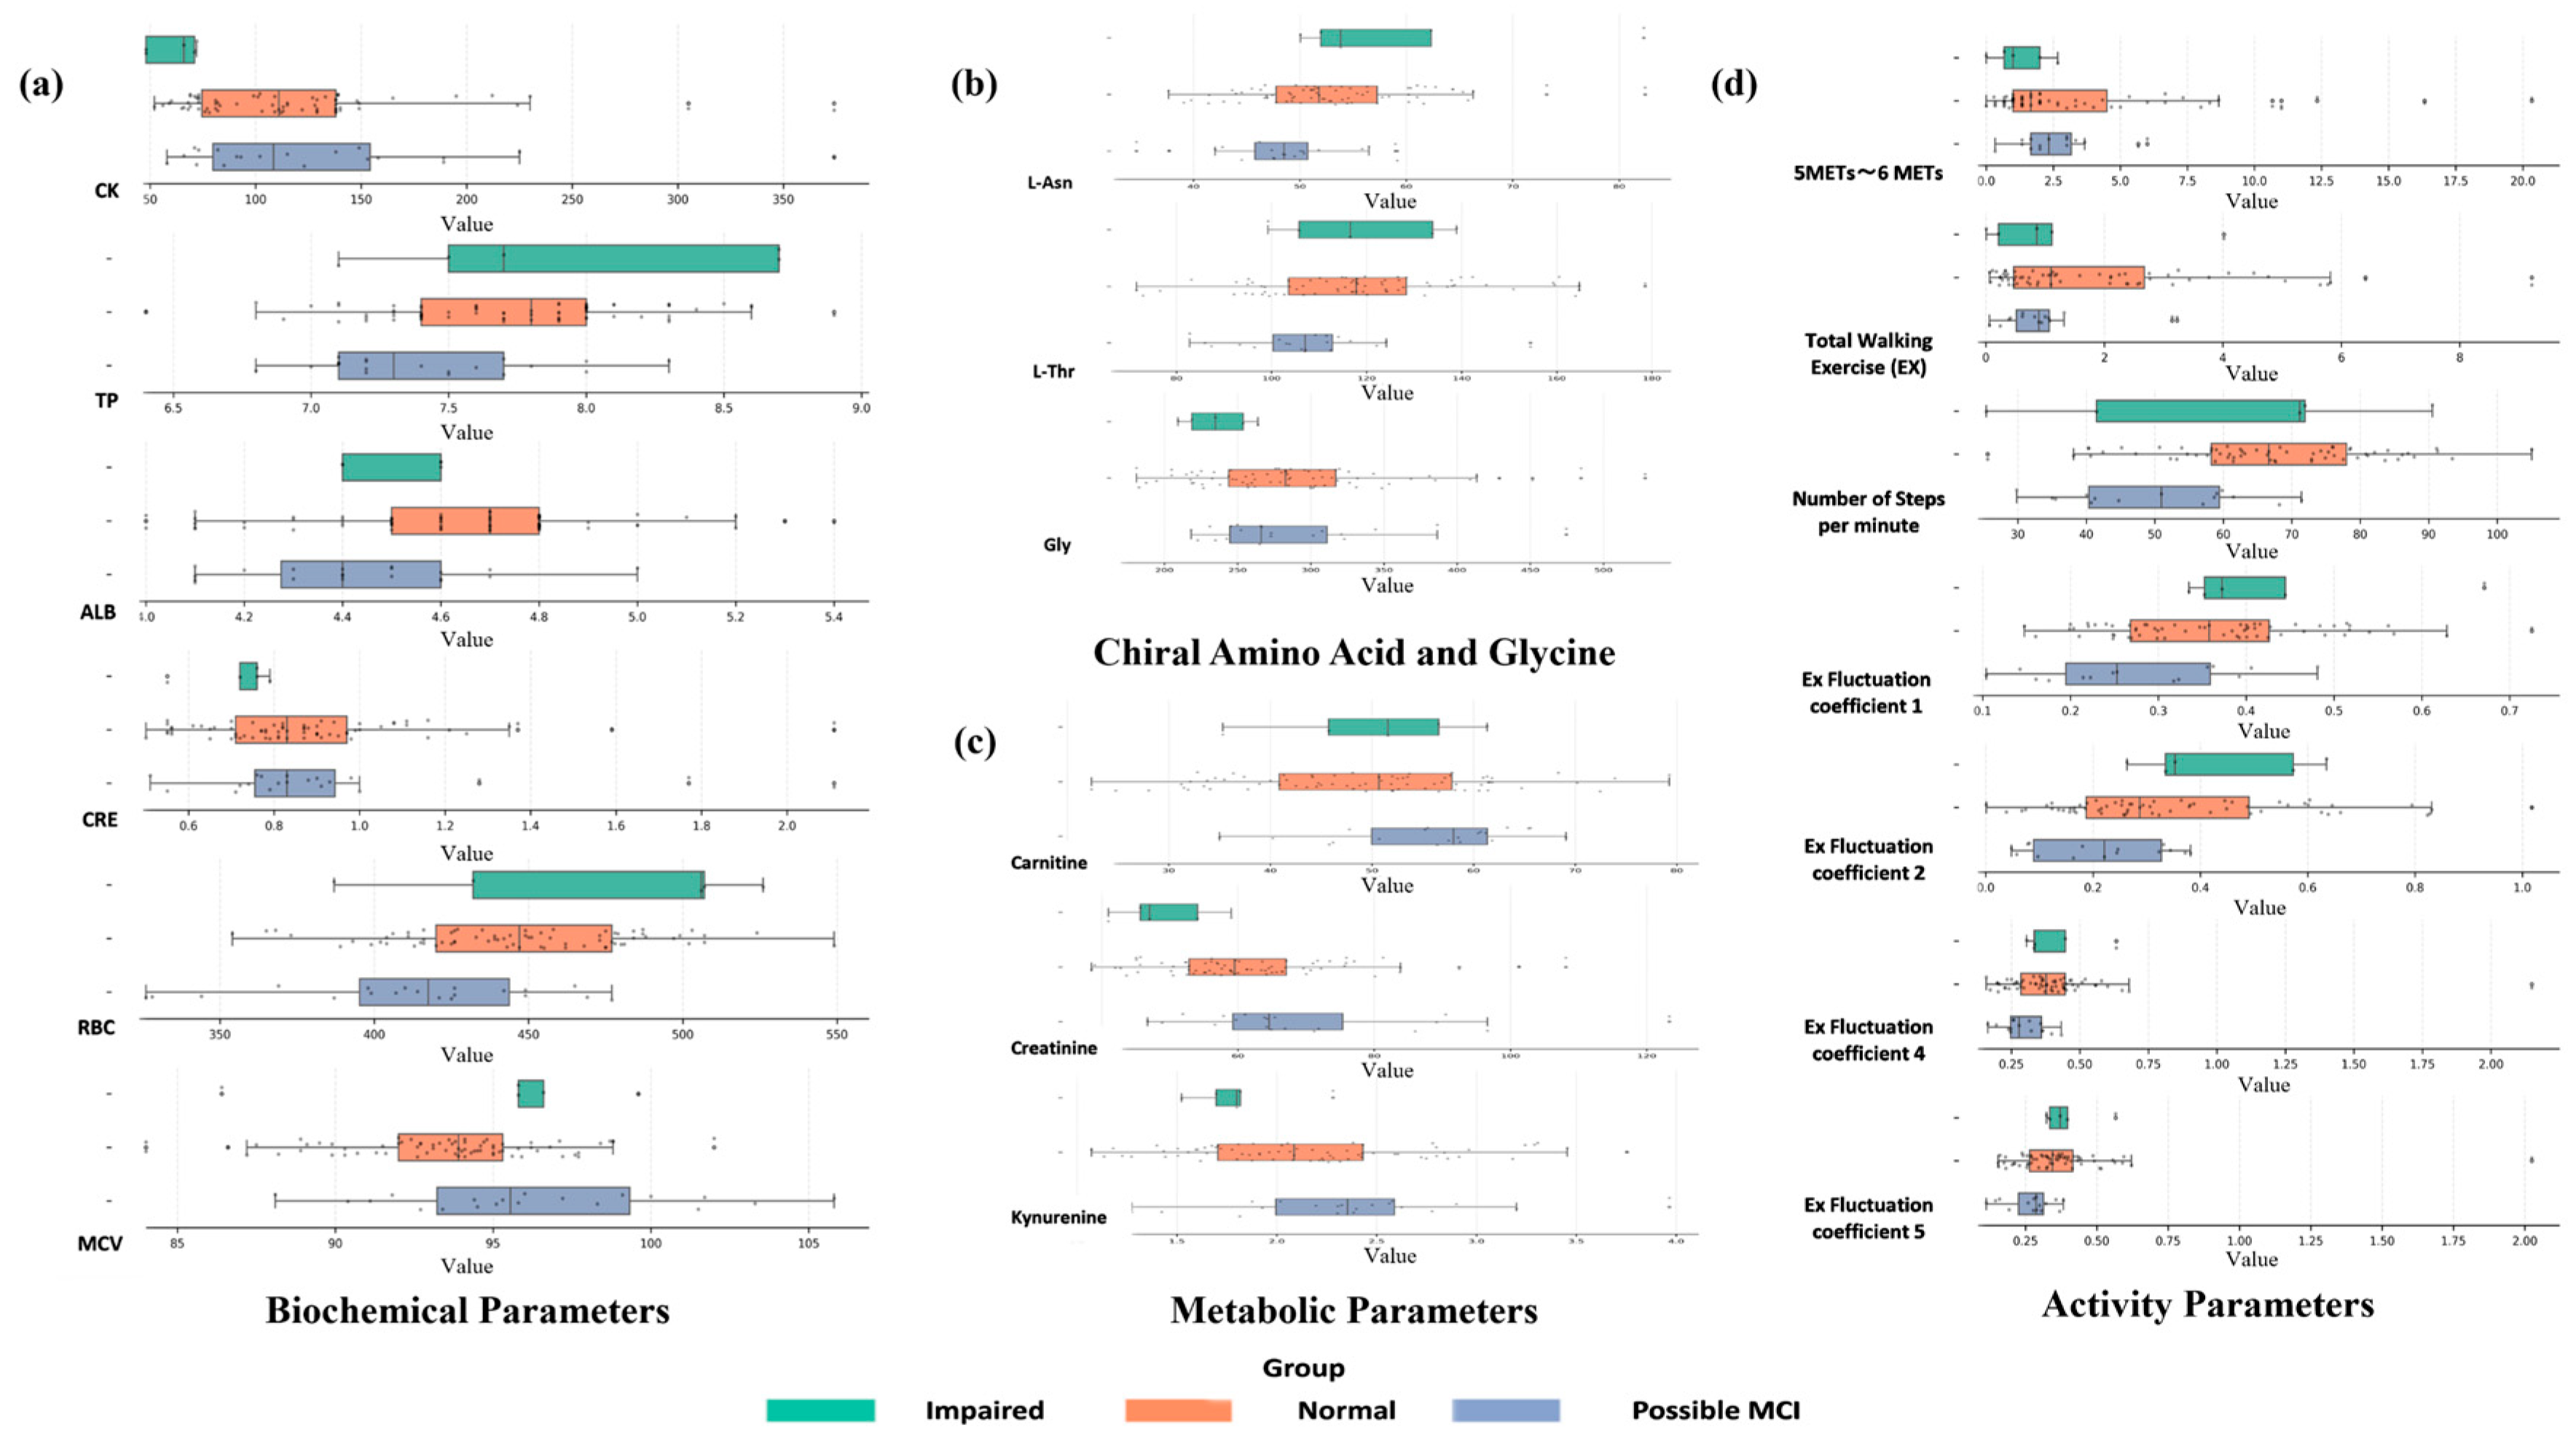
We conducted Games–Howell tests to compare baseline features across MMSE-defined cognitive categories (Normal, Possible MCI, Impaired), as a post hoc statistical complement to the model-derived feature importance. This test is appropriate for unequal variances and unbalanced sample sizes, providing more reliable Type-I error control than pooled-variance methods in heterogeneous clinical data.
2.14. Software Packages
All analyses were performed using the Python programming language and open-source Python packages. The software environment consisted of Python version 3.10 and the following major libraries (with versions), which were primarily used in the analyses: Pandas 2.2.2, NumPy 1.26.4, Matplotlib 3.5.1, Seaborn 0.13.2, Pingouin 0.5.5, Statsmodels 0.14.0, Scikit-bio 0.6.0, Scikit-learn 1.6.1, Scikit-optimize 0.10.2, SciPy 1.13.0, and SHAP 0.46.0.
4. Discussion
4.1. Principal Findings and Rationale of the Two-Stage Framework
This study developed and evaluated a two-stage, explainable machine learning framework to predict cognitive status at 18 months using baseline multimodal data from a community-dwelling elderly cohort. Across both the Imbalanced-Learn Random Forest and a penalized logistic regression baseline, the models consistently indicated that combinations of renal and systemic metabolic markers, amino acid and redox-related metabolites, and wearable-derived physical activity features carry informative signals about cognitive abnormality and severity. Structuring prediction into two sequential stages, first separating cognitively Normal individuals from those with any abnormality (Possible MCI or Impaired), which already represents a generalized binary classifier, and then distinguishing Possible MCI from Impaired, aligns the modeling strategy with the clinical progression of cognitive decline and allows stage-specific biomarker patterns to emerge. It is also important to note that our models were trained in a cohort defined by baseline MMSE ≥ 24, a criterion that allows the inclusion of individuals with possible mild impairment at enrollment. As a result, the classifiers primarily capture associations between baseline multimodal profiles and MMSE-defined severity status at 18 months, on top of pre-existing variability in cognitive function, rather than predicting purely de novo onset of impairment from a uniformly normal baseline. Accordingly, our findings should be interpreted in terms of stage-dependent differences in 18-month MMSE severity, not as estimates of strict conversion rates from normal cognition to MCI or dementia.
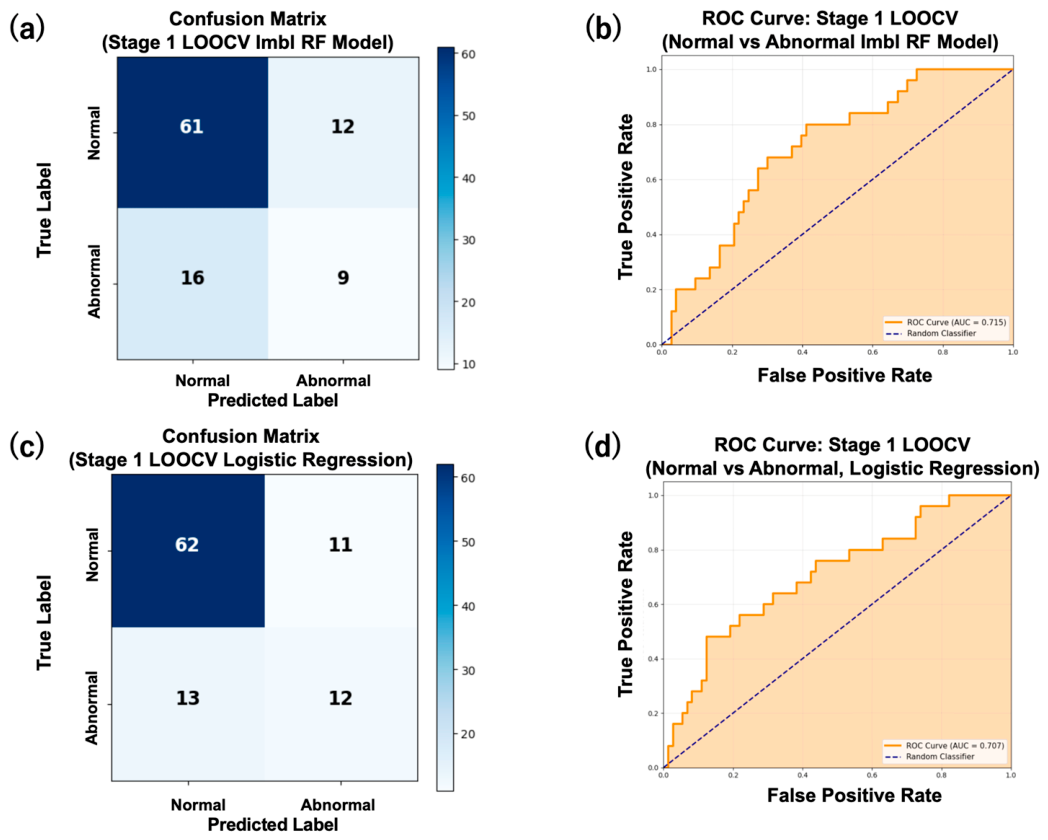
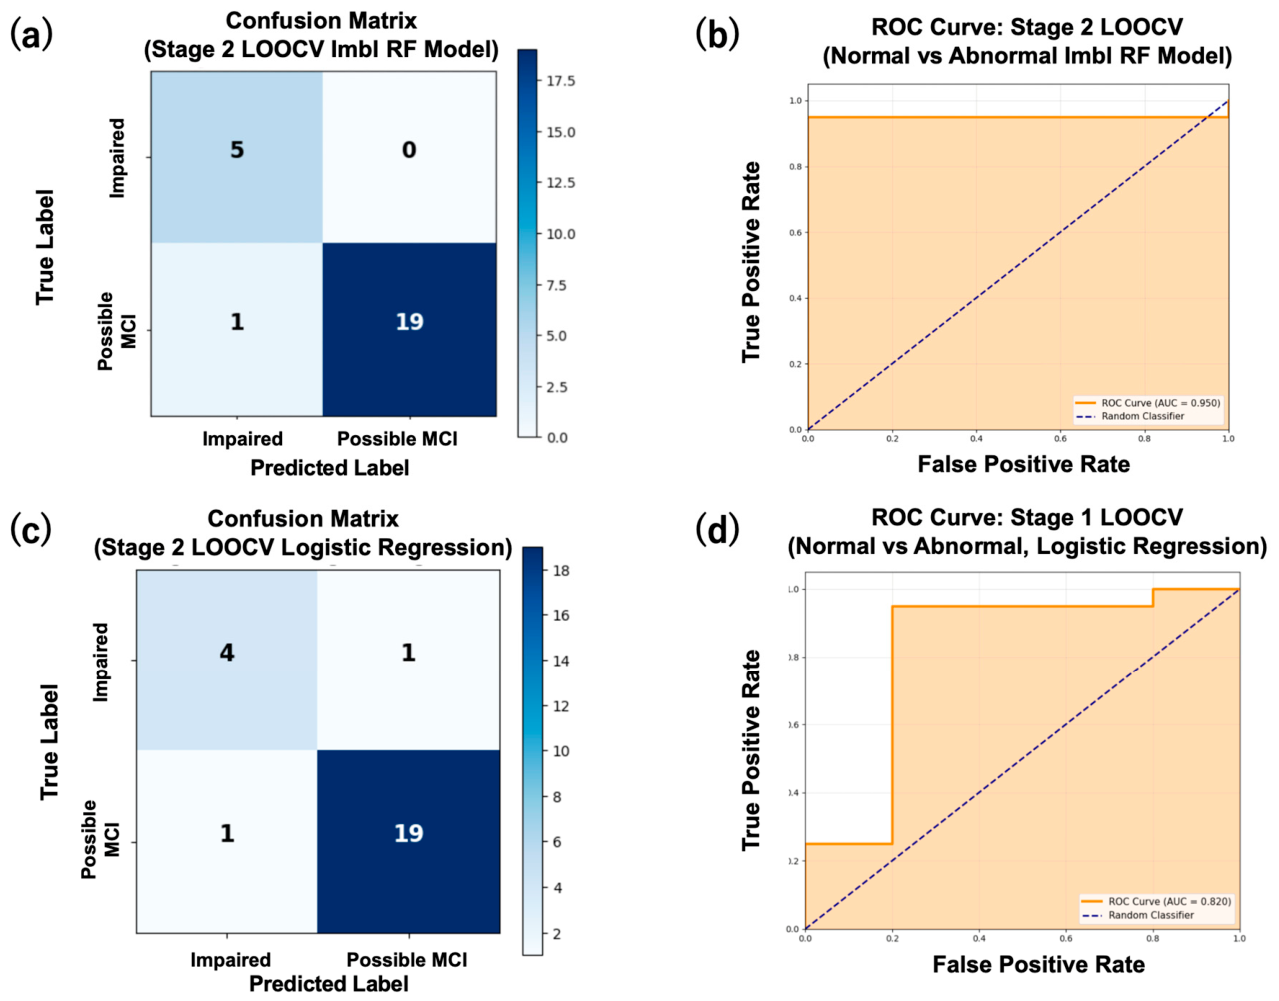
In Stage 1, both models achieved moderate discrimination: Random Forest provided slightly higher ROC-AUC values, whereas logistic regression achieved somewhat higher accuracy and sensitivity, suggesting that the underlying signal is robust to different modeling assumptions. In Stage 2, both approaches revealed strong separability between Possible MCI and Impaired cognition, with Random Forest achieving very high accuracy and AUC and logistic regression still performing well despite the small Impaired subgroup. SHAP analyses applied separately to the Random Forest and logistic regression models provided convergent evidence that the same broad biomarker groups, renal and metabolic indices, amino acid and oxidative-stress markers, and activity-variability measures, drive predictions at each stage, supporting an integrative view of cognitive aging as a multisystem process.
4.2. Biological Signatures in Stage 1
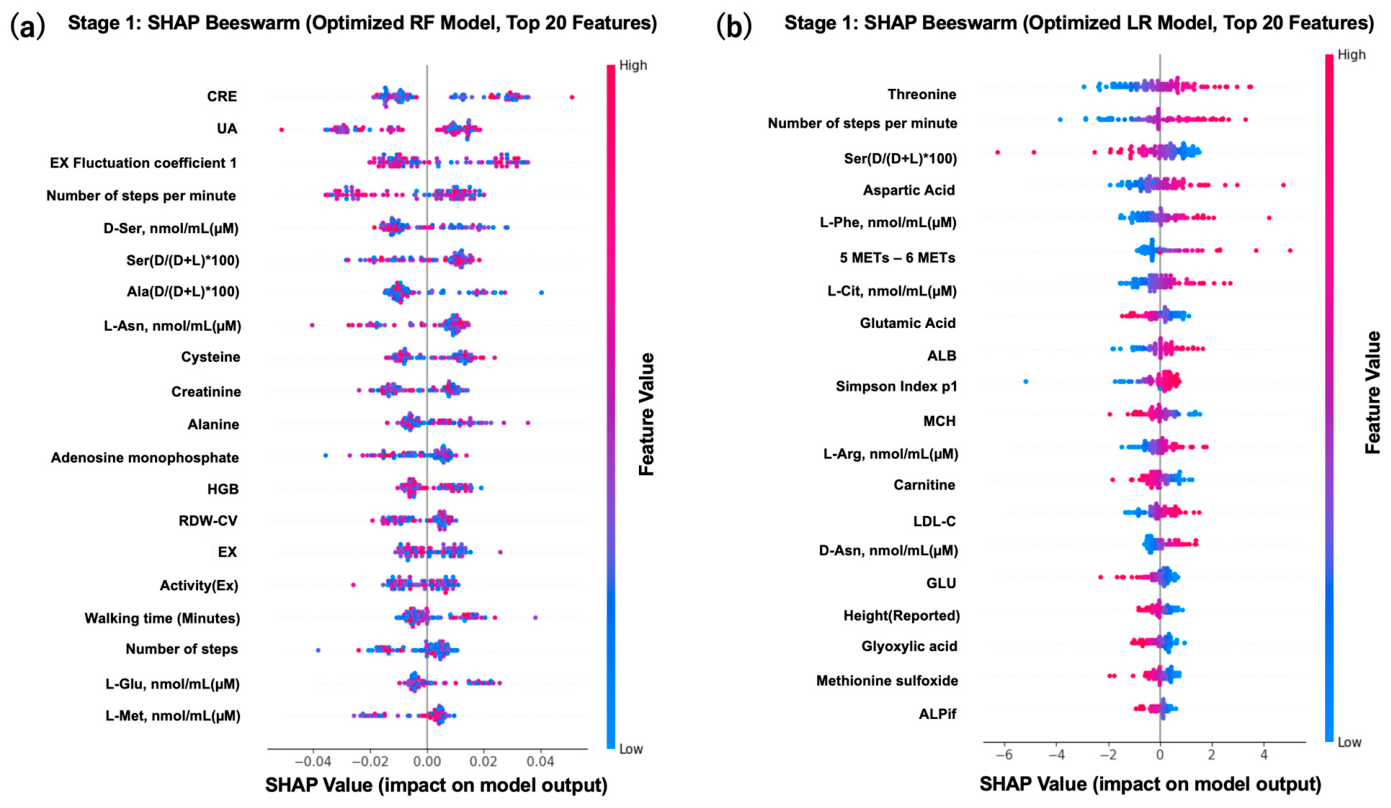
Stage 1 of our framework, which differentiated Normal participants from those of Possible MCI or Impaired, was primarily influenced by markers of renal function, nitrogen–purine metabolism, and systemic metabolic status in both modeling approaches. Uric acid, creatinine, and blood urea nitrogen emerged as the most influential predictors, indicating that kidney-related metabolic processes offer valuable insights into early cognitive abnormalities. The tuned logistic regression model likewise assigned substantial weight to creatinine. These routinely measured clinical markers may reflect the combined effects of vascular burden, metabolic homeostasis, and systemic clearance mechanisms might be relevant to brain aging [
25,
26].
In Stage 1, amino acid-related signatures, with multiple chiral and proteinogenic amino acid measures including D-serine, D-amino acid proportions, and L-asparagine, alanine, and L-glutamic acid, together with adenosine monophosphate and cysteine, pointing toward variation in neurotransmission-relevant pools, host microbiome co-metabolism, and antioxidant capacity ranked among the top contributors. Logistic regression emphasized a partially overlapping subset, including threonine, glutamic acid, tryptophan, and methionine sulfoxide, reinforcing the importance of amino acid and redox pathways under a linear modeling assumption as well. These amino acid features can be interpreted as reflecting broader systemic metabolic and neurotransmission-relevant variation already captured by the multimodal panel, rather than being specific markers of established neurodegeneration at the screening stage [
27,
28]. This interpretation is consistent with prior reports indicating that circulating amino acid profiles, including alanine/asparagine panels and D-amino acid proportions, differ across the cognitive spectrum and may relate to cognitive phenotypes in a domain-dependent manner [
20].
Redox- and energy-associated metabolites also contributed to Stage 1 predictions. Cysteine, a key substrate for glutathione synthesis, was an important feature, consistent with its role in maintaining antioxidant defenses and cellular redox balance [
29,
30,
31]. Adenosine monophosphate was another influential predictor, suggesting a link between peripheral energy-state signaling and early cognitive vulnerability. These findings indicate that Stage 1 reflects a range of systemic metabolic signals rather than markers specific to established neurodegeneration [
32].
In addition, the Simpson index of gut microbiome diversity appeared among the influential predictors in the Stage 1 logistic regression model, suggesting that overall microbial community structure may also contribute to baseline differences between cognitively Normal and Abnormal participants in this cohort.
4.3. Physical Activity Variability in Both Stages
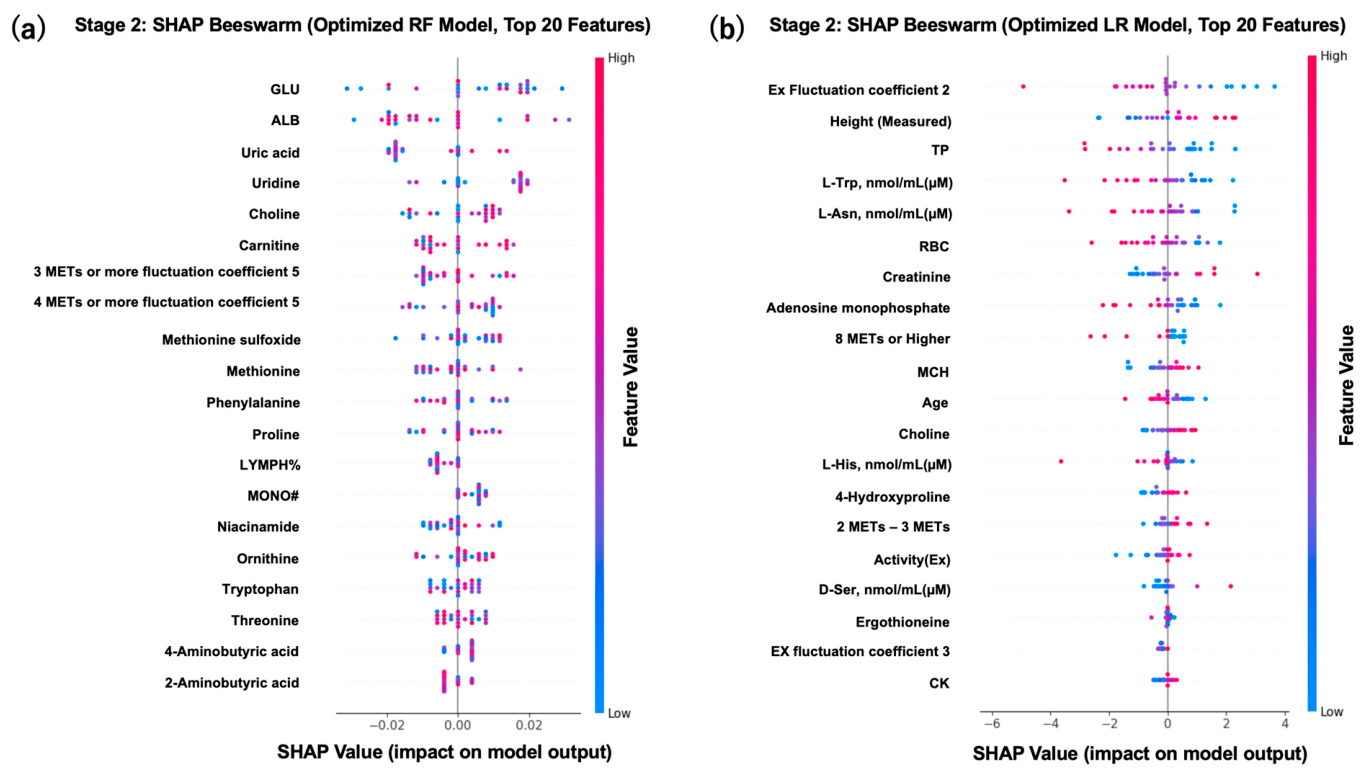
Wearable-derived physical activity metrics also contributed significantly to the predictive signal across both stages, particularly those capturing variability in activity patterns, highlighting their relevance to cognitive status. In Stage 1, the Random Forest model ranked exercise fluctuation coefficients, steps per minute, total steps, and walking time among the top features, while logistic regression also selected steps per minute and MET-based indicators within its most informative variables. In Stage 2, high-MET fluctuation coefficients (e.g., 3 METs or more and 4 METs or more) remained influential in the Random Forest SHAP results, and logistic regression highlighted additional activity-related variables such as EX fluctuation coefficients and MET-derived categories.
The prominence of activity variability suggests that irregular daily movement patterns may provide an early functional signature of instability associated with cognitive decline, complementing static biochemical measures [
33,
34]. These wearable-derived features are objective, non-invasive, and scalable, and their consistent appearance among the leading predictors in both models underscores the value of integrating behavioral data with clinical and metabolomic biomarkers for community-based cognitive risk assessment.
These findings are consistent with previous research linking accelerometry-derived features to cognitive function [
35].
4.4. Biological Signatures in Stage 2
In Stage 2, which distinguished Possible MCI from Impaired cognitive conditions, the machine learning classifier and logistic regression baseline both indicated a distinct pattern of key features compared with Stage 1. In the Random Forest model, glucose and albumin, together with uric acid and uridine, emerged as important predictors, highlighting the association of glycemic control, protein and nutritional status, and nucleotide-related metabolism in more advanced impairment.
Uridine and uric acid emerged as important markers in Stage 2, indicating a shift toward nucleotide-related metabolism in advanced impairment [
36,
37,
38]. Glutamic acid was also highly ranked, underscoring its role in excitatory neurotransmission and synaptic function [
39,
40]. Choline was also contributing to the classification, linking cholinergic pathways to cognitive processes commonly examined in dementia research [
41,
42].
Markers of mitochondrial and energy metabolism were also prominent. Carnitine, involved in fatty acid transport and mitochondrial energy production, and niacinamide, a precursor in NAD
+ metabolism, contributed to severity classification. Oxidative stress-related metabolites, such as methionine and methionine sulfoxide, further supported the role of redox imbalance in advanced cognitive impairment. Together, these features suggest that the transition from Possible MCI to Impaired status involves coordinated changes in energy metabolism, neurotransmitter balance, and oxidative stress pathways [
43,
44]. Logistic regression converged on related pathways, emphasizing tryptophan, asparagine, histidine, 4-hydroxyproline, adenosine monophosphate, and ergothioneine among its top features.
Across both models, amino acid profiles, including phenylalanine, proline, ornithine, tryptophan, threonine, and short-chain amino acids, recurrently appeared, suggesting that coordinated shifts in amino acid metabolism, neurotransmitter precursors, and inflammatory or nitrogen-handling pathways accompany the transition from Possible MCI to more clearly Impaired status [
45,
46,
47,
48].
4.5. Integrative Interpretation and Clinical Implications
Overall, findings from both stages support a stage-dependent interpretation of cognitive aging as a systems-level transition captured by multimodal biomarkers. Broad Normal vs. abnormal classifiers (Stage 1) are linked to broad metabolic and behavioral vulnerabilities, reflected in renal and systemic metabolic markers, amino acid balance, and activity variability, whereas Possible vs. Impaired Classifier (Stage 2) is associated with more pronounced alterations in energy metabolism, nucleotide and choline pathways, oxidative stress, and behavioral irregularity. The convergence between the Imbalanced-Learn Random Forest and logistic regression models, together with SHAP-based explanations, strengthens confidence that these biomarker groups represent persistent signals in the data rather than model-specific artefacts. Another important consideration is the balance between model complexity and sample size. The multimodal predictor space in this study is large compared with the number of participants, which increases the likelihood of overfitting and sensitivity of feature rankings to small perturbations in the data. Although the use of LOOCV, regularized logistic regression, and ensemble methods helps to stabilize estimates, the specific feature sets highlighted by SHAP should be regarded as one plausible model-based representation of the signal in this dataset rather than as a definitive, stable list of biomarkers.
While larger cohorts, longer follow-up, and broader cognitive batteries will be needed to validate and refine these signatures, identifying feature contributions through SHAP analysis in hierarchal stages offers transparency that is vital for clinical insights and hypothesis generation. Using accessible biomarkers, such as routine blood tests and wearable-derived measures, increases the feasibility of applying similar frameworks in real-world settings.
The excellent Stage 2 performance metrics should be interpreted with particular caution given to the small size of the Impaired subgroup (n = 5), which substantially increases the risk of overfitting despite the use of LOOCV and imbalanced-learning strategies. We acknowledge that overfitting cannot be definitively ruled out, and validation in larger, independent cohorts remains essential. However, when interpreted as exploratory trends rather than definitive quantitative findings, these results offer meaningful methodological insights. The convergence of biomarker signatures across two independent modeling approaches (Random Forest and Lasso logistic regression), the biological plausibility of identified pathways (renal and systemic metabolic indices, glucose metabolism, oxidative stress, amino acid dysregulation), and supporting evidence from Games–Howell post hoc comparisons collectively suggest that observed patterns may reflect genuine biological signals worthy of further investigation. The primary contribution of this work lies in demonstrating a two-stage, explainable AI framework that integrates minimally invasive multimodal data for stage-aware cognitive assessment, serving as a methodological template for hypothesis-driven validation studies rather than providing immediately actionable clinical biomarkers.




 ,
,