
Article

Geospatial Assessment of Soil–Biosphere Nexus Using a Biophysical Soil Security Matrix: Evidence from Minnesota, USA


1
Department of Forestry and Environmental Conservation, Clemson University, Clemson, SC 29634, USA
2
College of Forestry, Agriculture, and Natural Resources, University of Arkansas at Monticello, Monticello, AR 71656, USA
3
The Libyan Center for Palm Tree Research, Libyan Authority for Scientific Research, Tripoli 00218, Libya
4
Department of Biological Science and Biotechnology, Minnan Normal University, Zhangzhou 363000, China
5
Department of Electronic Information, Zhangzhou Institute of Technology, Zhangzhou 363000, China
6
Department of Environmental Engineering and Earth Sciences, Clemson University, Anderson, SC 29625, USA
7
Clemson Center for Geospatial Technologies, Clemson University, Clemson, SC 29634, USA
8
School of Law, Emory University, Atlanta, GA 30322, USA
*
Author to whom correspondence should be addressed.
Biosphere 2026, 2(3), 10; https://doi.org/10.3390/biosphere2030010
Submission received: 24 July 2026 / Revised: 31 August 2026 / Accepted: 2 September 2026 / Published: 17 September 2026
(This article belongs to the Special Issue Sustainable and Resilient Biosphere)

Abstract

The soil-biosphere nexus is a critical component embedded in the concepts of soil security and ecosystem services (ES) and is directly linked to several global challenges identified by the United Nations (UN). Although soil security has been proposed as a policy framework, a major problem is that there are no standard procedures to assess the five dimensions of soil security: capability, condition, capital, connectivity, and codification in relation to the soil-biosphere nexus. This study proposes a land cover change matrix, disaggregated by soil type (“biophysical soil security matrix”), as a tool to evaluate the biophysical soil security continuum and its temporary changes, integrated with ES valuation. The matrix was tested using the state of Minnesota (MN) as a case study. Although the dominant soil orders in MN possess high natural capability, widespread human-caused land degradation has dramatically lowered their actual biophysical condition and has fueled massive soil decarbonization. Historic land degradation in MN due to human activity totaled 98,516 km2 through 2024, with nearly 480 km2 of anthropogenically degraded land created between 2001 and 2024. Based on carbon emissions alone, we estimate that historic land degradation in MN has resulted in total social costs of nearly $50B (U.S. dollars, B = billion = 109) through 2024, with about 10% of this total social cost being realized between 2001 and 2024. Trends like this threaten soil security by directly eroding the soil’s capacity to sustain ES. Based on the analyses and results, this study recommends conducting both soil-centric and human-centric analyses of soil security to ensure the sustainable use of soil.

1. Introduction

1.1. Background Information About the Soil Security Concept in Relation to the Biosphere

Soils are products of the interaction of Earth’s four spheres (hydrosphere, lithosphere, atmosphere, biosphere) and form a continuous surface layer called the pedosphere [1]. Soils provide a wide array of ecosystem services (ES), but these soil ES (provisioning, regulating/supporting, and cultural) are not uniformly distributed around the world [2] and are under various threats (e.g., erosion, pollution, etc. [3]); therefore, the soil needs to be protected which is the focus of the soil security concept [4]. Soil security is defined as “the maintenance and improvement of the world’s soil resource to produce food, fiber and freshwater, contribute to energy and climate sustainability, and maintain the biodiversity and the overall protection of the ecosystem” [5]. The soil security concept has five dimensions [4,6,7]:
  • Capability is the functionality and potential for soils to provide ES based on inherent (characteristic) soil types and properties (biophysical traits).
  • Condition is the present state of soil relative to its inherent/characteristic state (biophysical traits).
  • Capital is the valuation of soil resources based on ecosystem goods and ES (biophysical plus economic traits).
  • Connectivity is the connection between soil and society, particularly as it relates to the resources and knowledge needed to effectively manage soil [4] (socio-economic traits).
  • Codification is the connection between soil and societal protection, including government incentives and/or regulations to promote sustainable use and stewardship of soil resources [4] (socio-economic traits).
The soil security concept is intended to address six global sustainable development challenges (food security, energy security, water security, biodiversity protection, climate change mitigation, and the provision of ecosystem services) [8] and complement other soil concepts, such as soil quality [9] and soil health [10], which tend to be used mainly on a local scale (e.g., field). The concept of soil security can be seen as an evolution in understanding of the importance of soil and humanity’s reliance on its care. Soil security is built on a field-scale understanding of the ecosystem services provided by soil, scaled up to a global level to help understand, manage, and preserve overall soil resources through soil governance [11,12].
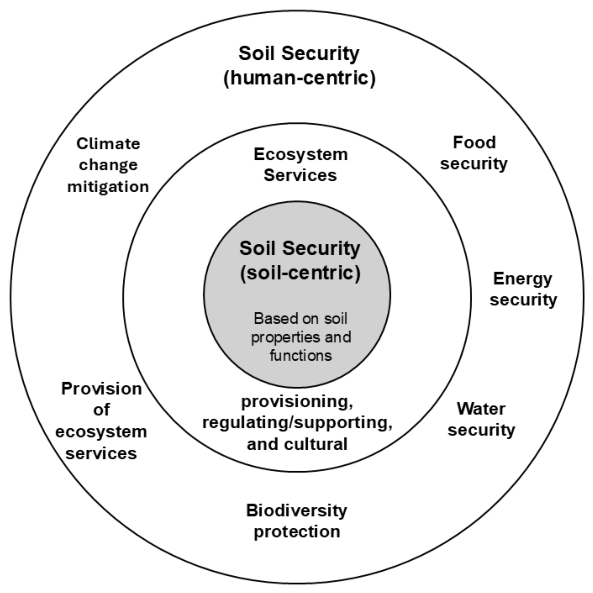
Soil security is a broad soil- and human-centric concept, which is challenging to assess because it requires an understanding of the intrinsic value of soil based on the benefits it provides to nature and the economic value it delivers based on the benefits to humans (Figure 1) [13]. Most soil security research focuses on the benefits soils can provide to humans through ecosystem services [14]; however, it is also necessary to account for inherent soil quality and the existing state of soil degradation, which defines what ecosystem benefits soils can provide, as well as the overall loss of value that occurs when soils are functionally removed by ever-expanding human developments. The intrinsic value of soil, defined as its value independent of economic use [15], is unknown; therefore, the benefits of soil to nature and biodiversity are often overlooked. There can be a conflict between preserving the intrinsic value of soil and focusing on providing ecosystem services for human value (e.g., food security at the cost of soil degradation from agricultural activities).
Assessment of soil security requires tools and methods to quantify the impacts of human actions on soil, particularly those that degrade or remove soil functions. The state of Minnesota (MN), within the contiguous USA, serves as a good model for understanding and evaluating soil security because it covers a large area and contains vital, agriculturally important soils.

1.2. Brief Literature Review and Objectives of the Study

The soil security concept is challenging to implement at a specific location because it requires multidisciplinary expertise, data, and tools, and there are no standard methods for assessing soil security. Several studies across a range of biophysical and governance contexts have attempted to apply the soil security concept, each with its own interpretation of what soil security entails [16,17,18]. For example, one study in agriculturally dominated areas of Central Java, Indonesia, used spatial modeling of three soil security dimensions and emphasized the need for detailed soil maps to accurately assess soil security [16]. A recent study in Tasmania mapped soil security by integrating its individual dimensions into a comprehensive assessment, revealing low security in agricultural soils and high security in conservation areas [17]. Digital soil mapping systems can be used to evaluate and track soil security over large areas, but it is important to develop local-scale methods, with remote sensing having the potential to help assess soil capital [18]. Soil capacity, another dimension of soil security, can be evaluated in terms of the ability to provide ES and soil resilience (soil stability and the capacity to recover from degradation) [7].
Studies from other regions also indicate that approaches to assessing soil security need to be adapted to local soil, data, and governance structures. An investigation of agricultural land in East–Central China assessed all five dimensions of soil security using spatial data and found that, although a significant portion of the region exhibited high crop production potential and was protected by regulatory policy, soil connectivity remained limited [19]. Soil security in the European Union (EU) depends on robust monitoring, adaptive governance, and stricter legal protections for soil resources [20]. In the Pacific region, the use of rapid soil spectral methods to estimate soil condition and capital in data-poor island environments was examined, and the importance of local data calibration and regional data sharing was emphasized [21]. These studies demonstrate that soil security can be evaluated in a variety of regions, but the available indicators and methods depend on local biophysical conditions, data availability, and institutional settings. Information on changes in soil conditions is crucial for conveying the importance of soil security and enhancing soil connectivity with stakeholders and policymakers, improving the codification of soil security [18]. Previous efforts to map soil security have lacked an inherent assessment of soil quality and a temporal analysis of changes in soil security. The present study proposes to address some of these limitations by integrating soil data with land use/land cover (LULC) analysis over time to monitor soil security. Land cover classes represent the ecosystem services provided by soils and can therefore be monitored over time as indicators of changes in those services [22,23,24,25]. For example, cultivated crops and hay/pasture LULC categories represent food security and relate to provisioning ES provided by soil. Often, LULC categories can represent multiple aspects of human-centered soil security, as seen with wetlands, which provide both water security and climate change mitigation. The analysis of LULC change over time documents shifts in LULC that affect soil security, with the conversion of land to development being one of the most destructive and irreversible threats to soil resources [5]. Furthermore, some LULC change analysis can help track the “maintenance and improvement” requirement as defined in the concept of soil security [5].
This study’s hypothesis is that soil security and its changes can be extensively monitored using satellite remote sensing to track conversions among LULC categories that relate to the maintenance, improvement, and loss of soil security, and to estimate loss and damage (L&D) related to climate change from land/soil conversions over time. By linking soil data to monitoring changes in soil security, it becomes possible to estimate carbon losses from greenhouse gas (GHG) emissions associated with remote sensing-identified changes. This study’s primary objective was to develop a spatial monitoring approach to assess the status and temporal dynamics of soil-centric soil security dimensions 1, 2, and 3 in the state of MN using land-cover datasets derived from satellite remote sensing imagery [26]. Sub-objectives included (1) determining the soil security status and its dimensions for 2024 and its temporal trends between 2001 and 2024, disaggregated by land cover category, which are related to climate change aspects of soil security; (2) quantifying climate change related soil security damages (e.g., C losses attributable to soil conversion associated with development activities and the corresponding realized social cost of carbon (SC-CO2)) as an estimate of the potential damages from CO2 derived by the United States (US) Environmental Protection Agency (EPA) [27]); and (3) examining policy recommendations and legal considerations for strengthening the concept of the soil security.

2. Materials and Methods

2.1. Study Area and Brief History of the Impacts of Land Conversions on Soil Security in Relation to Biodiversity and Ecosystems in the State of Minnesota (MN), USA

The state of MN was selected as a study site because it has a variety of soil and land use types and is among the largest of the 48 contiguous U.S. states. There are two Köppen climate types in MN: Dfb (warm-summer humid continental) and Dfa (hot-summer humid continental) [28]. The state of MN has seven soil orders representing soils that are slightly, moderately, and strongly weathered [29]. These soil orders occur across a wide range of land cover types, with varying degrees of degradation and soil security [29].
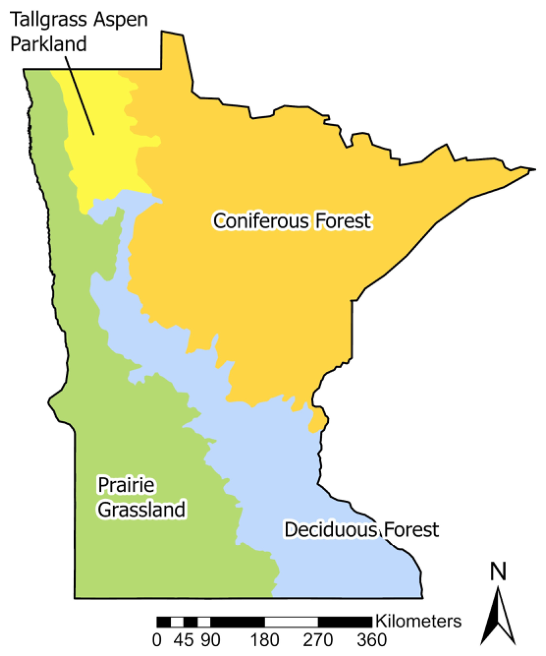
The evolution of soil security, as it relates to biodiversity and the protection status of the ecosystem in the state of MN, is intricately linked to the history of human land transformation in the USA [30]. The soils of MN were mostly intact under the forest and grassland biomes present before European settlement (before the 1800s) (Figure 2 and Table S1) [31,32]. European settlement in Minnesota resulted in widespread conversion of the Tallgrass Aspen Parkland, Deciduous Forest, and Prairie (grassland) biomes to cropland, particularly on Mollisols, which rank among the most agriculturally productive soil orders globally [31,32]. The Coniferous Forest biome was somewhat spared from land conversion due to extensive water bodies (e.g., lakes, wetlands) and the presence of relatively low-quality soils (SQ), such as Inceptisols. The state’s agricultural development was accompanied by extensive environmental destruction, including deforestation, land degradation (LD), and wetland drainage, which resulted in the loss of soil carbon (C) due to drainage and disturbance, and reduced the C sequestration potential in forests [31,32]. While some of these actions enabled agricultural activities, they likely caused significant deterioration of water resources, including wetlands, and overall biodiversity [33]. Mikhailova et al. (2025) [33] estimated that the amount of anthropogenically degraded land in MN was approximately 56.9% in 2021.
The area of wetlands in the present-day state of MN was 60,986.1 km2 in 1780 but experienced more than a 40% loss in wetland area between 1780 and 1980 [34], resulting in 3.6 × 10¹² kg midpoint total soil carbon (TSC) loss and corresponding midpoint social cost of carbon dioxide emissions (SC-CO2) in the amount of $619.4B USD [35]. Soil C data is often reported as a midpoint value, which is the central dataset value, and is an average of the lowest and highest reported values. Wetland losses were variable within the original biomes of MN: 90% of the wetlands were lost in the Prairie (grassland) biome, 40–60% of the wetlands were lost in the Deciduous Forest biome, and 5% of the wetlands were lost in the Coniferous Forest biome (Figure 2) [31].

2.2. Geospatial Analysis

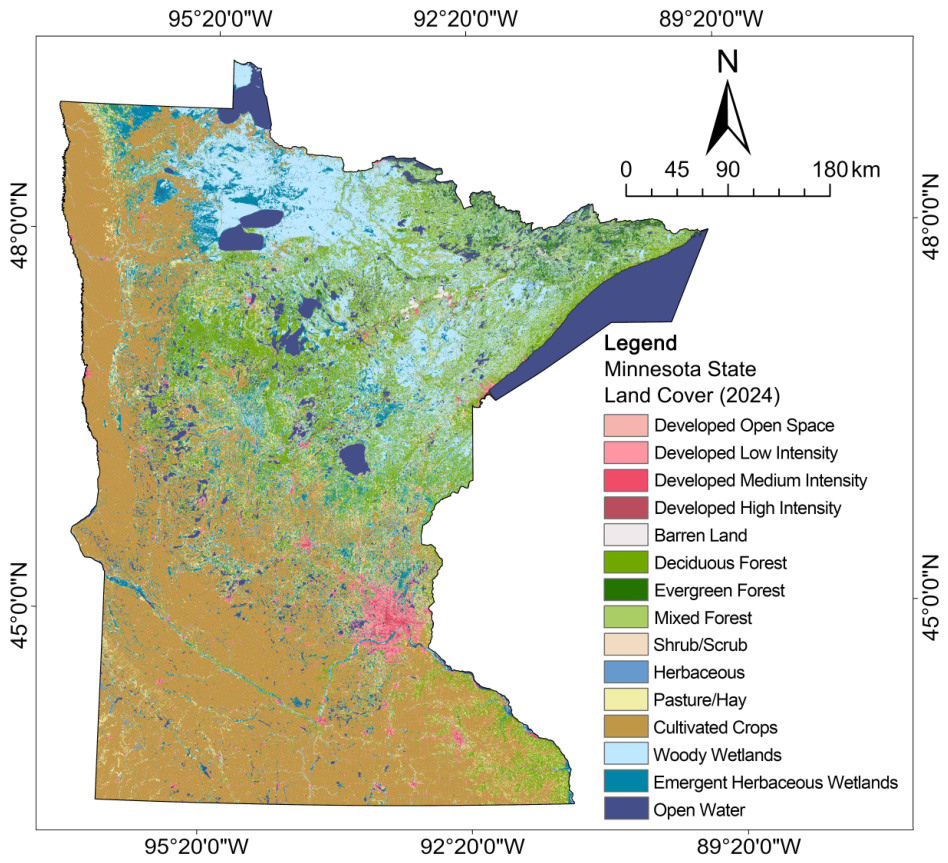
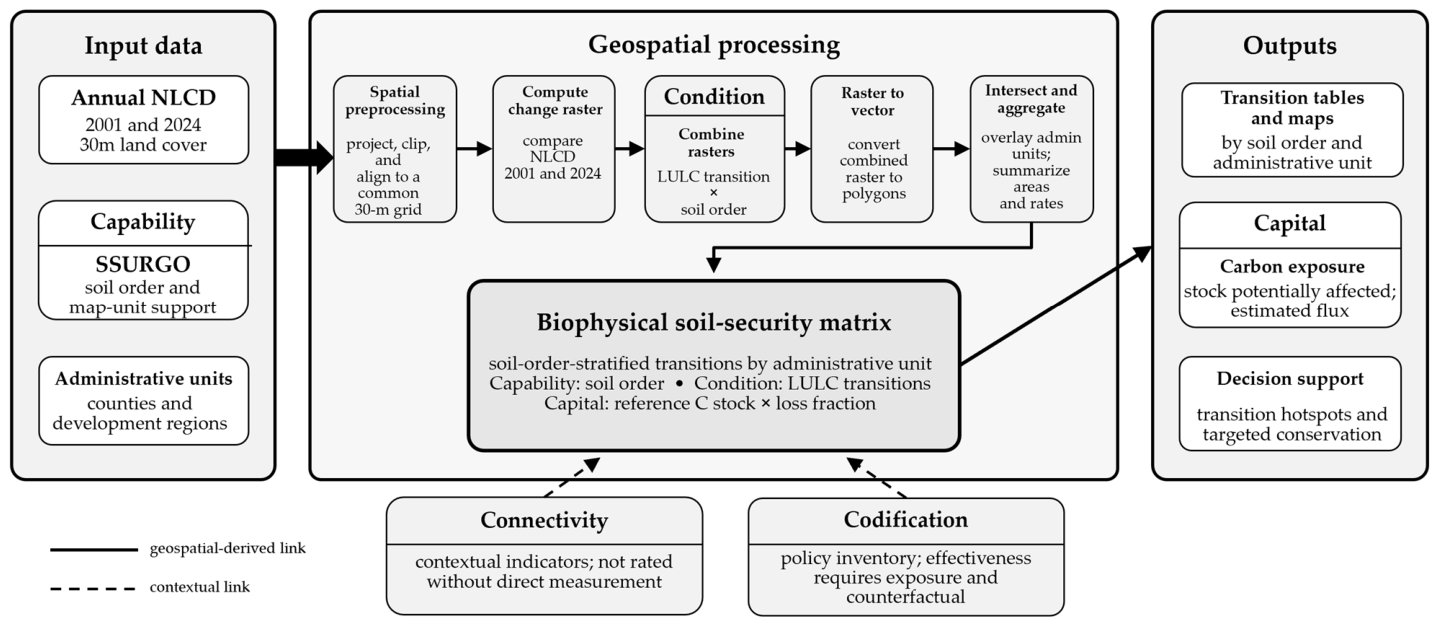
This analysis used detailed soil information from the Soil Survey Geographic Database (SSURGO), one of the highest-resolution soil survey databases commonly available across much of the conterminous United States [29]. SSURGO provides spatial soil mapping units and associated soil attributes at detailed survey scales and was used to characterize the spatial distribution of soil orders within Minnesota. Land cover data for 2001 and 2024 were obtained from the U.S. Geological Survey Annual National Land Cover Database (Annual NLCD), distributed through the Multi-Resolution Land Characteristics Consortium (MRLC) [26]. The Annual NLCD land-cover product is derived from Landsat imagery at a 30-m spatial resolution.
The land-cover datasets used in this study were existing, processed land-cover products obtained from MRLC. Therefore, the study did not perform radiometric correction, atmospheric correction, cloud masking, or land-cover classification directly from raw satellite imagery [26]. Instead, pre-processing focused on spatial harmonization of the existing land cover, soil, and administrative datasets prior to overlay and change analysis. All spatial datasets were transformed to the NAD 1983 UTM Zone 15N projected coordinate reference system (EPSG:26915) to support consistent spatial overlay and area calculations. The 30-m land-cover raster served as the reference grid for the land-cover change analysis. Where conversion or resampling of categorical spatial data was required, nearest-neighbor assignment was used to preserve the original categorical class values. Spatial datasets were aligned to a common cell origin, spatial extent, and grid configuration before the 2001 and 2024 land cover datasets were compared. These procedures minimized the possibility that apparent land cover transitions resulted from differences in coordinate reference systems, raster extents, grid alignments, or interpolation methods.
The SSURGO soil information was spatially integrated with the aligned land cover datasets, and a change raster was generated to identify areas that experienced land cover change between 2001 and 2024 using ArcGIS Pro 2.6 [36] (Figure 3). The resulting soil–land cover dataset was subsequently integrated with administrative boundaries [37] and used to derive land cover and soil change matrices for evaluating changes in soil security over time.
To evaluate soil security, particularly the soil capital dimension, soil carbon (C) estimates [38] and the social cost of carbon dioxide emissions (SC-CO2; $50 per metric ton CO2) [24] were incorporated into the analysis [25]. Soil C stocks were based on reported area-normalized contents (kg m−2) from Guo et al. (2006) [38]. The SC-CO2 monetary value is applicable to 2030 and is expressed in 2007 U.S. dollars using an average discount rate of 3% [27]. Although SC-CO2 is intended to provide a broad estimate of climate-related damages, it may underestimate the full costs associated with CO2 emissions because some climate impacts are not included in the estimate [27]. In the context of this study, soil capital represents the value of soil resources in terms of their capacity to provide ecosystem services, including climate-regulating services associated with soil C storage [4].

Source Data Accuracy and Uncertainty

The present study did not generate a new land cover classification or digital soil map; instead, it integrated established Annual NLCD and USDA-NRCS SSURGO products. However, independent USGS validation of Annual NLCD Collection 1.0 used 8360 reference plots and reported an average agreement of approximately 83% for land cover aggregated to Anderson Level I classes over 1985–2023 [26]. Therefore, uncertainty in the source datasets may propagate into the derived land cover change estimates and soil-security matrices through land cover classification error, positional and attribute uncertainty in soil mapping units, mixed pixels, boundary effects, rasterization or resampling, and differences in spatial representation between soil and land cover datasets [39]. These effects may be particularly important for small, fragmented, or transitional land cover classes. Accordingly, the results are interpreted primarily at landscape and regional scales rather than as exact field-scale measurements. Additional processing-related uncertainty was minimized by applying a common coordinate reference system and analysis grid, nearest-neighbor resampling for categorical data, and a consistent processing framework for the 2001 and 2024 datasets.

3. Results

The results of this study are organized using each of the five dimensions of soil security, with an emphasis on the soil-biosphere nexus.

3.1. Soil Capability in the State of Minnesota (MN), USA

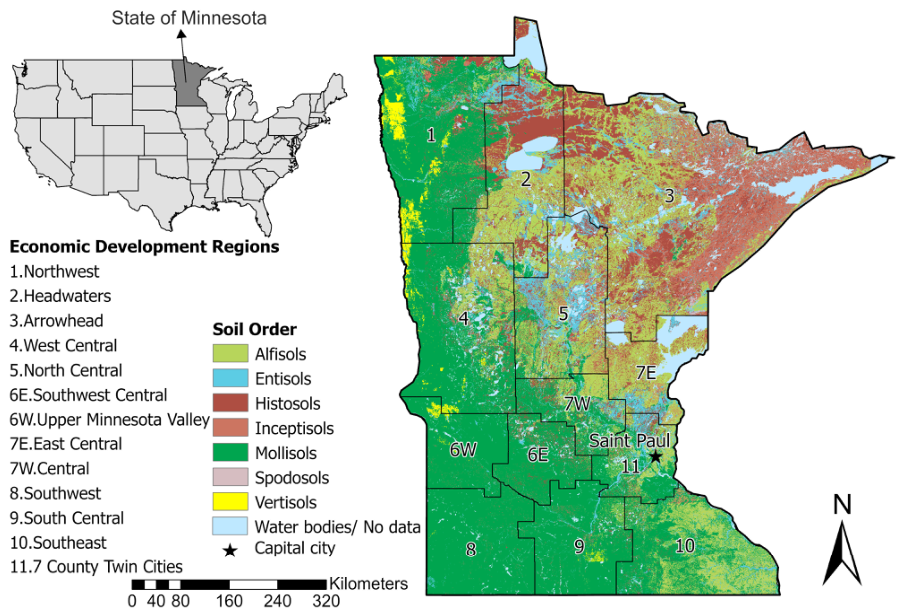
Soil capability refers to the inherent or reference soil properties, inherent soil quality, and potential of a particular soil type to provide ES [4]. There are seven soil orders in MN, grouped by the degree of soil development and weathering (Figure 4, Table 1), each with unique soil properties [40]. Slightly and strongly weathered soils are often considered low-quality for agriculture due to factors such as low nutrient content and high acidity [41]. The state of MN is dominated by moderately weathered soils, especially agriculturally important Alfisols (20%) and Mollisols (49%), with high inherent soil quality (Figure 4). These soils are found in areas that were once covered by Tallgrass Aspen Parkland, Deciduous Forest, and Prairie (grassland) biomes prior to European settlement (before the 1800s) and are now often cultivated for crops. These dramatic land conversions led to transformations of inherent soil properties due to soil erosion, which remains a persistent problem in the state despite the implementation of soil conservation efforts [42]. Historical peatland ditching resulted in significant C losses in MN [43].

3.2. Soil Condition in the State of Minnesota (MN), USA

3.2.1. Soil Degradation in the State of Minnesota (MN)

The present state of a particular soil, including how it has been altered or degraded from the reference state, is considered its current condition [44] or dynamic soil quality. For example, unlike inherent soil quality, which depends primarily on soil genesis, dynamic soil quality is highly sensitive to land use patterns and management regimes and can change over relatively short timescales [44]. In this study, we calculated anthropogenically degraded land as the sum of degraded land from agriculture (hay/pasture and cultivated crops), from development (developed, open space; developed, low intensity; developed, medium intensity; and developed, high intensity), and from barren land. Developed land is categorized into the following types: developed, open space; developed, high intensity; developed, medium intensity; and developed, low intensity. Agriculture includes the categories hay/pasture and cultivated crops. Potential areas for nature-based solutions (NBS) were restricted to the shrub/scrub, barren, and herbaceous land cover classes to identify candidate lands that would not conflict with existing land uses (Figure 5).
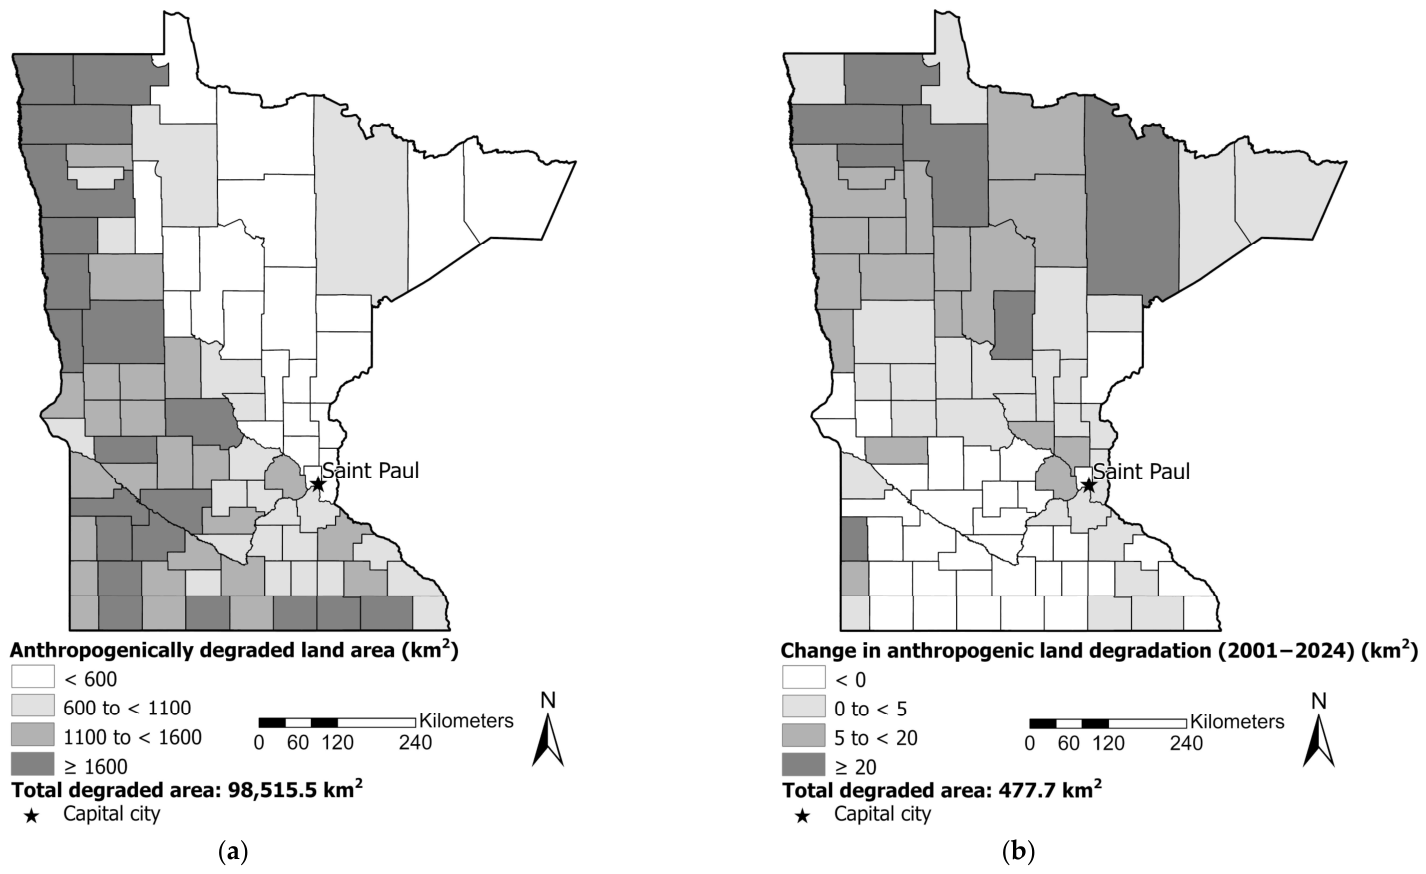
As of 2024, 58.2% of the state of MN experienced land degradation (LD) primarily from the large agricultural extent (Figure 5, Table 2 and Table 3), and the state has a negative balance between degraded land and land for potential nature-based solutions (NBS) based on the 2024 LULC configuration [45]. This negative balance indicates low levels of soil security in MN, as there is no potential land to compensate for LD. The state of MN cannot be considered land degradation neutral (LDN) based on an increase of +0.5% in overall anthropogenic LD and increases in the barren and developed LD types listed in Table 2. Different soil types exhibited different degrees of degradation in MN in 2024 (Table 2), which can be ranked from the highest to the lowest percent of degradation: Vertisols (97.2%), Mollisols (88.2%), Alfisols (44.2%), Entisols (30.2%), Inceptisols (18.7%), and Histosols (5.9%). Moderately weathered soils were the most degraded, followed by slightly weathered soils.
All soil orders exhibited increases in land development from 2001 to 2024 at the expense of shrub/scrub, mixed forest, herbaceous, evergreen forest, emergent herbaceous wetlands, and hay/pasture (Table 3). These temporal changes demonstrate a continuous trend in soil degradation (Table 4).
Land and soil degradation in MN were highly variable, as demonstrated by the spatial patterns in Figure 5. Past degradation mostly affected the Tallgrass Aspen Parkland, Deciduous Forest, and Prairie (grassland) biomes, whereas recent degradation affected the Coniferous Forest biome (Figure 6).

3.2.2. Soil Decarbonization and Loss of Soil Carbon (C) Sequestration Potential in the State of Minnesota (MN), USA

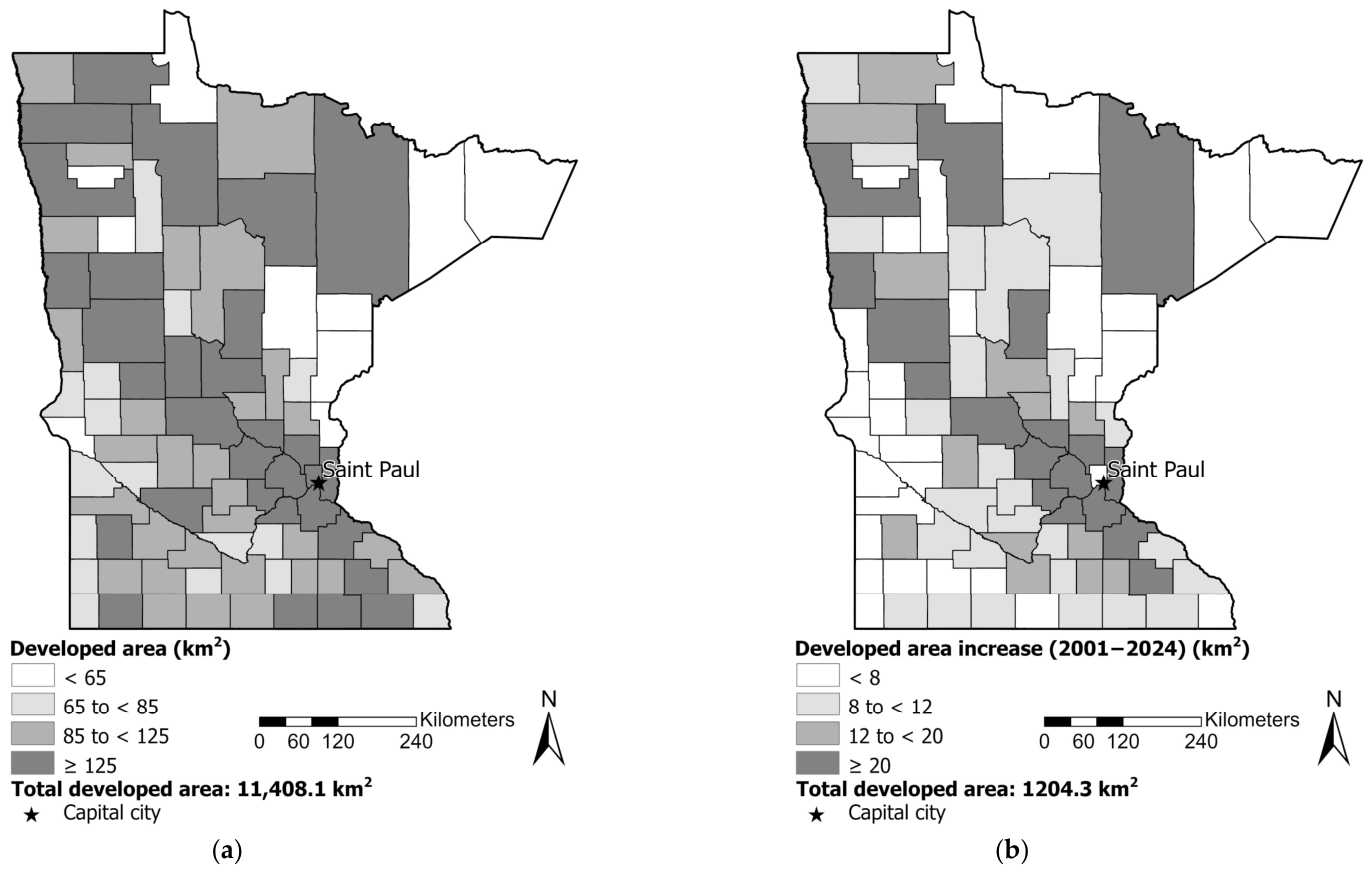
Developments in MN caused loss and damage (L&D) to regulating ES due to the loss of land for potential soil carbon (C) sequestration, with a total of 11,408.1 km2 of land area converted to development before and through 2024 (Figure 7a). The largest area losses from development were in counties adjacent to major urban areas in MN and North Dakota (ND): Hennepin (855.9 km2), St. Louis (542.8 km2), and Stearns (313.7 km2). Between 2001 and 2024, new developments resulted in a total of 1204.3 km2 of conversion. The largest area losses from development were also found in areas adjacent to major urban areas in MN and ND: Hennepin (67.5 km2), Stearns (50.3 km2), and Olmsted (44.8 km2) counties (Figure 7b). This analysis found that between 2001 and 2024, land development occurred primarily near already developed areas. Soils in MN have limited potential for C sequestration due to intensive agricultural use.
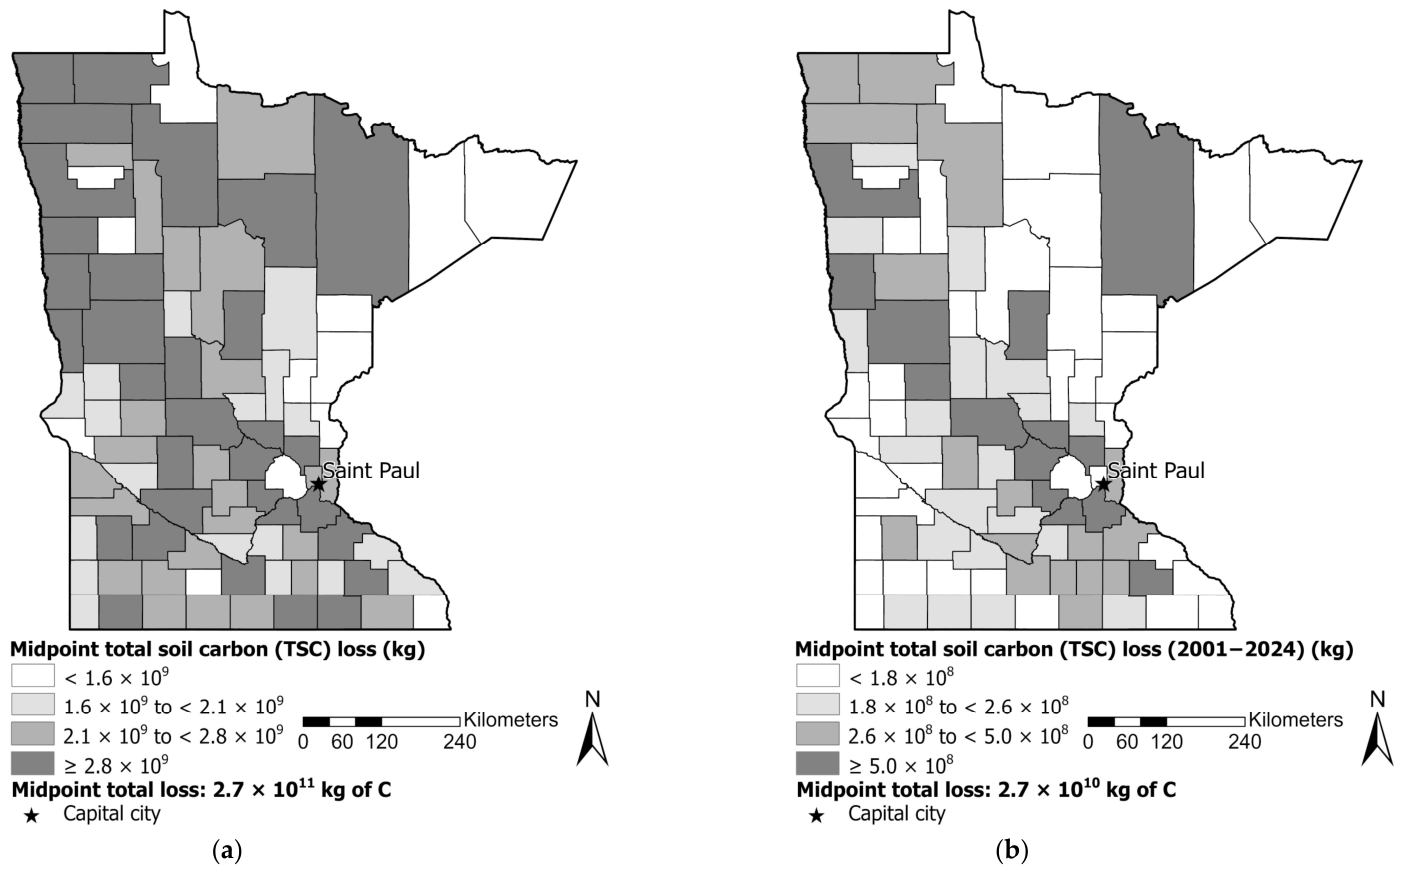
Soil degradation in MN was accompanied by soil decarbonization and removal of soil carbon sequestration potential from land conversions to developments, which continue to this day (Figure 7, Tables S3 and S4). Total soil carbon losses before and through 2024 resulted in an estimated midpoint total of 2.7 × 10¹¹ kg of C losses (Figure 8a). The highest soil C losses were found in Hennepin (2.0 × 10¹⁰ kg C), St. Louis (1.3 × 10¹⁰ kg C), and Stearns (8.8 × 10⁹ kg C) counties. New development activity between 2001 and 2024 caused a total of 2.7 × 10¹⁰ kg in C losses. The highest losses of soil C were found in Hennepin (1.6 × 10⁹ kg C), Stearns (1.3 × 10⁹ kg C), and Wright (9.4 × 10⁸ kg C) counties (Figure 8b).

3.3. Soil Capital of the State of Minnesota (MN), USA

Soil capital is the current value of soil resources expressed as their ability to provide ecosystem services that define the natural capital of soils [4]. Although soils provide numerous ecosystem services (ES), which can be valued using various methods, the soil security concept particularly emphasizes the role of soil C and its regulating ES, including climate regulation [4]. Therefore, Table 5 presents a summary of MN’s soil capital and its C valuation based on the concept of SC-CO2 [23,27]. Seven soil orders of MN contribute a midpoint total soil C of 6.1 × 10¹² kg C, with a midpoint value of $1.1T in “avoided” SC-CO2. It should be noted that these are the remaining values (as of 2024) after accounting for historic losses from land and soil degradation in MN.
Among the seven soil orders present in MN, the Histosols represent the “hotspot” for soil C storage (52% of midpoint total TSC storage) and midpoint SC-CO2 ($584.7B), despite covering only 13.2% of the state area (Table 5). This necessitates careful soil conservation and management in MN, because, unlike the more common mineral soils, Histosols are particularly vulnerable to drainage-induced microbial oxidation, subsidence, and irreversible SOC losses [47,48,49]. Given these vulnerabilities, Histosols represent a fragile soil resource that needs conservation [50]. Soil C valuation based on SC-CO2 can be interpreted as “avoided” SC-CO2 if soil C is sequestered in the soil or “realized” if soil C is released from the soil as greenhouse gas (GHG) contributing to climate change and associated damages. Soil C conservation represents numerous benefits to MN and the world. However, soil C release from soils in MN contributes to climate change damages worldwide. The SC-CO2 values are currently not accounted for in the market, therefore leading to an inefficient use of soil resources and environmental damage worldwide.
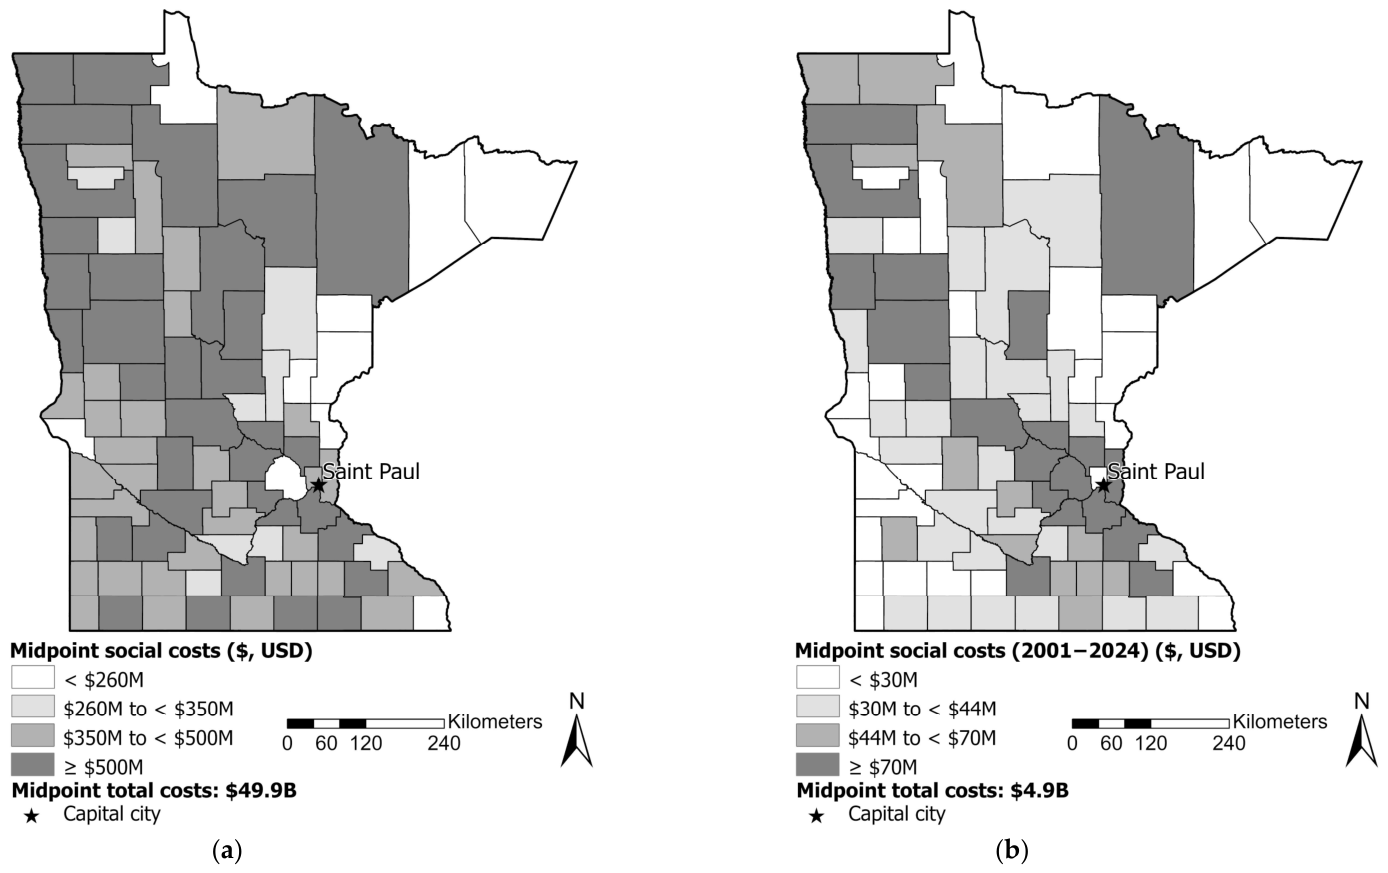
Soil capital is not static but dynamic, changing with LULC. For example, past developments (prior to and through 2024) generated $49.9B in “realized” social costs of soil carbon (C) (SC-CO2) (Figure 9a). The highest realized SC-CO2 was found in Hennepin ($3.7B), St. Louis ($2.5B), and Stearns ($1.6B) counties (Figure 9a). Recent developments (2001–2024) generated $4.9B in “realized” SC-CO2 (Figure 9b). The highest realized SC-CO2 was found in Hennepin ($295.9M), Sterns ($241.9M), and Wright ($172.4M) counties (Figure 9b). It should be noted that the SC-CO2 cost of C is a non-market, fixed value that can underestimate true damages associated with C loss [27].

3.4. Soil Connectivity in the State of Minnesota (MN), USA

Soil connectivity refers to the relationship between human soil management and the soil itself [4]. In this way, soil management can be optimized when the individuals responsible for the soil area possess the necessary knowledge and incentives to manage it properly [4]. Most of the land in MN is privately owned (76.5%) [51], with the remainder in state, federal, and other ownership, mostly concentrated in the Headwaters, Arrowhead, and North Central economic development regions [52] (Figure 4 and Figure S7). The state of MN has various organizations responsible for soil conservation (e.g., the Minnesota Natural Resources Conservation Service (NRCS), the Minnesota Association of Soil and Water Conservation Districts) and for soil science education (e.g., the University of Minnesota). The state selected the Minnesota State Soil, Lester (Fine-loamy, mixed, superactive, mesic Mollic Hapludalfs), for its fertile, agronomically important nature and its role in the state’s history and development [53]. While there are multiple soil connectivity supporting organizations, as noted, more than 80% of the MN population lives in urban areas and likely has limited connections and information about soil resources because they are not directly connected to agricultural activities, which often drive soil information (and the organizations that provide it) [54]. Furthermore, comparing past and recent urban developments using the economic development regions (Figure 4) reveals a recurring pattern of continuous development around urban areas, accompanied by associated total carbon losses and SC-CO2 damages (Tables S5–S7). Both historic and more recent development trends are concentrated in the 7 County Twin Cities economic development region, which generated the highest TSC losses and SC-CO2 damages (Tables S5–S7). This development reduces soil security and disconnects people from soil resources as urban areas grow. Similarly, the Southeast and West Central economic development regions had high levels of overall development across both historical and more recent timeframes. Development occurs regardless of damage to soil security because there are no economic consequences for GHG emissions or for reductions in soil ES when developments are built.

3.5. Soil Codification in the State of Minnesota (MN), USA

Codification of soils is the formulation of public policies and legal frameworks to safeguard soil resources [4]. Codification of soil security in MN includes multiple stakeholders, including individuals, municipalities, and the state. Private land ownership in MN is high, at 76.5% [51], which can complicate soil conservation efforts. Geospatial analysis in our study can help track the effectiveness of codification by evaluating changes in LD over time (Table 3), which show increases in LD, indicating decreasing soil security in the codification dimension. Future advancements in remote sensing technologies will likely enable tracking at the land-ownership level, allowing for the direct linking of laws or incentives to land over time. Minnesota currently has a range of pending legislation aimed at improving soil health, which could help strengthen the state’s soil security status. This includes setting soil-health farming goals and providing a range of grants to support soil-health improvements. The state of MN currently funds a “Soil Health Financial Assistance Grant” that provides cost-share for the purchase of equipment used to improve soil health (https://www.mda.state.mn.us/soil-health-grant) (accessed on 1 July 2026) [55]. The state also passed legislation that added soil health concepts to the soil and water conservation district policy (https://www.revisor.mn.gov/bills/bill.php?b=Senate&f=SF2904&ssn=0&y=2023) (accessed on 1 July 2026) [56].
Indeed, MN already has a program in place that sometimes provides support for soil security: the Conservation Stewardship Program [57]. The program is, in effect, a public-private partnership, and, as a private nonprofit corporation, it is substantially supported by taxpayers because donors can make tax-deductible contributions. The government, in effect, pays for a substantial part of the program because when the corporation receives a contribution, the government automatically receives less tax revenue. Economists call such reductions in tax revenue “tax expenditures” [58].
This program provides grants to private landowners who commit to preserving their land. Without specifically mentioning soil security, the program nonetheless seeks to achieve objectives identical to those of soil security. The program notes that it is critical to support practices on private lands that conserve land and native habitat to support biodiversity, and provide clean water and air, given the large proportion of private land ownership (70%) and increasing development pressures [57]. The program’s main focus is on conservation easements. Most often, the program provides benefits to private landowners who commit to refraining from developing their land. In other situations, landowners commit to restoring land that has been harmed to its natural, native state.
Likewise, the federal government provides grants to help farmers conserve land quality while strengthening their operations. The United States (US) Department of Agriculture’s Conservation Stewardship Program (CSP) for MN does not use the term soil security. However, in practice, its goals mirror those of soil security [59]. The goals of the CSP are to support the implementation of conservation practices that conserve natural resources in agricultural or forest operations, thereby providing benefits such as improved air and water quality for local communities [60]. Unfortunately, the program’s reach is limited. Of the MN farmers who apply for the program, 75% are rejected [60].
To increase the resources available to support MN farmers in maintaining and improving their soil health, a bill (HF 3293) was introduced in 2021 [56]. The comprehensive soil health bill would have provided funds to farmers in MN to increase soil-building and resilience practices, with the goal of achieving “Soil-Healthy Farming” statewide [56]. Under the bill (HR 3293), 50% of MN farmers would have achieved soil-healthy practices by 2030 and 100% by 2035 [56]. Under the definitions in the bill, “soil health” is similar to the common understanding of “soil security.” However, the bill has not yet passed; the program’s cost has deterred the necessary legislative support.

4. Discussion

4.1. Significance of the Results for Soil Security Worldwide

4.1.1. Benefits and Limitations of the Soil Security Concept

The main benefits of the soil security concept are its broad scope, multidimensionality, and integration of biophysical and socio-economic dimensions, which enable soils to be linked to wider global issues (e.g., climate change, food security) and interdisciplinary global initiatives (e.g., United Nations Sustainable Development Goals, etc.) [60]. The soil security concept is an active, soil-centric framework that aims to “reframe” the earlier derogatory reference to soil as “dirt” to elevate the status of soils as an “integrator” of Earth’s ecosystem functions, such as nutrient cycling [14]. For this reason, recent proposals suggest enhancing this framework into an integral soil security concept [14].
The main limitations of the soil security concept are the interpretation of the term “security” [58] and the lack of a clearly developed methodology for quantitatively and qualitatively assessing it worldwide [14], particularly in relation to global challenges (e.g., climate change). Assessing the biophysical aspects of soil security and its reference state [4] is particularly challenging due to the complex nature of soils, their functions, and the ecosystem services they provide. A recent study noted that the five dimensions of soil security are somewhat ambiguous regarding the functioning of the entire soil ecosystem [14].
Moreover, existing analyses of soil security can be conflicting due to the soil- and human-centric aspects of the soil security concept. For example, the reduction in soil-centric soil security (e.g., land degradation and C release from agriculture) can be viewed as an increase in human-centered soil security linked to food security. Our study presents examples of these conflicting aspects, in which the soil-centric soil security analysis suggests that it is harmful for states such as MN to create farmland by clear-cutting virgin forests (loss of biodiversity) and draining wetlands (reduction in water security). Doing so releases C and reduces C sequestration, thereby affecting climate change, while degrading soil and reducing soil capital. The logical conclusion of such analysis, if it is not always stated, is that creating farmland is not always beneficial to society, because soil-centric security would have been greater if the land had remained undisturbed.
However, such conclusions may be flawed because they consider only the benefits of maintaining soil-centric soil security (e.g., climate change mitigation) without considering its costs. Minnesota’s soil-centric soil security would have been maximized by prohibiting all farming and development for the last three centuries. However, such soil-centric security would have come at a great cost, severely limiting inhabitation and agricultural activities in the state.
Accordingly, the analysis of soil security should be modified to explicitly balance its benefits (e.g., climate change mitigation) against its costs, incorporating both soil-centric and human-centric aspects. Because people must use the land to thrive, the optimal level of soil- and human-centric soil security is not 100%. Soil security, in both its soil- and human-centric views, must be balanced. The costs of achieving soil security are substantial, whether they are the equipment or supplies needed to repair depleted soil or the opportunity cost of leaving the soil undisturbed rather than growing crops on it. The failure of MN’s soil health bill may indicate that the state legislature believed the cost of restoring the state’s soil outweighed the benefits.

4.1.2. Refining the Soil Security Concept
There has been some debate in the literature about the relevance of the concept of soil security [61]. Our study contributes to this debate by highlighting potential conflicts between soil- and human-centric aspects of soil security, particularly regarding the soil-biosphere nexus. By definition, agricultural activities provide provisioning ES while simultaneously disturbing the soil and contributing to LD and GHG emissions. Human development often permanently degrades the ecosystem services provided by soil, thereby threatening soil security.
Despite the contradictory nature of the currently formulated concept of soil security, it is an important concept because it attempts to bridge metrics related to soil-centric soil security (e.g., soil suitability, soil health, etc.) with concerns about human-centered soil security linked to food security, which are more broadly understood and discussed beyond the soil science and agronomic communities. For example, recent research [62] discussed broadening the concept of soil security to enhance familiarity and use among policymakers, as soil is the foundation of food production and ecological health and is linked to numerous ecosystem services that enable human existence. Soil security has the potential to help a broad range of policymakers codify soil protections that enhance sustainability.
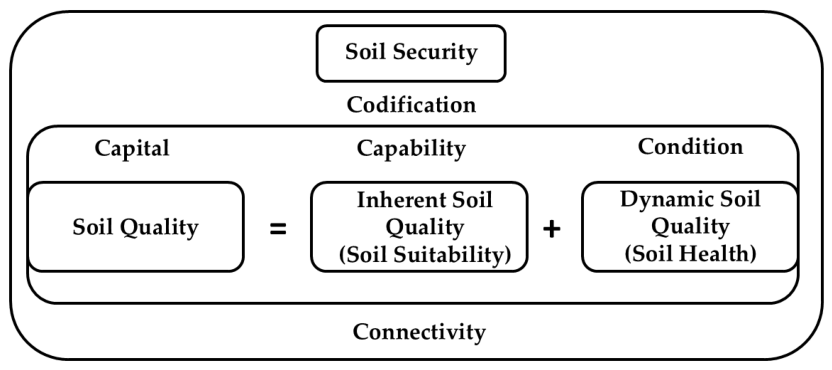
Figure 10 presents a framework for integrating soil quality with the concept of soil security. Soil quality and soil health can be evaluated at the landscape scale using geospatial analysis that combines land cover, land cover change, and soil spatial data [63,64]. Similarly, the key soil-centric soil security concepts mirror these soil metrics (Figure 10). Soil capital can be understood as dependent on soil quality, whereas soil capability is analogous to the soil’s inherent quality or suitability. The current condition of soil resources is equivalent to the soil’s health. Available geospatial data and tools offer opportunities to quantitatively and qualitatively assess soil security by leveraging existing concepts of soil quality, soil suitability, and soil health. The results of this type of analysis can serve as the foundation for decision-making on soil resources. Soil security depends on soil capability and condition. Soil types with inherently low soil quality tend to have low overall soil security due to their low-quality soil capital. The security of high-quality soil can be threatened by utilization (e.g., agriculture) due to the high market value of its capital, as demonstrated in MN. Tracking changes in LULC can identify areas of the landscape where these high-quality soils are under threat, or are potentially being improved, to inform changes in overall soil security over time.
Figure 10. The newly proposed integration of soil quality with the concept of soil security (adapted from [63]).
Biosphere 02 00010 g010
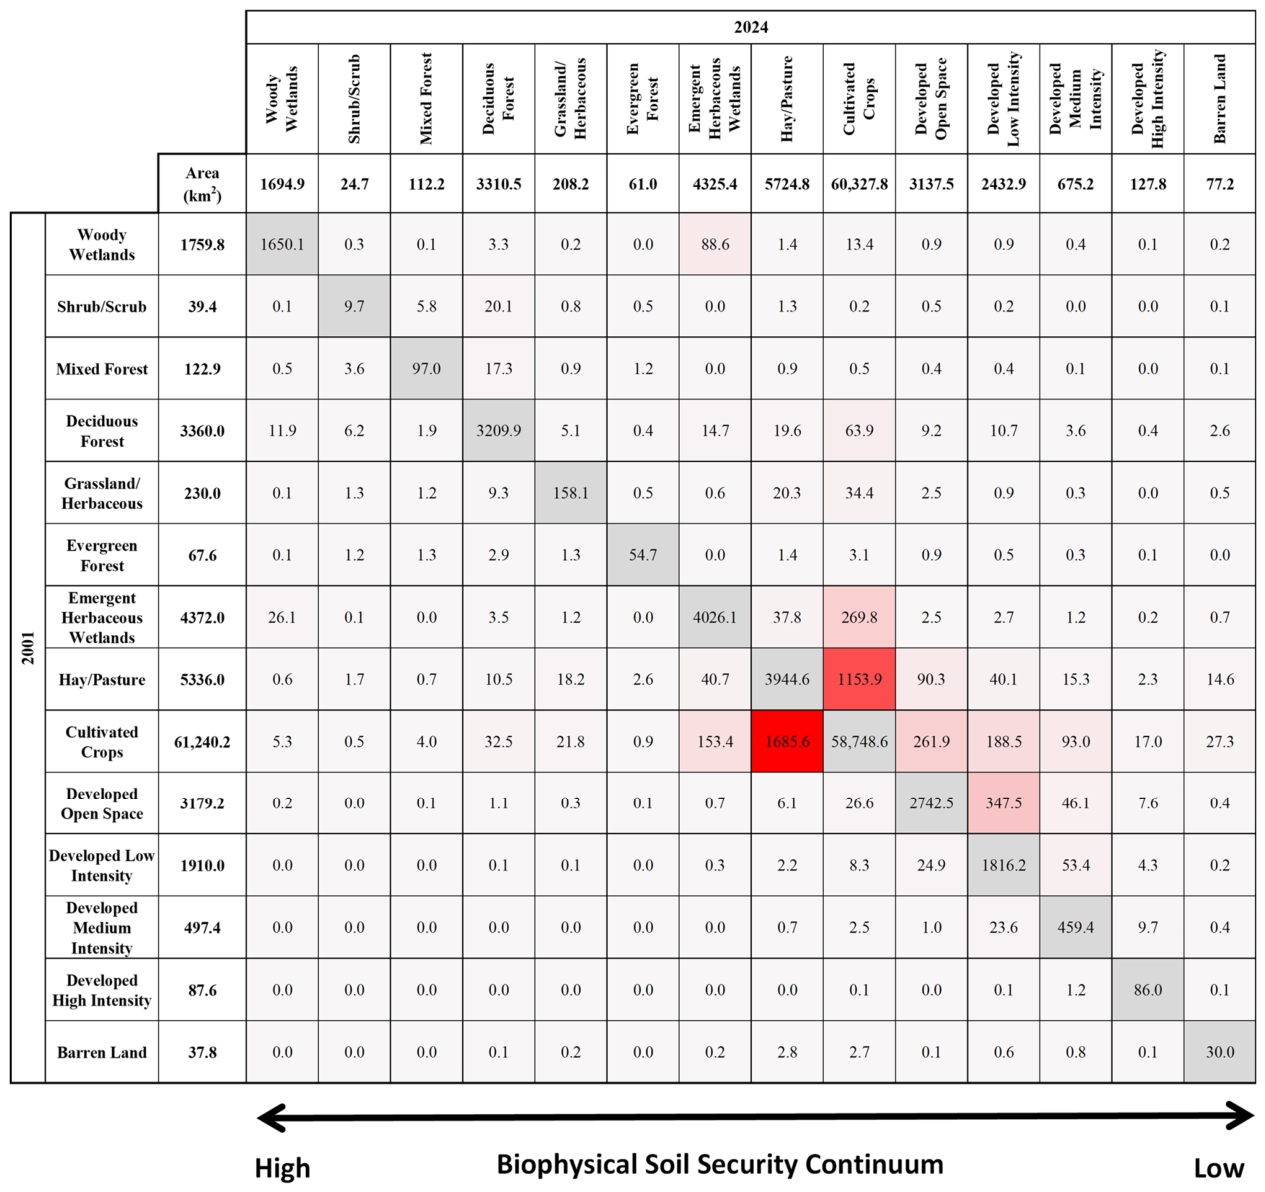
This study developed the concept of a biophysical soil security matrix, using a land cover change matrix [56], for each of the soil orders found in MN (Figure 11 shows the changes for Mollisols, while the other soil orders are shown in Figures S1–S6). These matrices, covering land conversions between 2001 and 2024, help visualize changes in soil-centric soil security over time. By calculating the extent and type of land cover change, it is possible to identify how this change has likely affected soil security and soil C emissions. Land cover classes can be used to understand the ES provided by soil. For example, cultivated crops and hay/pasture LULC categories are directly related to food security and linked to the provisioning ES provided by soil. Additionally, LULC categories often represent multiple aspects of human-centered soil security, as seen with wetlands, which can provide both water security and climate change mitigation benefits. The evaluation of LULC change over time identifies changes that affect soil security, with land conversion to human development causing irreversible damage to soil resources, including the release of soil C. Not all LULC changes lower soil security, as the LULC change analysis can be used to track the “maintenance and improvement” [5] requirement aspect of soil security.
The soil security/land cover change matrix for Mollisols, shown in Figure 11, can be interpreted as follows. Diagonal matrix entries (i.e., gray squares) indicate land cover that did not change from 2001 to 2024. Conversely, cell entries with areas shaded in red in the matrix indicate land cover categories that have changed from 2001 to 2024, with darker shades of red indicating larger area conversions in land cover types. For example, of the original 4372.0 km2 of emergent herbaceous wetlands in Mollisols in 2001, 4026.1 km2 remained in 2024. However, 269.8 km2 of the original emergent herbaceous wetlands were converted to cultivated crops, and 26.1 km2 were converted to woody wetlands by 2024. The total area of emergent herbaceous wetlands for Mollisols decreased only by about 1% (from 4372.0 to 4325.4 km2) over this time, with the loss of original land cover area being offset primarily by conversion gains from cultivated crops (153.4 km2) and woody wetlands (88.6 km2). The matrix in Figure 11 also shows that between 2001 and 2024, 560.4 km2 of cultivated crops and 148.0 km2 of hay/pasture were converted to developed areas for Mollisols. Interestingly, the matrix reveals that from 2001 to 2024, 1153.9 km2 of hay/pasture was converted to cultivated crops, while 1685.6 km2 was converted back to hay/pasture. The type of conversion that occurred either reduced or enhanced soil security and the availability of soil resources for sustainable ecosystem services, as indicated by the two-headed arrow at the bottom of the matrix. Therefore, the matrix also identifies any large areas that are restored to land covers with higher soil security. For example, for Mollisols in MN, almost none of the developed lands were restored, with mostly zero values across the undisturbed land classes (Figure 11; other soil orders shown in Figures S1–S6).
This matrix can also be created using relevant soil properties (e.g., soil C) or even SC-CO2 monetary values associated with land covers and conversions. Visualizing the biophysical soil security matrix by soil type (e.g., soil order) provides important additional information about the resource capacity of soils subject to land cover change, which varies widely by property and soil C content.
The transferability of the proposed biophysical soil security matrix also depends on the availability, spatial resolution, thematic detail, temporal consistency, and accuracy of the underlying geospatial datasets. Minnesota represents a relatively data-rich case because detailed SSURGO soil information and spatially consistent land cover products are available. The conceptual framework, however, is not restricted to Minnesota or to SSURGO-based analyses. In regions where comparable high-resolution soil databases are unavailable, the matrix could be constructed using nationally available, regional, or global soil datasets together with compatible land cover products [39]. In such applications, the spatial scale and level of thematic detail of the analysis should be adjusted to the resolution and reliability of the available datasets. Thus, the proposed framework is conceptually transferable across geographic regions, but the precision and spatial detail of its implementation are data-dependent.
Recent applications of the soil security concept have used different assessment methods depending on the study scale and the availability of soil information. One approach is an indicator-based framework for evaluating soil functions, soil services, and localized threats [65]. Another methodology uses spatially harmonized datasets, combined with participatory indicator weighting, to calculate regional soil security indices for agricultural regions of Mexico [66]. Additionally, in data-limited Pacific Island environments, spectral methods offer a viable solution for rapidly estimating key indicators of soil condition and soil capital [21]. The approach used in this study differs in that it organizes observed LULC changes by soil order and links these transitions to soil C stocks and SC-CO2 values. Therefore, the proposed matrix provides a spatially explicit assessment of capability, condition, and capital, while connectivity and codification are treated as contextual dimensions because they were not directly measured.
The application of soil security dimensions to the state of MN can help refine decision-making regarding soil security worldwide, as demonstrated by the following ratings for MN:
  • Dimension 1 (biophysical): Capability of dominant soils (Alfisols (20%) and Mollisols (49%); Figure 4) was rated as high in terms of soil security.
  • Dimension 2 (biophysical): Condition of the most capable MN soils is low as a result of anthropogenic land degradation, with the following degradation levels in 2024: Vertisols (97.2%), Mollisols (88.2%), Alfisols (44.2%), Entisols (30.3%), Inceptisols (18.7%), and Histosols (5.9%) (Table 3). Furthermore, much of the land degradation resulted in decarbonization, which continues to the present day.
  • Dimension 3 (biophysical and economic): Capital for MN soils is partially represented by the remaining midpoint soil storage and social cost of total soil carbon (TSC): 6.1 × 10¹² kg C, $1.1T in 2024. This capital continues to decline due to ongoing anthropogenic LD in the state, as documented by the anthropogenic LD trends in Table 3. Figure 8b and Figure 9b show the spatial patterns of soil capital decline by county in MN.
  • Dimension 4 (socio-economic): Connectivity is low in MN, given the fact that 80% of the population lives in urban areas [54] and is likely disconnected from agricultural production.
  • Dimension 5 (socio-economic): Codification of soil security in MN includes multiple stakeholders, including individuals, municipalities, and the state. Private land ownership in MN is high at 76.5% [51], which can complicate soil conservation efforts. Geospatial analysis in our study can help track the effectiveness of codification by evaluating changes in LD over time (Table 3), which shows increases in anthropogenic LD, indicating decreasing soil security in the codification dimension. There are efforts to improve soil health through legislative action [47], but it is unclear whether these efforts can truly address the massive scale of LD from agriculture and development.
  • The overall soil-centric soil security rating for MN is moving towards a low rating within the biophysical soil security continuum based on the analysis of the five dimensions of soil security. Furthermore, MN’s internal soil security rating is relevant to global climate change due to GHG emissions from soil degradation in the state.
The next logical question is what can be done to improve MN’s soil-centric soil security, with nature-based solutions (NBS) among the possible approaches to address soil-centric soil security loss [67]. Unfortunately, there is a negative balance between the area of LD and the potential area for NBS in MN, indicating a low level of soil-centric soil security in the state and further reducing the opportunity for mitigation. Similarly, 37 states in the contiguous USA have a negative balance, while the 11 states with a positive balance between areas of LD and potential NBS areas, such as Nevada, Arizona, and Utah, are dominated by inherently degraded soils [38]. Most states in the midwestern region exhibit high anthropogenic LD, indicating a corresponding low level of soil-centric soil security [38]. Improving the soil resources of productive agricultural land through NBS could enhance overall soil security; however, from a soil-centric perspective, it would reduce agricultural production, potentially affecting the human-centric assessment of soil security. It should be noted that soil security is being promoted as a global concept, and the state of MN highlights the complexity of taking the fragmented soil security of individual states or other administrative units into a unified global soil security system.
Figure 11. Newly proposed biophysical soil security matrix (layout based on [68]). An example is shown for the Mollisols soil order in Minnesota (MN), USA, where the matrix details land-cover conversions involving Mollisols between 2001 and 2024. The diagonal values (shaded in gray) indicate areas with no land cover change. The darkest red shades represent the largest changes to the area. The biophysical soil security continuum ranges from high (e.g., wetland and forest land covers) to low (e.g., developed areas). This land cover can change along with the biophysical soil security continuum in both directions, as land can be restored or converted to land cover types with high soil security. The term “biophysical soil security continuum” refers to the interconnectedness among the biophysical dimensions of soil security.
Biosphere 02 00010 g011

4.2. Significance of the Results in a Broader Context

Although there are currently no specific international soil security laws, various international initiatives recognize the significance of soil in addressing a wide range of global challenges, and our study provides relevant examples. The results of our study indicate that the concept of soil security and its applications should be further investigated before being adopted by the international community, particularly regarding the soil- and human-centric aspects of soil security as they relate to international initiatives. The examples below demonstrate the “conflicting” nature of soil security as it applies to global challenges, especially when providing food security comes at the expense of biodiversity and climate change mitigation. The UN Sustainable Development Goals (SDGs) [69], UN Convention on Biological Diversity [70], UN KunmingMontreal Global Biodiversity Framework [71], UN Convention to Combat Desertification [72,73], Revised World Soil Charter [74], and Ramsar Convention on Wetlands [75] all mention the importance of soils in several of their goals, which also related to the six global challenges for sustainable development (food security, energy security, water security, biodiversity protection, climate change mitigation, and the provision of ecosystem services):
  • Food Security: There was a decrease in cultivated crops (−1.5%) overall, and most of the seven soil orders between 2001 and 2024 in MN (Table 4). Hay/pasture also showed a decrease in some soil orders. Biophysical soil security matrices for individual soil orders showed that hay/pasture and cultivated crops were converted to developments in the following soil orders: Entisols, Inceptisols, Histosols, Alfisols, and Mollisols (Figure 11 and Figures S1–S4) (Applicable to UN SDG 2: Zero Hunger);
  • Provision of ecosystem services: Biophysical soil security matrices for the soil orders of Entisols, Inceptisols, Histosols, Alfisols, and Mollisols (Figure 11 and Figures S1–S4) demonstrate the conversion of C-sequestering and productive soils to developments, which most likely results in the reduction of the provision of ecosystem services by these soils (Relevant for UN SDG 12: Responsible Consumption and Production);
  • Climate change mitigation: The state of MN currently does not have any climate change plans (https://www.georgetownclimate.org/adaptation/plans.html (accessed on 18 April 2026) [76]. Economic activity in MN has driven both past and current land conversions, resulting in GHG emissions and monetary social cost of CO2 (SC-CO2) values. Additionally, developments now include areas isolated from the atmosphere and excluded from future C sequestration capacity in MN. Up to 2024, MN experienced a loss of 11,408.1 km2 to development, with a total soil carbon (TSC) midpoint loss of 2.7 × 10¹¹ and an associated midpoint estimated value of $49.9B (where B = billion = 109, USD) in SC-CO2 (Table S6). Recent land developments (1204.3 km2) from 2001 to 2024 likely resulted in a midpoint loss of 2.7 × 10¹⁰ kg of TSC, corresponding to a midpoint of $4.9B in SC-CO2 (Table S6). There is very little land (1.0% of total land area) available for nature-based C sequestration (Table 3) (Addressing UN SDG 13: Climate Action);
  • Biodiversity protection: Almost 58% of MN land has been subject to anthropogenic LD primarily because of agriculture (88% of total anthropogenic LD) up to and including 2024. Varying degrees of anthropogenic LD were seen in all seven soil orders: Vertisols (97.2%), Mollisols (88.2%), Alfisols (44.2%), Entisols (30.2%), Inceptisols (18.7%), and Histosols (5.9%). Data from more recent years (2001–2024) showed a +0.5% increase in anthropogenic LD and a +11.8% increase in LD from developments in the state, which were not offset by land potentially available for NBS (Table 3). There were decreases in the total areas of shrub/scrub (−28.9%), mixed forest (−8.3%), herbaceous (−42.8%), evergreen forests (−5.6%), woody wetlands (−1.9%), and cultivated crops (−1.5%) (Table 3). (Addressing UN SDG 15: Life on Land; UN Convention to Combat Desertification; UN Convention on Biological Diversity; UN Kunming-Montreal Global Biodiversity Framework; The Revised World Soil Charter);
  • Water Security: Our study leverages satellite-based land cover change detection, combined with spatial soil databases, to identify changes in LULC related to wetlands (e.g., emergent herbaceous wetlands) and related soil types (e.g., Histosols) in MN. As noted in Section 3.3, Histosols account for only 13% of soils in MN, but they are a significant repository (“hotspot”) of SOC (66% of MN’s total SOC) and TSC (52% of MN’s total TSC) (Table 5). When wetlands are drained and/or converted to other LULC types, Histosols undergo hydromorphological changes, including the loss of reducing conditions, changes in redoximorphic features, microbial oxidation of SOC, and subsidence [47,48,49]. In 2001, the total area of wetlands in MN was 41,108.4 km2. Of this total wetland area, 70% were woody wetlands (28,627.6 km2) while 30% were emergent herbaceous wetlands (12,480.8 km2). By 2024, the total wetland area had decreased slightly to 41,015.8 km2, an overall loss of about 0.2%. Woody wetlands (68%, 28,083.5 km2) remained the dominant wetland type in 2024, although the relative amount of emergent herbaceous wetlands did increase slightly by 2024 (32%, 12,932.3 km2). Despite the apparent relative stability in total wetlands, woody wetlands, and emergent herbaceous wetlands from 2001 to 2024, an in-depth examination of land cover/land use changes reveals a more nuanced story (Table S8). A portion of these wetlands (29.8 km2) was converted to developments, which resulted in 4.2 × 10⁹ kg midpoint TSC loss and corresponding midpoint SC-CO2 in the amount of $778.7M USD, estimated based on soil C content of the soil order of Histosols (Tables S2 and S8). (Relevant to Ramsar Convention on Wetlands).

5. Conclusions

This study developed a biophysical soil security matrix that combines soil order, LULC change from 2001 to 2024, and soil C valuation to evaluate changes in capability, condition, and capital. As part of this assessment, geospatial analysis conducted in this study quantified soil security degradation and C loss in the state of MN (USA) between 2001 and 2024, as documented through analyses of “biophysical soil security matrices” and the state’s five dimensions of soil security. These matrices provide a spatial and temporal approach to identifying where land conversion has reduced soil-centric soil security. Application of the matrix to MN showed that soils with high inherent capability can have low current soil security conditions. Soil security degradation follows the historic trend of land conversions in MN, in which soils with higher soil security status were converted to LULC with lower soil security status. This pattern mirrors the overall history of land development in MN, where highly productive prairie soils (Alfisols and Mollisols) were subject to LD through conversion to agricultural uses. The resulting decline in soil security represents losses and damages from GHG emissions that should be identified and quantified to improve soil security and climate impacts through actions that advance the status within the biophysical soil security continuum. For example, the biophysical soil security continuum for MN is currently lower for the critical soil types with high LD, Mollisols (88.2%), and Alfisols (44.2%), due to development and widespread agriculture. It is essential to note that both past and recent developments that have contributed to reduced soil security are closely linked to the state’s overall economic development.
This study revealed inconsistencies in the interpretation of soil security. While land cover change and soil management are reducing soil-centric soil security while increasing climate change impacts on an ongoing basis, they can be viewed as a means of maintaining increased human-centered soil security by providing food security through ecosystem services supplied by soil. This paper proposed new techniques to evaluate and monitor soil-centric soil security, including C loss, which affects the climate across multiple spatial scales, by leveraging remote sensing data products and spatial soil data. The proposed framework is scalable across local, regional, and national applications where compatible soil and land cover information is available; however, the spatial detail, reliability, and interpretation of the resulting soil-security assessment depend on the resolution, accuracy, and temporal consistency of the underlying geospatial datasets. Future advances in remote sensing will enable the monitoring of various land use activities and even direct GHG emissions, thereby better quantifying the impact of management decisions on soil and climate security (e.g., agricultural crops and management techniques within agricultural production). These new technologies may allow ongoing comparison between soil- and human-centric aspects of soil security. It is necessary to monitor soil health across various scales to gain insights into overall soil resources and the human activities that can improve or harm soil security. Providing quantitative data on the status and trajectory of soil-centric soil security across multiple scales, from the field to the global level, could help policymakers and stakeholders improve practices to slow or reverse the ongoing decline in soil-centric soil security and mitigate climate change worldwide over time.

Supplementary Materials

The following supporting information can be downloaded at: https://www.mdpi.com/article/10.3390/biosphere2030010/s1, Figure S1: Biophysical soil security matrix (matrix layout was adapted from [68]) for the soil order of Entisols in Minnesota (MN) (USA), where the matrix details the conversions of land cover with Entisols between 2001 and 2024; Figure S2: Biophysical soil security matrix (matrix layout was adapted from [68]) for the soil order of Inceptisols in Minnesota (MN) (USA), where the matrix details the conversions of land cover with Inceptisols between 2001 and 2024; Figure S3: Biophysical soil security matrix (matrix layout was adapted from [68]) for the soil order of Histosols in Minnesota (MN) (USA), where the matrix details the conversions of land cover with Histosols between 2001 and 2024; Figure S4: Biophysical soil security matrix (matrix layout was adapted from [68]) for the soil order of Alfisols in Minnesota (MN) (USA), where the matrix details the conversions of land cover with Alfisols between 2001 and 2024; Figure S5: Biophysical soil security matrix (matrix layout was adapted from [68]) for the soil order of Vertisols in Minnesota (MN) (USA), where the matrix details the conversions of land cover with Vertisols between 2001 and 2024; Figure S6: Biophysical soil security matrix (matrix layout was adapted from [68]) for the soil order of Spodosols in Minnesota (MN) (USA), where the matrix details the conversions of land cover with Spodosols between 2001 and 2024; Figure S7: Proportion of state-owned land (%) by county in the state of Minnesota (MN) (USA) (43°30′ N to 49°23′ N; 89°29′ W to 97°14′ W) (adapted from [52]); Table S1: Biomes present before European settlement (before the 1800s) in the current boundaries of the state of Minnesota (MN) (USA) and changes in land use/land cover (LULC) of potential natural vegetation (adapted from [31] and [32]); Table S2: Area-normalized content (kg m−2) and monetary values ($ m−2) of soil organic carbon (SOC), soil inorganic carbon (SIC), and total soil carbon (TSC = SOC + SIC) by soil order using data developed by [38] for the upper 2 m of soil and an avoided social cost of carbon (SC-CO2) of $50 per metric ton of CO2, applicable for 2030 (2007 U.S. dollars with an average discount rate of 3% [27]); Table S3: Land conversion to developments, and its minimum negative impacts on soil security including ecosystem functions and services (e.g., regulating), by soil order for the state of Minnesota (MN) in the contiguous United States of America (USA) prior to and through 2024 and recent changes (2001–2024); Table S4: Land conversion to developments, and its maximum negative impacts on soil security including ecosystem functions and services (e.g., regulating), by soil order for the state of Minnesota (MN) in the contiguous United States of America (USA) prior to and through 2024 and recent changes (2001–2024); Table S5: Land conversion to developments, and its minimum negative impacts on soil security including ecosystem functions and services (e.g., regulating), by economic development region for the state of Minnesota (MN) in the contiguous United States of America (USA) prior to and through 2024 and recent changes (2001–2024); Table S6: Land conversion to developments, and its midpoint negative impacts on soil security, including ecosystem functions and services (e.g., regulating), by economic development region for the state of Minnesota (MN) in the contiguous United States of America (USA) prior to and through 2024 and recent changes (2001–2024); Table S7: Land conversion to developments, and its maximum negative impacts on soil security including ecosystem functions and services (e.g., regulating), by economic development region for the state of Minnesota (MN) in the contiguous United States of America (USA) prior to and through 2024 and recent changes (2001–2024); Table S8: Monitoring of wise use of wetlands for the Ramsar Convention using land use/land cover (LULC) change matrix for the state of Minnesota (MN) in the United States of America (USA) over the time period 2001 to 2024. Positive values indicate a net loss in the area of a wetland category.

Author Contributions

Conceptualization, E.A.M.; methodology, E.A.M., M.A.S. and H.A.Z.; formal analysis, E.A.M.; writing—original draft preparation, E.A.M., G.C.P. and P.C.-D.; writing—review and editing, E.A.M., C.J.P., G.B.S. and M.A.S.; visualization, H.A.Z., L.L. and Z.H. All authors have read and agreed to the published version of the manuscript.

Funding

This research received no external funding.

Institutional Review Board Statement

Not applicable.

Informed Consent Statement

Not applicable.

Data Availability Statement

The authors confirm that the data supporting the findings of this study are available within the article and its Supplementary Materials.

Acknowledgments

We would like to thank the reviewers for their constructive comments and suggestions.

Conflicts of Interest

The authors declare no conflicts of interest.

Abbreviations

The following abbreviations are used in this manuscript:
CCarbon
CO2Carbon dioxide
ESEcosystem services
EPAEnvironmental Protection Agency
GBFKunming–Montreal Global Biodiversity Framework
GHGGreenhouse gases
LDLand degradation
L&DLoss and damage
LULCLand use/land cover
MNMinnesota
NBSNature-based solutions
NDNorth Dakota
NLCDNational Land Cover Database
NRCSNatural Resources Conservation Service
SC-CO2Social cost of carbon emissions
SDGsSustainable Development Goals
SOCSoil organic carbon
SICSoil inorganic carbon
SSURGOSoil Survey Geographic Database
STATSGOState Soil Geographic Database
TSCTotal soil carbon
UNUnited Nations
UNCCDUnited Nations Convention to Combat Desertification
USAUnited States of America
USDUnited States dollar
USDAUnited States Department of Agriculture

References

  1. Jenny, H. Factors of Soil Formation; McGraw Hill: New York, NY, USA, 1941. [Google Scholar]
  2. Adhikari, K.; Hartemink, A.E. Linking soils to ecosystem services—A global review. Geoderma 2016, 262, 101–111. [Google Scholar] [CrossRef] [Scilit]
  3. Montanarella, L.; Pennock, D.J.; McKenzie, N.; Badraoui, M.; Chude, V.; Baptista, I.; Mamo, T.; Yemefack, M.; Singh Aulakh, M.; Yagi, K.; et al. World’s soils are under threat. Soil 2016, 2, 79–82. [Google Scholar] [CrossRef] [Scilit]
  4. McBratney, A.; Field, D.J.; Koch, A. The dimensions of soil security. Geoderma 2014, 213, 203–213. [Google Scholar] [CrossRef] [Scilit]
  5. McBratney, A.B.; Minasny, B.; Wheeler, I.; Malone, B.P. Frameworks for digital soil assessment. In Digital Soil Assessment and Beyond; Minasny, B., Malone, B.P., McBratney, A.B., Eds.; Taylor & Francis Group: London, UK, 2012; pp. 9–14. [Google Scholar]
  6. Field, D.J. Soil security: Dimensions. In Global Soil Security; Field, D.J., Morgan, C.L., McBratney, A.B., Eds.; Springer International Publishing: Berlin/Heidelberg, Germany, 2017; pp. 15–23. [Google Scholar]
  7. Murphy, B.; Fogarty, P. Application of the soil security concept to two contrasting soil landscape systems—Implications for soil capability and sustainable land management. Sustainability 2019, 11, 5706. [Google Scholar] [CrossRef] [Scilit]
  8. Bouma, J.; McBratney, A. Framing soils as an actor when dealing with wicked environmental problems. Geoderma 2013, 200, 130–139. [Google Scholar] [CrossRef] [Scilit]
  9. Bünemann, E.K.; Bongiorno, G.; Bai, Z.; Creamer, R.E.; De Deyn, G.; De Goede, R.; Fleskens, L.; Geissen, V.; Kuyper, T.W.; Mäder, P.; et al. Soil quality–A critical review. Soil Biol. Biochem. 2018, 120, 105–125. [Google Scholar] [CrossRef] [Scilit]
  10. Lehmann, J.; Bossio, D.A.; Kögel-Knabner, I.; Rillig, M.C. The concept and future prospects of soil health. Nat. Rev. Earth Environ. 2020, 1, 544–553. [Google Scholar] [CrossRef] [Scilit] [PubMed]
  11. Howard, T.M.; Lawson, A. Soil governance: Accessing cross-disciplinary perspectives. Int. J. Rural. Law Policy 2015, 1, 98–105. [Google Scholar] [CrossRef] [Scilit]
  12. Fox, S.J. Soil governance and private property. Utah Law Rev. 2024, 1, 1–56. [Google Scholar] [CrossRef] [Scilit]
  13. Bartkowski, B.; Bartke, S.; Helming, K.; Paul, C.; Techen, A.K.; Hansjürgens, B. Potential of the economic valuation of soil-based ecosystem services to inform sustainable soil management and policy. PeerJ 2020, 8, e8749. [Google Scholar] [CrossRef] [Scilit] [PubMed]
  14. Mizuta, K.; Grunwald, S. Reshaping how we think about soil security. Soil Syst. 2022, 6, 74. [Google Scholar] [CrossRef] [Scilit]
  15. Warkentin, B.P. Beyond stewardship from conservation to intrinsic soil value. In Proceedings of the 17th World Congress of Soil Science, Bangkok, Thailand, 14–21 August 2002. [Google Scholar]
  16. Widyatmanti, W.; Umarhadi, D.A. Spatial modeling of soil security in agricultural land of Central Java, Indonesia: A preliminary study on capability, condition, and capital dimensions. Soil Secur. 2022, 8, 100070. [Google Scholar] [CrossRef] [Scilit]
  17. Kidd, D.; Field, D.; McBratney, A.; Webb, M. A preliminary spatial quantification of the soil security dimensions for Tasmania. Geoderma 2018, 322, 184–200. [Google Scholar] [CrossRef] [Scilit]
  18. Arrouays, D.; Mulder, V.L.; Richer-de-Forges, A.C. Soil mapping, digital soil mapping and soil monitoring over large areas and the dimensions of soil security–A review. Soil Secur. 2021, 5, 100018. [Google Scholar] [CrossRef] [Scilit]
  19. Yang, R.-M.; Minasny, B.; Ma, Y.-X.; Field, D.; McBratney, A.; Wu, C.-F. A preliminary soil security assessment of agricultural land in middle-eastern China. Soil Use Manag. 2018, 34, 584–596. [Google Scholar] [CrossRef] [Scilit]
  20. Montanarella, L.; Panagos, P. Soil security for the European Union. Soil Secur. 2021, 4, 100009. [Google Scholar] [CrossRef] [Scilit]
  21. Moloney, J.P.; Ma, Y.; Stockmann, U.; Manu, V.; Minoneti, V.; Hui, S.; Halavatau, S.; Patolo, S.; Tukia, T.; Foliaki, S.; et al. Rapid soil attribute evaluation for soil security assessments in data-poor environments in the Pacific region. Soil Secur. 2024, 16, 100161. [Google Scholar] [CrossRef] [Scilit]
  22. Shiferaw, H.; Alamirew, T.; Kassawmar, T.; Zeleke, G. Evaluating ecosystems services values due to land use transformation in the Gojeb watershed, Southwest Ethiopia. Environ. Syst. Res. 2021, 10, 22. [Google Scholar] [CrossRef] [Scilit]
  23. Wu, Y.; Liu, X.; Zhao, Q.; Liu, H.; Qu, F.; Zhang, M. Impact of land use/land cover change on ecosystem service trade-offs/synergies—A case study of Gangu County, China. Sustainability 2024, 16, 5929. [Google Scholar] [CrossRef] [Scilit]
  24. Asante-Yeboah, E.; Koo, H.; Ros-Tonen, M.A.; Sieber, S.; Fürst, C. Participatory and spatially explicit assessment to envision the future of land-use/land-cover change scenarios on selected ecosystem services in Southwestern Ghana. Environ. Manag. 2024, 74, 94–113. [Google Scholar] [CrossRef] [Scilit] [PubMed]
  25. Mikhailova, E.A.; Zurqani, H.A.; Lin, L.; Hao, Z.; Post, C.J.; Schlautman, M.A.; Shepherd, G.B. Opportunities for monitoring soil and land development to support United Nations (UN) Sustainable Development Goals (SDGs): A Case study of the United States of America (USA). Land 2023, 12, 1853. [Google Scholar] [CrossRef] [Scilit]
  26. Multi-Resolution Land Characteristics Consortium—MRLC. Available online: https://www.mrlc.gov/ (accessed on 15 April 2025).
  27. EPA—United States Environmental Protection Agency. The Social Cost of Carbon. EPA Fact Sheet. 2016. Available online: https://19january2017snapshot.epa.gov/climatechange/social-cost-carbon_.html (accessed on 15 April 2026).
  28. PRISM Climate Group, Oregon State University. Available online: https://prism.oregonstate.edu (accessed on 15 April 2026).
  29. Soil Survey Staff, Natural Resources Conservation Service, United States Department of Agriculture. Soil Survey Geographic (SSURGO) Database. Available online: https://nrcs.app.box.com/v/soils (accessed on 15 April 2026).
  30. Li, X.; Tian, H.; Lu, C.; Pan, S. Four-century history of land transformation by humans in the United States (1630–2020): Annual and 1 km grid data for the HIStory of LAND changes (HISLAND-US). Earth Syst. Sci. Data 2023, 15, 1005–1035. [Google Scholar] [CrossRef] [Scilit]
  31. Tester, J.R. Minnesota’s Natural Heritage: An Ecological Perspective; University of Minnesota Press: Minneapolis, MN, USA, 1995. [Google Scholar]
  32. Minnesota Department of Natural Resources. All About Minnesota’s Forests and Trees: A Primer. 2008. Available online: https://www.dnr.state.mn.us/forestry/education/primer/index.html (accessed on 11 April 2026).
  33. Mikhailova, E.A.; Zurqani, H.A.; Lin, L.; Hao, Z.; Post, C.J.; Schlautman, M.A.; Post, G.C.; Highberger, G.A.; Shepherd, G.B. The role of soil diversity (pedodiversity) in the Kunming Montreal Global Biodiversity Framework: Example of the contiguous United States of America (USA). Biosphere 2025, 1, 3. [Google Scholar] [CrossRef] [Scilit]
  34. Dahl, T.E. Wetland Losses in the United States 1780’s to 1980’s. U.S. Department of Interior FWS. 1990. Available online: https://www.fws.gov/sites/default/files/documents/Wetlands-Losses-in-the-United-States-1780s-to-1980s.pdf (accessed on 5 April 2026).
  35. Mikhailova, E.A.; Zurqani, H.A.; Lin, L.; Hao, Z.; Post, C.J.; Schlautman, M.A.; Post, G.C.; Brown, C.E.; Shepherd, G.B. Monitoring wise use of wetlands during land conversion for the Ramsar Convention on wetlands: A Case study of the contiguous United States of America (USA). Biosphere 2025, 1, 2. [Google Scholar] [CrossRef] [Scilit]
  36. ESRI (Environmental Systems Research Institute). ArcGIS Pro 2.6. Available online: https://pro.arcgis.com/en/pro-app/2.6/get-started/whats-new-in-arcgis-pro.htm (accessed on 15 April 2026).
  37. The United States Census Bureau. TIGER/Line Boundary Shapefiles. 2018. Available online: https://www.census.gov/geographies/mapping-files/time-series/geo/tiger-line-file.2018.html (accessed on 15 April 2026).
  38. Guo, Y.; Amundson, R.; Gong, P.; Yu, Q. Quantity and spatial variability of soil carbon in the conterminous United States. Soil Sci. Soc. Am. J. 2006, 70, 590–600. [Google Scholar] [CrossRef] [Scilit]
  39. Xu, P.; Tsendbazar, N.E.; Herold, M.; De Bruin, S.; Koopmans, M.; Birch, T.; Carter, S.; Fritz, S.; Lesiv, M.; Mazur, E.; et al. Comparative validation of recent 10 m-resolution global land cover maps. Remote Sens. Environ. 2024, 311, 114316. [Google Scholar] [CrossRef] [Scilit]
  40. Anderson, J.L.; Grigal, D.F.; Cooper, T. Soils and Landscapes of Minnesota; Minnesota Extension Service, University of Minnesota: St. Paul, MN, USA, 1984. Available online: https://hdl.handle.net/11299/211988 (accessed on 15 April 2026).
  41. Brady, N.C.; Weil, R.R. The Nature and Properties of Soils, 13th ed.; Pearson Education: London, UK, 2002. [Google Scholar]
  42. Thaler, E.A.; Kwang, J.S.; Quirk, B.J.; Quarrier, C.L.; Larsen, I.J. Rates of historical anthropogenic soil erosion in the midwestern United States. Earth’s Future 2022, 10, e2021EF002396. [Google Scholar] [CrossRef] [Scilit]
  43. Krause, L.; McCullough, K.J.; Kane, E.S.; Kolka, R.K.; Chimner, R.A.; Lilleskov, E.A. Impacts of historical ditching on peat volume and carbon in northern Minnesota USA peatlands. J. Environ. Manag. 2021, 296, 113090. [Google Scholar] [CrossRef] [Scilit] [PubMed]
  44. Lal, R. Soil health and carbon management. Food Energy Secur. 2016, 5, 212–222. [Google Scholar] [CrossRef] [Scilit]
  45. Mikhailova, E.A.; Zurqani, H.A.; Lin, L.; Hao, Z.; Post, C.J.; Schlautman, M.A.; Post, G.C.; Landis, L.N.; Roberts, L.C.; Shepherd, G.B. Assessing potential land and soil for nature-based solutions (NBS) for United Nations (UN) initiatives: An example of the contiguous United States of America (USA). Earth 2025, 6, 17. [Google Scholar] [CrossRef] [Scilit]
  46. Soil Survey Staff. Keys to Soil Taxonomy, 13th ed.; U.S. Department of Agriculture, Natural Resources Conservation Service: Washington, DC, USA, 2022. Available online: https://www.nrcs.usda.gov/resources/guides-and-instructions/keys-to-soil-taxonomy (accessed on 15 April 2026).
  47. Leifeld, J.; Menichetti, L. The underappreciated potential of peatlands in global climate change mitigation strategies. Nat. Commun. 2018, 9, 1071. [Google Scholar] [CrossRef] [Scilit] [PubMed]
  48. Tiemeyer, B.; Freibauer, A.; Borraz, E.A.; Augustin, J.; Bechtold, M.; Beetz, S.; Beyer, C.; Ebli, M.; Eickenscheidt, T.; Fiedler, S.; et al. A new methodology for organic soils in national greenhouse gas inventories: Data synthesis, derivation and application. Ecol. Indic. 2020, 109, 105838. [Google Scholar] [CrossRef] [Scilit]
  49. Evans, C.D.; Peacock, M.; Baird, A.J.; Artz, R.R.E.; Burden, A.; Callaghan, N.; Chapman, P.J.; Cooper, H.M.; Coyle, M.; Craig, E.; et al. Overriding water table control on managed peatland greenhouse gas emissions. Nature 2021, 593, 548–552. [Google Scholar] [CrossRef] [Scilit] [PubMed]
  50. Clunes, J.; Valle, S.; Dörner, J.; Martínez, O.; Pinochet, D.; Zúñiga, F.; Blum, W.E. Soil fragility: A concept to ensure a sustainable use of soils. Ecol. Indic. 2022, 139, 108969. [Google Scholar] [CrossRef] [Scilit]
  51. U.S. Bureau of the Census. Statistical Abstract of the United States: 1991; U.S. Bureau of the Census: Washington, DC, USA, 1991; p. 201. Available online: https://www.census.gov/library/publications/1991/compendia/statab/111ed.html (accessed on 15 April 2026).
  52. Helland, J. State-Owned Land in Minnesota. House Research. Short Subjects. 2002. Available online: https://www.house.mn.gov/hrd/pubs/ss/sssoland.pdf (accessed on 15 April 2026).
  53. Soil Science Society of America. USDA. Lester–Minnesota State Soil. Available online: https://www.soils4teachers.org/files/s4t/k12outreach/mn-state-soil-booklet.pdf (accessed on 15 April 2026).
  54. Dumas, S. Urban and Rural Population Trend Analysis. 2021. Available online: https://www.minnesotago.org/application/files/6416/5270/8798/MNDOT_Urban_Rural_Trend_FINAL.pdf (accessed on 15 April 2026).
  55. Minnesota Department of Agriculture. Soil Health Financial Assistance Program Grants. Available online: https://www.mda.state.mn.us/soil-health-grant (accessed on 15 April 2026).
  56. Minnesota Legislature. Office of the Revisor of Statutes. Available online: https://www.revisor.mn.gov/bills/bill.php?b=Senate&f=SF2904&ssn=0&y=2023 (accessed on 15 April 2026).
  57. Minnesota Land Trust. Conservation Stewardship. Available online: https://mnland.org/protect-land/for-owners-of-protected-land/ (accessed on 15 April 2026).
  58. Hungerford, T.L. Tax Expenditures: Good, Bad, or Ugly? Tax Notes 2006, 113, 325–334. [Google Scholar]
  59. United States Department of Agriculture. Natural Resources Conservation Service. Conservation Stewardship Program-Minnesota. Available online: https://www.nrcs.usda.gov/programs-initiatives/csp-conservation-stewardship-program/minnesota/conservation-stewardship (accessed on 15 April 2026).
  60. Bouma, J. Soil security in sustainable development. Soil Syst. 2019, 3, 5. [Google Scholar] [CrossRef] [Scilit]
  61. Allan, C. The opportunities and risks of the soil security metaphor: A review. Sustainability 2019, 11, 4464. [Google Scholar] [CrossRef] [Scilit]
  62. Yawson, D.O.; Adu, M.O.; Ason, B.; Armah, F.A.; Yengoh, G.T. Putting soil security on the policy agenda: Need for a familiar framework. Challenges 2016, 7, 15. [Google Scholar] [CrossRef] [Scilit]
  63. Mikhailova, E.A.; Zurqani, H.A.; Lin, L.; Hao, Z.; Post, C.J.; Schlautman, M.A.; Post, G.C. Spatiotemporal analysis of soil quality degradation and emissions in the state of Iowa (USA). Land 2024, 13, 547. [Google Scholar] [CrossRef] [Scilit]
  64. Mikhailova, E.A.; Zurqani, H.A.; Lin, L.; Hao, Z.; Post, C.J.; Schlautman, M.A.; Post, G.C.; Shepherd, G.B.; Dixon, R.M. Quantifying damages to soil health and emissions from land development in the state of Illinois (USA). Land 2023, 12, 1567. [Google Scholar] [CrossRef] [Scilit]
  65. Evangelista, S.J.; Field, D.J.; McBratney, A.B.; Minasny, B.; Ng, W.; Padarian, J.; Román Dobarco, M.; Wadoux, A.M.J.-C. A proposal for the assessment of soil security: Soil functions, soil services and threats to soil. Soil Secur. 2023, 10, 100086. [Google Scholar] [CrossRef] [Scilit]
  66. Figueroa, D.; Abbruzzini, T.F.; Prado, B.; Guevara Santamaria, M. Participatory agricultural soil security index for Mexico: Regional disparities and implications for food production. Soil Secur. 2026, 22, 100229. [Google Scholar] [CrossRef] [Scilit]
  67. Seddon, N.; Chausson, A.; Berry, P.; Girardin, C.A.; Smith, A.; Turner, B. Understanding the value and limits of nature-based solutions to climate change and other global challenges. Philos. Trans. R. Soc. B. 2020, 375, 20190120. [Google Scholar] [CrossRef] [Scilit] [PubMed]
  68. Helfenstein, J.; Diogo, V.; Bürgi, M.; Verburg, P.H.; Schüpbach, B.; Szerencsits, E.; Mohr, F.; Siegrist, M.; Swart, R.; Herzog, F. An approach for comparing agricultural development to societal visions. Agron. Sustain. Dev. 2022, 42, 5. [Google Scholar] [CrossRef] [Scilit] [PubMed]
  69. United Nations (UN). Transforming Our World: The 2030 Agenda for Sustainable Development; The Resolution Adopted by the General Assembly on 25 September 2015; United Nations: New York, NY, USA, 2015; 35p.
  70. UN. Convention on Biological Diversity. Treaty Collection. 1992. Available online: https://www.cbd.int/doc/legal/cbd-en.pdf (accessed on 18 April 2026).
  71. UN. Convention on Biological Diversity. Kunming-Montreal Global Biodiversity Framework. 2022. Available online: https://www.cbd.int/article/cop15-final-text-kunming-montreal-gbf-221222 (accessed on 18 April 2026).
  72. United Nations Convention to Combat Desertification. Available online: https://www.unccd.int/convention/overview (accessed on 18 April 2026).
  73. United Nations (UN) Convention to Combat Desertification. Decision 3/COP.12 (COP 12, Ankara, 2015). Integration of the Sustainable Development Goals and Target into the Implementation of the United Nations Convention to Combat Desertification and the Intergovernmental Working Group Report on Land Degradation Neutrality. Available online: https://www.unccd.int/official-documentscop-12-ankara-2015/3cop12 (accessed on 18 April 2026).
  74. Food and Agriculture Organization (FAO). Revised World Soil Charter. Available online: https://openknowledge.fao.org/server/api/core/bitstreams/65be618a-f5e8-4f67-9cbb-d77f1f5cd31e/content (accessed on 18 April 2026).
  75. Ramsar Convention on Wetlands. Available online: https://www.ramsar.org/ (accessed on 18 April 2026).
  76. Georgetown Law. Georgetown Climate Center. State Adaptation Progress Tracker. Available online: https://www.georgetownclimate.org/adaptation/plans.html (accessed on 9 March 2026).
Figure 1. Relationship between soil security, ecosystem services (ES), and six global challenges for sustainable development, where soil-centric security (shaded) is independent of human need, while human-centric soil security is linked to ES provided by soil and global challenges (based on [4,14]).
Biosphere 02 00010 g001
Figure 2. Biomes present before European settlement (before the 1800s) in the current boundaries of the state of Minnesota (MN), USA (43°30′ N to 49°23′ N; 89°29′ W to 97°14′ W) (adapted from [31,32]).
Biosphere 02 00010 g002
Figure 3. Geospatial workflow for assessing the soil-biosphere nexus and biophysical soil security in Minnesota (MN), USA. The workflow integrates SSURGO soils, 2001 and 2024 NLCD land cover, spatial preprocessing, change analysis, raster-to-vector conversion, and administrative aggregation to quantify capability, condition, and capital, while retaining connectivity and codification as contextual dimensions.
Biosphere 02 00010 g003
Figure 4. State of Minnesota (MN), USA, soil map (43°30′ N to 49°23′ N; 89°29′ W to 97°14′ W) derived from the SSURGO soils database [29] with boundaries of economic development regions [37]. The inherent soil quality (soil suitability) of MN is dominated by moderately weathered Alfisols (20%) and Mollisols (49%) with a high inherent soil quality status.
Biosphere 02 00010 g004
Figure 5. State of Minnesota (MN), USA, 2024 land cover map (43°30′ N to 49°23′ N; 89°29′ W to 97°14′ W) (using data from Multi-Resolution Land Characteristics Consortium (MRLC) [26]).
Biosphere 02 00010 g005
Figure 6. Spatial distribution of (a) anthropogenically degraded land from past land conversions (prior to and through 2024), and (b) recent change in anthropogenic land degradation (2001–2024) by county in Minnesota (MN), USA (43°30′ N to 49°23′ N; 89°29′ W to 97°14′ W).
Biosphere 02 00010 g006
Figure 7. Loss and damage (L&D) because of loss of land for potential soil carbon (C) sequestration from (a) past developments (prior to and through 2024), and (b) land developments that occurred between 2001 and 2024 by county in Minnesota (MN), USA (43°30′ N to 49°23′ N; 89°29′ W to 97°14′ W).
Biosphere 02 00010 g007
Figure 8. Loss and damage (L&D) because of soil carbon (C) loss with associated emissions from (a) past land developments (prior to and through 2024) and (b) more recent land developments between 2001 and 2024 by county in Minnesota (MN), USA (43°30′ N to 49°23′ N; 89°29′ W to 97°14′ W).
Biosphere 02 00010 g008
Figure 9. Loss and damage (L&D) can be measured as “realized” social costs of soil carbon (C) (SC-CO2) from (a) past developments (prior to and through 2024) and (b) recent land developments by county in the state of Minnesota (MN), USA (43°30′ N to 49°23′ N; 89°29′ W to 97°14′ W) from 2001 to 2024. Note: M = million = 106, B = billion = 109.
Biosphere 02 00010 g009
Table 1. Capability is described by soil diversity (pedodiversity), which is represented by taxonomic diversity at the soil order level in Minnesota (MN) (USA) [37].
Soil CapabilityArea (2024)Area (2024)
Soil OrderGeneral Characteristics and Constraints(km2)(%)
EntisolsEmbryonic soils with an ochric epipedon11,939.4    7.1       
InceptisolsYoung soils with an ochric or umbric epipedon15,878.3    9.4       
HistosolsOrganic soils with ≥20% organic carbon22,377.6    13.2       
VertisolsSoils with swelling clays3618.3    2.1       
AlfisolsClay-enriched B horizon with B.S. ≥ 35%33,055.4    19.5       
MollisolsCarbon-enriched soils with B.S. ≥ 50%82,240.0    48.6       
SpodosolsCoarse-textured soils with albic and spodic horizons37.5    0       
Note: B.S. = base saturation. Entisols, Inceptisols, Alfisols, Mollisols, Spodosols, and Vertisols are mineral soils. Histosols are organic soils.
Table 2. Land use/land cover (LULC) by soil order in Minnesota (MN), USA in 2024.
Soil Quality Continuum
NLCD Land Cover Classes
(LULC),
Soil Health Continuum
2024 Total
Area by LULC
(km2)
Degree of Weathering and Soil Development (Inherent Soil Quality; Soil Suitability)
EntisolsInceptisolsHistosolsVertisolsAlfisolsMollisolsSpodosols
2024 Area by Soil Order (km2)
Woody wetlandsHigher28,083.5      3165.84054.814,245.249.34868.61694.94.9
Shrub/ScrubBiosphere 02 00010 i001923.4      155.2337.031.4037524.70.1
Mixed forest6070.2      915.12953.5225.601842.9112.220.9
Deciduous forest18,853.9      2249.82931.7821.312.99526.83310.50.9
Herbaceous572.9      92.5109.311.20.9150.7208.20
Evergreen forest3194.9      837.81509.7112.50663.46110.5
Emergent herbaceous wetlands12,932.3      911.41011.15618.937.71027.74325.40
Hay/Pasture11,980.7      1009.1541.2325.036.54344.25724.80
Cultivated crops74,858.4      1278.11753.6636.53233.77628.760,327.80
Developed, open space5372.4      470.2326.1179.764.31194.63137.50
Developed, low intensity4509.7      478.8253.2145.8148.41050.52432.90
Developed, medium intensity1260.6      205.652.315.825.8285.9675.20
Developed, high intensity265.4      81.68.82.34.840127.80
Barren landLower268.3      88.436.26.33.956.377.20
Totals169,146.6       11,939.415,878.322,377.63618.333,055.4082,240.0037.5
Note: Entisols, Inceptisols, Alfisols, Mollisols, Spodosols, and Vertisols are mineral soils. Histosols are organic soils. The seven soil orders are discrete taxonomic units, whereas the soil quality continuum reflects the continuous distribution of dynamic conditions that soil can exhibit, ranging from degraded to healthy, based on both its inherent natural properties and dynamic, interconnected factors.
Table 3. Potential land for nature-based solutions (NBS) and anthropogenic land degradation status by soil order for the state of Minnesota (MN) in the United States of America (USA) in 2024. Percent changes in area from 2001 to 2024 are shown in parentheses. Reported values have been rounded; therefore, calculated percentages and sums may show minor discrepancies.
Soil OrderTotal AreaAnthropogenically Degraded LandTypes of Anthropogenic DegradationPotential Land for Nature-Based
Solutions
BarrenDevelopedAgriculture
(km2)(%)(km2)(km2)(km2)(km2)(km2)
Entisols11,9397.13612 (+1.9)                 88 (+25.2)1236 (+8.8)2287 (−2.1)336 (−22.9)                  
Inceptisols15,8789.42971 (+3.0)                 36 (+95.9)640 (+11.3)2295 (+0.1)482 (−45.7)                  
Histosols22,37813.21311 (+1.2)                 6 (+22.3)344 (+6.1)961 (−0.5)49 (−13.4)                  
Vertisols36182.13517 (+0.1)                 4 (0)243 (+10.8)3270 (−0.6)5 (+0.9)                  
Alfisols33,05519.514,600 (+0.6)                 56 (+126.7)2571 (+13.0)11,973 (−1.9)582 (−24.1)                  
Mollisols82,24048.672,503 (+0.3)                 77 (+104.0)6373 (+12.3)66,053 (−0.8)310 (+0.9)                  
Spodosols3700 (0)                 0 (0)0 (0)0 (0)0 (0)                  
All Soils
Totals169,147100.098,516 (+0.5)                  268 (+66.7)11,408 (+11.8)86,839 (−1.0)1765 (−28.3)                  
Note: Entisols, Inceptisols, Mollisols, Spodosols, Vertisols, and Alfisols are mineral soils. Histosols are organic soils. Anthropogenically degraded land was calculated as a sum of degraded land from agriculture (hay/pasture and cultivated crops), from development (developed, open space; developed, low intensity; developed, medium intensity; developed, high intensity), and barren land. Developed land includes categories: developed, open space; developed, high intensity; developed, medium intensity; developed, low intensity. Agriculture includes categories: cultivated crops and hay/pasture. Potential land for nature-based solutions (NBS) is limited to shrub/scrub, barren, and herbaceous land cover classes, to identify land areas without impacting current land uses. The area change was calculated as follows: ((2024 Area − 2001 Area)/2001 Area) × 100%.
Table 4. Land use/land cover (LULC) change (%) by soil order in Minnesota (MN), USA from 2001 to 2024.
Soil Quality Continuum
NLCD Land Cover Classes
(LULC),
Soil Health Continuum
Change in Area, 2001–2024
(%)
Degree of Weathering and Soil Development (Inherent Soil Quality; Soil Suitability)
EntisolsInceptisolsHistosolsVertisolsAlfisolsMollisolsSpodosols
Change in Area, 2001–2024 (%)
Woody wetlandsHigher−1.9                 −2.7−0.9−2.1−2.2−1.0−3.70.5
Shrub/ScrubBiosphere 02 00010 i002−28.9                 −18.4−36.82.342.9−25.6−37.3−46.7
Mixed forest−8.3                 −4.5−6.2−5.9190.1−13.4−8.8−7.9
Deciduous forest6.6                 7.225.11.4−7.65.1−1.56.9
Herbaceous−42.8                 −47.3−67.5−45.7475−36.7−9.5−38.8
Evergreen forest−5.6                 −5.6−3.0−8.729.6−10.7−9.921.0
Emergent herbaceous wetlands3.6                 9.53.05.9−5.98.5−1.1−7.4
Hay/Pasture2.8                 −1.2−2.52.254−1.27.30.0
Cultivated crops−1.5                 −2.90.9−1.8−1.0−2.4−1.50
Developed, open space−1.2                 −0.5−0.7−4.3−24.91−1.30
Developed, low intensity25.3                 17.624.617.733.924.327.41.0
Developed, medium intensity30.2                 11.041.248.23130.935.7200.0
Developed, high intensity33.6                 14.835.360.539.140.345.80
Barren landLower66.6                 25.295.922.3−4.9126.7104.02.9
Note: Entisols, Inceptisols, Alfisols, Mollisols, Spodosols, and Vertisols are mineral soils. Histosols are organic soils. Change in the area was calculated as follows: ((2024 LULC Area − 2001 LULC Area)/2001 LULC Area) × 100%.
Table 5. Soil capital and distribution of inherent soil quality and remaining soil carbon regulating ecosystem services in the state of Minnesota (MN), USA by soil order in 2024 [46].
Parameter2024 TotalDegree of Weathering and Soil Development
EntisolsInceptisolsHistosolsVertisolsAlfisolsMollisolsSpodosols
2024 Area (km2)169,146.611,939.415,878.322,377.63618.333,055.482,240.037.5
Soil organic carbon (SOC):
Minimum (kg of C)2.1 × 10122.1 × 10104.4 × 10101.4 × 10122.0 × 10107.6 × 10104.9 × 10111.1 × 108
Midpoint (kg of C)4.8 × 10129.6 × 10101.4 × 10113.1 × 10125.3 × 10102.5 × 10111.1 × 10124.6 × 108
Maximum (kg of C)8.4 × 10121.9 × 10112.8 × 10115.5 × 10129.2 × 10104.7 × 10111.9 × 10129.6 × 108
Minimum (SC-CO2, $, USD)$380.4B$3.8B$8.1B$262.30B$3.6B$13.9B$88.8B$19.9M
Midpoint (SC-CO2, $, USD)$877.7B$17.6B$25.9B$574.9B$9.8B$45.6B$203.9B$84.7M
Maximum (SC-CO2, $, USD)$1.5T$34.6B$50.7B$1.0T$16.9B$85.6B$343.8B$175.3M
Soil inorganic carbon (SIC):
Minimum (kg of C)5.6 × 10112.3 × 10104.0 × 10101.3 × 10103.7 × 10104.3 × 10104.0 × 10117.5 × 106
Midpoint (kg of C)1.4 × 10125.7 × 10108.1 × 10105.4 × 10108.4 × 10101.4 × 10119.5 × 10112.2 × 107
Maximum (kg of C)2.4 × 10121.0 × 10111.3 × 10111.1 × 10111.4 × 10112.7 × 10111.6 × 10124.1 × 107
Minimum (SC-CO2, $, USD)$102.7B$4.2B$7.3B$2.5B$6.8B$7.9B$74.0B$1.5M
Midpoint (SC-CO2, $, USD)$250.3B$10.5B$14.9B$9.8B$15.4B$26.1B$173.5B$4.1M
Maximum (SC-CO2, $, USD)$435.0B$18.4B$24.5B$20.6B$25.4B$49.3B$296.9B$7.5M
Total soil carbon (TSC):
Minimum (kg of C)2.6 × 10124.4 × 10108.4 × 10101.4 × 10125.7 × 10101.2 × 10118.9 × 10111.2 × 108
Midpoint (kg of C)6.1 × 10121.5 × 10112.2 × 10113.2 × 10121.4 × 10113.9 × 10112.1 × 10124.8 × 108
Maximum (kg of C)1.1 × 10132.9 × 10114.1 × 10115.6 × 10122.3 × 10117.3 × 10113.5 × 10121.0 × 109
Minimum (SC-CO2, $, USD)$483.3B$8.1B$15.4B$264.7B$10.4B$21.8B$162.8B$21.4M
Midpoint (SC-CO2, $, USD)$1.1T$27.9B$40.8B$584.7B$25.1B$71.4B$376.7B$88.8M
Maximum (SC-CO2, $, USD)$2.0T$53.1B$75.2B$1.0T$42.3B$134.5B$640.6B$182.8M
Note: Entisols, Inceptisols, Alfisols, Mollisols, Spodosols, and Vertisols are mineral soils. Histosols are organic soils. M = million = 106; B = billion = 109; T = trillion = 1012.
Disclaimer/Publisher’s Note: The statements, opinions and data contained in all publications are solely those of the individual author(s) and contributor(s) and not of MDPI and/or the editor(s). MDPI and/or the editor(s) disclaim responsibility for any injury to people or property resulting from any ideas, methods, instructions or products referred to in the content.