
Geospatial Assessment of Soil–Biosphere Nexus Using a Biophysical Soil Security Matrix: Evidence from Minnesota, USA

 ,
,  ,
,  , , , ,
Abstract
1. Introduction
1.1. Background Information About the Soil Security Concept in Relation to the Biosphere
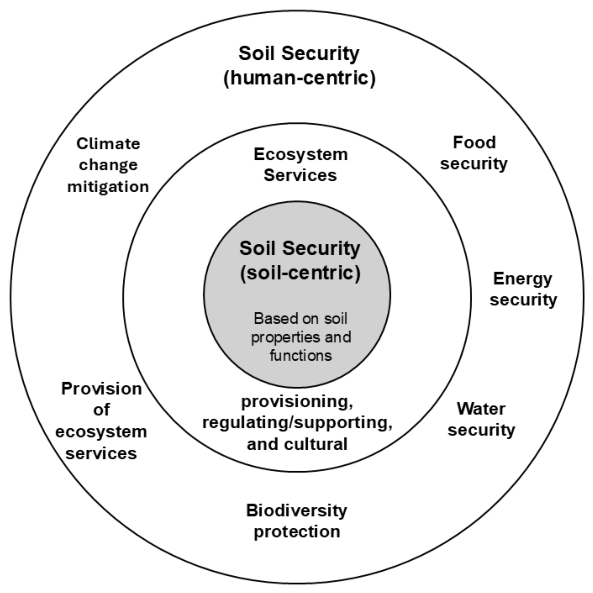
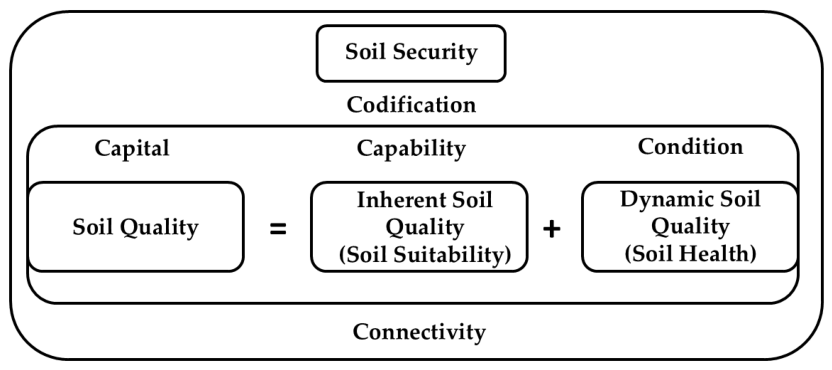
- Capability is the functionality and potential for soils to provide ES based on inherent (characteristic) soil types and properties (biophysical traits).
- Condition is the present state of soil relative to its inherent/characteristic state (biophysical traits).
- Capital is the valuation of soil resources based on ecosystem goods and ES (biophysical plus economic traits).
- Connectivity is the connection between soil and society, particularly as it relates to the resources and knowledge needed to effectively manage soil [4] (socio-economic traits).
- Codification is the connection between soil and societal protection, including government incentives and/or regulations to promote sustainable use and stewardship of soil resources [4] (socio-economic traits).
1.2. Brief Literature Review and Objectives of the Study
2. Materials and Methods
2.1. Study Area and Brief History of the Impacts of Land Conversions on Soil Security in Relation to Biodiversity and Ecosystems in the State of Minnesota (MN), USA
2.2. Geospatial Analysis
Source Data Accuracy and Uncertainty
3. Results
3.1. Soil Capability in the State of Minnesota (MN), USA
3.2. Soil Condition in the State of Minnesota (MN), USA
3.2.1. Soil Degradation in the State of Minnesota (MN)
3.2.2. Soil Decarbonization and Loss of Soil Carbon (C) Sequestration Potential in the State of Minnesota (MN), USA
3.3. Soil Capital of the State of Minnesota (MN), USA
3.4. Soil Connectivity in the State of Minnesota (MN), USA
3.5. Soil Codification in the State of Minnesota (MN), USA
4. Discussion
4.1. Significance of the Results for Soil Security Worldwide
4.1.1. Benefits and Limitations of the Soil Security Concept
4.1.2. Refining the Soil Security Concept
- Dimension 1 (biophysical): Capability of dominant soils (Alfisols (20%) and Mollisols (49%); Figure 4) was rated as high in terms of soil security.
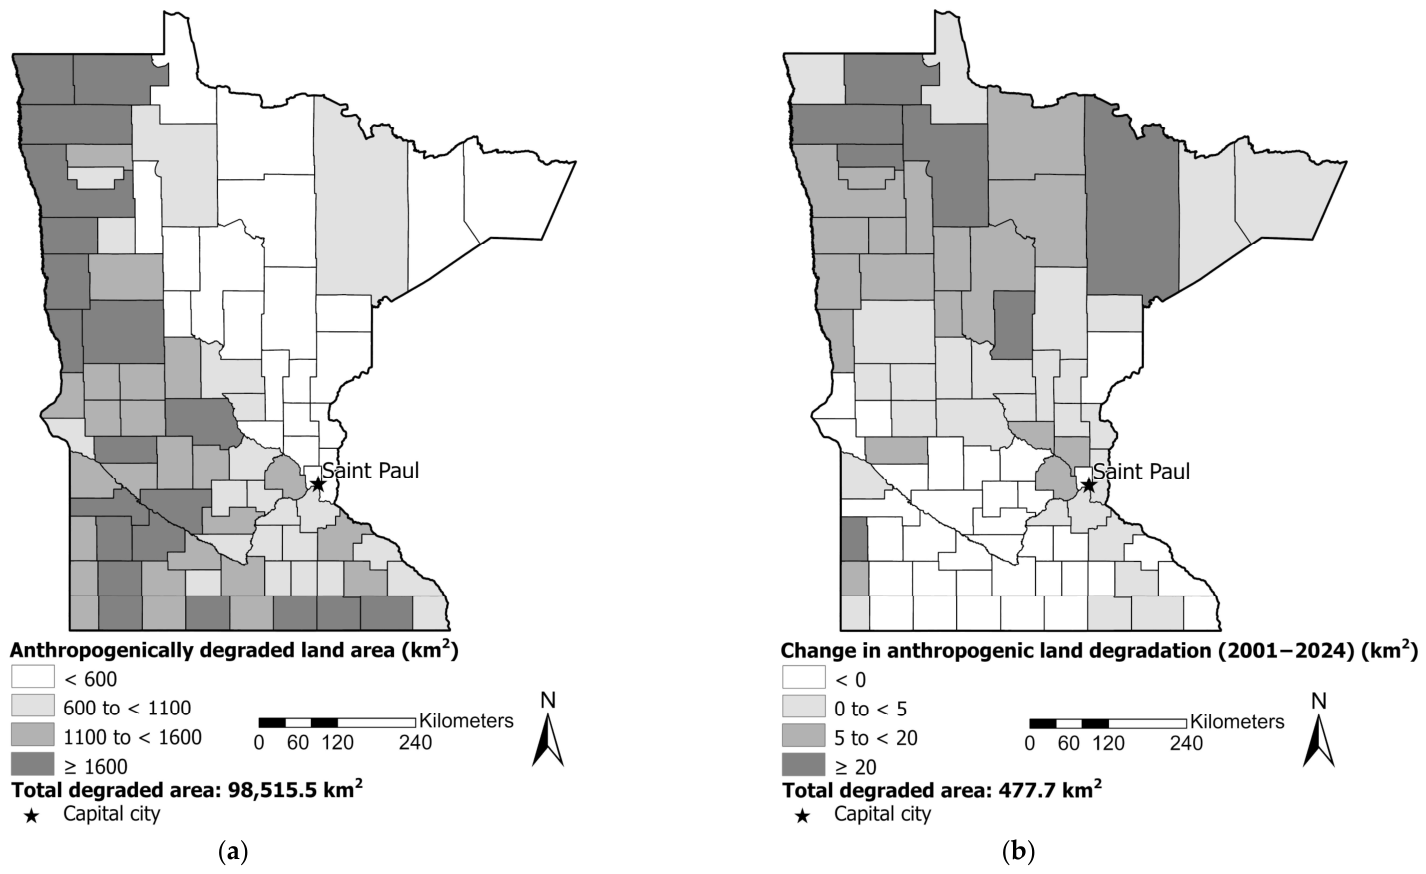
- Dimension 2 (biophysical): Condition of the most capable MN soils is low as a result of anthropogenic land degradation, with the following degradation levels in 2024: Vertisols (97.2%), Mollisols (88.2%), Alfisols (44.2%), Entisols (30.3%), Inceptisols (18.7%), and Histosols (5.9%) (Table 3). Furthermore, much of the land degradation resulted in decarbonization, which continues to the present day.
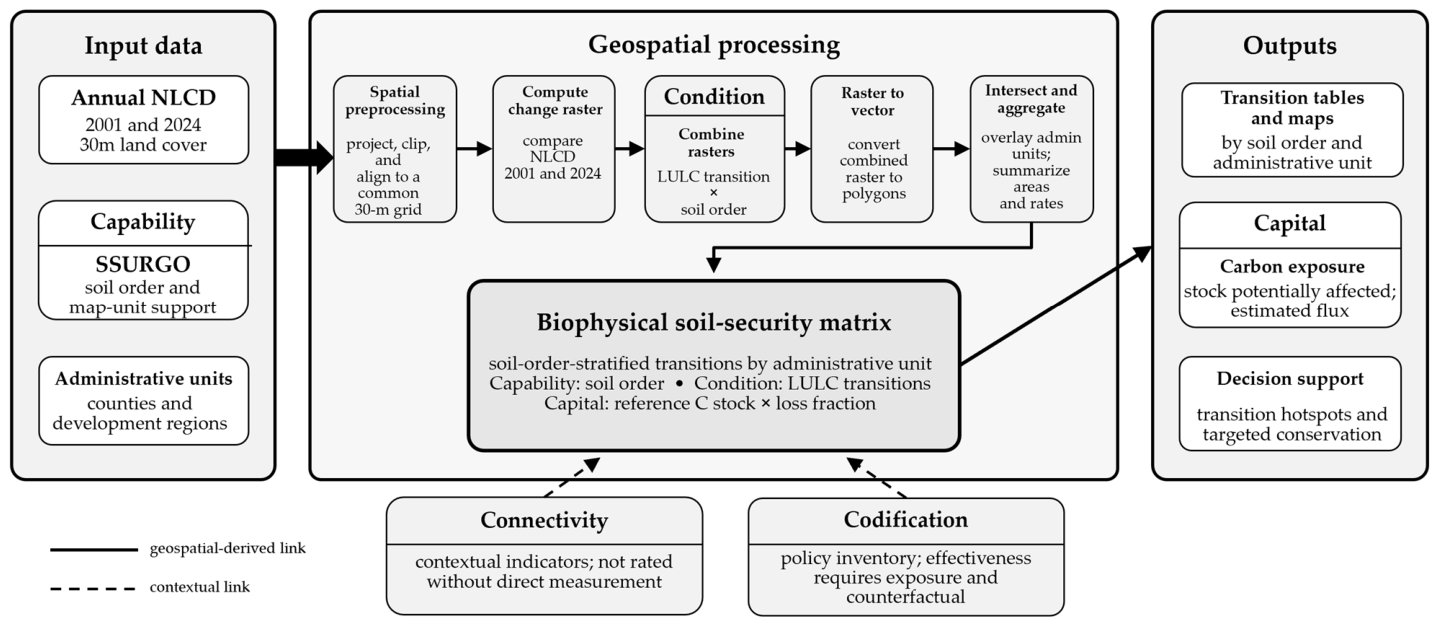
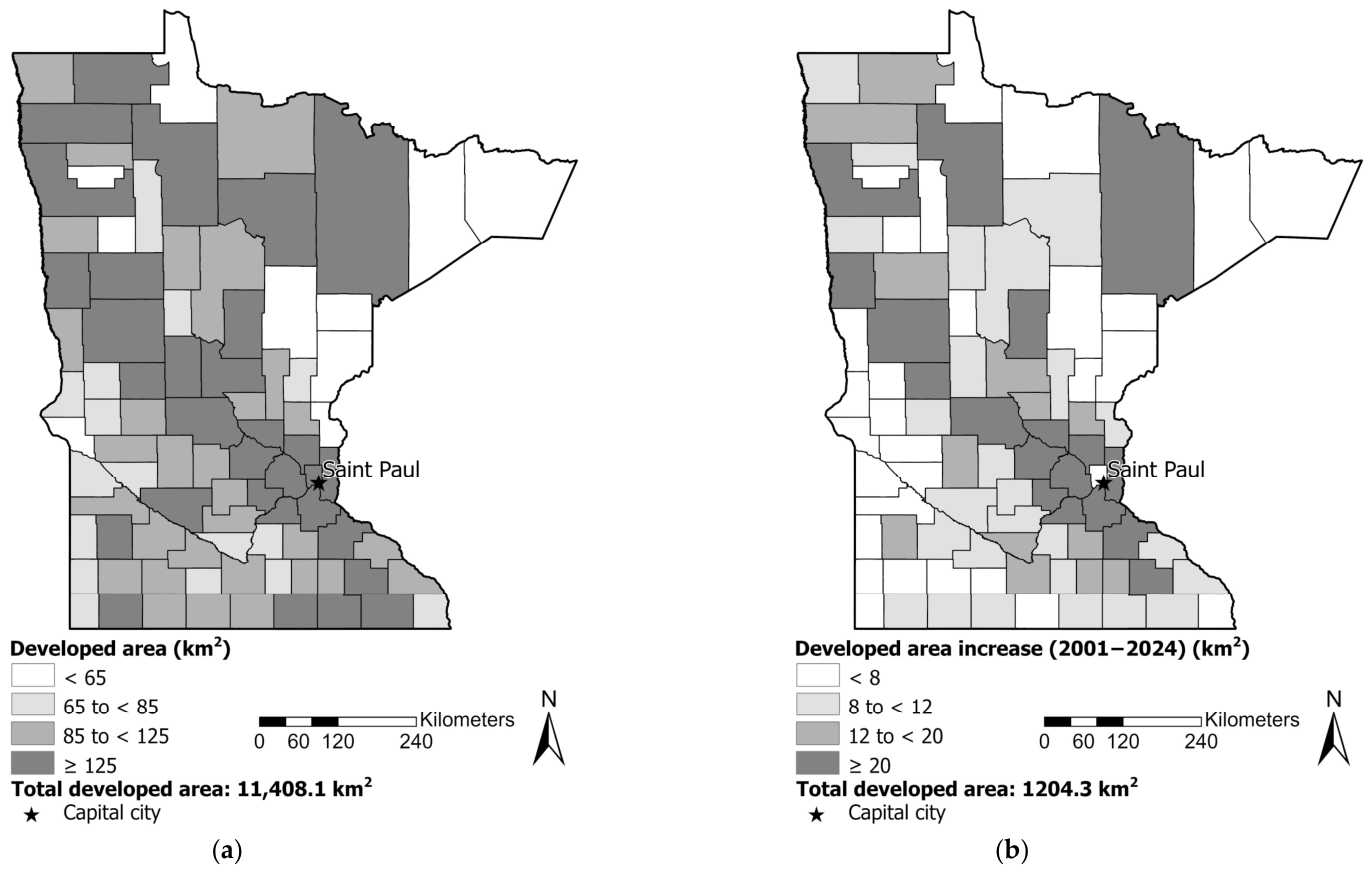
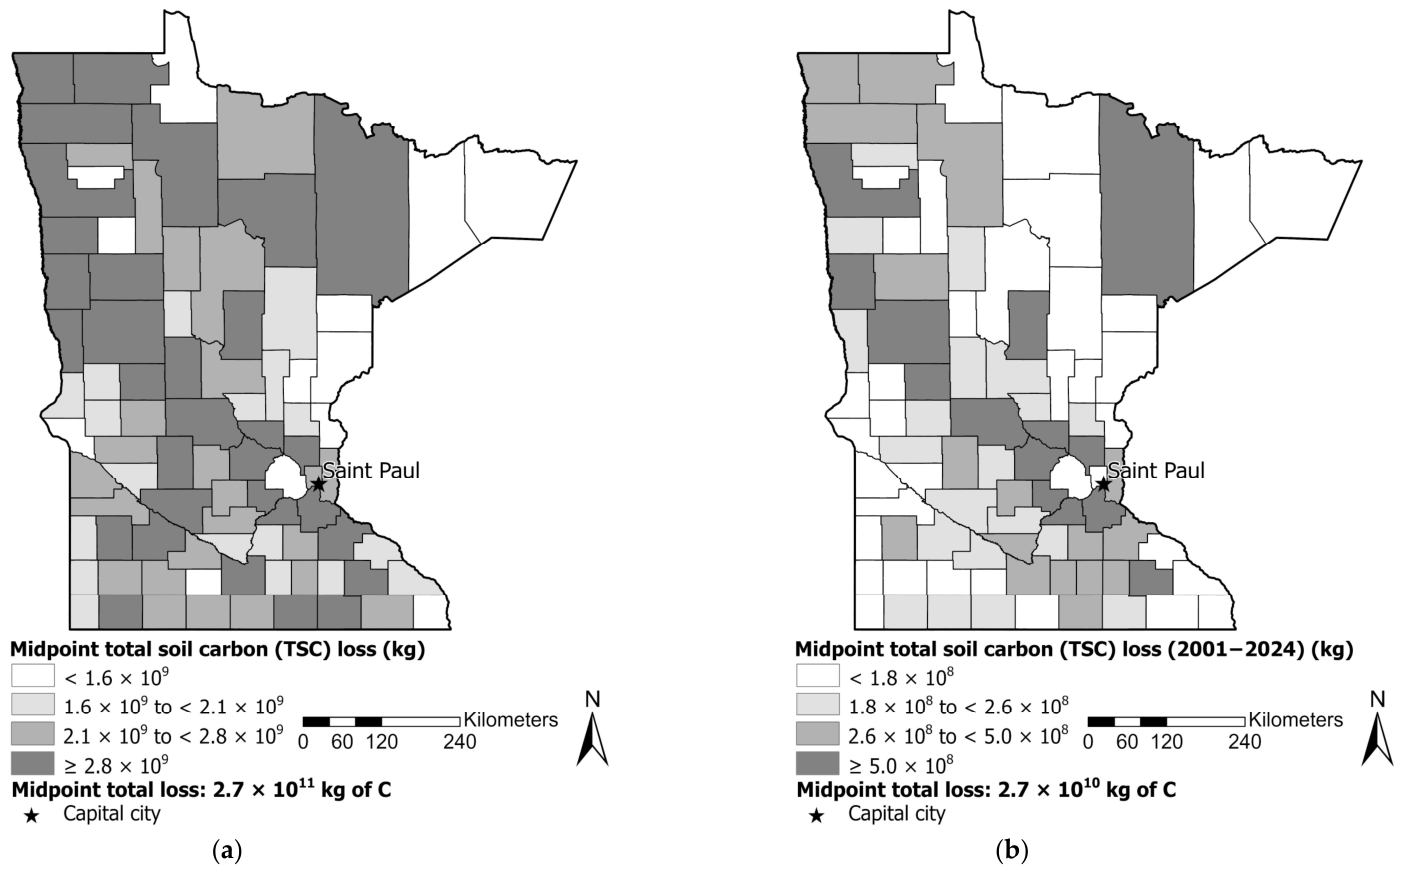
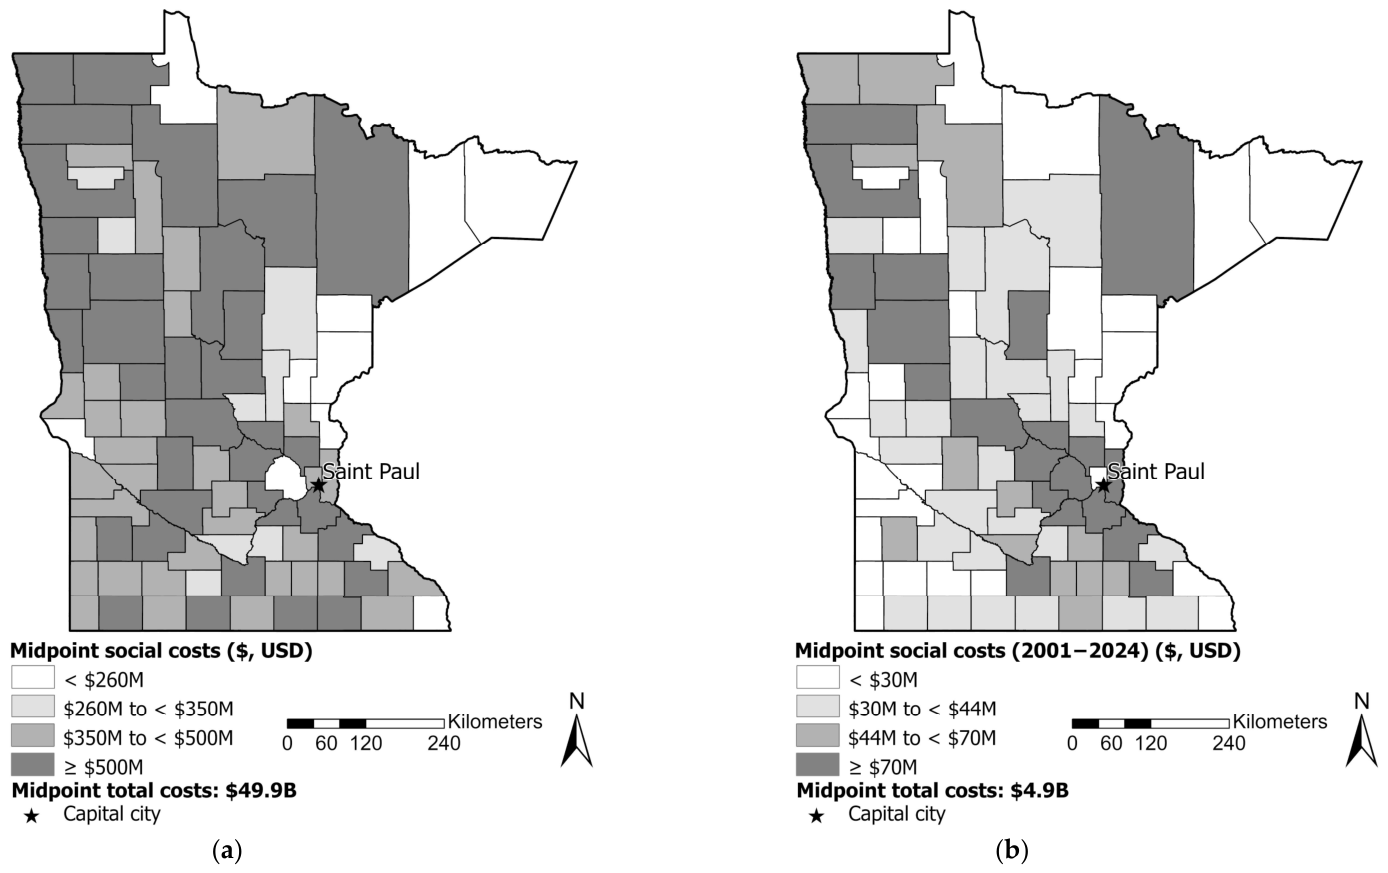
- Dimension 3 (biophysical and economic): Capital for MN soils is partially represented by the remaining midpoint soil storage and social cost of total soil carbon (TSC): 6.1 × 10¹² kg C, $1.1T in 2024. This capital continues to decline due to ongoing anthropogenic LD in the state, as documented by the anthropogenic LD trends in Table 3. Figure 8b and Figure 9b show the spatial patterns of soil capital decline by county in MN.
- Dimension 4 (socio-economic): Connectivity is low in MN, given the fact that 80% of the population lives in urban areas [54] and is likely disconnected from agricultural production.
- Dimension 5 (socio-economic): Codification of soil security in MN includes multiple stakeholders, including individuals, municipalities, and the state. Private land ownership in MN is high at 76.5% [51], which can complicate soil conservation efforts. Geospatial analysis in our study can help track the effectiveness of codification by evaluating changes in LD over time (Table 3), which shows increases in anthropogenic LD, indicating decreasing soil security in the codification dimension. There are efforts to improve soil health through legislative action [47], but it is unclear whether these efforts can truly address the massive scale of LD from agriculture and development.
- The overall soil-centric soil security rating for MN is moving towards a low rating within the biophysical soil security continuum based on the analysis of the five dimensions of soil security. Furthermore, MN’s internal soil security rating is relevant to global climate change due to GHG emissions from soil degradation in the state.
4.2. Significance of the Results in a Broader Context
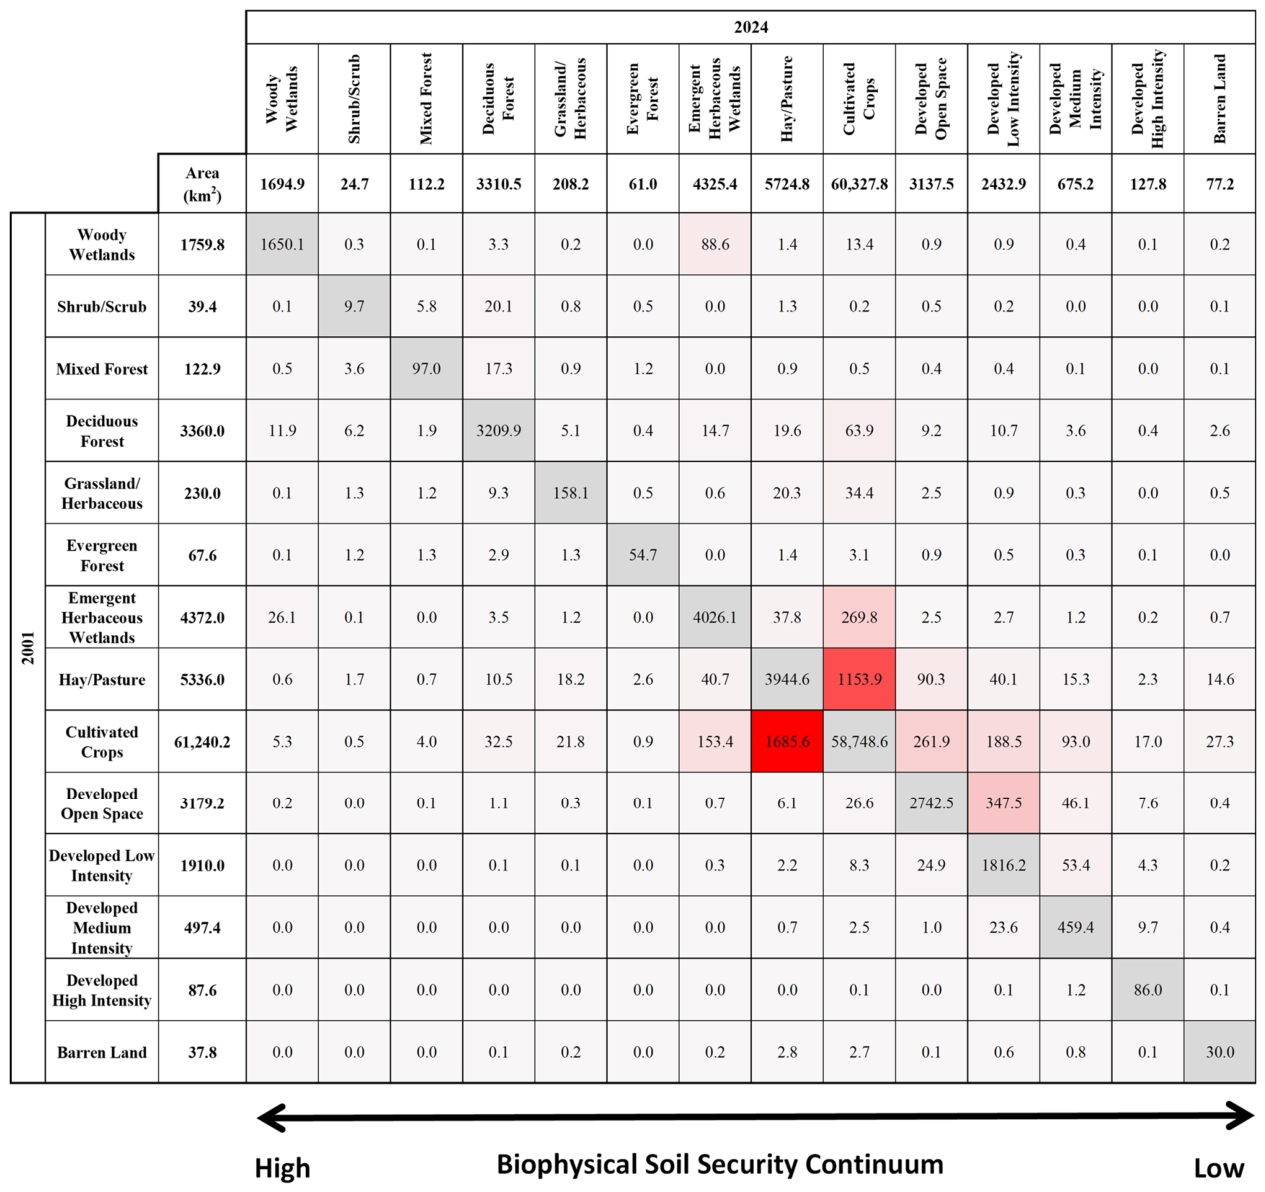
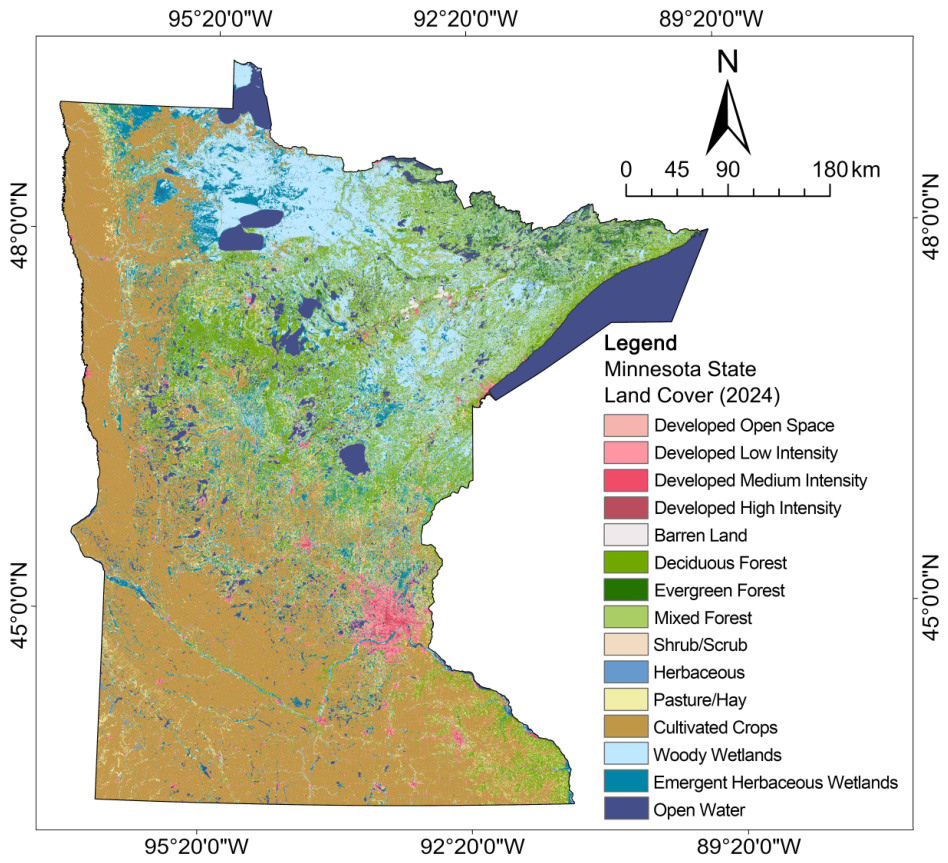
- Food Security: There was a decrease in cultivated crops (−1.5%) overall, and most of the seven soil orders between 2001 and 2024 in MN (Table 4). Hay/pasture also showed a decrease in some soil orders. Biophysical soil security matrices for individual soil orders showed that hay/pasture and cultivated crops were converted to developments in the following soil orders: Entisols, Inceptisols, Histosols, Alfisols, and Mollisols (Figure 11 and Figures S1–S4) (Applicable to UN SDG 2: Zero Hunger);
- Provision of ecosystem services: Biophysical soil security matrices for the soil orders of Entisols, Inceptisols, Histosols, Alfisols, and Mollisols (Figure 11 and Figures S1–S4) demonstrate the conversion of C-sequestering and productive soils to developments, which most likely results in the reduction of the provision of ecosystem services by these soils (Relevant for UN SDG 12: Responsible Consumption and Production);
- Climate change mitigation: The state of MN currently does not have any climate change plans (https://www.georgetownclimate.org/adaptation/plans.html (accessed on 18 April 2026) [76]. Economic activity in MN has driven both past and current land conversions, resulting in GHG emissions and monetary social cost of CO2 (SC-CO2) values. Additionally, developments now include areas isolated from the atmosphere and excluded from future C sequestration capacity in MN. Up to 2024, MN experienced a loss of 11,408.1 km2 to development, with a total soil carbon (TSC) midpoint loss of 2.7 × 10¹¹ and an associated midpoint estimated value of $49.9B (where B = billion = 109, USD) in SC-CO2 (Table S6). Recent land developments (1204.3 km2) from 2001 to 2024 likely resulted in a midpoint loss of 2.7 × 10¹⁰ kg of TSC, corresponding to a midpoint of $4.9B in SC-CO2 (Table S6). There is very little land (1.0% of total land area) available for nature-based C sequestration (Table 3) (Addressing UN SDG 13: Climate Action);
- Biodiversity protection: Almost 58% of MN land has been subject to anthropogenic LD primarily because of agriculture (88% of total anthropogenic LD) up to and including 2024. Varying degrees of anthropogenic LD were seen in all seven soil orders: Vertisols (97.2%), Mollisols (88.2%), Alfisols (44.2%), Entisols (30.2%), Inceptisols (18.7%), and Histosols (5.9%). Data from more recent years (2001–2024) showed a +0.5% increase in anthropogenic LD and a +11.8% increase in LD from developments in the state, which were not offset by land potentially available for NBS (Table 3). There were decreases in the total areas of shrub/scrub (−28.9%), mixed forest (−8.3%), herbaceous (−42.8%), evergreen forests (−5.6%), woody wetlands (−1.9%), and cultivated crops (−1.5%) (Table 3). (Addressing UN SDG 15: Life on Land; UN Convention to Combat Desertification; UN Convention on Biological Diversity; UN Kunming-Montreal Global Biodiversity Framework; The Revised World Soil Charter);
- Water Security: Our study leverages satellite-based land cover change detection, combined with spatial soil databases, to identify changes in LULC related to wetlands (e.g., emergent herbaceous wetlands) and related soil types (e.g., Histosols) in MN. As noted in Section 3.3, Histosols account for only 13% of soils in MN, but they are a significant repository (“hotspot”) of SOC (66% of MN’s total SOC) and TSC (52% of MN’s total TSC) (Table 5). When wetlands are drained and/or converted to other LULC types, Histosols undergo hydromorphological changes, including the loss of reducing conditions, changes in redoximorphic features, microbial oxidation of SOC, and subsidence [47,48,49]. In 2001, the total area of wetlands in MN was 41,108.4 km2. Of this total wetland area, 70% were woody wetlands (28,627.6 km2) while 30% were emergent herbaceous wetlands (12,480.8 km2). By 2024, the total wetland area had decreased slightly to 41,015.8 km2, an overall loss of about 0.2%. Woody wetlands (68%, 28,083.5 km2) remained the dominant wetland type in 2024, although the relative amount of emergent herbaceous wetlands did increase slightly by 2024 (32%, 12,932.3 km2). Despite the apparent relative stability in total wetlands, woody wetlands, and emergent herbaceous wetlands from 2001 to 2024, an in-depth examination of land cover/land use changes reveals a more nuanced story (Table S8). A portion of these wetlands (29.8 km2) was converted to developments, which resulted in 4.2 × 10⁹ kg midpoint TSC loss and corresponding midpoint SC-CO2 in the amount of $778.7M USD, estimated based on soil C content of the soil order of Histosols (Tables S2 and S8). (Relevant to Ramsar Convention on Wetlands).
5. Conclusions
Supplementary Materials
Author Contributions
Funding
Institutional Review Board Statement
Informed Consent Statement
Data Availability Statement
Acknowledgments
Conflicts of Interest
Abbreviations
| C | Carbon |
| CO2 | Carbon dioxide |
| ES | Ecosystem services |
| EPA | Environmental Protection Agency |
| GBF | Kunming–Montreal Global Biodiversity Framework |
| GHG | Greenhouse gases |
| LD | Land degradation |
| L&D | Loss and damage |
| LULC | Land use/land cover |
| MN | Minnesota |
| NBS | Nature-based solutions |
| ND | North Dakota |
| NLCD | National Land Cover Database |
| NRCS | Natural Resources Conservation Service |
| SC-CO2 | Social cost of carbon emissions |
| SDGs | Sustainable Development Goals |
| SOC | Soil organic carbon |
| SIC | Soil inorganic carbon |
| SSURGO | Soil Survey Geographic Database |
| STATSGO | State Soil Geographic Database |
| TSC | Total soil carbon |
| UN | United Nations |
| UNCCD | United Nations Convention to Combat Desertification |
| USA | United States of America |
| USD | United States dollar |
| USDA | United States Department of Agriculture |
References
- Jenny, H. Factors of Soil Formation; McGraw Hill: New York, NY, USA, 1941. [Google Scholar]
- Adhikari, K.; Hartemink, A.E. Linking soils to ecosystem services—A global review. Geoderma 2016, 262, 101–111. [Google Scholar] [CrossRef] [Scilit]
- Montanarella, L.; Pennock, D.J.; McKenzie, N.; Badraoui, M.; Chude, V.; Baptista, I.; Mamo, T.; Yemefack, M.; Singh Aulakh, M.; Yagi, K.; et al. World’s soils are under threat. Soil 2016, 2, 79–82. [Google Scholar] [CrossRef] [Scilit]
- McBratney, A.; Field, D.J.; Koch, A. The dimensions of soil security. Geoderma 2014, 213, 203–213. [Google Scholar] [CrossRef] [Scilit]
- McBratney, A.B.; Minasny, B.; Wheeler, I.; Malone, B.P. Frameworks for digital soil assessment. In Digital Soil Assessment and Beyond; Minasny, B., Malone, B.P., McBratney, A.B., Eds.; Taylor & Francis Group: London, UK, 2012; pp. 9–14. [Google Scholar]
- Field, D.J. Soil security: Dimensions. In Global Soil Security; Field, D.J., Morgan, C.L., McBratney, A.B., Eds.; Springer International Publishing: Berlin/Heidelberg, Germany, 2017; pp. 15–23. [Google Scholar]
- Murphy, B.; Fogarty, P. Application of the soil security concept to two contrasting soil landscape systems—Implications for soil capability and sustainable land management. Sustainability 2019, 11, 5706. [Google Scholar] [CrossRef] [Scilit]
- Bouma, J.; McBratney, A. Framing soils as an actor when dealing with wicked environmental problems. Geoderma 2013, 200, 130–139. [Google Scholar] [CrossRef] [Scilit]
- Bünemann, E.K.; Bongiorno, G.; Bai, Z.; Creamer, R.E.; De Deyn, G.; De Goede, R.; Fleskens, L.; Geissen, V.; Kuyper, T.W.; Mäder, P.; et al. Soil quality–A critical review. Soil Biol. Biochem. 2018, 120, 105–125. [Google Scholar] [CrossRef] [Scilit]
- Lehmann, J.; Bossio, D.A.; Kögel-Knabner, I.; Rillig, M.C. The concept and future prospects of soil health. Nat. Rev. Earth Environ. 2020, 1, 544–553. [Google Scholar] [CrossRef] [Scilit] [PubMed]
- Howard, T.M.; Lawson, A. Soil governance: Accessing cross-disciplinary perspectives. Int. J. Rural. Law Policy 2015, 1, 98–105. [Google Scholar] [CrossRef] [Scilit]
- Fox, S.J. Soil governance and private property. Utah Law Rev. 2024, 1, 1–56. [Google Scholar] [CrossRef] [Scilit]
- Bartkowski, B.; Bartke, S.; Helming, K.; Paul, C.; Techen, A.K.; Hansjürgens, B. Potential of the economic valuation of soil-based ecosystem services to inform sustainable soil management and policy. PeerJ 2020, 8, e8749. [Google Scholar] [CrossRef] [Scilit] [PubMed]
- Mizuta, K.; Grunwald, S. Reshaping how we think about soil security. Soil Syst. 2022, 6, 74. [Google Scholar] [CrossRef] [Scilit]
- Warkentin, B.P. Beyond stewardship from conservation to intrinsic soil value. In Proceedings of the 17th World Congress of Soil Science, Bangkok, Thailand, 14–21 August 2002. [Google Scholar]
- Widyatmanti, W.; Umarhadi, D.A. Spatial modeling of soil security in agricultural land of Central Java, Indonesia: A preliminary study on capability, condition, and capital dimensions. Soil Secur. 2022, 8, 100070. [Google Scholar] [CrossRef] [Scilit]
- Kidd, D.; Field, D.; McBratney, A.; Webb, M. A preliminary spatial quantification of the soil security dimensions for Tasmania. Geoderma 2018, 322, 184–200. [Google Scholar] [CrossRef] [Scilit]
- Arrouays, D.; Mulder, V.L.; Richer-de-Forges, A.C. Soil mapping, digital soil mapping and soil monitoring over large areas and the dimensions of soil security–A review. Soil Secur. 2021, 5, 100018. [Google Scholar] [CrossRef] [Scilit]
- Yang, R.-M.; Minasny, B.; Ma, Y.-X.; Field, D.; McBratney, A.; Wu, C.-F. A preliminary soil security assessment of agricultural land in middle-eastern China. Soil Use Manag. 2018, 34, 584–596. [Google Scholar] [CrossRef] [Scilit]
- Montanarella, L.; Panagos, P. Soil security for the European Union. Soil Secur. 2021, 4, 100009. [Google Scholar] [CrossRef] [Scilit]
- Moloney, J.P.; Ma, Y.; Stockmann, U.; Manu, V.; Minoneti, V.; Hui, S.; Halavatau, S.; Patolo, S.; Tukia, T.; Foliaki, S.; et al. Rapid soil attribute evaluation for soil security assessments in data-poor environments in the Pacific region. Soil Secur. 2024, 16, 100161. [Google Scholar] [CrossRef] [Scilit]
- Shiferaw, H.; Alamirew, T.; Kassawmar, T.; Zeleke, G. Evaluating ecosystems services values due to land use transformation in the Gojeb watershed, Southwest Ethiopia. Environ. Syst. Res. 2021, 10, 22. [Google Scholar] [CrossRef] [Scilit]
- Wu, Y.; Liu, X.; Zhao, Q.; Liu, H.; Qu, F.; Zhang, M. Impact of land use/land cover change on ecosystem service trade-offs/synergies—A case study of Gangu County, China. Sustainability 2024, 16, 5929. [Google Scholar] [CrossRef] [Scilit]
- Asante-Yeboah, E.; Koo, H.; Ros-Tonen, M.A.; Sieber, S.; Fürst, C. Participatory and spatially explicit assessment to envision the future of land-use/land-cover change scenarios on selected ecosystem services in Southwestern Ghana. Environ. Manag. 2024, 74, 94–113. [Google Scholar] [CrossRef] [Scilit] [PubMed]
- Mikhailova, E.A.; Zurqani, H.A.; Lin, L.; Hao, Z.; Post, C.J.; Schlautman, M.A.; Shepherd, G.B. Opportunities for monitoring soil and land development to support United Nations (UN) Sustainable Development Goals (SDGs): A Case study of the United States of America (USA). Land 2023, 12, 1853. [Google Scholar] [CrossRef] [Scilit]
- Multi-Resolution Land Characteristics Consortium—MRLC. Available online: https://www.mrlc.gov/ (accessed on 15 April 2025).
- EPA—United States Environmental Protection Agency. The Social Cost of Carbon. EPA Fact Sheet. 2016. Available online: https://19january2017snapshot.epa.gov/climatechange/social-cost-carbon_.html (accessed on 15 April 2026).
- PRISM Climate Group, Oregon State University. Available online: https://prism.oregonstate.edu (accessed on 15 April 2026).
- Soil Survey Staff, Natural Resources Conservation Service, United States Department of Agriculture. Soil Survey Geographic (SSURGO) Database. Available online: https://nrcs.app.box.com/v/soils (accessed on 15 April 2026).
- Li, X.; Tian, H.; Lu, C.; Pan, S. Four-century history of land transformation by humans in the United States (1630–2020): Annual and 1 km grid data for the HIStory of LAND changes (HISLAND-US). Earth Syst. Sci. Data 2023, 15, 1005–1035. [Google Scholar] [CrossRef] [Scilit]
- Tester, J.R. Minnesota’s Natural Heritage: An Ecological Perspective; University of Minnesota Press: Minneapolis, MN, USA, 1995. [Google Scholar]
- Minnesota Department of Natural Resources. All About Minnesota’s Forests and Trees: A Primer. 2008. Available online: https://www.dnr.state.mn.us/forestry/education/primer/index.html (accessed on 11 April 2026).
- Mikhailova, E.A.; Zurqani, H.A.; Lin, L.; Hao, Z.; Post, C.J.; Schlautman, M.A.; Post, G.C.; Highberger, G.A.; Shepherd, G.B. The role of soil diversity (pedodiversity) in the Kunming Montreal Global Biodiversity Framework: Example of the contiguous United States of America (USA). Biosphere 2025, 1, 3. [Google Scholar] [CrossRef] [Scilit]
- Dahl, T.E. Wetland Losses in the United States 1780’s to 1980’s. U.S. Department of Interior FWS. 1990. Available online: https://www.fws.gov/sites/default/files/documents/Wetlands-Losses-in-the-United-States-1780s-to-1980s.pdf (accessed on 5 April 2026).
- Mikhailova, E.A.; Zurqani, H.A.; Lin, L.; Hao, Z.; Post, C.J.; Schlautman, M.A.; Post, G.C.; Brown, C.E.; Shepherd, G.B. Monitoring wise use of wetlands during land conversion for the Ramsar Convention on wetlands: A Case study of the contiguous United States of America (USA). Biosphere 2025, 1, 2. [Google Scholar] [CrossRef] [Scilit]
- ESRI (Environmental Systems Research Institute). ArcGIS Pro 2.6. Available online: https://pro.arcgis.com/en/pro-app/2.6/get-started/whats-new-in-arcgis-pro.htm (accessed on 15 April 2026).
- The United States Census Bureau. TIGER/Line Boundary Shapefiles. 2018. Available online: https://www.census.gov/geographies/mapping-files/time-series/geo/tiger-line-file.2018.html (accessed on 15 April 2026).
- Guo, Y.; Amundson, R.; Gong, P.; Yu, Q. Quantity and spatial variability of soil carbon in the conterminous United States. Soil Sci. Soc. Am. J. 2006, 70, 590–600. [Google Scholar] [CrossRef] [Scilit]
- Xu, P.; Tsendbazar, N.E.; Herold, M.; De Bruin, S.; Koopmans, M.; Birch, T.; Carter, S.; Fritz, S.; Lesiv, M.; Mazur, E.; et al. Comparative validation of recent 10 m-resolution global land cover maps. Remote Sens. Environ. 2024, 311, 114316. [Google Scholar] [CrossRef] [Scilit]
- Anderson, J.L.; Grigal, D.F.; Cooper, T. Soils and Landscapes of Minnesota; Minnesota Extension Service, University of Minnesota: St. Paul, MN, USA, 1984. Available online: https://hdl.handle.net/11299/211988 (accessed on 15 April 2026).
- Brady, N.C.; Weil, R.R. The Nature and Properties of Soils, 13th ed.; Pearson Education: London, UK, 2002. [Google Scholar]
- Thaler, E.A.; Kwang, J.S.; Quirk, B.J.; Quarrier, C.L.; Larsen, I.J. Rates of historical anthropogenic soil erosion in the midwestern United States. Earth’s Future 2022, 10, e2021EF002396. [Google Scholar] [CrossRef] [Scilit]
- Krause, L.; McCullough, K.J.; Kane, E.S.; Kolka, R.K.; Chimner, R.A.; Lilleskov, E.A. Impacts of historical ditching on peat volume and carbon in northern Minnesota USA peatlands. J. Environ. Manag. 2021, 296, 113090. [Google Scholar] [CrossRef] [Scilit] [PubMed]
- Lal, R. Soil health and carbon management. Food Energy Secur. 2016, 5, 212–222. [Google Scholar] [CrossRef] [Scilit]
- Mikhailova, E.A.; Zurqani, H.A.; Lin, L.; Hao, Z.; Post, C.J.; Schlautman, M.A.; Post, G.C.; Landis, L.N.; Roberts, L.C.; Shepherd, G.B. Assessing potential land and soil for nature-based solutions (NBS) for United Nations (UN) initiatives: An example of the contiguous United States of America (USA). Earth 2025, 6, 17. [Google Scholar] [CrossRef] [Scilit]
- Soil Survey Staff. Keys to Soil Taxonomy, 13th ed.; U.S. Department of Agriculture, Natural Resources Conservation Service: Washington, DC, USA, 2022. Available online: https://www.nrcs.usda.gov/resources/guides-and-instructions/keys-to-soil-taxonomy (accessed on 15 April 2026).
- Leifeld, J.; Menichetti, L. The underappreciated potential of peatlands in global climate change mitigation strategies. Nat. Commun. 2018, 9, 1071. [Google Scholar] [CrossRef] [Scilit] [PubMed]
- Tiemeyer, B.; Freibauer, A.; Borraz, E.A.; Augustin, J.; Bechtold, M.; Beetz, S.; Beyer, C.; Ebli, M.; Eickenscheidt, T.; Fiedler, S.; et al. A new methodology for organic soils in national greenhouse gas inventories: Data synthesis, derivation and application. Ecol. Indic. 2020, 109, 105838. [Google Scholar] [CrossRef] [Scilit]
- Evans, C.D.; Peacock, M.; Baird, A.J.; Artz, R.R.E.; Burden, A.; Callaghan, N.; Chapman, P.J.; Cooper, H.M.; Coyle, M.; Craig, E.; et al. Overriding water table control on managed peatland greenhouse gas emissions. Nature 2021, 593, 548–552. [Google Scholar] [CrossRef] [Scilit] [PubMed]
- Clunes, J.; Valle, S.; Dörner, J.; Martínez, O.; Pinochet, D.; Zúñiga, F.; Blum, W.E. Soil fragility: A concept to ensure a sustainable use of soils. Ecol. Indic. 2022, 139, 108969. [Google Scholar] [CrossRef] [Scilit]
- U.S. Bureau of the Census. Statistical Abstract of the United States: 1991; U.S. Bureau of the Census: Washington, DC, USA, 1991; p. 201. Available online: https://www.census.gov/library/publications/1991/compendia/statab/111ed.html (accessed on 15 April 2026).
- Helland, J. State-Owned Land in Minnesota. House Research. Short Subjects. 2002. Available online: https://www.house.mn.gov/hrd/pubs/ss/sssoland.pdf (accessed on 15 April 2026).
- Soil Science Society of America. USDA. Lester–Minnesota State Soil. Available online: https://www.soils4teachers.org/files/s4t/k12outreach/mn-state-soil-booklet.pdf (accessed on 15 April 2026).
- Dumas, S. Urban and Rural Population Trend Analysis. 2021. Available online: https://www.minnesotago.org/application/files/6416/5270/8798/MNDOT_Urban_Rural_Trend_FINAL.pdf (accessed on 15 April 2026).
- Minnesota Department of Agriculture. Soil Health Financial Assistance Program Grants. Available online: https://www.mda.state.mn.us/soil-health-grant (accessed on 15 April 2026).
- Minnesota Legislature. Office of the Revisor of Statutes. Available online: https://www.revisor.mn.gov/bills/bill.php?b=Senate&f=SF2904&ssn=0&y=2023 (accessed on 15 April 2026).
- Minnesota Land Trust. Conservation Stewardship. Available online: https://mnland.org/protect-land/for-owners-of-protected-land/ (accessed on 15 April 2026).
- Hungerford, T.L. Tax Expenditures: Good, Bad, or Ugly? Tax Notes 2006, 113, 325–334. [Google Scholar]
- United States Department of Agriculture. Natural Resources Conservation Service. Conservation Stewardship Program-Minnesota. Available online: https://www.nrcs.usda.gov/programs-initiatives/csp-conservation-stewardship-program/minnesota/conservation-stewardship (accessed on 15 April 2026).
- Bouma, J. Soil security in sustainable development. Soil Syst. 2019, 3, 5. [Google Scholar] [CrossRef] [Scilit]
- Allan, C. The opportunities and risks of the soil security metaphor: A review. Sustainability 2019, 11, 4464. [Google Scholar] [CrossRef] [Scilit]
- Yawson, D.O.; Adu, M.O.; Ason, B.; Armah, F.A.; Yengoh, G.T. Putting soil security on the policy agenda: Need for a familiar framework. Challenges 2016, 7, 15. [Google Scholar] [CrossRef] [Scilit]
- Mikhailova, E.A.; Zurqani, H.A.; Lin, L.; Hao, Z.; Post, C.J.; Schlautman, M.A.; Post, G.C. Spatiotemporal analysis of soil quality degradation and emissions in the state of Iowa (USA). Land 2024, 13, 547. [Google Scholar] [CrossRef] [Scilit]
- Mikhailova, E.A.; Zurqani, H.A.; Lin, L.; Hao, Z.; Post, C.J.; Schlautman, M.A.; Post, G.C.; Shepherd, G.B.; Dixon, R.M. Quantifying damages to soil health and emissions from land development in the state of Illinois (USA). Land 2023, 12, 1567. [Google Scholar] [CrossRef] [Scilit]
- Evangelista, S.J.; Field, D.J.; McBratney, A.B.; Minasny, B.; Ng, W.; Padarian, J.; Román Dobarco, M.; Wadoux, A.M.J.-C. A proposal for the assessment of soil security: Soil functions, soil services and threats to soil. Soil Secur. 2023, 10, 100086. [Google Scholar] [CrossRef] [Scilit]
- Figueroa, D.; Abbruzzini, T.F.; Prado, B.; Guevara Santamaria, M. Participatory agricultural soil security index for Mexico: Regional disparities and implications for food production. Soil Secur. 2026, 22, 100229. [Google Scholar] [CrossRef] [Scilit]
- Seddon, N.; Chausson, A.; Berry, P.; Girardin, C.A.; Smith, A.; Turner, B. Understanding the value and limits of nature-based solutions to climate change and other global challenges. Philos. Trans. R. Soc. B. 2020, 375, 20190120. [Google Scholar] [CrossRef] [Scilit] [PubMed]
- Helfenstein, J.; Diogo, V.; Bürgi, M.; Verburg, P.H.; Schüpbach, B.; Szerencsits, E.; Mohr, F.; Siegrist, M.; Swart, R.; Herzog, F. An approach for comparing agricultural development to societal visions. Agron. Sustain. Dev. 2022, 42, 5. [Google Scholar] [CrossRef] [Scilit] [PubMed]
- United Nations (UN). Transforming Our World: The 2030 Agenda for Sustainable Development; The Resolution Adopted by the General Assembly on 25 September 2015; United Nations: New York, NY, USA, 2015; 35p.
- UN. Convention on Biological Diversity. Treaty Collection. 1992. Available online: https://www.cbd.int/doc/legal/cbd-en.pdf (accessed on 18 April 2026).
- UN. Convention on Biological Diversity. Kunming-Montreal Global Biodiversity Framework. 2022. Available online: https://www.cbd.int/article/cop15-final-text-kunming-montreal-gbf-221222 (accessed on 18 April 2026).
- United Nations Convention to Combat Desertification. Available online: https://www.unccd.int/convention/overview (accessed on 18 April 2026).
- United Nations (UN) Convention to Combat Desertification. Decision 3/COP.12 (COP 12, Ankara, 2015). Integration of the Sustainable Development Goals and Target into the Implementation of the United Nations Convention to Combat Desertification and the Intergovernmental Working Group Report on Land Degradation Neutrality. Available online: https://www.unccd.int/official-documentscop-12-ankara-2015/3cop12 (accessed on 18 April 2026).
- Food and Agriculture Organization (FAO). Revised World Soil Charter. Available online: https://openknowledge.fao.org/server/api/core/bitstreams/65be618a-f5e8-4f67-9cbb-d77f1f5cd31e/content (accessed on 18 April 2026).
- Ramsar Convention on Wetlands. Available online: https://www.ramsar.org/ (accessed on 18 April 2026).
- Georgetown Law. Georgetown Climate Center. State Adaptation Progress Tracker. Available online: https://www.georgetownclimate.org/adaptation/plans.html (accessed on 9 March 2026).


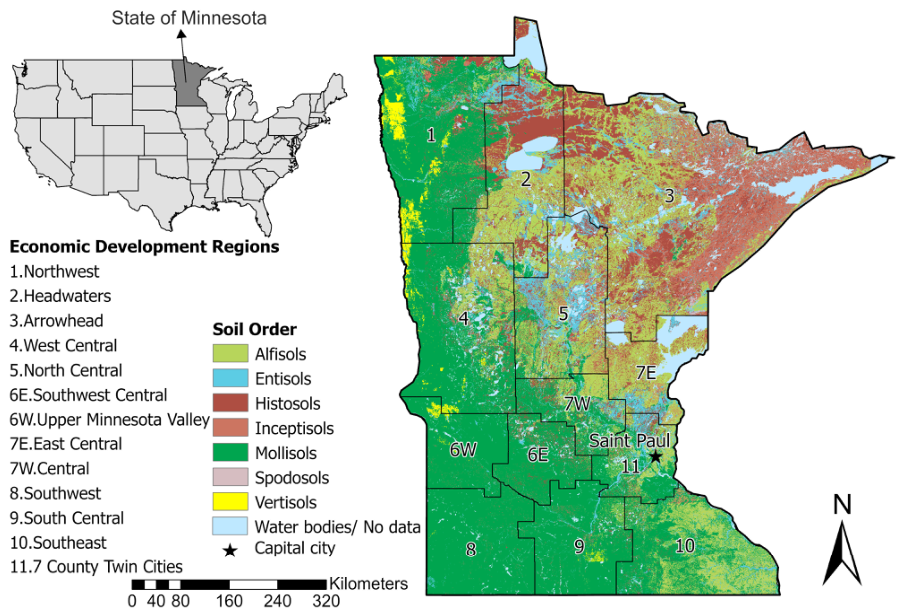



| Soil Capability | Area (2024) | Area (2024) | |
|---|---|---|---|
| Soil Order | General Characteristics and Constraints | (km2) | (%) |
| Entisols | Embryonic soils with an ochric epipedon | 11,939.4 | 7.1 |
| Inceptisols | Young soils with an ochric or umbric epipedon | 15,878.3 | 9.4 |
| Histosols | Organic soils with ≥20% organic carbon | 22,377.6 | 13.2 |
| Vertisols | Soils with swelling clays | 3618.3 | 2.1 |
| Alfisols | Clay-enriched B horizon with B.S. ≥ 35% | 33,055.4 | 19.5 |
| Mollisols | Carbon-enriched soils with B.S. ≥ 50% | 82,240.0 | 48.6 |
| Spodosols | Coarse-textured soils with albic and spodic horizons | 37.5 | 0 |
| Soil Quality Continuum | |||||||||
|---|---|---|---|---|---|---|---|---|---|
| NLCD Land Cover Classes (LULC), Soil Health Continuum | 2024 Total Area by LULC (km2) | Degree of Weathering and Soil Development (Inherent Soil Quality; Soil Suitability) | |||||||
| Entisols | Inceptisols | Histosols | Vertisols | Alfisols | Mollisols | Spodosols | |||
| 2024 Area by Soil Order (km2) | |||||||||
| Woody wetlands | Higher | 28,083.5 | 3165.8 | 4054.8 | 14,245.2 | 49.3 | 4868.6 | 1694.9 | 4.9 |
| Shrub/Scrub |  | 923.4 | 155.2 | 337.0 | 31.4 | 0 | 375 | 24.7 | 0.1 |
| Mixed forest | 6070.2 | 915.1 | 2953.5 | 225.6 | 0 | 1842.9 | 112.2 | 20.9 | |
| Deciduous forest | 18,853.9 | 2249.8 | 2931.7 | 821.3 | 12.9 | 9526.8 | 3310.5 | 0.9 | |
| Herbaceous | 572.9 | 92.5 | 109.3 | 11.2 | 0.9 | 150.7 | 208.2 | 0 | |
| Evergreen forest | 3194.9 | 837.8 | 1509.7 | 112.5 | 0 | 663.4 | 61 | 10.5 | |
| Emergent herbaceous wetlands | 12,932.3 | 911.4 | 1011.1 | 5618.9 | 37.7 | 1027.7 | 4325.4 | 0 | |
| Hay/Pasture | 11,980.7 | 1009.1 | 541.2 | 325.0 | 36.5 | 4344.2 | 5724.8 | 0 | |
| Cultivated crops | 74,858.4 | 1278.1 | 1753.6 | 636.5 | 3233.7 | 7628.7 | 60,327.8 | 0 | |
| Developed, open space | 5372.4 | 470.2 | 326.1 | 179.7 | 64.3 | 1194.6 | 3137.5 | 0 | |
| Developed, low intensity | 4509.7 | 478.8 | 253.2 | 145.8 | 148.4 | 1050.5 | 2432.9 | 0 | |
| Developed, medium intensity | 1260.6 | 205.6 | 52.3 | 15.8 | 25.8 | 285.9 | 675.2 | 0 | |
| Developed, high intensity | 265.4 | 81.6 | 8.8 | 2.3 | 4.8 | 40 | 127.8 | 0 | |
| Barren land | Lower | 268.3 | 88.4 | 36.2 | 6.3 | 3.9 | 56.3 | 77.2 | 0 |
| Totals | 169,146.6 | 11,939.4 | 15,878.3 | 22,377.6 | 3618.3 | 33,055.40 | 82,240.00 | 37.5 | |
| Soil Order | Total Area | Anthropogenically Degraded Land | Types of Anthropogenic Degradation | Potential Land for Nature-Based Solutions | |||
|---|---|---|---|---|---|---|---|
| Barren | Developed | Agriculture | |||||
| (km2) | (%) | (km2) | (km2) | (km2) | (km2) | (km2) | |
| Entisols | 11,939 | 7.1 | 3612 (+1.9) | 88 (+25.2) | 1236 (+8.8) | 2287 (−2.1) | 336 (−22.9) |
| Inceptisols | 15,878 | 9.4 | 2971 (+3.0) | 36 (+95.9) | 640 (+11.3) | 2295 (+0.1) | 482 (−45.7) |
| Histosols | 22,378 | 13.2 | 1311 (+1.2) | 6 (+22.3) | 344 (+6.1) | 961 (−0.5) | 49 (−13.4) |
| Vertisols | 3618 | 2.1 | 3517 (+0.1) | 4 (0) | 243 (+10.8) | 3270 (−0.6) | 5 (+0.9) |
| Alfisols | 33,055 | 19.5 | 14,600 (+0.6) | 56 (+126.7) | 2571 (+13.0) | 11,973 (−1.9) | 582 (−24.1) |
| Mollisols | 82,240 | 48.6 | 72,503 (+0.3) | 77 (+104.0) | 6373 (+12.3) | 66,053 (−0.8) | 310 (+0.9) |
| Spodosols | 37 | 0 | 0 (0) | 0 (0) | 0 (0) | 0 (0) | 0 (0) |
| All Soils | |||||||
| Totals | 169,147 | 100.0 | 98,516 (+0.5) | 268 (+66.7) | 11,408 (+11.8) | 86,839 (−1.0) | 1765 (−28.3) |
| Soil Quality Continuum | |||||||||
|---|---|---|---|---|---|---|---|---|---|
| NLCD Land Cover Classes (LULC), Soil Health Continuum | Change in Area, 2001–2024 (%) | Degree of Weathering and Soil Development (Inherent Soil Quality; Soil Suitability) | |||||||
| Entisols | Inceptisols | Histosols | Vertisols | Alfisols | Mollisols | Spodosols | |||
| Change in Area, 2001–2024 (%) | |||||||||
| Woody wetlands | Higher | −1.9 | −2.7 | −0.9 | −2.1 | −2.2 | −1.0 | −3.7 | 0.5 |
| Shrub/Scrub |  | −28.9 | −18.4 | −36.8 | 2.3 | 42.9 | −25.6 | −37.3 | −46.7 |
| Mixed forest | −8.3 | −4.5 | −6.2 | −5.9 | 190.1 | −13.4 | −8.8 | −7.9 | |
| Deciduous forest | 6.6 | 7.2 | 25.1 | 1.4 | −7.6 | 5.1 | −1.5 | 6.9 | |
| Herbaceous | −42.8 | −47.3 | −67.5 | −45.7 | 475 | −36.7 | −9.5 | −38.8 | |
| Evergreen forest | −5.6 | −5.6 | −3.0 | −8.7 | 29.6 | −10.7 | −9.9 | 21.0 | |
| Emergent herbaceous wetlands | 3.6 | 9.5 | 3.0 | 5.9 | −5.9 | 8.5 | −1.1 | −7.4 | |
| Hay/Pasture | 2.8 | −1.2 | −2.5 | 2.2 | 54 | −1.2 | 7.3 | 0.0 | |
| Cultivated crops | −1.5 | −2.9 | 0.9 | −1.8 | −1.0 | −2.4 | −1.5 | 0 | |
| Developed, open space | −1.2 | −0.5 | −0.7 | −4.3 | −24.9 | 1 | −1.3 | 0 | |
| Developed, low intensity | 25.3 | 17.6 | 24.6 | 17.7 | 33.9 | 24.3 | 27.4 | 1.0 | |
| Developed, medium intensity | 30.2 | 11.0 | 41.2 | 48.2 | 31 | 30.9 | 35.7 | 200.0 | |
| Developed, high intensity | 33.6 | 14.8 | 35.3 | 60.5 | 39.1 | 40.3 | 45.8 | 0 | |
| Barren land | Lower | 66.6 | 25.2 | 95.9 | 22.3 | −4.9 | 126.7 | 104.0 | 2.9 |
| Parameter | 2024 Total | Degree of Weathering and Soil Development | ||||||
|---|---|---|---|---|---|---|---|---|
| Entisols | Inceptisols | Histosols | Vertisols | Alfisols | Mollisols | Spodosols | ||
| 2024 Area (km2) | 169,146.6 | 11,939.4 | 15,878.3 | 22,377.6 | 3618.3 | 33,055.4 | 82,240.0 | 37.5 |
| Soil organic carbon (SOC): | ||||||||
| Minimum (kg of C) | 2.1 × 10¹² | 2.1 × 10¹⁰ | 4.4 × 10¹⁰ | 1.4 × 10¹² | 2.0 × 10¹⁰ | 7.6 × 10¹⁰ | 4.9 × 10¹¹ | 1.1 × 10⁸ |
| Midpoint (kg of C) | 4.8 × 10¹² | 9.6 × 10¹⁰ | 1.4 × 10¹¹ | 3.1 × 10¹² | 5.3 × 10¹⁰ | 2.5 × 10¹¹ | 1.1 × 10¹² | 4.6 × 10⁸ |
| Maximum (kg of C) | 8.4 × 10¹² | 1.9 × 10¹¹ | 2.8 × 10¹¹ | 5.5 × 10¹² | 9.2 × 10¹⁰ | 4.7 × 10¹¹ | 1.9 × 10¹² | 9.6 × 10⁸ |
| Minimum (SC-CO2, $, USD) | $380.4B | $3.8B | $8.1B | $262.30B | $3.6B | $13.9B | $88.8B | $19.9M |
| Midpoint (SC-CO2, $, USD) | $877.7B | $17.6B | $25.9B | $574.9B | $9.8B | $45.6B | $203.9B | $84.7M |
| Maximum (SC-CO2, $, USD) | $1.5T | $34.6B | $50.7B | $1.0T | $16.9B | $85.6B | $343.8B | $175.3M |
| Soil inorganic carbon (SIC): | ||||||||
| Minimum (kg of C) | 5.6 × 10¹¹ | 2.3 × 10¹⁰ | 4.0 × 10¹⁰ | 1.3 × 10¹⁰ | 3.7 × 10¹⁰ | 4.3 × 10¹⁰ | 4.0 × 10¹¹ | 7.5 × 10⁶ |
| Midpoint (kg of C) | 1.4 × 10¹² | 5.7 × 10¹⁰ | 8.1 × 10¹⁰ | 5.4 × 10¹⁰ | 8.4 × 10¹⁰ | 1.4 × 10¹¹ | 9.5 × 10¹¹ | 2.2 × 10⁷ |
| Maximum (kg of C) | 2.4 × 10¹² | 1.0 × 10¹¹ | 1.3 × 10¹¹ | 1.1 × 10¹¹ | 1.4 × 10¹¹ | 2.7 × 10¹¹ | 1.6 × 10¹² | 4.1 × 10⁷ |
| Minimum (SC-CO2, $, USD) | $102.7B | $4.2B | $7.3B | $2.5B | $6.8B | $7.9B | $74.0B | $1.5M |
| Midpoint (SC-CO2, $, USD) | $250.3B | $10.5B | $14.9B | $9.8B | $15.4B | $26.1B | $173.5B | $4.1M |
| Maximum (SC-CO2, $, USD) | $435.0B | $18.4B | $24.5B | $20.6B | $25.4B | $49.3B | $296.9B | $7.5M |
| Total soil carbon (TSC): | ||||||||
| Minimum (kg of C) | 2.6 × 10¹² | 4.4 × 10¹⁰ | 8.4 × 10¹⁰ | 1.4 × 10¹² | 5.7 × 10¹⁰ | 1.2 × 10¹¹ | 8.9 × 10¹¹ | 1.2 × 10⁸ |
| Midpoint (kg of C) | 6.1 × 10¹² | 1.5 × 10¹¹ | 2.2 × 10¹¹ | 3.2 × 10¹² | 1.4 × 10¹¹ | 3.9 × 10¹¹ | 2.1 × 10¹² | 4.8 × 10⁸ |
| Maximum (kg of C) | 1.1 × 10¹³ | 2.9 × 10¹¹ | 4.1 × 10¹¹ | 5.6 × 10¹² | 2.3 × 10¹¹ | 7.3 × 10¹¹ | 3.5 × 10¹² | 1.0 × 10⁹ |
| Minimum (SC-CO2, $, USD) | $483.3B | $8.1B | $15.4B | $264.7B | $10.4B | $21.8B | $162.8B | $21.4M |
| Midpoint (SC-CO2, $, USD) | $1.1T | $27.9B | $40.8B | $584.7B | $25.1B | $71.4B | $376.7B | $88.8M |
| Maximum (SC-CO2, $, USD) | $2.0T | $53.1B | $75.2B | $1.0T | $42.3B | $134.5B | $640.6B | $182.8M |
Disclaimer/Publisher’s Note: The statements, opinions and data contained in all publications are solely those of the individual author(s) and contributor(s) and not of MDPI and/or the editor(s). MDPI and/or the editor(s) disclaim responsibility for any injury to people or property resulting from any ideas, methods, instructions or products referred to in the content. |
© 2026 by the authors. Licensee MDPI, Basel, Switzerland. This article is an open access article distributed under the terms and conditions of the Creative Commons Attribution (CC BY) license.
Share and Cite
Mikhailova, E.A.; Zurqani, H.A.; Lin, L.; Hao, Z.; Post, C.J.; Schlautman, M.A.; Carbajales-Dale, P.; Post, G.C.; Shepherd, G.B. Geospatial Assessment of Soil–Biosphere Nexus Using a Biophysical Soil Security Matrix: Evidence from Minnesota, USA. Biosphere 2026, 2, 10. https://doi.org/10.3390/biosphere2030010
Mikhailova EA, Zurqani HA, Lin L, Hao Z, Post CJ, Schlautman MA, Carbajales-Dale P, Post GC, Shepherd GB. Geospatial Assessment of Soil–Biosphere Nexus Using a Biophysical Soil Security Matrix: Evidence from Minnesota, USA. Biosphere. 2026; 2(3):10. https://doi.org/10.3390/biosphere2030010
Chicago/Turabian StyleMikhailova, Elena A., Hamdi A. Zurqani, Lili Lin, Zhenbang Hao, Christopher J. Post, Mark A. Schlautman, Patricia Carbajales-Dale, Gregory C. Post, and George B. Shepherd. 2026. "Geospatial Assessment of Soil–Biosphere Nexus Using a Biophysical Soil Security Matrix: Evidence from Minnesota, USA" Biosphere 2, no. 3: 10. https://doi.org/10.3390/biosphere2030010
APA StyleMikhailova, E. A., Zurqani, H. A., Lin, L., Hao, Z., Post, C. J., Schlautman, M. A., Carbajales-Dale, P., Post, G. C., & Shepherd, G. B. (2026). Geospatial Assessment of Soil–Biosphere Nexus Using a Biophysical Soil Security Matrix: Evidence from Minnesota, USA. Biosphere, 2(3), 10. https://doi.org/10.3390/biosphere2030010