Article

Monitoring Wise Use of Wetlands During Land Conversion for the Ramsar Convention on Wetlands: A Case Study of the Contiguous United States of America (USA)

1
Department of Forestry and Environmental Conservation, Clemson University, Clemson, SC 29634, USA
2
College of Forestry, Agriculture, and Natural Resources, University of Arkansas at Monticello, Monticello, AR 71656, USA
3
The Libyan Center for Palm Tree Research, Libyan Authority for Scientific Research, Tripoli 00218, Libya
4
Department of Biological Science and Biotechnology, Minnan Normal University, Zhangzhou 363000, China
5
Department of Electronic Information, Zhangzhou Institute of Technology, Zhangzhou 363000, China
6
Department of Environmental Engineering and Earth Sciences, Clemson University, Anderson, SC 29625, USA
7
Clemson Center for Geospatial Technologies, Clemson University, Anderson, SC 29625, USA
8
School of Law, Emory University, Atlanta, GA 30322, USA
*
Author to whom correspondence should be addressed.
Biosphere 2025, 1(1), 2; https://doi.org/10.3390/biosphere1010002
Submission received: 5 February 2025 / Revised: 4 March 2025 / Accepted: 11 March 2025 / Published: 16 March 2025

Abstract

:
Wetlands provide the world with important ecosystem services (ES) including carbon (C) storage. The Ramsar Convention (RC) is the only global treaty on wetlands outside of the United Nations (UN) with 172 contracting parties across the world as of 2025. The goals of the convention are to promote the wise use and conservation of wetlands, designation of suitable wetlands as wetlands of international importance, and international cooperation. The problem is that there is no consensus for standard global analysis, which is needed to ensure wetlands conservation. The novelty of this study is the use of methodology that combines satellite-based land cover change analysis with high-resolution spatial databases to help understand the change in wetlands area over time and identify potential hotspots for C loss. Greenhouse gas (GHG) emissions from wetland conversions represent “transboundary” damages. Therefore, C loss from wetlands conversions can be expressed through the “realized” social cost of C (SC-CO2) which is a conservative estimate of the damages caused by carbon dioxide (CO2) release. A case study of the contiguous United States of America (USA) using raster analysis within ArcGIS Pro showed key findings that almost 53% of the wetlands area was lost between 1780 and 1980, starting with 894,880.7 km2 in 1780 and falling to 422,388.2 km2 in 1980. This net loss generated damages including midpoint total soil C loss (6.7 × 10¹³ kg of C) with associated midpoint “realized” social costs of C (SC-CO2) value of $11.4T (where T = trillion = 1012, $ = United States dollars, USD). Recent analysis of the contiguous USA (2001–2021) revealed wetlands area losses and damages in all states. The newly demonstrated method for rapid monitoring of wetlands changes over time can be integrated into systems for worldwide monitoring to support the RC wise use concept.

1. Introduction

1.1. Background Information About the Ramsar Convention

Wetlands are unique ecosystems of global significance, which require protection [1]. The Ramsar Convention (RC) is the only global treaty on wetlands outside of the United Nations (UN) with 172 contracting parties worldwide as of 2025 [2,3]. The goals of the convention are to promote the wise use and conservation of wetlands, the designation of suitable wetlands as wetlands of international importance, and international cooperation [2,3]. The RC states that “wetlands are areas of marsh, fen, peatland or water, whether natural or artificial, permanent or temporary, with water that is static or flowing, fresh, brackish or salt, including areas of marine water the depth of which at low tide does not exceed six metres” [2]. Although RC promotes the conservation of all wetlands, it also requires that each contracting party picks suitable wetlands from its area to be included in a “List of Wetlands of International Importance” [2]. The original RC document mentions the wise use of wetlands, but it does not define it [2]. The definition of wise use was adopted in 1987 at the Third Meeting of the Conference of Contracting Parties [4], which states that:
  • The wise use of wetlands is their sustainable utilization for the benefit of humankind in a way compatible with the maintenance of the natural properties of the ecosystem”.
  • Sustainable utilization is defined as “human use of a wetland so that it may yield the greatest continuous benefit to present generations while maintaining its potential to meet the needs and aspirations of future generations”.
  • Natural properties of the ecosystem are defined as “those physical, biological or chemical components, such as soil, water, plants, animals and nutrients, and the interactions between them”.
Interpretation and implementation of wise use of wetlands is specific to a contracting party with its individual policy and legislation as applied to RC [5]. Current RC worldwide monitoring is focused on the ~2300 nationally designated wetland sites and is not a comprehensive system to monitor overall wetlands within participating countries [6]. Although the RC website is still in development, it appears future development will be focused on data related to threats to the nationally designated wetland sites and not wetlands in general. Monitoring the designated wetlands sites is useful, but it does not include monitoring all existing wetlands over time to provide a more holistic picture of how RC countries support the wise-use pledges. Monitoring of wetlands, including the Ramsar sites, should leverage remote sensing analysis to help evaluate wetland resources over time.

1.2. Brief History of Wetlands Losses in the United States of America (USA)

There is a need to explore opportunities to enhance monitoring of wise use by contracting parties, and this study uses the present-day United States of America (USA) as a case study because it covers a large geographic area with numerous wetlands and 41 Ramsar sites [7]. During Colonial times in America, the area presently comprising the 50 different USA states had approximately 1,586,368 km2 of wetlands with 894,355 km2 of wetlands located in the present-day contiguous 48 states [8]. In addition, Alaska and Hawaii contained 687,966 km2 and 239 km2 respectively [8].
The USA experienced an enormous loss of wetlands between the years 1780 to 1980, primarily due to agricultural expansion, with almost 53% of the wetlands area in the contiguous USA lost between 1780 and 1980, starting with 894,880.7 km2 in 1780 and falling to 422,388.2 km2 in 1980 [8]. Wetlands losses were highly variable by location, with present-day Florida losing the most wetlands area (compared to other states) and present-day California losing the highest percentage of the original area of wetlands within the state (Figure 1). Twenty-two states experienced more than 50% loss of the original area of wetlands [8]. This historical analysis by Dahl (1990) [8] used early wetland estimates from state-level reports and not spatially explicit efforts. The rapid disappearance of wetlands (over just a 200-year period) had a significant impact not only on the environment (e.g., biodiversity loss, etc.) but also on society (e.g., flooding, etc.) as well [9].
In response to dramatic wetlands losses, the United States (US) adopted a wide range of wetlands-related policy measures and legislation, including establishing 41 US RC sites (Figure 2). Podolski (2001) [5] reviewed the US wetlands policy, legislation, and case law in application to the concept of wise use of the RC. In addition, the US policy also includes the concept of no net loss of wetlands [5,10]. As noted by Podolski (2001) [5], successful compliance with the RC requires better data, including a comprehensive wetlands dataset that is updated and can monitor trends over time.
The most recent report to the US Congress on “Status and Trends of Wetlands in the Conterminous United States 2009 to 2019” [11] found a large net loss of wetlands when compared to the previous report (2004–2009) [12]. The methods used in both reports rely on studying field plots that are randomly distributed across the contiguous US, with a greater density of plots in wetter areas [11]. These plots were analyzed for change between the two years by using expert aerial photo interpreters to evaluate the status using high-resolution (~1 m) aerial photography, combined with limited field visits [11]. This method’s advantage is that manual photo interpretation has a high level of accuracy for the fixed plots that are considered as part of the program; however, this method requires extensive cost and effort that likely does not allow yearly evaluation. The high cost and effort limit the applicability of these methods for countries with fewer resources. Also, by using a statistical sample of the wetland areas (that are kept confidential), the data analysis method does not allow the identification of hotspots of wetland change and does not provide a comprehensive view of wetlands’ status over time because only a subset of wetlands is studied.

1.3. Brief Literature Review and Objectives of the Study

Multiple studies have used remote sensing data to track wetlands over time using various methodologies [13,14,15]. Atesoglu et al. (2025) [13] visually interpreted wetland plots within previously identified wetland areas in Türkiye to track land cover changes between 2000 and 2022. This study also used a land cover change matrix for wetlands, but the study area was limited to plots within existing wetland areas [13]. In another recent study, Shinkarenko and Bartalev (2025) [14] reviewed the various remote sensing technologies that have been used to identify wetland types and characteristics, suggesting the need for new monitoring that includes better differentiation between wetland types. Dahanayake et al. (2024) [15] classified Landsat imagery to track wetland changes in two major wetland areas in Sri Lanka between 2000 and 2021 and found anthropogenic change by examining landcover transitions within zones.
This study’s hypothesis is that wetlands and their changes can be comprehensively monitored over time using satellite remote sensing to estimate damages from wetland conversions. By linking soil data to wetland changes, it is possible to estimate C loss from remote sensing identified changes. The primary objective of this study was to develop a spatial monitoring technique to evaluate the status and change of the wise use of wetlands over time using land cover datasets derived from satellite remote sensing (Multi-Resolution Land Characteristics Consortium (MRLC) [16]) using the contiguous United States of America (USA) as a case study. Sub-objectives included (1) evaluating the historical wetlands losses and damages for the United States of America between 1780 and 1980; (2) determining the wetlands wise use status for 2021 disaggregated by land cover type; (3) quantifying the recent changes in wetlands use and associated damages from 2001 to 2021 (e.g., C loss from wetlands loss to developments and associated “realized” social costs of C (SC-CO2) derived by the United States (US) Environmental Protection Agency (EPA) [17]); and (4) exploring recommendations around legal issues for the wise use of wetlands.

2. Materials and Methods

2.1. Study Area

The study was conducted on wetlands in the 48 states of the contiguous USA, including the US Ramsar wetlands (Figure 3). In 2021, the total area of wetlands (woody wetlands + emergent herbaceous wetlands) in the contiguous USA was 415,864.7 km2. The total wetlands area was highly variable by state, with the state of West Virginia having the smallest area of total wetlands (186.8 km2) and the state of Florida having the largest total wetlands area of 44,042.9 km2. There were regional differences as well, with the following ranking of regions from the smallest wetlands area to the largest wetlands area: West (15,849.3 km2), Northern Plains (32,700.2 km2), East (38,982.6 km2), South Central (58,873.9 km2), Midwest (113,907.2 km2), and Southeast (155,551.8 km2). The contiguous USA was used for this study because of the readily available satellite land cover data and historical information on wetlands changes.

2.2. Geospatial Analysis

Analysis was completed following steps outlined in the flowchart in Figure 4, which included using ArcGIS Pro 3.1 software [18]. Land cover change analysis used the “compute change raster” tool in ArcGIS Pro to compute differences between satellite remote sensing datasets from 2001 and 2021 (Multi-Resolution Land Characteristics Consortium (MRLC) [16]). These data provide 30m resolution land cover layers that are classified from cloud-free Landsat satellite imagery. The contiguous USA was converted to a raster within the contiguous land area boundary [19]. Next, the resulting land cover change raster was combined with the state boundary vector layer to obtain the imagery that included state boundary and land cover change (Figure 4) from 2001 to 2021 using the previously noted “compute change raster” tool. The wetlands land cover (Figure 5) change was calculated based on the attribute table of the image of the state boundary and 2001–2021 land cover conversion, which was subsequently tabulated to determine wetlands land cover change areas using the Zonal Statistics as “Table” tool in ArcGIS Pro. A change matrix was calculated to determine the area of land that was classified as wetlands in 2001 that changed to a non-wetlands category in 2021. This change in wetlands is in contrast to wetland losses, where wetlands are converted to developments. The realized social costs of C (SC-CO2) were calculated using the non-market (fixed) EPA-calculated SC-CO2 of $46 per metric ton of CO2 [17] and soil C values for the soil order of Histosols (soil order typically found in wetlands: organic soils with ≥20% of organic carbon) taken from Guo et al. (2006) [20], which provided the following ranges of total soil C (TSC) values: 64.5—142.5—248.9 kg m−2; 10.88—24.03—41.98 $ m−2 ($ = USD = United States dollar).

3. Results

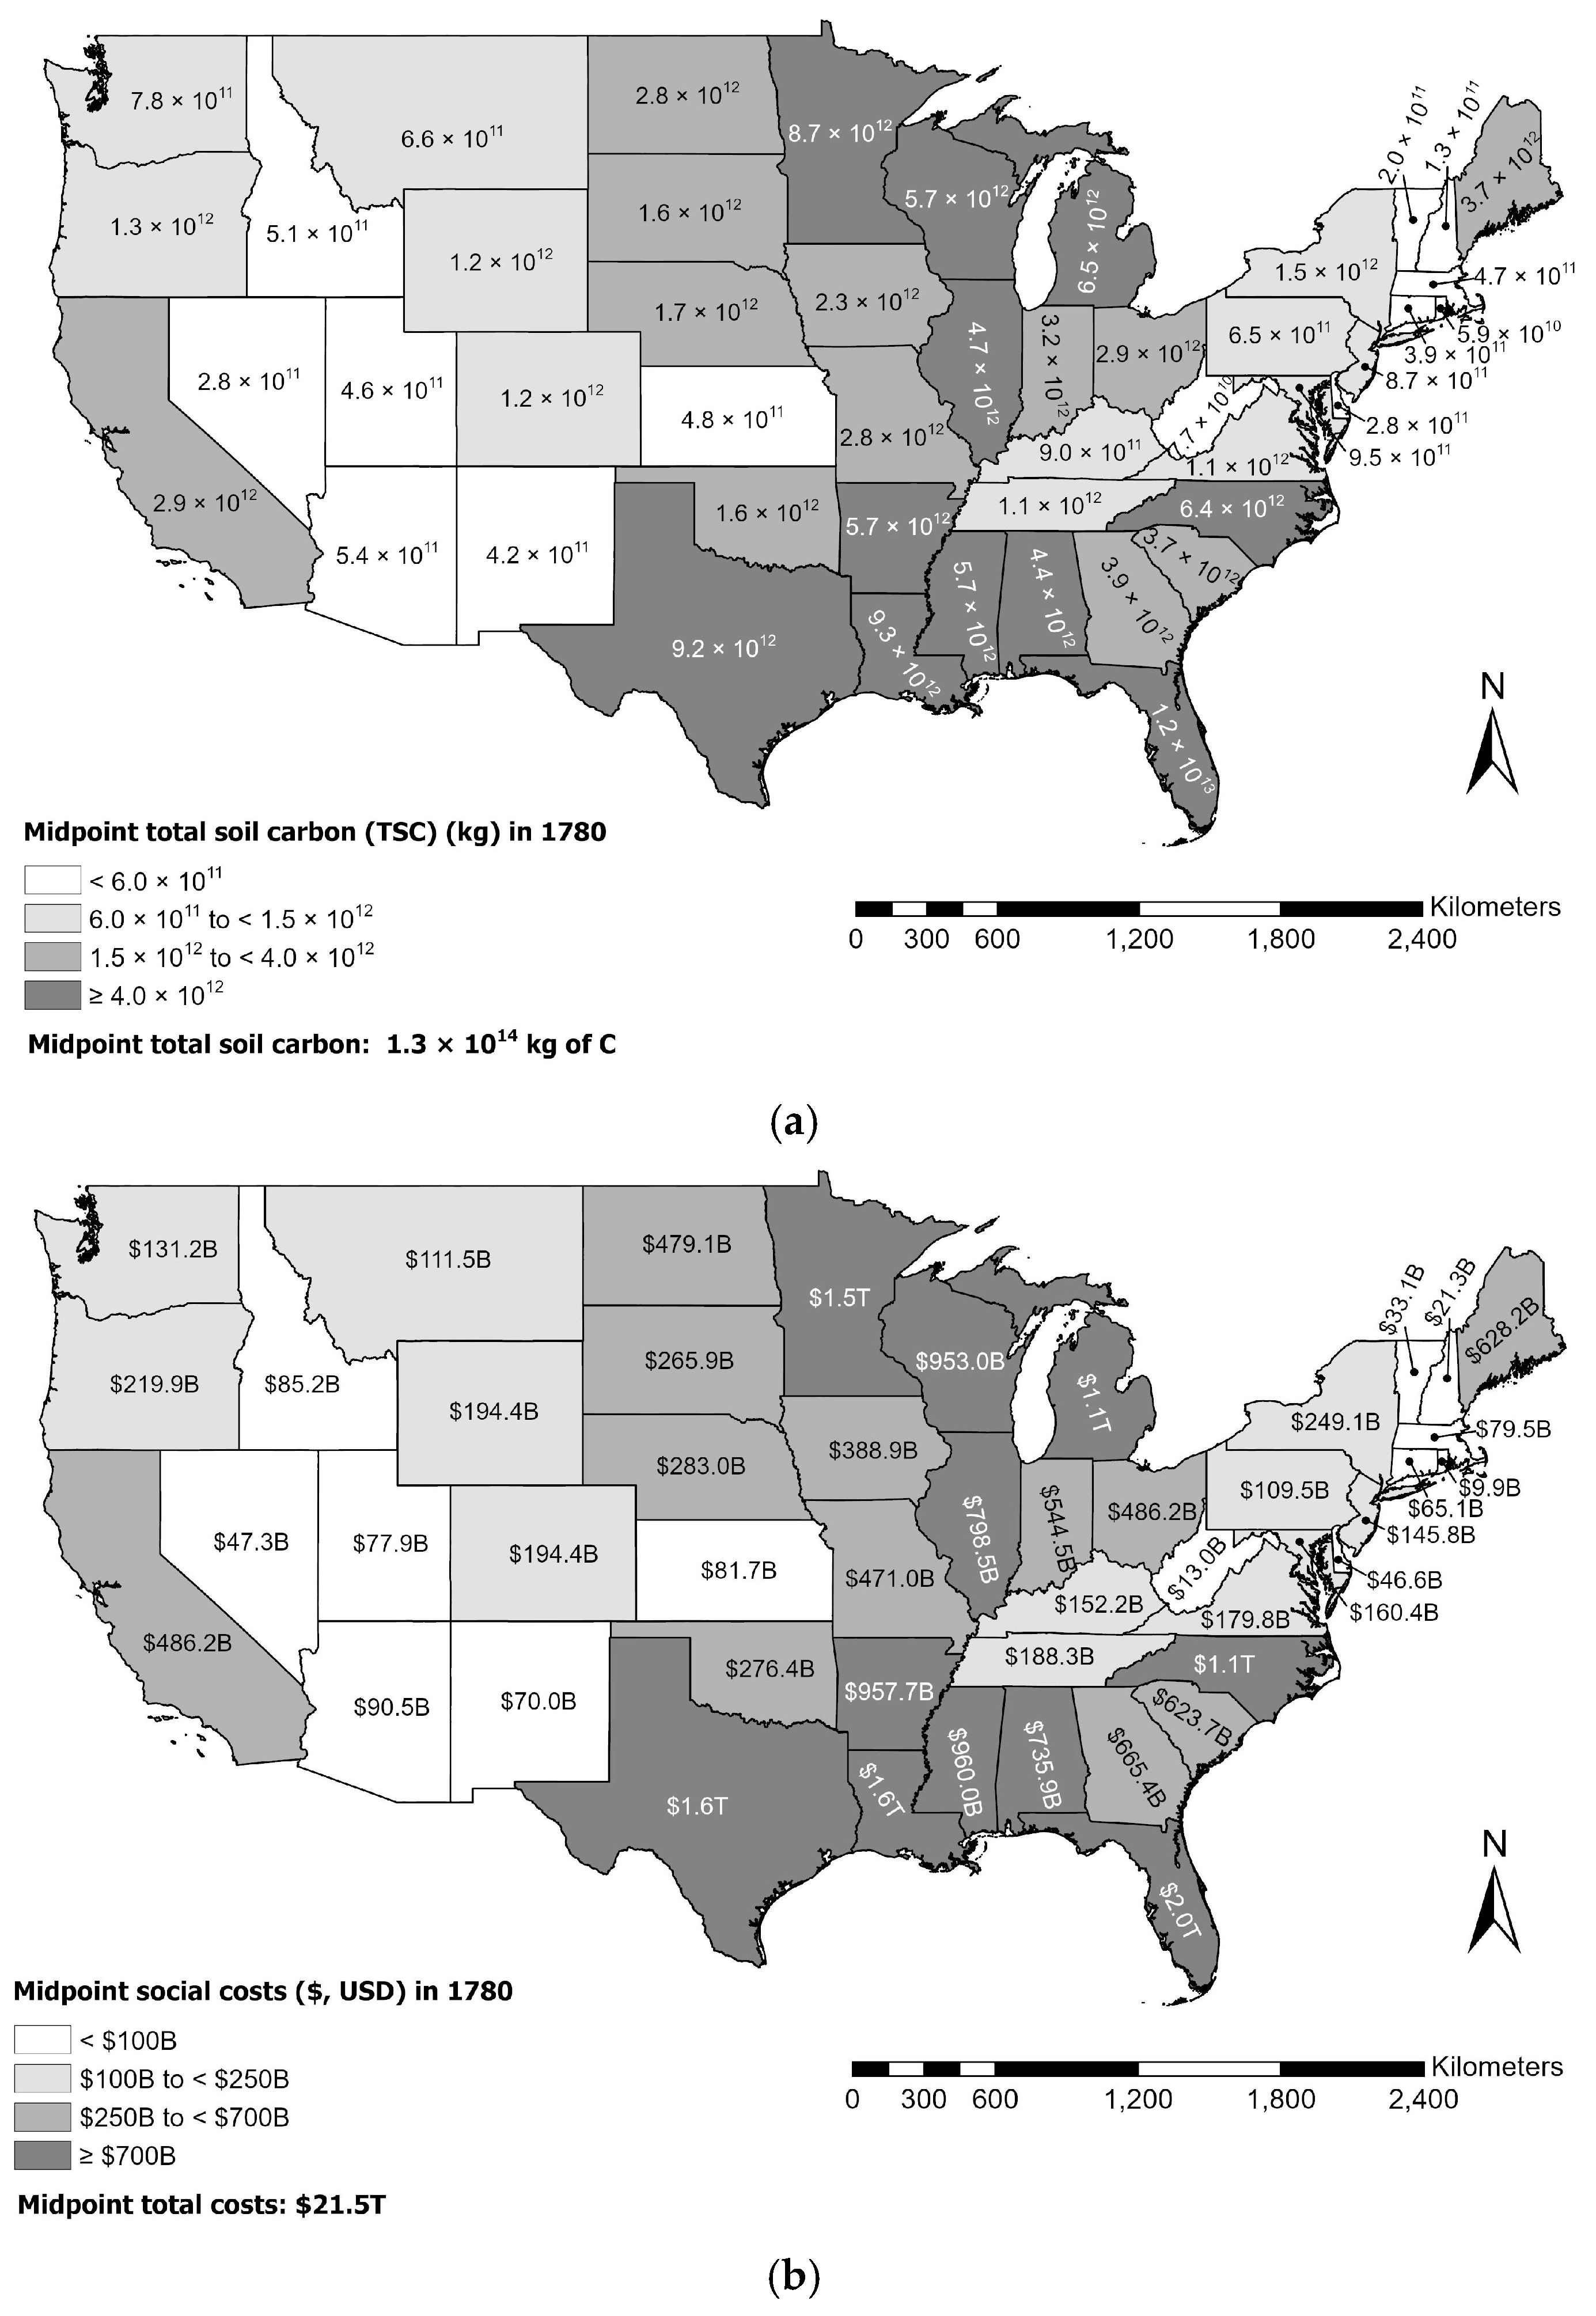
3.1. Historical (1780) Wetlands Soil Carbon (C) Stocks and Social Costs of C (SC-CO2)

Based on the historical wetlands area in 1780 and assuming that they were predominantly composed of the soil order of Histosols, this study estimates that these wetlands contained between 5.8 × 10¹³ kg and 2.2 × 10¹⁴ kg of TSC with a midpoint value of 1.3 × 10¹⁴ kg of TSC (Table S1). These TSC values translate into “avoided” SC-CO2 in the range of $9.7T to $37.6T with a mid-point value of $21.5T (Table S1). The distribution of TSC and “avoided” SC-CO2 values were highly variable within the contiguous US, with the states of FL, LA, and TX having the highest TSC (Figure 6).

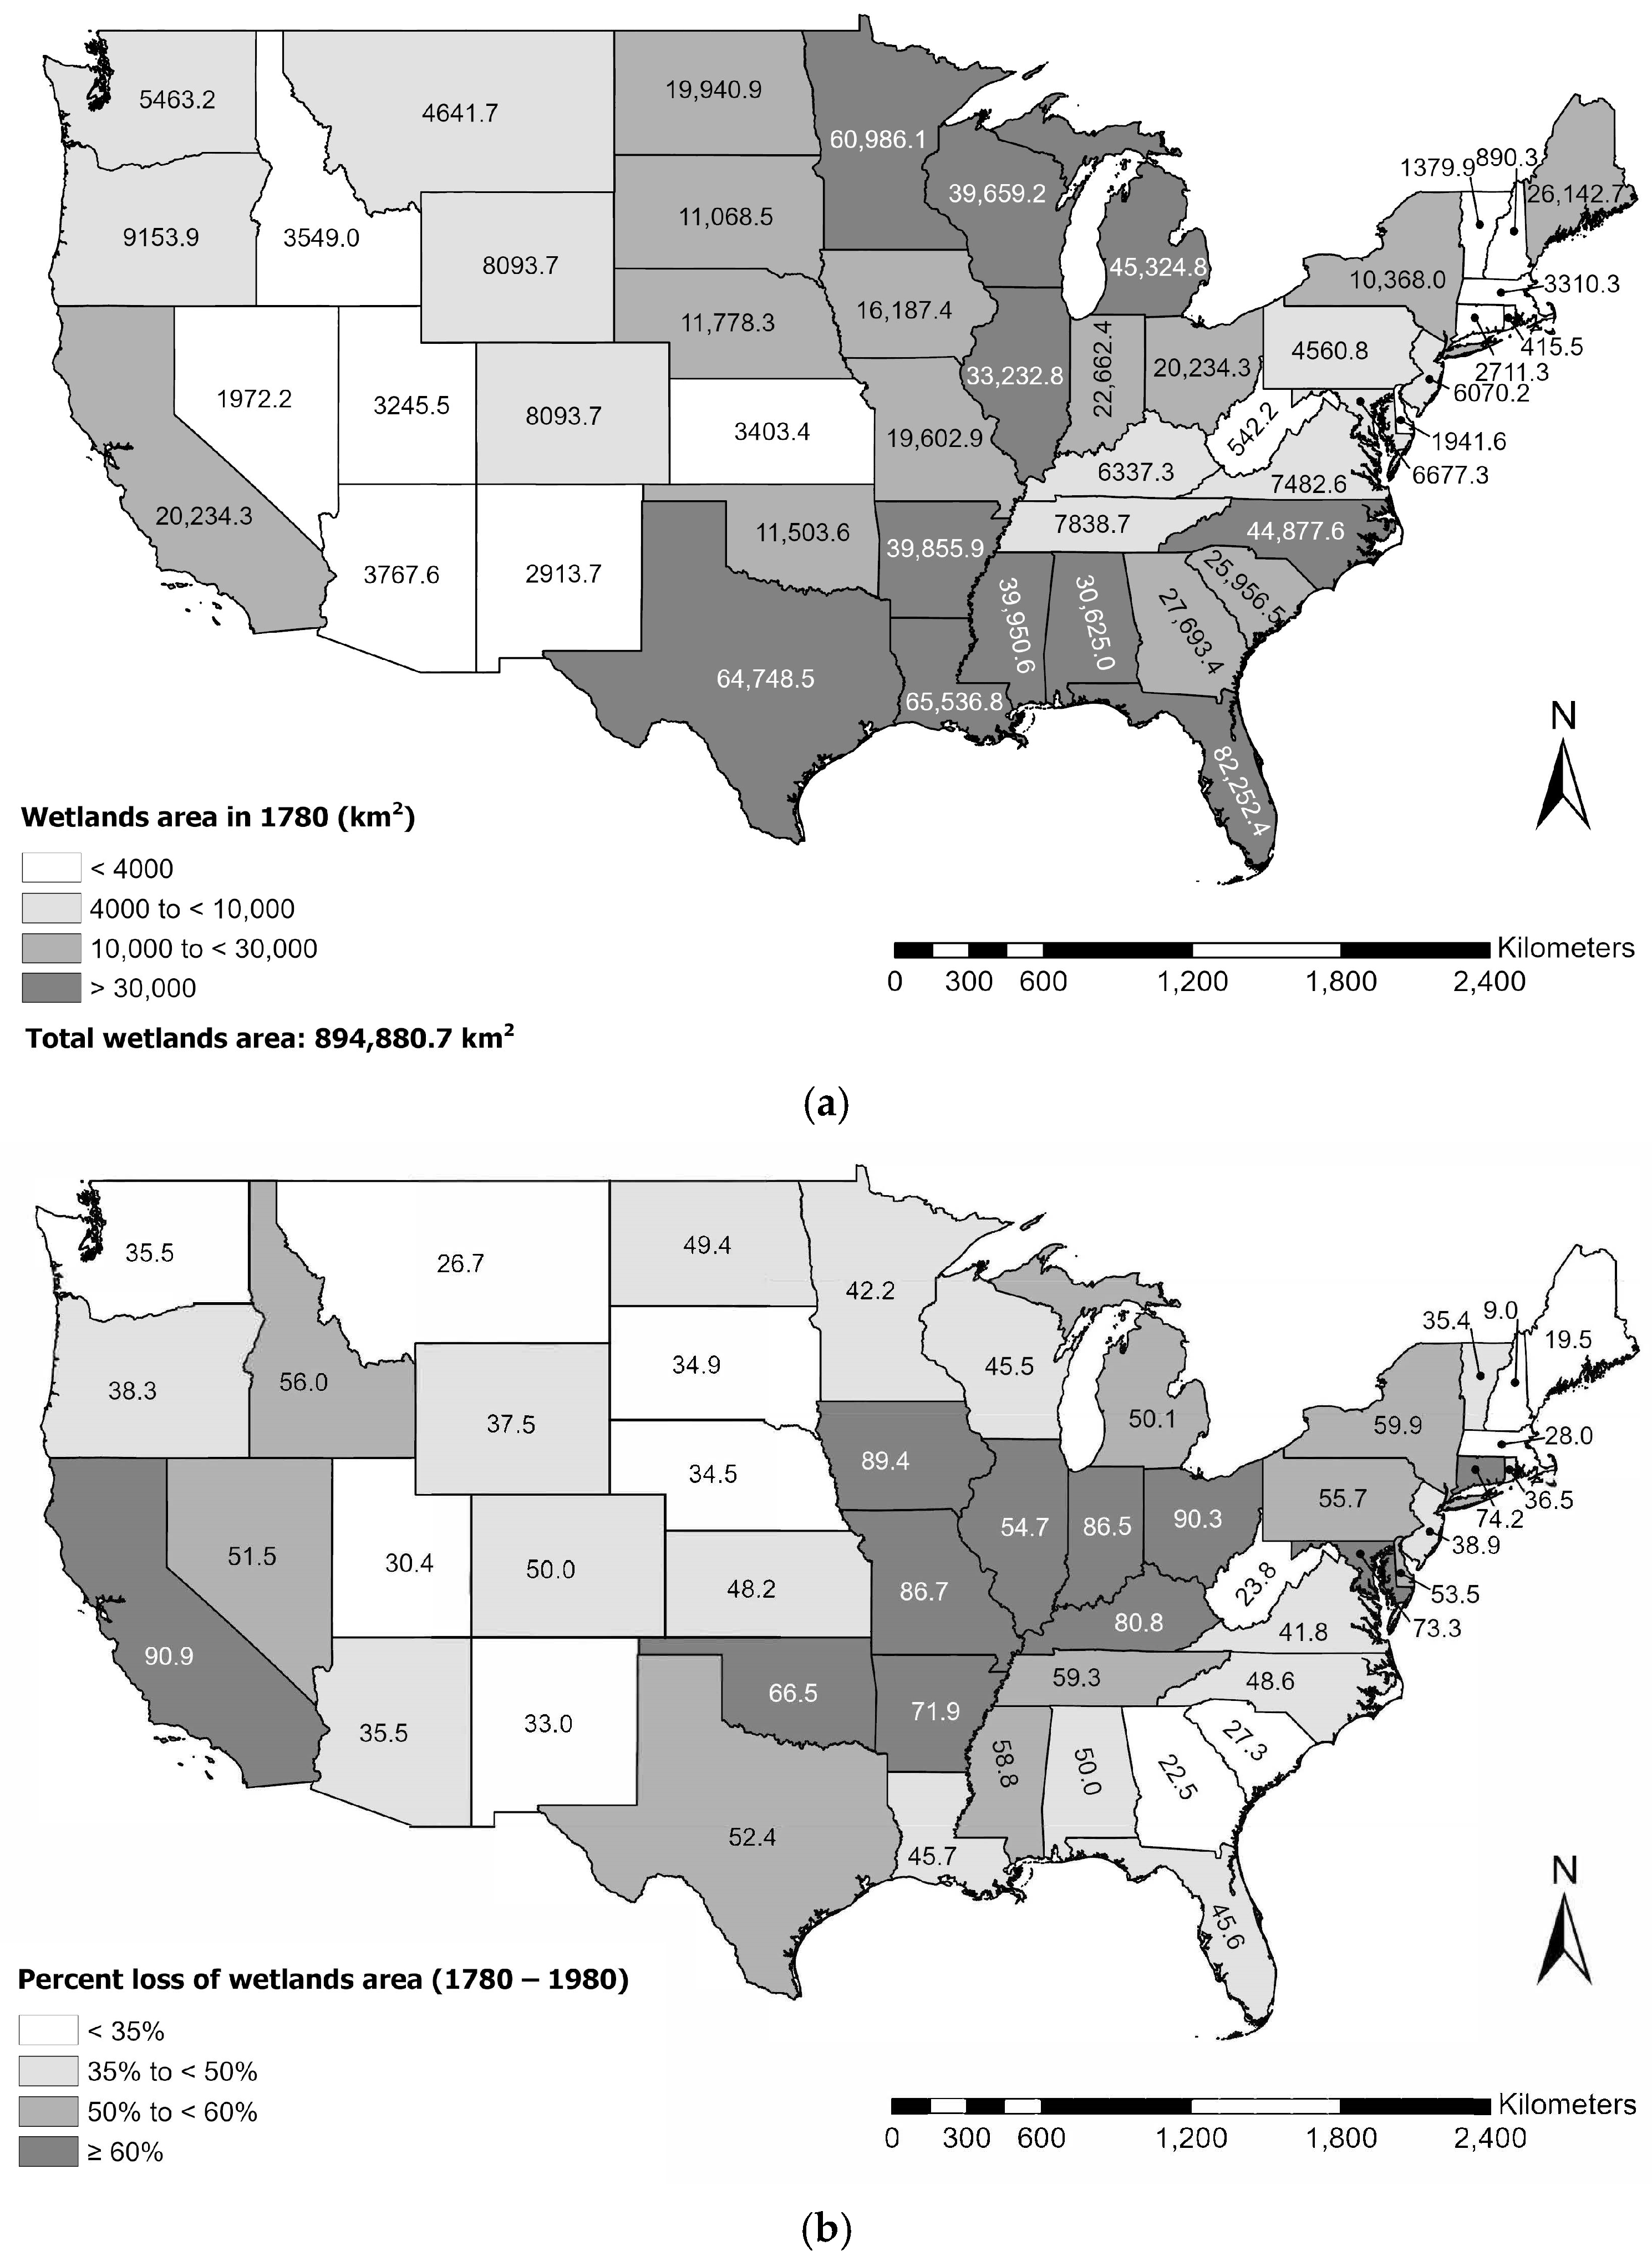
3.2. Historical Wetlands Losses and Damages (1780–1980) in the Contiguous United States of America (USA)

Almost 53% of the wetlands area was lost between 1780 and 1980, starting with 894,880.7 km2 in 1780 and falling to 422,388.2 km2 in 1980 in the contiguous USA. This net loss generated damages, including midpoint total soil C loss (6.7 × 10¹³ kg of C) with an associated midpoint “realized” SC-CO2 value of $11.4T (Table S2). These losses were highly variable within the country with FL, TX, and LA experiencing the largest losses of wetlands area and TSC with associated SC-CO2 values (Figure 7).

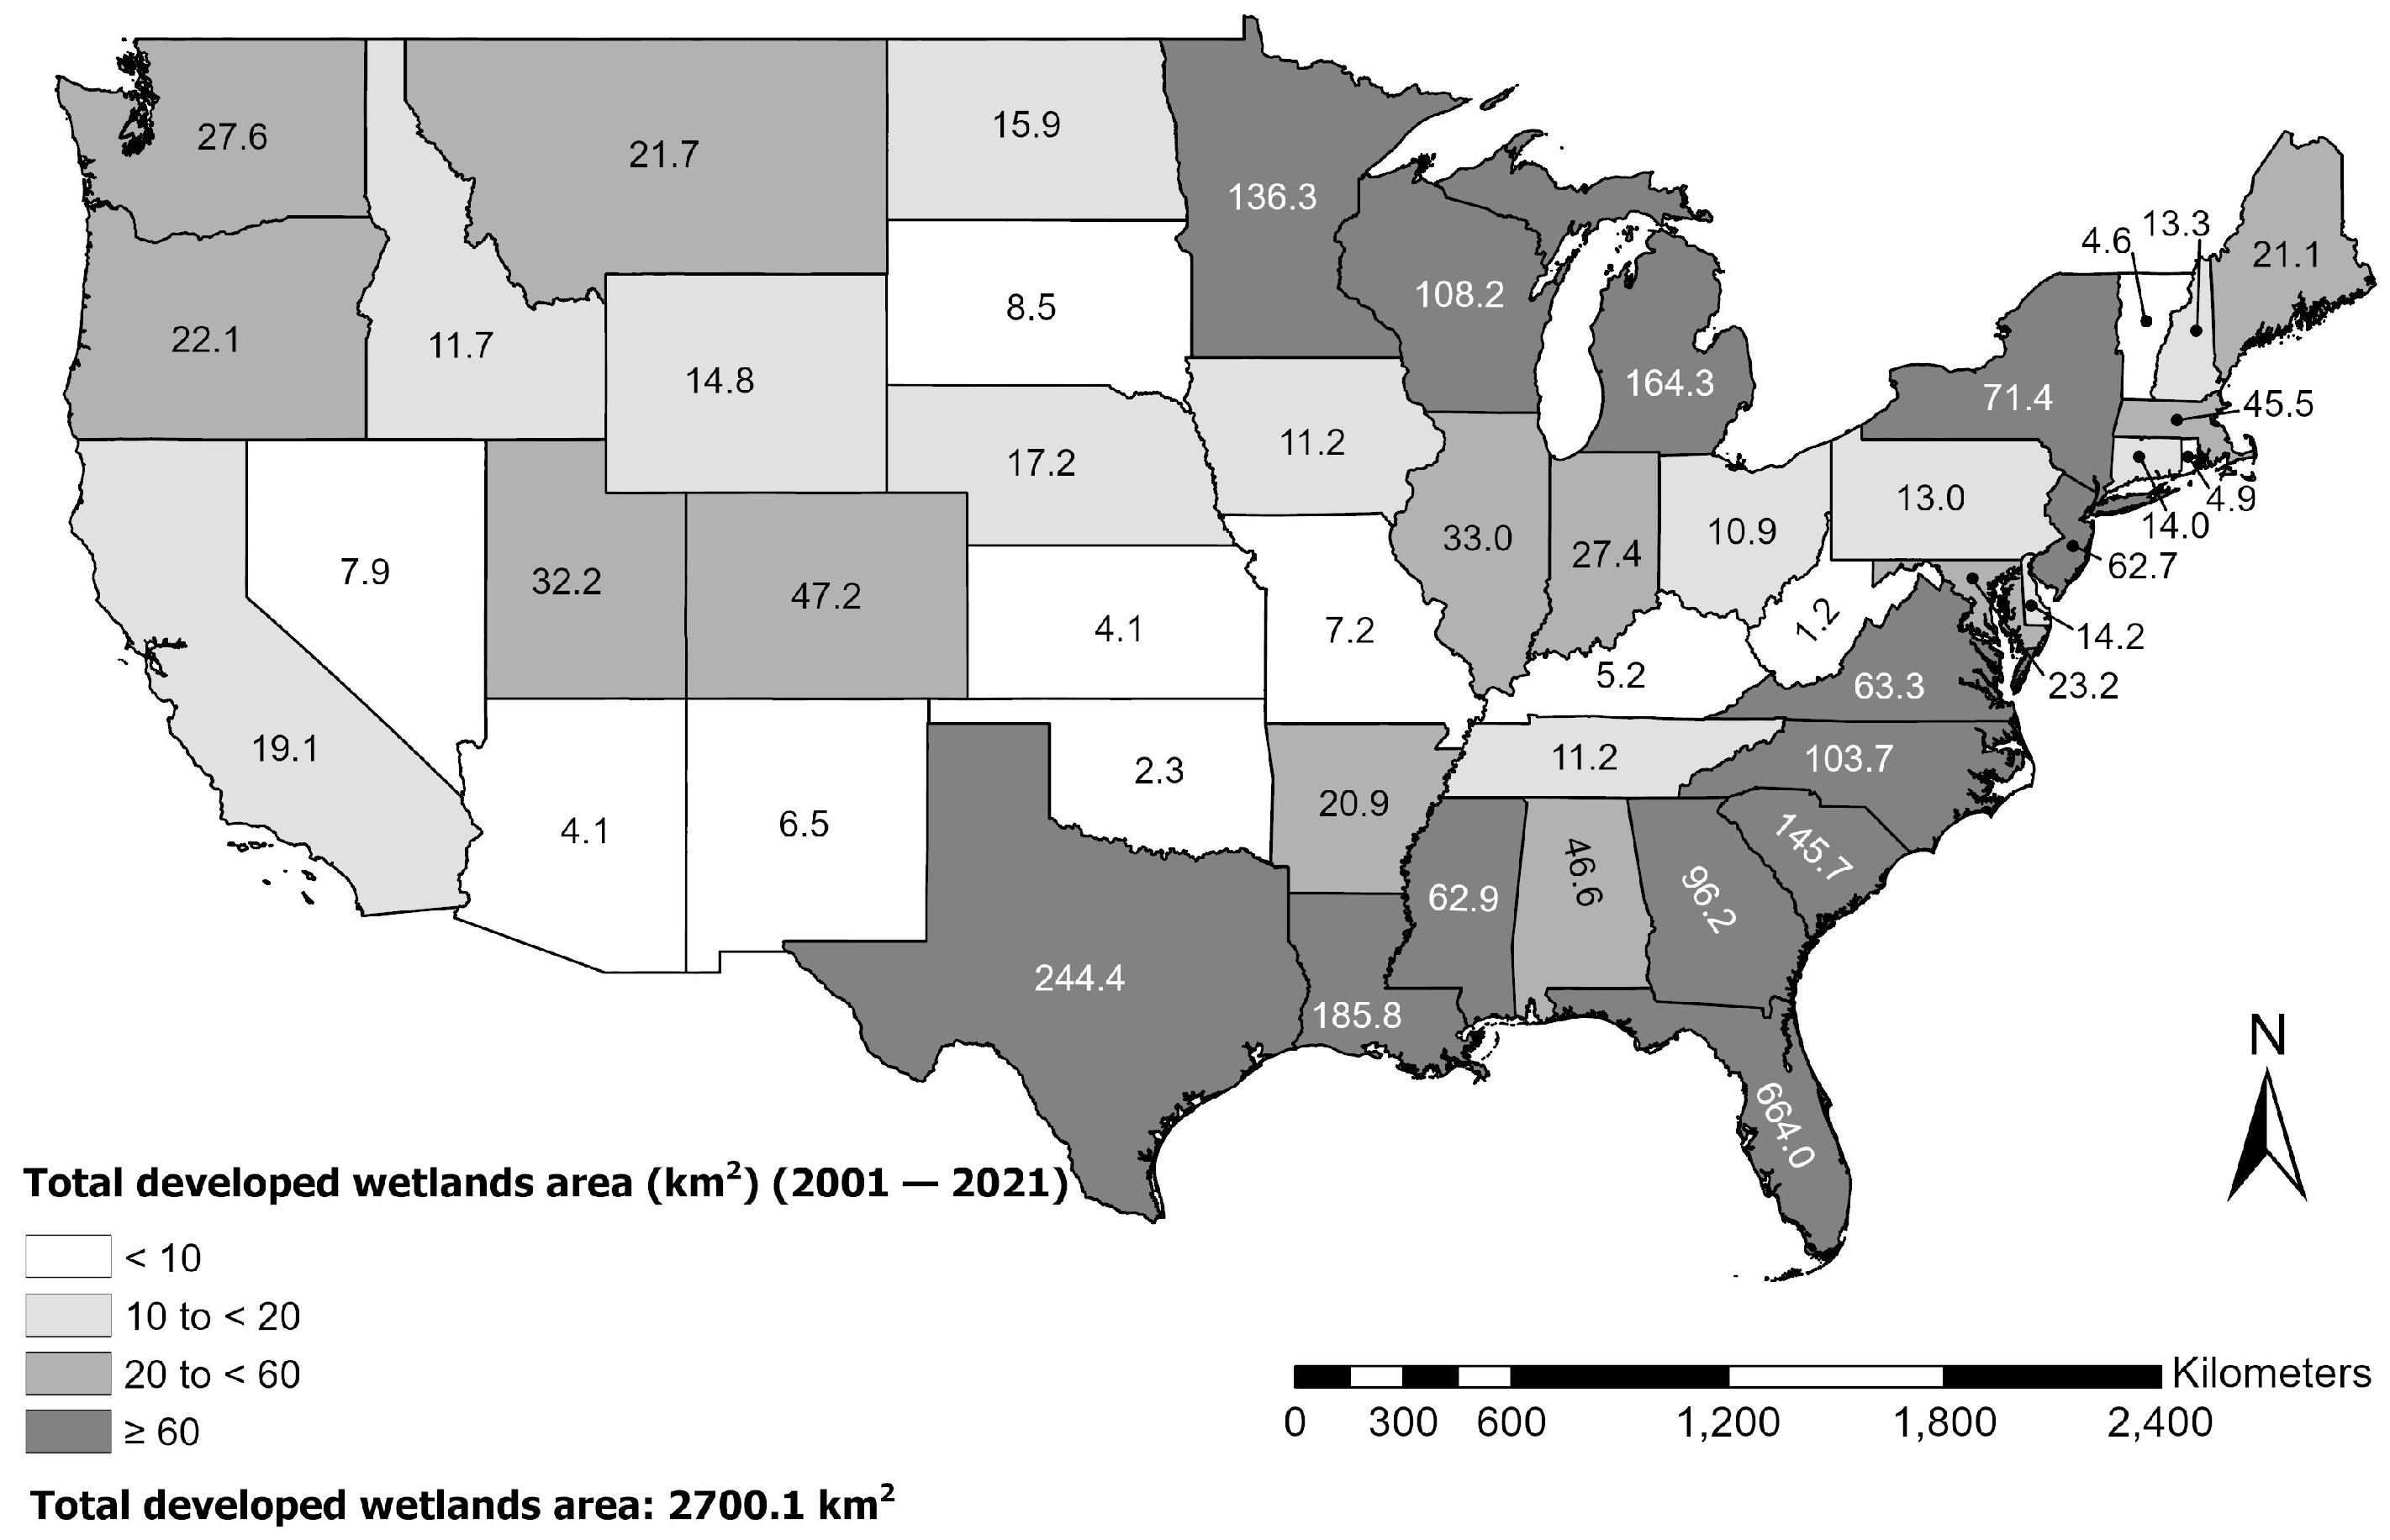
3.3. Recent Wetlands Changes to Non-Wetlands Land Cover Types During Land Conversions (2001–2021) in the Contiguous United States of America (USA)

Wetlands experienced recent land conversions to other non-wetlands LULC between 2001 and 2021, which totaled 6508.8 km2 (Figure 8, Table 1 and Table S3). Table 1 is a newly proposed matrix for monitoring wise use of wetlands for the RC, showing detailed changes in wetlands use by the wetlands type (woody wetlands, emergent herbaceous wetlands, total wetlands). In addition to the contiguous US, the LULC change matrix analysis was conducted for each of the 48 states in the contiguous US (Table 1). The change matrix allows for the tracking of the conversion of wetlands to other wetlands and non-wetlands land cover types (Table 1).

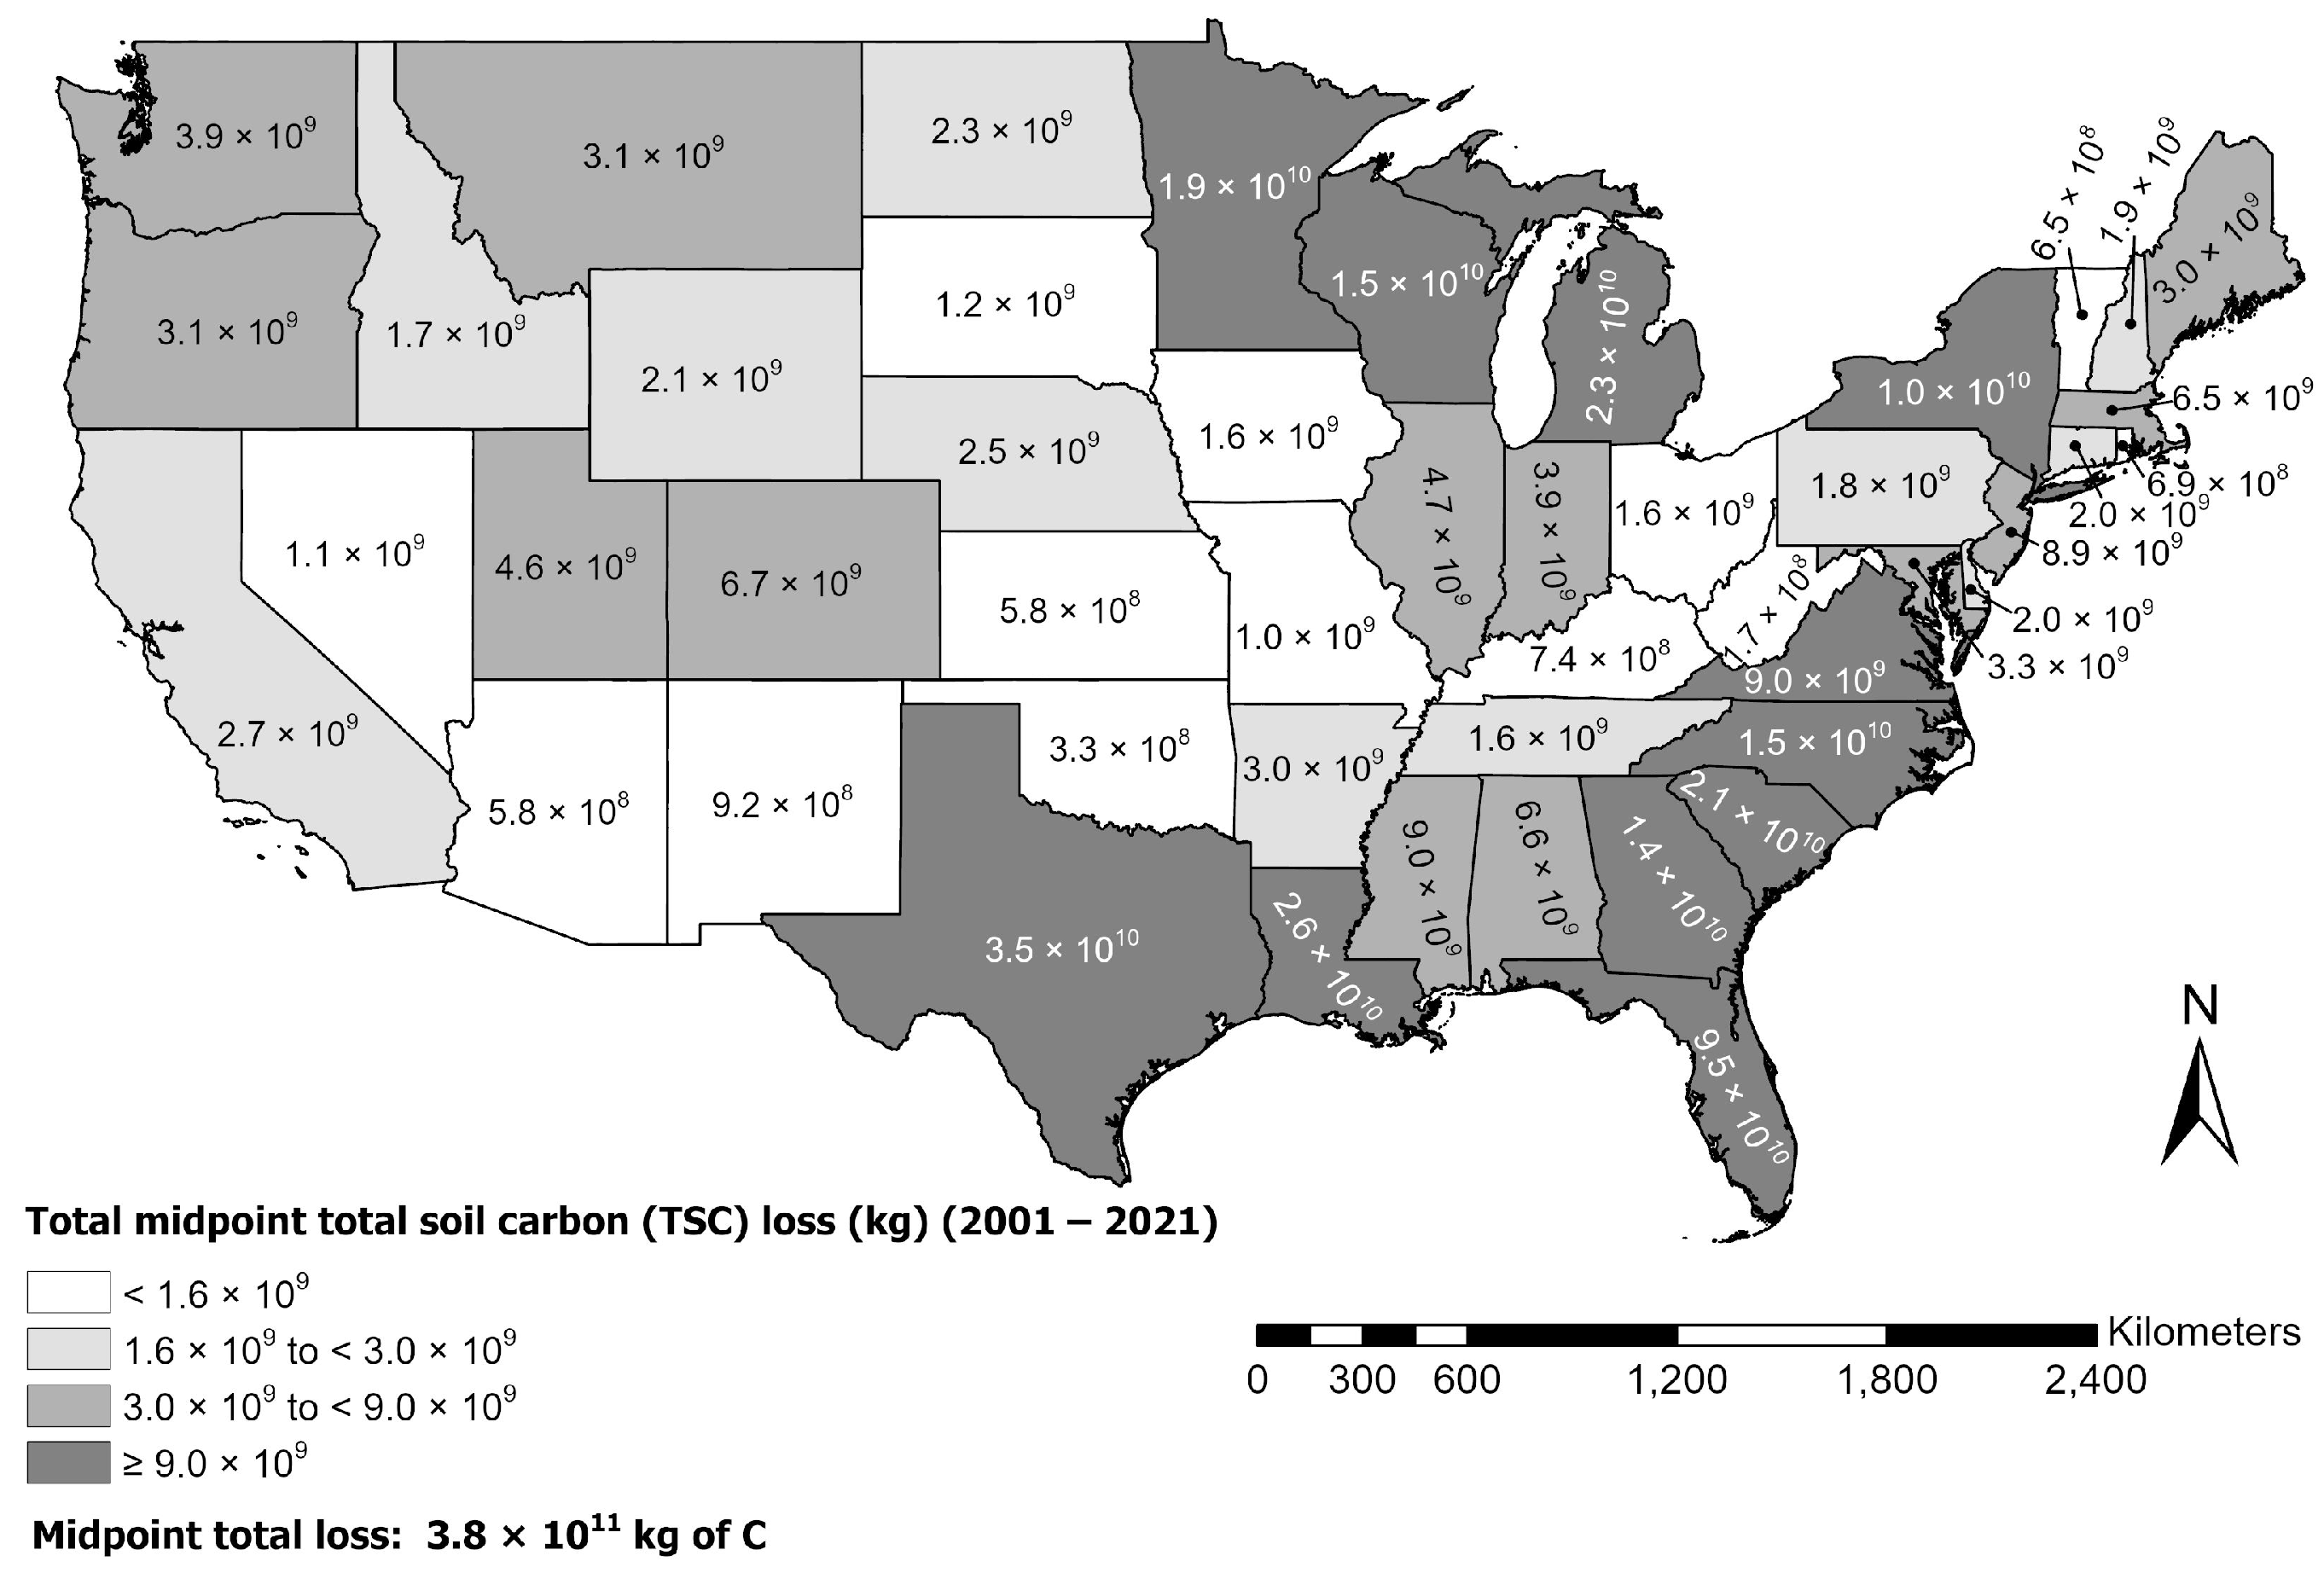
3.4. Damages from Recent Wetlands Losses to Developments (2001–2021) in the Contiguous United States of America (USA)

The “change matrix” of wetlands conversions to other land classes allows not only the monitoring of the wise use of wetlands but also estimating losses and damages (L&D) from these conversions (e.g., wetlands to developments). It would be wise to use wetlands as wetlands, but Table 1 shows that wetlands were converted to other uses between 2001 and 2021, which generated L&D not accounted for in the RC. Population growth and market-driven economic activity often drive wetlands conversions to other uses (e.g., agriculture, development, etc.) [21]. Some of the L&D from wetlands, especially because of land conversions to developments (built environments), failed to be represented by market mechanisms. Our study reveals a methodology to quantify this L&D from developments:
(1) Damage from wetlands conversion to developments because of loss of land that could be used for potential soil carbon (C) sequestration. For example, the conversion of wetlands to developments led to the loss of land for potential C sequestration, which was 2700.1 km2 between 2001 and 2021 for the contiguous US with FL (664.0 km2), TX (244.4 km2) and LA (185.8 km2) having the highest losses (Figure 9, Table S3). Our results are consistent with Zou et al. (2024) [22], who examined the conversion of wetlands to impervious areas and found that FL had the highest rate of wetland conversion (representing 20% of the contiguous USA overall conversions), followed by TX, CA, and LA. This loss was attributed to the growth of population and the need for new housing, which created large impervious areas that are not available for future C sequestration [22]. Coastal wetlands face the impact of conversions from development as well as from sea level rise, and continued monitoring of these wetlands’ areas through repeated remote sensing analysis can serve to identify threats to wetland resources and GHG emissions [23].
(2) Damage from wetlands conversions to developments because of soil carbon (C) loss and associated emissions from wetlands drainage and land developments. For example, the conversion of wetlands between 2001 and 2021 in the contiguous US resulted in the loss of TSC, which ranged between 1.7 × 10¹¹ kg and 6.7 × 10¹¹ kg of C with a midpoint value of 3.8 × 10¹¹ kg of TSC with FL (9.5 × 10¹⁰ kg of C), TX (3.5 × 10¹⁰ kg of C) and LA (2.6 × 10¹⁰ kg of C) having the highest mid-point losses (Figure 10, Table S3). Nearly all wetlands contain most of their carbon in the soil and not in plant biomass and draining and disturbance of wetlands causes C to be oxidized and released as CO2 [24]. Wetlands store a disproportionately high amount of soil C compared to other soils in the USA, and evidence suggests that anthropogenic disturbance of wetlands reduces the amount of soil C [25]. Also, the conversion of wetlands to other land covers was found to reduce soil C and cause CO2 emissions globally [26].
(3) Damage from emissions because of wetlands conversions to developments, which can be measured as “realized” social costs of soil carbon (C) (SC-CO2) released from the land development process. For example, total soil C losses were converted to “realized” social costs of C (SC-CO2) with a range of values between $29.4B and $113.4B with a midpoint value of $64.9B with FL ($15.9B), TX ($5.9B), and LA ($4.5B) having the highest midpoint SC-CO2 values (Figure 11, Table S3). The same three states are leading in wetlands losses and damages (L&D) both historically and recently. Damages from wetland losses extend beyond an individual country’s boundaries and are transboundary in nature. It should be noted that the SC-CO2 estimates of L&D from wetlands losses most likely underestimate the actual L&D because they are based on the US fixed price of SC-CO2 and not the world market value [27]. Also, these SC-CO2 values are theoretical and rarely used in actual situations [27]. Damages from wetland losses are not limited to greenhouse gas emissions (GHG) but have an impact on the whole world’s ecosystem because of changes in the hydrological cycle [28]. The social cost of carbon (SC-CO2) can be used to help provide economic justifications for the protection of wetlands, given the large amount of soil C storage maintained in undisturbed wetlands and the high cost of damages from the conversion and release of CO2 [29]. The same valuation method may not be sufficient, however, to support wetland creation for C sequestration unless other ecosystem service benefits are considered [29].

3.5. The Importance of Disaggregating Wetlands Change Analysis by Smaller Units

It is important to disaggregate wetlands wise use analysis by smaller units (e.g., states), and Table 2 shows an example with the results of the wetlands change matrix for the state of FL between 2001 and 2021 (Table 2). Florida experienced the largest wetlands area losses to developments with corresponding TSC losses and SC-CO2 values among the 48 states in the contiguous USA between 2001 and 2021.
Given the high prevalence of wetlands and population growth in FL, wetland areas were directly converted to developed areas in many instances. As an example, in Collier County, FL (USA), Figure 12 shows an area where wetlands were directly converted to housing developments. The high-resolution ortho imagery (Figure 12a,b) clearly indicates how housing developments were placed in wetland areas between 2005 and 2021. The medium-resolution land cover data from classified satellite imagery from the same location (Figure 12c,d) in 2001 and 2021 also documents this conversion from wetlands to developments, demonstrating the utility of using this medium-resolution land cover data to track wetland conversions over time. This example shows that it is possible to disaggregate the data down to local scales to understand specific locations where wetlands have been converted over time and to potentially identify wetland areas that are being threatened by future development. This high-resolution evaluation of wetland conversions to developments could be potentially used to assign damages for actions that result from these wetland conversions and associated CO2 release, as well as loss of habitat while placing homeowners in areas that may be subject to flood risk [30].

4. Discussion

4.1. Significance of the Results for the Ramsar Convention on Wetlands

4.1.1. Benefits and Limitations of the Ramsar Convention (RC)

The RC is an important step in global wetlands conservation, which is focused on Earth’s unique type of ecosystems [2,3]. Although small in their global extent, wetlands provide a wide range of ecosystem services essential to Earth’s and human well-being (e.g., C storage, water purification, flood regulation, etc.) [1]. The goals of the RC are to promote the wise use and conservation of wetlands, the designation of suitable wetlands as wetlands of international importance, and international cooperation among its 172 contracting parties [2,3]. The USA is just one of the contracting parties participating in the RC; furthermore, its large area extent and numerous states with various ecosystems and wetlands make it an interesting case study in the global context. Despite its large territory and numerous states within its union, the USA has 41 Ramsar sites covering only 0.19% of the country’s total surface area with uneven distribution of sites among states [33]. Similarly to other countries in the world, this handful of Ramsar sites does not provide a full accounting of the wise use of all wetlands in the country, which is necessary for wetlands conservation. The concept of wise use is a central paradigm of RC, but it is too general and lacks standardized methods of quantification and comparison between countries in the world. The RC does not account for historical changes in wetlands and factors affecting them around the world, which is necessary for wetlands loss prevention and the effective mitigation of damages from wetlands loss [34]. Although RC mentions the importance of several natural properties of wetland ecosystems, it emphasizes wetlands as waterfowl habitats [2,3]. However, RC lacks emphasis on national (e.g., between states in a country) and international (e.g., between countries) “transboundary” damages from wetland losses (e.g., GHG emissions, flood regulation, water purification, etc.), which is necessary for combating wetlands losses and assuring accountability for associated damages in the past, present, and future. Our study demonstrated a geospatial methodology to track the use of wetlands at the state and country scales using the LULC change matrix (Table 1), which allows for rapid assessment of adherence to the RC principles.
An essential characteristic to note is that RC’s requirements are much broader than often acknowledged. Focus is often on the requirement that each contracting party lists at least one wetland of international importance located within their territory [5]. Altogether, 172 countries that have joined RC have listed approximately 2300 wetlands, and efforts under RC to protect wetlands focus overwhelmingly on wetlands on this list [6]. However, the listed wetlands are only a small subset of the world’s total wetlands. There is currently an ongoing technological revolution that leverages artificial intelligence (AI) and deep learning to replace manual photo interpretation of wetlands, which will likely lead to future detailed wetland inventories for the world [35,36].
The world’s focus only on listed wetlands violates the RC. The RC requires that member countries engage in “wise use” not only of the listed wetlands in their countries. In addition, a member must engage in wise use of all of the country’s wetlands, even wetlands that are not listed. Article 3(1) requires that members “shall formulate and implement their planning so as to promote the conservation of the wetlands included in the List, and as far as possible the wise use of wetlands in their territory” [2]. As a leading commentary notes, the obligation to promote the conservation of all wetlands within the border of a contracting party is often overlooked [5]. Our study identifies remote sensing technology to track changes in land cover that can be applied to wetland conservation.

4.1.2. Refining the Ramsar Convention

Given RC’s requirement that each member country engages in the wise use of all of its wetlands, norms and rules must be created to define “wise use.” The RC affirms wetlands’ central ecological and economic importance [2]. On the other hand, the term “wise use” suggests that the RC assumes that countries need not preserve all wetlands untouched. Instead, they may “use” the wetlands, but the use must be “wise.” Probably the best place to start for defining “wise use” is to use general concepts of economic efficiency. An instructive example is the way that the United States regulates wetlands under its Clean Water Act (CWA) [10]. Regulators recognize that wetlands often provide their economic and ecological benefits—for example in reducing GHG—regardless of where they are located. In contrast, sometimes a given wetland occupies an area that offers a valuable development opportunity. The CWA’s concept of “mitigation banking” permits the wetland to be sacrificed for development, as long as the developers expand wetlands elsewhere in areas where development creates less value [10]. This approach may ensure that some of the wetlands’ benefits persist while permitting the value of development. It is unclear if these mitigation efforts actually compensate for all the damages associated with wetland losses because of the inability to evaluate the wetland’s value [10]. Our study demonstrates how geospatial technologies can help RC to track transboundary damages [37] from wetlands losses.

4.2. Significance of the Results to the United Nations (UN) Sustainable Development Goals (SDGs) and Other UN Initiatives

The importance of wetlands in various global initiatives is widely recognized in the scientific literature, but it is too general in scope and lacks specific quantitative and qualitative examples [33]. The results of this study are not limited to the RC, but are also relevant to several UN initiatives, including the Sustainable Development Goals (SDGs), adopted in 2015 [38,39], as well as many other UN initiatives (e.g., UN Convention on Biological Diversity [40]; UN Convention to Combat Desertification [41,42]; Revised World Soil Charter [43]; UN Kunming–Montreal Global Biodiversity Framework [44]). The UN suggests disaggregating data whenever possible because data aggregation at the country level can mask differences within countries. This study’s outcomes are relevant to UN goals and initiatives for several reasons:
  • SDG 2: Zero Hunger contains Target 2.4, which mentions sustainable food production systems and maintenance of ecosystems necessary for climate change adaptation, flooding, and improving soil and land quality [38]. Historic wetlands loss (53% area loss) was primarily caused by agriculture expansion in the contiguous USA, which altered the hydrological cycle and caused GHG emissions, contributing to climate change. Recent wetlands losses (2001–2021) in all states of the contiguous USA are also partially caused by agricultural conversions of wetlands to hay/pasture and cultivated crops (2265.5 km2) (Table 1). (Relevant for UN SDG 2: Zero Hunger, Target 2.4);
  • SDG 3: Good Health and Well-Being contains Target 3.9, which highlights the need to reduce the number of illnesses and deaths from pollution, including soil pollution [38]. Historic and recent wetlands losses reduced the “filtering” capacity of soils and land to purify water in all states of the contiguous USA. (Relevant for UN SDG 3: Good Health and Well-Being, Target 3.9);
  • SDG 6: Clean Water and Sanitation contains several targets for safe drinking water and its sources, including wetlands [38]. The filtering capacity of soil in the contiguous US was greatly reduced when wetlands were drained and converted to other land uses, directly impacting water quality. (Relevant for UN SDG 6: Clean Water and Sanitation, Targets 6.1, 6.3, 6.4, and 6.6);
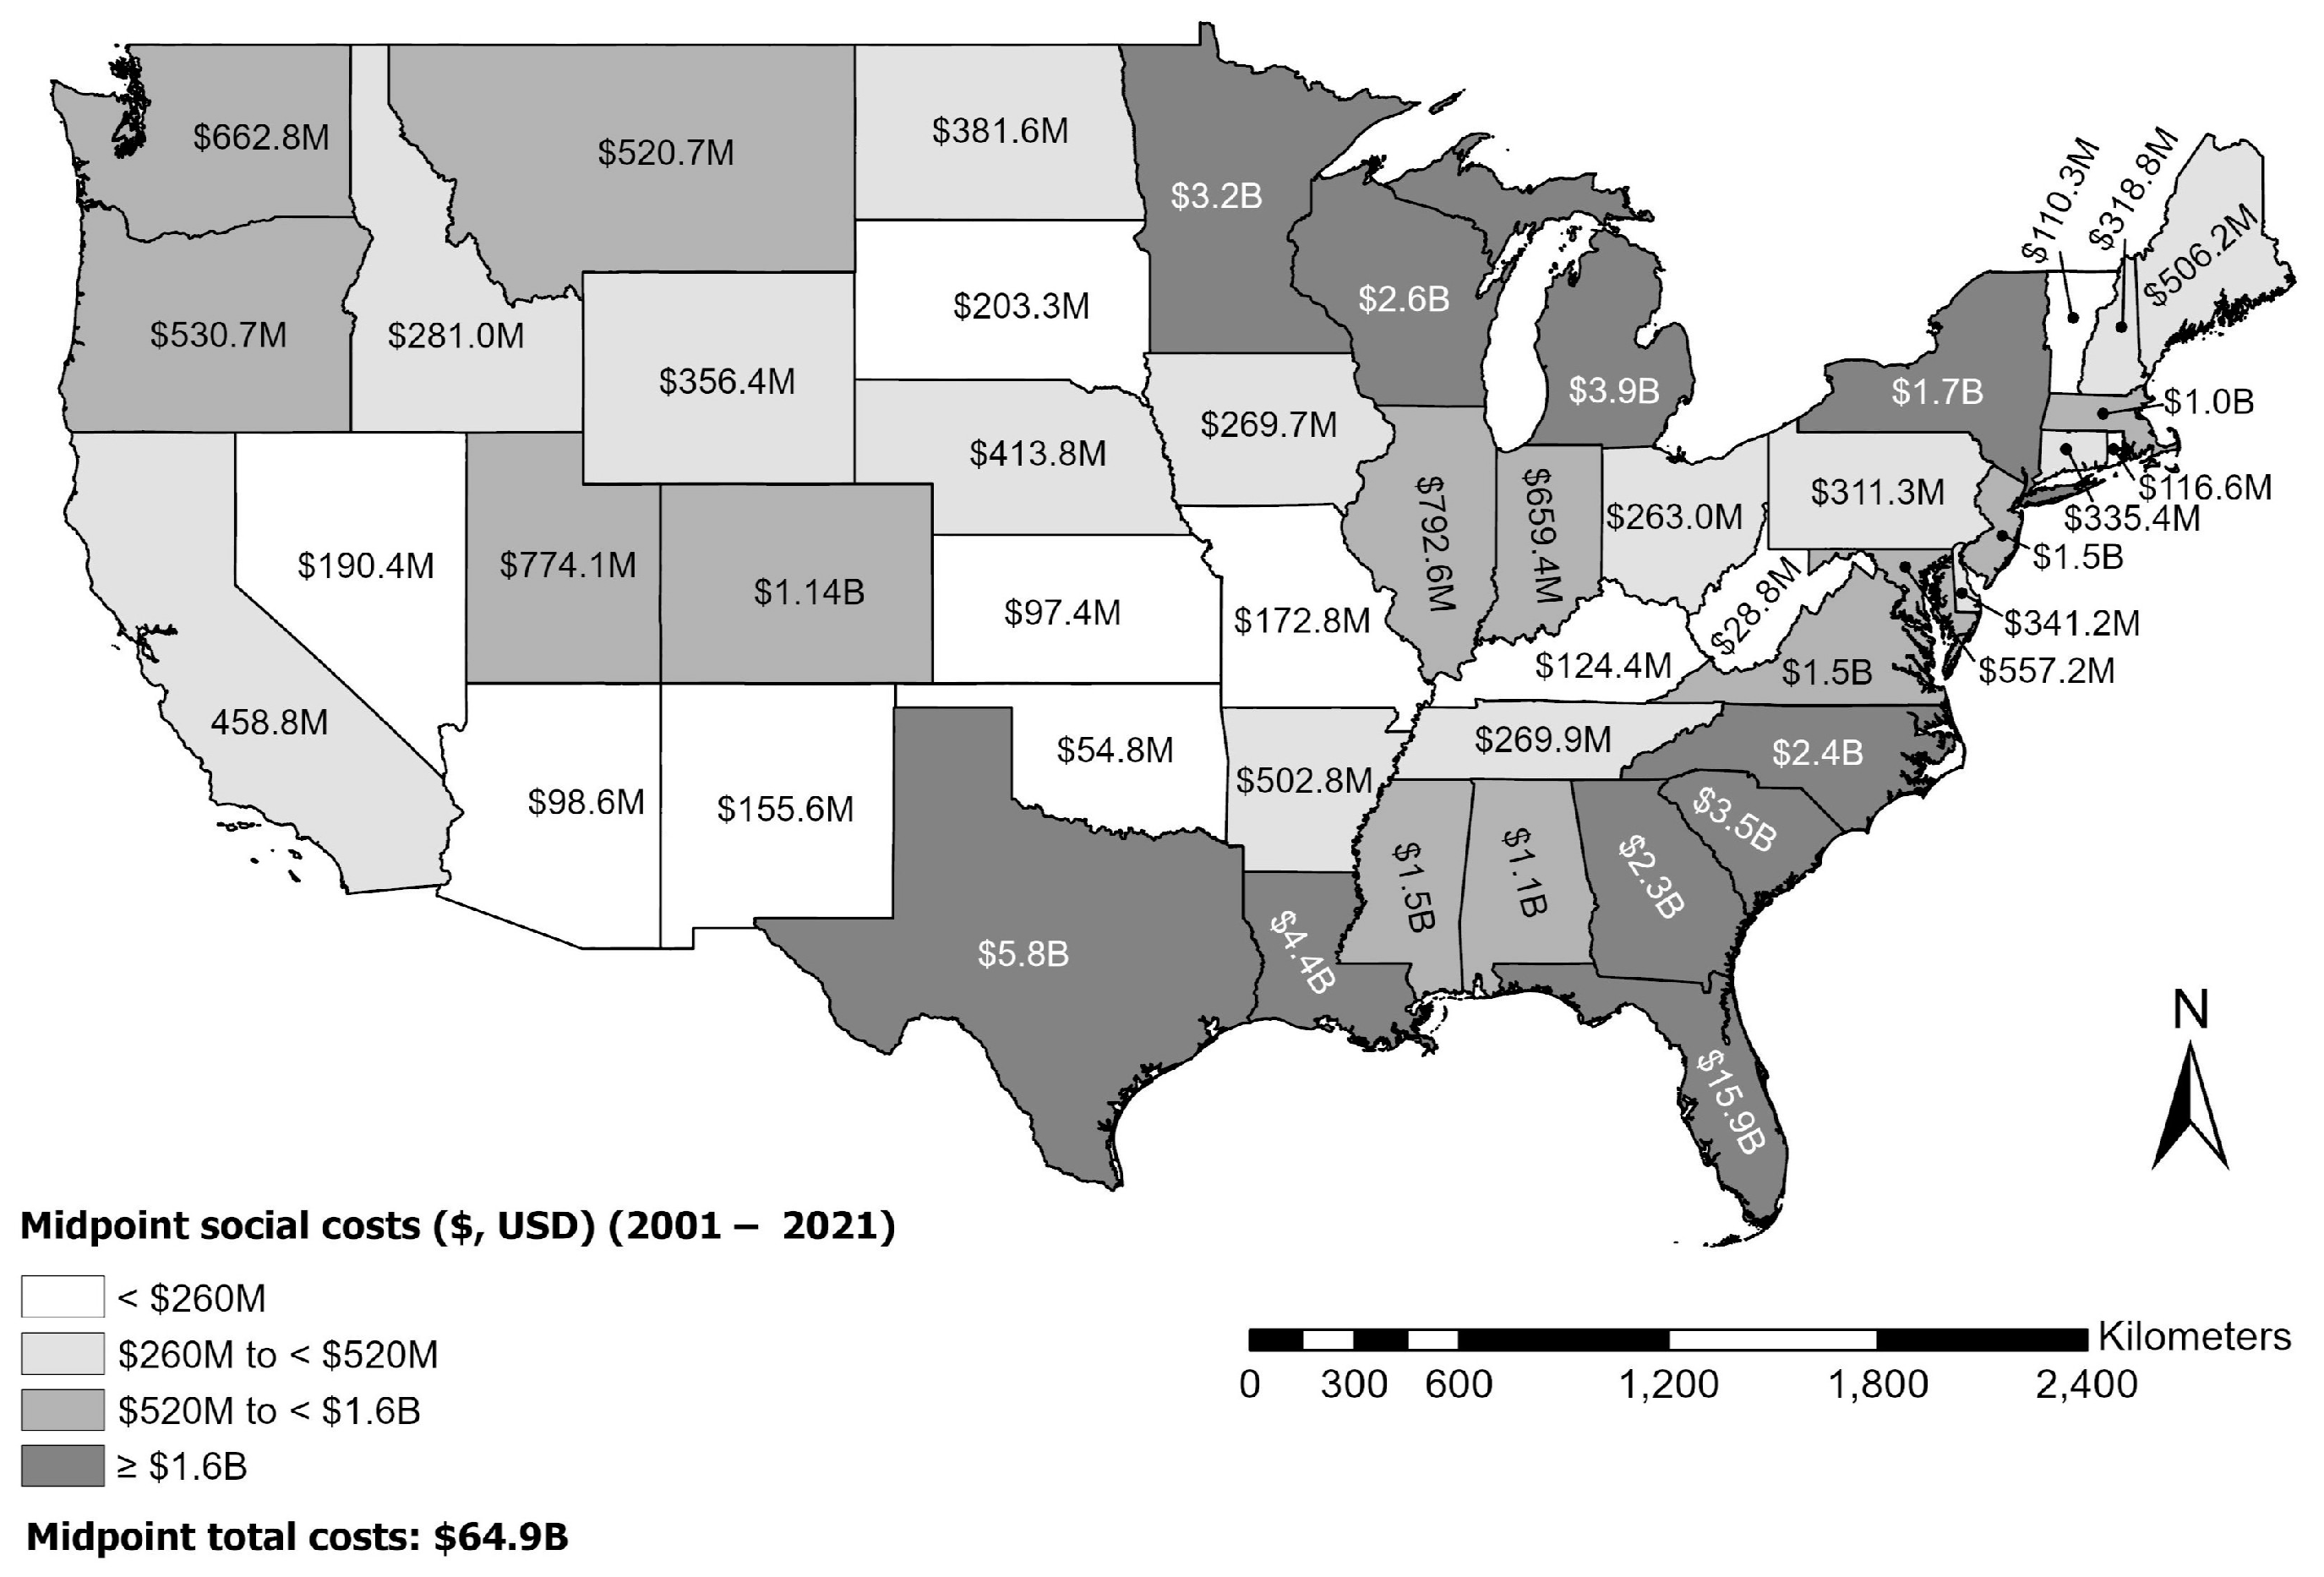
  • SDG 11: Sustainable Cities and Communities require the mitigation of risks to build resilience, and the loss of inland and coastal wetlands between 2000 and 2021 increased flood risk because wetlands serve as a buffer to extreme precipitation and weather events. For example, some of the states with the highest wetlands loss were the coastal states of FL, TX, and LA (Figure 8), where this loss reduced the sustainability and resilience of cities and communities in these states. (Relevant for UN SDG 11: Sustainable Cities and Communities, Target 11.B);
  • SDG 12: Responsible Consumption and Production and Target 12.2 highlight the need for efficient use and sustainable management of natural resources. Our study documents historical and recent unsustainable use of wetlands by converting them into agriculture and urban developments in the contiguous USA. (Relevant for UN SDG 12: Responsible Consumption and Production, Target 12.2);
  • SDG 13: Climate Action and Target 13.1 urging to act on climate change and its impacts, but most states in the USA have no climate change plans (https://www.georgetownclimate.org/adaptation/plans.html (accessed on 16 January 2025)) [45]. Data from this study can support the development of a plan for the states because it determined soil-based GHG emissions and associated SC-CO2 values from the conversion of wetlands to developments in the past and present. In addition, this study quantified the loss of potential soil C sequestration from wetlands losses. Our study showed that almost 53% of the wetlands area was lost between 1780 and 1980, starting with 894,880.7 km2 in 1780 and falling to 422,388.2 km2 in 1980. This net loss generated damages, including midpoint total soil C loss (6.7 × 10¹³ kg of C) with associated midpoint “realized” social costs of C (SC-CO2) value of $11.4T (where T = trillion = 1012, $ = United States dollars, USD). These losses were highly variable within the country, with the states of Florida (FL), Texas (TX), and Louisiana (LA) experiencing the largest losses of wetlands area and C with associated SC-CO2 values. (Relevant to UN SDG 13: Climate Action, Target 13.1);
  • Wetlands losses in the contiguous USA contributed to biodiversity loss, which is not consistent with the wise use of wetlands obligations under the RC. In addition, the continued loss of wetlands is altering the hydrological cycle contributing to further land degradation and desertification. Tracking wetlands losses is also important for UNCCD because wetlands are hotspots of soil C, which can be released upon disturbance. The results of our study suggest that it is important to disaggregate land degradation and land degradation neutrality analyses by LULC type to see wetlands degradation status. (Relevant to UN SDG 15: Life on Land, Targets 15.1, 15.5, and 15.A; UN Convention to Combat Desertification (UNCCD); UN Convention on Biological Diversity; UN Kunming–Montreal Global Biodiversity Framework);
  • The Revised World Soil Charter, which was endorsed by member states of the Food and Agriculture Organization (FAO), provides guidelines to ensure that “soils are managed sustainably and that degraded soils are rehabilitated or restored” [43]. Our study showed losses of wetlands which often contain the soil order of Histosols, soils high in soil organic matter, which become hotspots of GHG emissions upon disturbance (e.g., drainage of wetlands, etc.). (Relevant to The Revised World Soil Charter).

4.3. Significance of the Results for the Millennium Ecosystem Assessment and Consideration of Additional Losses and Damages (L&D)

Wetlands provide a wide range of ecosystem services [1] and are often acknowledged to be among the most critical and valuable ecosystems on Earth [46]. For example, past studies have revealed that wetlands often provide more valuable ecosystem services than freshwaters (e.g., rivers, lakes), forests (e.g., tropical, temperate), woodlands, and grasslands [47,48,49]. Wetlands are a part of the global environment with a global ecosystem services (ES) value in the range of $125T to $145T [49]. Ecosystem services are often defined as benefits provided by ecosystems to people where the value of ES is a relative contribution of the ecosystem to human well-being [47]. Using the framework outlined under the Millenium Ecosystem Assessment [50], ecosystem services are broadly categorized as provisioning, regulating, cultural, and supporting. Wetlands provide provisioning services (e.g., food, water, timber, etc.), regulating services (e.g., improving water quality, minimizing floods, preventing erosion, providing habitat, etc.), cultural services (e.g, recreation, education, etc.), and supporting services (e.g., soil development, water storage, chemical transformations) [46].
Valuation methods of ES are complex and often represent just a fraction of the actual ES value [49]. Nevertheless, the framework of ES has been applied to wetlands in various studies around the world, which documented the large ES value of wetlands, especially for water regulation and biodiversity [1,46]. A few studies documented the importance of wetlands as C and other GHG sinks and hotspots, which need to be protected from unsustainable use (e.g., development, etc.) [46,51]. Wetlands can be significant sources of GHG emissions upon disturbance and climate change impacts (e.g., drying, etc.) [52].
The focus of the present article on soil C sequestration and avoided CO2 emissions associated with wetlands, is one of several ecosystem services included in the category of regulating services [46]. Because monetary value estimates of many ecosystem services are readily available [47,48,49], consideration of additional losses and damages resulting from historic and more recent losses of wetlands is possible for the 48 contiguous US states that were used as the case study in the present article. Equally important, the present study’s approach of using satellite remote sensing together with geospatial analysis to monitor wetlands over time would enable more refined estimates of total losses and damages resulting from wetland conversions/losses, because the relative contribution of the various ecosystem services provided by wetlands depends on the specific location of the wetlands themselves.

4.4. Limitations of the Study and Future Research Needs

Our study demonstrated the importance of incorporating ES valuation in the RC by focusing on regulating ES (e.g., C storage, water, etc.), which tend to be of international scope because they are often transboundary extending beyond national boundaries [53]. It used ES valuation based on the concept of “avoided” and “realized” SC-CO2, demonstrating the “conflicting” value of wetlands for C and other GHG regulations, which has internationally important transboundary significance [53]. The limitation of this analysis is that it used a range of C values from the soil order of Histosols, which is a commonly occurring soil type in wetlands and typically contains the most C among wetlands soils. It should be noted that Histosols are not the only soil order within wetlands. However, data were not available for other soil orders that may be present in these areas because much of the early wetland estimates come from state-level reports and did not include spatially explicit mapping efforts.
The RC can provide an important framework for dealing with international conflicts associated with transboundary GHG emissions, which affect every country in the world. However, the regulatory mechanism will need to be developed, and the results of our study can be of value to RC contracting parties for transboundary cooperation and coordination efforts. A limitation of our study is that it is primarily focused on C, but there are other GHG as well that can be contained and/or released from wetlands. Furthermore, it should be noted that the value of wetlands ES is much larger than regulating ES; therefore, future research should focus on assessing the aggregated value of wetlands ES. This effort should extend beyond the RC sites designated as internally important to all wetlands in the world. Another limitation of our study is that it is primarily focused on the 48 states within the contiguous US, but there are other states and territories within the union with large areas of wetlands that could be included in future studies. For example, wetland areas as of the 1980s in the state of Alaska (687,966 km2) [8] contain between $7.5T and $28.9T of SC-CO2 from TSC (with a midpoint value of $16.5T), which can potentially be released into the atmosphere as a result of LULC change and/or climate change. This is just a fraction of the worldwide damages that can be released upon unsustainable wetlands use and climate change in the state of Alaska [54,55].

5. Conclusions

The RC is an important “soft law” with the goals of promoting the wise use and conservation of wetlands, the designation of suitable wetlands as wetlands of international importance, and international cooperation. Major emphasis on a few wetlands of international importance and waterfowl may limit the monitoring of wise use of wetlands worldwide. The RC needs to transition from being a “soft law” to a more powerful tool of accountability and responsibility for the L&D associated with wetlands losses, especially concerning the transboundary L&D at the national and international levels (e.g., GHG emissions, etc.).
Responsibility for wetlands losses can be assigned, and damages collected (e.g., social costs, etc.) for these intentional wetlands losses. Very often, wetlands losses have a societal cost (e.g., SC-CO2), but no individual cost. While the RC obligates its contracting parties to focus on the wise use of wetlands, it should expand its focus to include the designation and monitoring of all wetlands within each participating country. Historic accounts of wetlands show that large wetland areas of the contiguous US (and likely other countries and regions) have been lost. This study has demonstrated that existing wetland areas can be tracked over time using a satellite-remote sensing-based change matrix that gives a clear indication of how development and other land cover change trends are impacting wetlands. This can help indicate hotspot areas where wetlands are at greatest risk (e.g., the southeast USA) and help prioritize interconnected wetland groupings to preserve ecological biodiversity. This monitoring technique could also be combined with soil spatial databases in the future to refine estimates of potential liabilities (e.g., the release of GHGs) from the conversion of wetlands. Our new approach will also permit for the first time monitoring and enforcement of the RC’s requirement that contracting parties engage in “wise use” not only of wetlands that contracting parties have specifically listed, but also of all wetlands. Standards for defining “wise use” are now necessary to determine whether contracting parties are in compliance. An approach defining wise use as economic efficiency does not necessarily mean ecological equivalence and mitigation of transboundary damages. The demonstrated techniques will only become more accurate over time with innovations in remote sensing technologies that allow both higher spatial and spectral resolution to refine both the type and change in wetland areas. Climate change will also drive wetland changes, as climate patterns impact the water available to sustain wetland ecosystems. With ever-improving tools and data, the RC will have the opportunity to focus on all wetlands and to help develop monitoring systems to comprehensively understand how land use changes impact wetlands. Future research will leverage these new remote sensing platforms, combined with advances in deep learning, to create ever more accurate wetland delineations that can be tracked over time.

Supplementary Materials

The following supporting information can be downloaded at: https://www.mdpi.com/article/10.3390/biosphere1010002/s1, Table S1: Wetlands inventory for the contiguous United States of America (USA) in 1780; Table S2: Wetlands losses in the contiguous United States of America (USA) (1780−1980); Table S3: Wetlands losses to developments in the contiguous United States of America (USA) (2001−2021).

Author Contributions

Conceptualization, E.A.M.; methodology, E.A.M., M.A.S. and H.A.Z.; formal analysis, E.A.M. and G.C.P.; writing—original draft preparation, E.A.M. and C.E.B.; writing—review and editing, E.A.M., C.J.P., M.A.S. and G.B.S.; visualization, H.A.Z., L.L. and Z.H. All authors have read and agreed to the published version of the manuscript.

Funding

This research received no external funding.

Data Availability Statement

Data are contained within the article and Supplementary Materials.

Acknowledgments

We would like to thank the reviewers for their constructive comments and suggestions.

Conflicts of Interest

The authors declare no conflicts of interest.

Glossary

CCarbon
CO2Carbon dioxide
EPAEnvironmental Protection Agency
ESEcosystem services
FLFlorida
GHGGreenhouse gas
LALouisiana
L&DLoss and damage
LULCLand use/land cover
MRLCMulti-Resolution Land Characteristics Consortium
NNorth
NLCDNational Land Cover Database
NRCSNatural Resources Conservation Service
RCRamsar Convention
SC-CO2Social costs of carbon emissions
SDGsSustainable Development Goals
SSURGOSoil Survey Geographic Database
STATSGOState Soil Geographic Database
TXTexas
UNUnited Nations
UNCCDUnited Nations Convention to Combat Desertification
USAUnited States of America
USDAUnited States Department of Agriculture
WWest

References

  1. Xu, X.; Chen, M.; Yang, G.; Jiang, B.; Zhang, J. Wetland ecosystem services research: A critical review. Glob. Ecol. Conserv. 2020, 22, e01027. [Google Scholar] [CrossRef]
  2. Convention on Wetlands of International Importance Especially as Waterfowl Habitat. Ramsar, Iran, 2.2.1971. Available online: https://www.ramsar.org/sites/default/files/documents/library/current_convention_text_e.pdf (accessed on 1 January 2025).
  3. Ramsar: The Convention on Wetlands. Official Documents. Available online: https://www.ramsar.org/official-documents (accessed on 1 January 2025).
  4. Recommendation 3.3: Wise Use of Wetlands. 3rd Meeting of the Conference of the Contracting Parties, Regina, Canada, 27 May–5 June 1987. Available online: https://www.ramsar.org/sites/default/files/documents/library/key_rec_3.03e.pdf (accessed on 5 January 2025).
  5. Podolsky, M.J. US wetlands policy, legislation, and case law as applied to the wise use concept of the Ramsar convention. Case W. Res. L. Rev. 2001, 52, 627. [Google Scholar]
  6. Ramsar Monitoring Website. Global Standard for Wetland Conservation. Available online: https://ramsar-monitoring.org/# (accessed on 5 January 2025).
  7. Ramsar Country Profile: United States of America. Available online: https://www.ramsar.org/country-profile/united-states-america (accessed on 5 January 2025).
  8. Dahl, T.E. Wetland Losses in the United States 1780’s to 1980’s. U.S. Department of Interior FWS; 1990. Available online: https://www.fws.gov/sites/default/files/documents/Wetlands-Losses-in-the-United-States-1780s-to-1980s.pdf (accessed on 5 January 2025).
  9. Maltby, E. The wetlands paradigm shift in response to changing societal priorities: A reflective review. Land 2022, 11, 1526. [Google Scholar] [CrossRef]
  10. Ruhl, J.B.; James Salzman, J. No net loss? The past, present, and future of wetlands mitigation banking. Case W. Res. L. Rev. 2022, 73, 411–439. Available online: https://scholarlycommons.law.case.edu/caselrev/vol73/iss2/8 (accessed on 5 January 2025).
  11. Lang, M.W.; Ingebritsen, J.C.; Griffin, R.K. Status and Trends of Wetlands in the Conterminous United States 2009 to 2019; U.S. Department of the Interior; Fish and Wildlife Service: Washington, DC, USA, 2024; 43p. Available online: https://www.fws.gov/media/status-and-trends-wetlands-conterminous-united-states-2009-2019 (accessed on 5 January 2025).
  12. Dahl, T.E. Status and Trends of Wetlands in the Conterminous United States 2004 to 2009; U.S. Department of the Interior; Fish and Wildlife Service: Washington, DC, USA, 2011; 108p. [Google Scholar]
  13. Atesoglu, A.; Ozel, H.B.; Varol, T.; Cetin, M.; Baysal, B.U.; Bulut, F.S. Monitoring land cover/use conversions in Türkiye wetlands using Collect Earth. J. Indian Soc. Remote Sens. 2025, 1–16. [Google Scholar] [CrossRef]
  14. Shinkarenko, S.S.; Bartalev, S.A. Application of remote sensing data in large-scale monitoring of wetlands. Cosm. Res. 2024, 62 (Suppl. S1), S100–S114. [Google Scholar] [CrossRef]
  15. Dahanayake, H.D.; Dahanayaka, D.D.G.L.; Hudson, P.; Wickramasinghe, D. Land use changes of coastal wetlands using remote sensing. A case study of Muthurajawela & Anawilundawa wetlands, Sri Lanka. TeMA-J. Land Use Mobil. Environ. 2024, 17, 7–21. [Google Scholar] [CrossRef]
  16. Multi-Resolution Land Characteristics Consortium—MRLC. Available online: https://www.mrlc.gov/ (accessed on 5 January 2025).
  17. EPA—United States Environmental Protection Agency. The Social Cost of Carbon. EPA Fact Sheet. 2016. Available online: https://19january2017snapshot.epa.gov/climatechange/social-cost-carbon_.html (accessed on 5 January 2025).
  18. ESRI (Environmental Systems Research Institute). ArcGIS Pro 3.1. Available online: https://www.esri.com/en-us/arcgis/products/arcgis-pro/overview (accessed on 24 December 2024).
  19. US Census Bureau, Geography Division. Available online: https://www.census.gov/geographies/mapping-files/time-series/geo/carto-boundary-file.html (accessed on 24 December 2024).
  20. Guo, Y.; Amundson, R.; Gong, P.; Yu, Q. Quantity and spatial variability of soil carbon in the conterminous United States. Soil Sci. Soc. Am. J. 2006, 70, 590–600. [Google Scholar] [CrossRef]
  21. Asselen, S.V.; Verburg, P.H.; Vermaat, J.E.; Janse, J.H. Drivers of wetland conversion: A global meta-analysis. PLoS ONE 2013, 8, e81292. [Google Scholar] [CrossRef]
  22. Zou, Z.; Huang, C.; Lang, M.W.; Du, L.; McCarty, G.; Ingebritsen, J.C.; Harner, J.; Griffin, R.; Gong, W.; Lu, J. Hotspots of wetland loss to impervious surfaces in the conterminous United States. Sci. Total Environ. 2024, 948, 174787. [Google Scholar] [CrossRef]
  23. Enwright, N.M.; Osland, M.J.; Thorne, K.M.; Guntenspergen, G.R.; Grace, J.B.; Steyer, G.D.; Herold, N.; Chivoiu, B.; Han, M. Observing coastal wetland transitions using national land cover products. Prog. Phys. Geogr. 2024, 48, 113–135. [Google Scholar] [CrossRef]
  24. Moomaw, W.R.; Chmura, G.L.; Davies, G.T.; Finlayson, C.M.; Middleton, B.A.; Natali, S.M.; Perry, J.E.; Roulet, N.; Sutton-Grier, A.E. Wetlands in a changing climate: Science, policy and management. Wetlands 2018, 38, 183–205. [Google Scholar] [CrossRef]
  25. Nahlik, A.M.; Fennessy, M.S. Carbon storage in US wetlands. Nat. Commun. 2016, 7, 1–9. [Google Scholar] [CrossRef] [PubMed]
  26. Tan, L.; Ge, Z.; Ji, Y.; Lai, D.Y.; Temmerman, S.; Li, S.; Li, X.; Tang, J. Land use and land cover changes in coastal and inland wetlands cause soil carbon and nitrogen loss. Glob. Ecol. Biogeogr. 2022, 31, 2541–2563. [Google Scholar] [CrossRef]
  27. Revesz, R.L.; Sarinsky, M. The social cost of greenhouse gases: Legal economic, and institutional perspective. Yale J. Reg. 2022, 39, 856–907. [Google Scholar]
  28. Bullock, A.; Acreman, M. The role of wetlands in the hydrological cycle. Hydrol. Earth Syst. Sci. 2003, 7, 358–389. [Google Scholar] [CrossRef]
  29. Gallant, K.; Withey, P.; Risk, D.; Kooten, G.C.; Spafford, L. Measurement and economic valuation of carbon sequestration in Nova Scotian wetlands. Ecol. Econ. 2020, 171, 106619. [Google Scholar] [CrossRef]
  30. Brody, S.D.; Zahran, S.; Maghelal, P.; Grover, H.; Highfield, W.E. The rising costs of floods: Examining the impact of planning and development decisions on property damage in Florida. J. Am. Plan. Assoc. 2007, 73, 330–345. [Google Scholar] [CrossRef]
  31. U.S. Geological Survey (USGS). Aerial Photography-Digital Orthophoto Quadrangle (DOQs). Retrieved from USGS Earth Explorer; 2005. Available online: https://www.usgs.gov/centers/eros/science/usgs-eros-archive-aerial-photography-digital-orthophoto-quadrangle-doqs (accessed on 17 January 2025).
  32. U.S. Geological Survey (USGS). National Agriculture Imagery Program (NAIP). Retrieved from USGS Earth Explorer; 2021. Available online: https://www.usgs.gov/centers/eros/science/usgs-eros-archive-aerial-photography-national-agriculture-imagery-program-naip (accessed on 17 January 2025).
  33. Mohanty, S.; Pandey, P.C.; Pandey, M.; Srivastava, P.K.; Dwivedi, C.S. Wetlands contribution and linkage to support SDGs, its indicators and targets—A critical review. Sustain. Dev. 2024, 32, 5348–5392. [Google Scholar] [CrossRef]
  34. Ballut-Dajud, G.A.; Sandoval Herazo, L.C.; Fernández-Lambert, G.; Marín-Muñiz, J.L.; López Méndez, M.C.; Betanzo-Torres, E.A. Factors affecting wetland loss: A review. Land 2022, 11, 434. [Google Scholar] [CrossRef]
  35. Dronova, I. Object-based image analysis in wetland research: A review. Remote Sens. 2015, 7, 6380–6413. [Google Scholar] [CrossRef]
  36. Zheng, J.Y.; Hao, Y.Y.; Wang, Y.C.; Zhou, S.Q.; Wu, W.B.; Yuan, Q.; Gao, Y.; Guo, H.Q.; Cai, X.X.; Zhao, B. Coastal wetland vegetation classification using pixel-based, object-based and deep learning methods based on RGB-UAV. Land 2022, 11, 2039. [Google Scholar] [CrossRef]
  37. Vriesinga, S. International wetland conservation and the Ramsar Convention: Do broad measures and wise use equal meaningful transboundary solutions. Southeast. Environ. Law J. 2008, 17, 169. Available online: https://scholarcommons.sc.edu/selj/vol17/iss1/5 (accessed on 5 January 2025).
  38. United Nations (UN). Transforming Our World: The 2030 Agenda for Sustainable Development; The Resolution Adopted by the General Assembly on 25 September 2015; United Nations: New York, NY, USA, 2015; 35p. [Google Scholar]
  39. Seifollahi-Aghmiuni, S.; Nockrach, M.; Kalantari, Z. The potential of wetlands in achieving the sustainable development goals of the 2030 Agenda. Water 2019, 11, 609. [Google Scholar] [CrossRef]
  40. UN. Convention on Biological Diversity. Treaty Collection. 1992. Available online: https://www.cbd.int/doc/legal/cbd-en.pdf (accessed on 16 January 2025).
  41. United Nations Convention to Combat Desertification Overview. Available online: https://www.unccd.int/convention/overview (accessed on 16 January 2025).
  42. United Nations (UN) Convention to Combat Desertification. Decision 3/COP.12 (COP 12, Ankara, 2015). Integration of the Sustainable Development Goals and Target into the Implementation of the United Nations Convention to Combat Desertification and the Intergovernmental Working Group Report on Land Degradation Neutrality. Available online: https://www.unccd.int/official-documents/cop-12-ankara-2015 (accessed on 16 January 2025).
  43. Food and Agriculture Organization (FAO). Revised World Soil Charter. Available online: https://openknowledge.fao.org/server/api/core/bitstreams/65be618a-f5e8-4f67-9cbb-d77f1f5cd31e/content (accessed on 16 January 2025).
  44. UN. Convention on Biological Diversity. Kunming-Montreal Global Biodiversity Framework. 2022. Available online: https://www.cbd.int/article/cop15-final-text-kunming-montreal-gbf-221222 (accessed on 16 January 2025).
  45. Georgetown Law. Georgetown Climate Center. State Adaptation Progress Tracker. Available online: https://www.georgetownclimate.org/adaptation/plans.html (accessed on 16 January 2025).
  46. Mitsch, W.J.; Bernal, B.; Hernandez, M.E. Ecosystem services of wetlands. Int. J. Biodivers. Sci. Ecosyst. Serv. Manag. 2015, 11, 1–4. [Google Scholar] [CrossRef]
  47. Costanza, R.; d’Arge, R.; De Groot, R.; Farber, S.; Grasso, M.; Hannon, B.; Limburg, K.; Naeem, S.; O’neill, R.V.; Paruelo, J.; et al. The value of the world’s ecosystem services and natural capital. Nature 1997, 387, 253–260. [Google Scholar] [CrossRef]
  48. De Groot, R.; Brander, L.; Van Der Ploeg, S.; Costanza, R.; Bernard, F.; Braat, L.; Christie, M.; Crossman, N.; Ghermandi, A.; Hein, L.; et al. Global estimates of the value of ecosystems and their services in monetary units. Ecosyst. Serv. 2012, 1, 50–61. [Google Scholar] [CrossRef]
  49. Costanza, R.; De Groot, R.; Sutton, P.; Van der Ploeg, S.; Anderson, S.J.; Kubiszewski, I.; Farber, S.; Turner, R.K. Changes in the global value of ecosystem services. Global Environ. Change 2014, 26, 152–158. [Google Scholar] [CrossRef]
  50. Millennium Ecosystem Assessment. Ecosystems and Human Well-Being: Synthesis; Island Press: Washington, DC, USA, 2005. [Google Scholar]
  51. Zhang, Y.; Zhang, X.; Fang, W.; Cai, Y.; Zhang, G.; Liang, J.; Chang, J.; Chen, L.; Wang, H.; Zhang, P.; et al. Carbon sequestration potential of wetlands and regulating strategies response to climate changes. Environ. Res. 2025, 269, 120890. [Google Scholar] [CrossRef]
  52. Liu, X.; Lu, X.; Yu, R.; Sun, H.; Xue, H.; Qi, Z.; Cao, Z.; Zhang, Z.; Liu, T. Greenhouse gases emissions from riparian wetlands: An example from the Inner Mongolia grassland region in China. Biogeosciences 2021, 18, 4855–4872. [Google Scholar] [CrossRef]
  53. Rosenblum, Z.H.; Schmeier, S. Global wetland governance: Introducing the transboundary wetlands database. Water 2022, 14, 3077. [Google Scholar] [CrossRef]
  54. Vynne, C.; Dovichin, E.; Fresco, N.; Dawson, N.; Joshi, A.; Law, B.E.; Lertzman, K.; Rupp, S.; Schmiegelow, F.; Trammell, E.J. The importance of Alaska for climate stabilization, resilience, and biodiversity conservation. Front. For. Glob. Change 2021, 4, 701277. [Google Scholar] [CrossRef]
  55. Hinzman, L.D.; Bettez, N.D.; Bolton, W.R.; Chapin, F.S.; Dyurgerov, M.B.; Fastie, C.L.; Griffith, B.; Hollister, R.D.; Hope, A.; Huntington, H.P.; et al. Evidence and implications of recent climate change in northern Alaska and other arctic regions. Clim. Change 2005, 72, 251–298. [Google Scholar] [CrossRef]
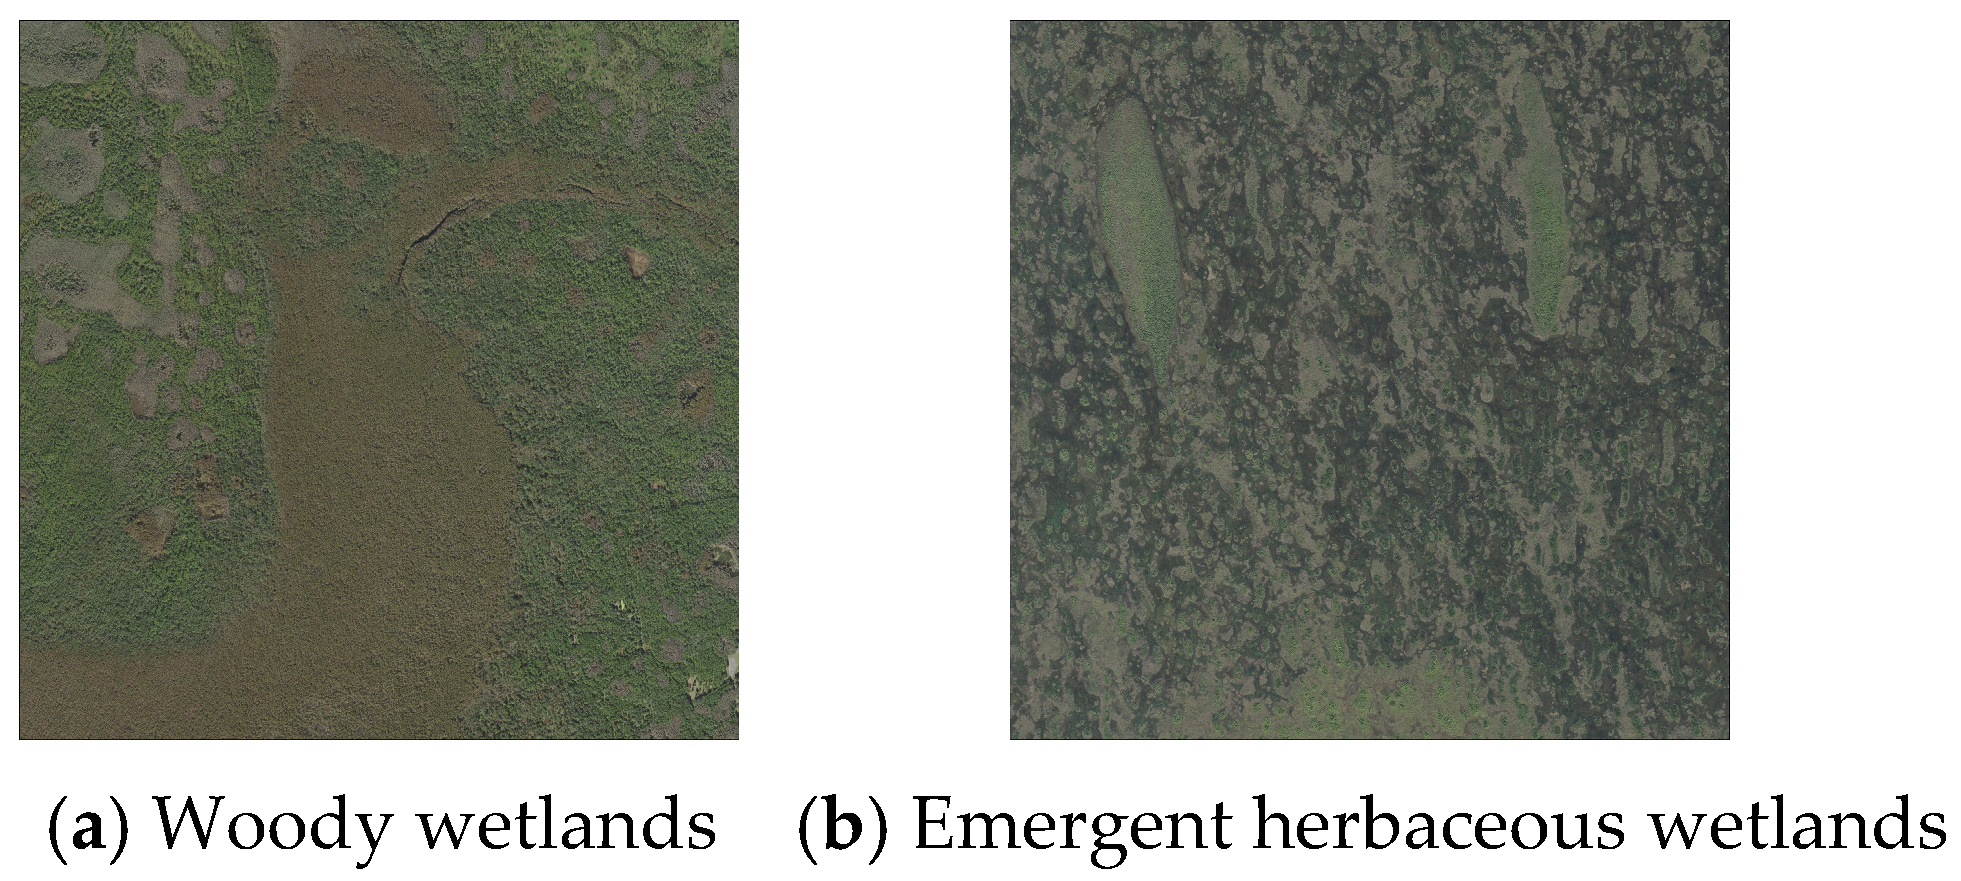
Figure 1. Maps showing (a) wetlands area in 1780, and (b) percent loss of wetlands area (1780–1980) in the present-day contiguous states of the United States of America (USA) (adapted from Dahl (1990) [8]). Almost 53% of the wetlands area in the contiguous USA was lost between 1780 and 1980, starting with 894,880.7 km2 in 1780 and falling to 422,388.2 km2 in 1980 [8]. This analysis used early wetland estimates from state-level reports and not spatially explicit mapping efforts [8].
Biosphere 01 00002 g001
Figure 2. Ramsar site locations in the United States of America (USA) (adapted from Ramsar Monitoring Website. Available online: https://ramsar-monitoring.org/# (accessed on 5 January 2025) [6]).
Biosphere 01 00002 g002
Figure 3. Wetlands in the contiguous United States of America in 2021 (based on data from the Multi-Resolution Land Characteristics Consortium (MRLC) [16]).
Biosphere 01 00002 g003
Figure 4. Flowchart of the geospatial analysis used in this study.
Biosphere 01 00002 g004
Figure 5. Examples of (a) woody wetlands and (b) emergent herbaceous wetlands in the state of Florida (FL) (USA) were identified by using classified satellite images from the Multi-Resolution Land Characteristics Consortium (MRLC) with detailed descriptions of land classes [16]. Woody wetlands (90) are defined as “areas where forest or shrubland vegetation accounts for greater than 20% of vegetative cover and the soil or substrate is periodically saturated with or covered with water” [21]. Emergent herbaceous wetlands (95) are “areas where perennial herbaceous vegetation accounts for greater than 80% of vegetative cover and the soil or substrate is periodically saturated with or covered with water” [16].
Biosphere 01 00002 g005
Figure 6. Maps showing historical (1780) (a) midpoint total soil carbon (TSC) (kg), and (b) “avoided” midpoint social costs of soil carbon (C) (SC-CO2) ($, USD) based on Environmental Protection Agency (EPA)-calculated SC-CO2 of $46 per metric ton of carbon dioxide (CO2) [17] in the contiguous United States of America (USA). Note: B = billion = 109, T = trillion = 1012, $ = United States dollars (USD).
Biosphere 01 00002 g006
Figure 7. Maps showing examples of damages from wetlands losses (1780–1980) presented as (a) midpoint total soil carbon (TSC) loss (kg), and (b) “realized” midpoint social costs of soil carbon (C) (SC-CO2) ($, USD) based on Environmental Protection Agency (EPA)-calculated SC-CO2 of $46 per metric ton of carbon dioxide (CO2) [17] in the contiguous United States of America (USA). Total soil C loss was in the range of 3.0 × 10¹³ to 1.2 × 10¹⁴ kg, and SC-CO2 values were in the range of $5.1T to $19.8T. Note: B = billion = 109, T = trillion = 1012, $ = United States dollars (USD).
Biosphere 01 00002 g007
Figure 8. Map of total wetlands area changes to non-wetlands land cover types, which was calculated using the change matrix of wetlands areas between 2001 and 2021 by state in the contiguous United States of America (USA).
Biosphere 01 00002 g008
Figure 9. Damages from wetlands conversion to developments (2001–2021) because of loss of land for potential soil carbon (C) sequestration by the state in the contiguous United States of America (USA). Developed land cover classes (LULC) are defined in the National Land Cover Database (NLCD) class legend as developed, open space; developed, low intensity; developed, medium intensity; developed, high intensity [16].
Biosphere 01 00002 g009
Figure 10. Damages from wetlands conversion to developments (2001–2021) because of loss of total soil carbon (TSC) by the state in the contiguous United States of America (USA). Developed land cover classes (LULC) are defined in the National Land Cover Database (NLCD) class legend as developed, open space; developed, low intensity; developed, medium intensity; developed, high intensity [16].
Biosphere 01 00002 g010
Figure 11. Damages from wetlands conversion to developments because of emissions, which can be measured as “realized” social costs of soil carbon (C) (SC-CO2) by the state in the contiguous United States of America (USA) from 2001 to 2021. Developed land cover classes (LULC) are defined in the National Land Cover Database (NLCD) class legend as developed, open space; developed, low intensity; developed, medium intensity; developed, high intensity [16]. Note: M = million = 106, B = billion = 109, USD = United States Dollar.
Biosphere 01 00002 g011
Figure 12. High-resolution aerial imagery of (a) mostly undeveloped wetland areas in Collier County, Florida (FL) (USA) in 2005 [31], and (b) the same area in 2021 [32] showing new housing developments in wetland areas. Land cover data of (c) mostly undeveloped wetlands (light and dark blue areas) in 2001 and (d) developed areas in 2021 (red areas) in the same location as the high-resolution aerial imagery (based on data from MRLC [16]).
Biosphere 01 00002 g012
Table 1. Proposed monitoring of wise use of wetlands for the Ramsar Convention using the land use/land cover (LULC) change matrix. This matrix shows wetlands changes to non-wetlands land covers for the contiguous United States of America (USA) (2001–2021) as an example.
NLCD Land Cover Classes
(LULC)
Area (km2) in 2001Total Wetlands
Area (km2) in 2021;
Change (2001–2021) (km2)
Woody Wetlands
Area (km2) in 2021
Emergent Herbaceous Wetlands
Area (km2) in 2021
Total wetlands465,148.1458,639.2 (−6508.8)347,499.9111,139.3
Woody wetlands350,376.8348,324.7 336,398.0 11,926.7
Emergent herbaceous wetlands114,771.3110,314.511,101.999,212.6
Change in the Wetlands Area (2001–2021) (km2) to Non-Wetland Types
Shrub/Scrub+175.5+71.8+103.7
Mixed forest+93.3+50.5+42.8
Deciduous forest+283.0+87.3+195.7
Herbaceous+388.3+60.8+327.5
Evergreen forest+258.5+128.3+130.2
Hay/Pasture+577.6+63.0+514.7
Cultivated crops+1687.9+268.8+1419.0
Developed, open space+1302.6+1046.4+256.2
Developed, low intensity+692.8+506.8+186.0
Developed, medium intensity+535.1+388.0+147.2
Developed, high intensity+169.6+118.1+51.4
Barren land+344.6+87.0+257.6
Note: Hyphen symbol = not applicable.
Table 2. Proposed monitoring of wise use of wetlands for the Ramsar Convention using land use/land cover (LULC) change matrix by individual states using the state of Florida (FL) in the United States of America (USA) (2001–2021) as an example.
NLCD Land Cover Classes
(LULC)
Area (km2) in 2001Total Wetlands
Area (km2) in 2021;
Change (2001–2021) (km2)
Woody Wetlands
Area (km2) in 2021
Emergent Herbaceous Wetlands Area (km2) in 2021
Total wetlands52,125.751,362.1 (−763.7)37,121.114,241.0
Woody wetlands36,913.736,308.3 34,819.6 1488.7
Emergent herbaceous wetlands15,212.115,053.72301.512,752.2
Change in the Wetlands Area (2001–2021) (km2) to Non-Wetland Types
Shrub/Scrub+7.3+4.7+2.6
Mixed forest+1.2+0.7+0.5
Deciduous forest+0.7+0.4+0.3
Herbaceous+5.4+2.9+2.5
Evergreen forest+28.9+16.2+12.7
Hay/Pasture+5.9+3.4+2.5
Cultivated crops+16.8+12.4+4.4
Developed, open space+254.8+220.4+34.4
Developed, low intensity+181.9+145.8+36.1
Developed, medium intensity+172.2+135.7+36.4
Developed, high intensity+55.0+42.0+13.1
Barren land+33.5+20.7+12.8
Note: Hyphen symbol = not applicable.
Disclaimer/Publisher’s Note: The statements, opinions and data contained in all publications are solely those of the individual author(s) and contributor(s) and not of MDPI and/or the editor(s). MDPI and/or the editor(s) disclaim responsibility for any injury to people or property resulting from any ideas, methods, instructions or products referred to in the content.

