Proceeding Paper

Modeling Long-Term Municipal Solid Waste Generation, Recovery and Landfill Burden in the USA †

by
Saisantosh Vamshi Harsha Madiraju
1,* and
Abhiram Siva Prasad Pamula
2
1
The College of Engineering, The University of Toledo, Toledo, OH 43606, USA
2
Civil Construction and Environmental Engineering, Marquette University, Milwaukee, WI 53233, USA
*
Author to whom correspondence should be addressed.
Presented at the 1st International Online Conference on Urban Sciences (IOCUS 2026), 20–22 May 2026; Available online: https://sciforum.net/event/IOCUS2026.
Environ. Earth Sci. Proc. 2026, 45(1), 8; https://doi.org/10.3390/eesp2026045008
Published: 14 August 2026

Abstract

Over the past six decades, municipal solid waste (MSW) generation in the United States of America (USA) has increased substantially alongside population growth, urbanization, and changing consumption patterns. This study examined historical MSW data from 1960 to 2018 to evaluate long-term relationships among population, total MSW generation, per-capita waste, recycling and composting, combustion with energy recovery, and landfilling. A bounded forecasting framework was then applied to project future MSW pathways through 2200, using official population projections through 2100 and a quadratic extension beyond that horizon. Recycling and composting were capped at 70%, and combustion was fixed at 12.9% of total MSW generation. The results show that although recovery efficiency improves over time, continued growth in total waste generation sustains substantial landfill demand in absolute terms. The findings suggest that long-term MSW sustainability will require not only higher diversion efficiency, but also source reduction, reuse, and broader changes in production and consumption systems.

1. Introduction

In recent decades, the management of municipal solid waste (MSW) has become a central environmental and public health concern in the United States of America (USA) as the nation’s population and rates of consumption have steadily increased [1]. The cumulative effects of economic growth, urbanization, and changes in production and packaging have dramatically altered both the quantity and composition of solid waste, necessitating new strategies for waste diversion, recycling, and resource recovery [2]. Early practices in the 19th and early 20th centuries focused primarily on unregulated local disposal, with American cities slowly adopting organized public works for street cleaning and refuse collection only in the early 1800s [3]. Progress in waste management accelerated through innovations such as truck transportation, motorized street sweeping, incineration, and the establishment of sanitary landfills, eventually culminating in pivotal regulatory developments such as the 1976 Resource Conservation and Recovery Act (RCRA), which reshaped MSW management throughout the nation [4]. By the late 20th century, these foundations paved the way for a modern waste management system encompassing landfill reduction, recycling, composting, and energy recovery, governed by a blend of municipal policy, federal law, and private sector involvement [5,6].
The driving force behind the transformation and intensification of waste management practices has been significant demographic expansion. Between 1960 and 2018, the population of the USA nearly doubled from approximately 180 million to over 335 million residents [7]. With increased population density and consumer demand, the total volume of MSW generated each year rose from 88 million tons in 1960 to 292 million tons in 2018, a more than threefold increase. Simultaneously, per capita waste generation climbed, reflecting changes in lifestyle, consumption habits, and materials used in product manufacturing and distribution [8,9]. On average, Americans generate about 5 pounds of daily waste as disposables rise. These shifts highlight the growing pressure on existing waste infrastructure and underscore the urgency of developing adaptive and innovative systems that can keep pace with both rising volumes and evolving waste characteristics [10,11].
A critical gap in current MSW assessment is the tendency to evaluate progress primarily through diversion rates rather than absolute disposal burden. Although recycling, composting, and landfill diversion have improved substantially, the waste management system of the USA continues to face pressure from both increasing waste quantities and limitations in material recovery adaptability. Landfill utilization has decreased since the 1960s; however, escalating waste generation sustains high disposal demands and reinforces long-term dependence [12]. This mismatch highlights a central sustainability challenge where end-of-life management systems can become more efficient while total disposal burden continues to grow. As environmental regulations evolve, public participation in recycling expands, and combustion with energy recovery becomes a more established component of the MSW portfolio, there is a growing need to evaluate how population growth, consumption, policy, and technological adaptation jointly shape waste-management outcomes [13].
To address this need, this study quantitatively examines fifty-eight years of national MSW management data from 1960 to 2018, focusing on total MSW generation, per-capita waste output, recycling and composting shares, landfill tonnage, and waste processed through combustion with energy recovery. This long-term historical record provides a framework for evaluating both legacy transitions and contemporary changes in waste management in the USA, including the influence of policy mechanisms such as tax incentives for waste optimization and other regulatory drivers that shape system-level outcomes [14,15,16]. By compiling and analyzing these longitudinal trends, the study identifies substantial system shifts, including the expansion of recycling and composting, the decline of open dumping and uncontrolled landfill practices, and the development of more sophisticated waste-to-energy systems. Incorporating population-driven metrics further allows the analysis to distinguish between improvements in management efficiency and growth in the total waste stream driven by demographic and consumption patterns.
This longitudinal perspective is important because MSW sustainability depends not only on how waste is managed after generation, but also on whether recovery systems can keep pace with rising waste production. Statistical comparisons of historical trends can reveal turning points, inflection zones, and persistent structural limitations that are not visible in annual reports alone. These insights are directly relevant to resource conservation, landfill minimization, infrastructure planning, and environmental stewardship, particularly as communities seek to transition from disposal-oriented systems toward circular and adaptive waste-management strategies [17,18,19,20].
By synthesizing historical data, current management practices, and future policy implications, this study provides a data-driven basis for evaluating the long-term performance of MSW systems in the USA. The findings are intended to support policymakers, engineers, environmental scientists, and community decision makers who must plan for waste infrastructure under continued population growth and changing consumption dynamics. This broader contribution of this work is to move MSW evaluation beyond percentage-based indicators and toward a system-level understanding of absolute waste burden, recovery capacity, landfill dependence, and the need for source reduction, reuse, circular design, and technological innovation. Although MSW studies in the USA often emphasize diversion rates, fewer assessments evaluate whether improvements in recovery reduce absolute landfill burden under long-term population and per-capita waste growth. This study addresses that gap by comparing historical changes in relative management shares with projected absolute waste quantities.

2. Methodology and Modeling

2.1. Historical Data Trend Analysis (1960–2018)

This study utilizes fifty-eight years of national MSW management data (1960–2018) to establish baseline trends. The primary data show major trends in municipal solid waste (MSW) generation, recycling, combustion, and landfilling in the USA. This study draws on all available MSW data from the USEPA and integrates it with population statistics from historical U.S. Census Bureau datasets to establish a reconciled analytical baseline [21]. Several scenario implications emerged from this initial analysis:
  • Population (USA): Exhibits a very strong and consistent upward trend across the 1960–2018 period [8].
  • Total MSW Generated: Shows a significant increase over time, with per capita generation rising gradually and remaining relatively stable in the later decades before increasing further in 2018 [21].
  • Recycling & Composting (Total MSW Managed): This is the most dramatic trend. The rate of recycling/composting has increased nearly 10-fold, moving from approximately 6.3% of the MSW stream in 1960 to 38.2% in 2018. This demonstrates a substantial societal shift toward resource recovery [21].
  • Combustion (Energy Recovery): The rate spiked dramatically between 1980 and 1990 (from 1.8% to 14.3%) and has since remained relatively stable, fluctuating between 11.7% and 14.3% of the total MSW generated. The trend is best modeled as a constant average after 2000 [22].
  • Landfilling: While the absolute tonnage landfilled increased until the 2010s, its share of the total MSW stream has plummeted, dropping from about 93.6% in 1960 to about 50.0% in 2018. Landfilling is becoming a smaller proportion of the total waste management portfolio [21].

2.2. Assumptions and Limitations

The long-term forecast, which extends over a span of 182 years (spanning from 2018 out to the 2200 system boundary), is based on a number of simplifying assumptions that help structure the model but also introduce important limitations. The analysis presumes that the main drivers influencing municipal solid waste generation, such as population growth, economic development, policy enforcement, and technological innovation, will remain relatively stable over time. In reality, this is an ambitious assumption, as future decades may bring unforeseen social, economic, or environmental shifts that could significantly alter waste management dynamics [23]. This is a modeling assumption rather than a prediction of actual future conditions.
The model applies official U.S. Census Bureau Middle Series projections through to 2100 and uses a second-degree polynomial extrapolation only for the extended 2110–2200 horizon. Similarly, the model fixes the combustion rate at its recent historical average, assuming limited expansion of energy recovery infrastructure. Recycling and composting are capped at a practical upper limit of 70% to reflect current technological and material constraints, acknowledging that complete diversion from landfills remains unrealistic [12,24]. Landfilling, conversely, is bounded at a logical minimum of 0% to prevent negative outcomes in the data [25,26].
These assumptions (see Table 1) provide analytical clarity and prevent numerical overreach, but they also restrict the model’s ability to capture future innovation or policy transformation. Therefore, the results should be interpreted as a baseline scenario useful for understanding long-term trends and policy stress tests rather than exact forecasts.

2.3. Forecasting Model and Equations

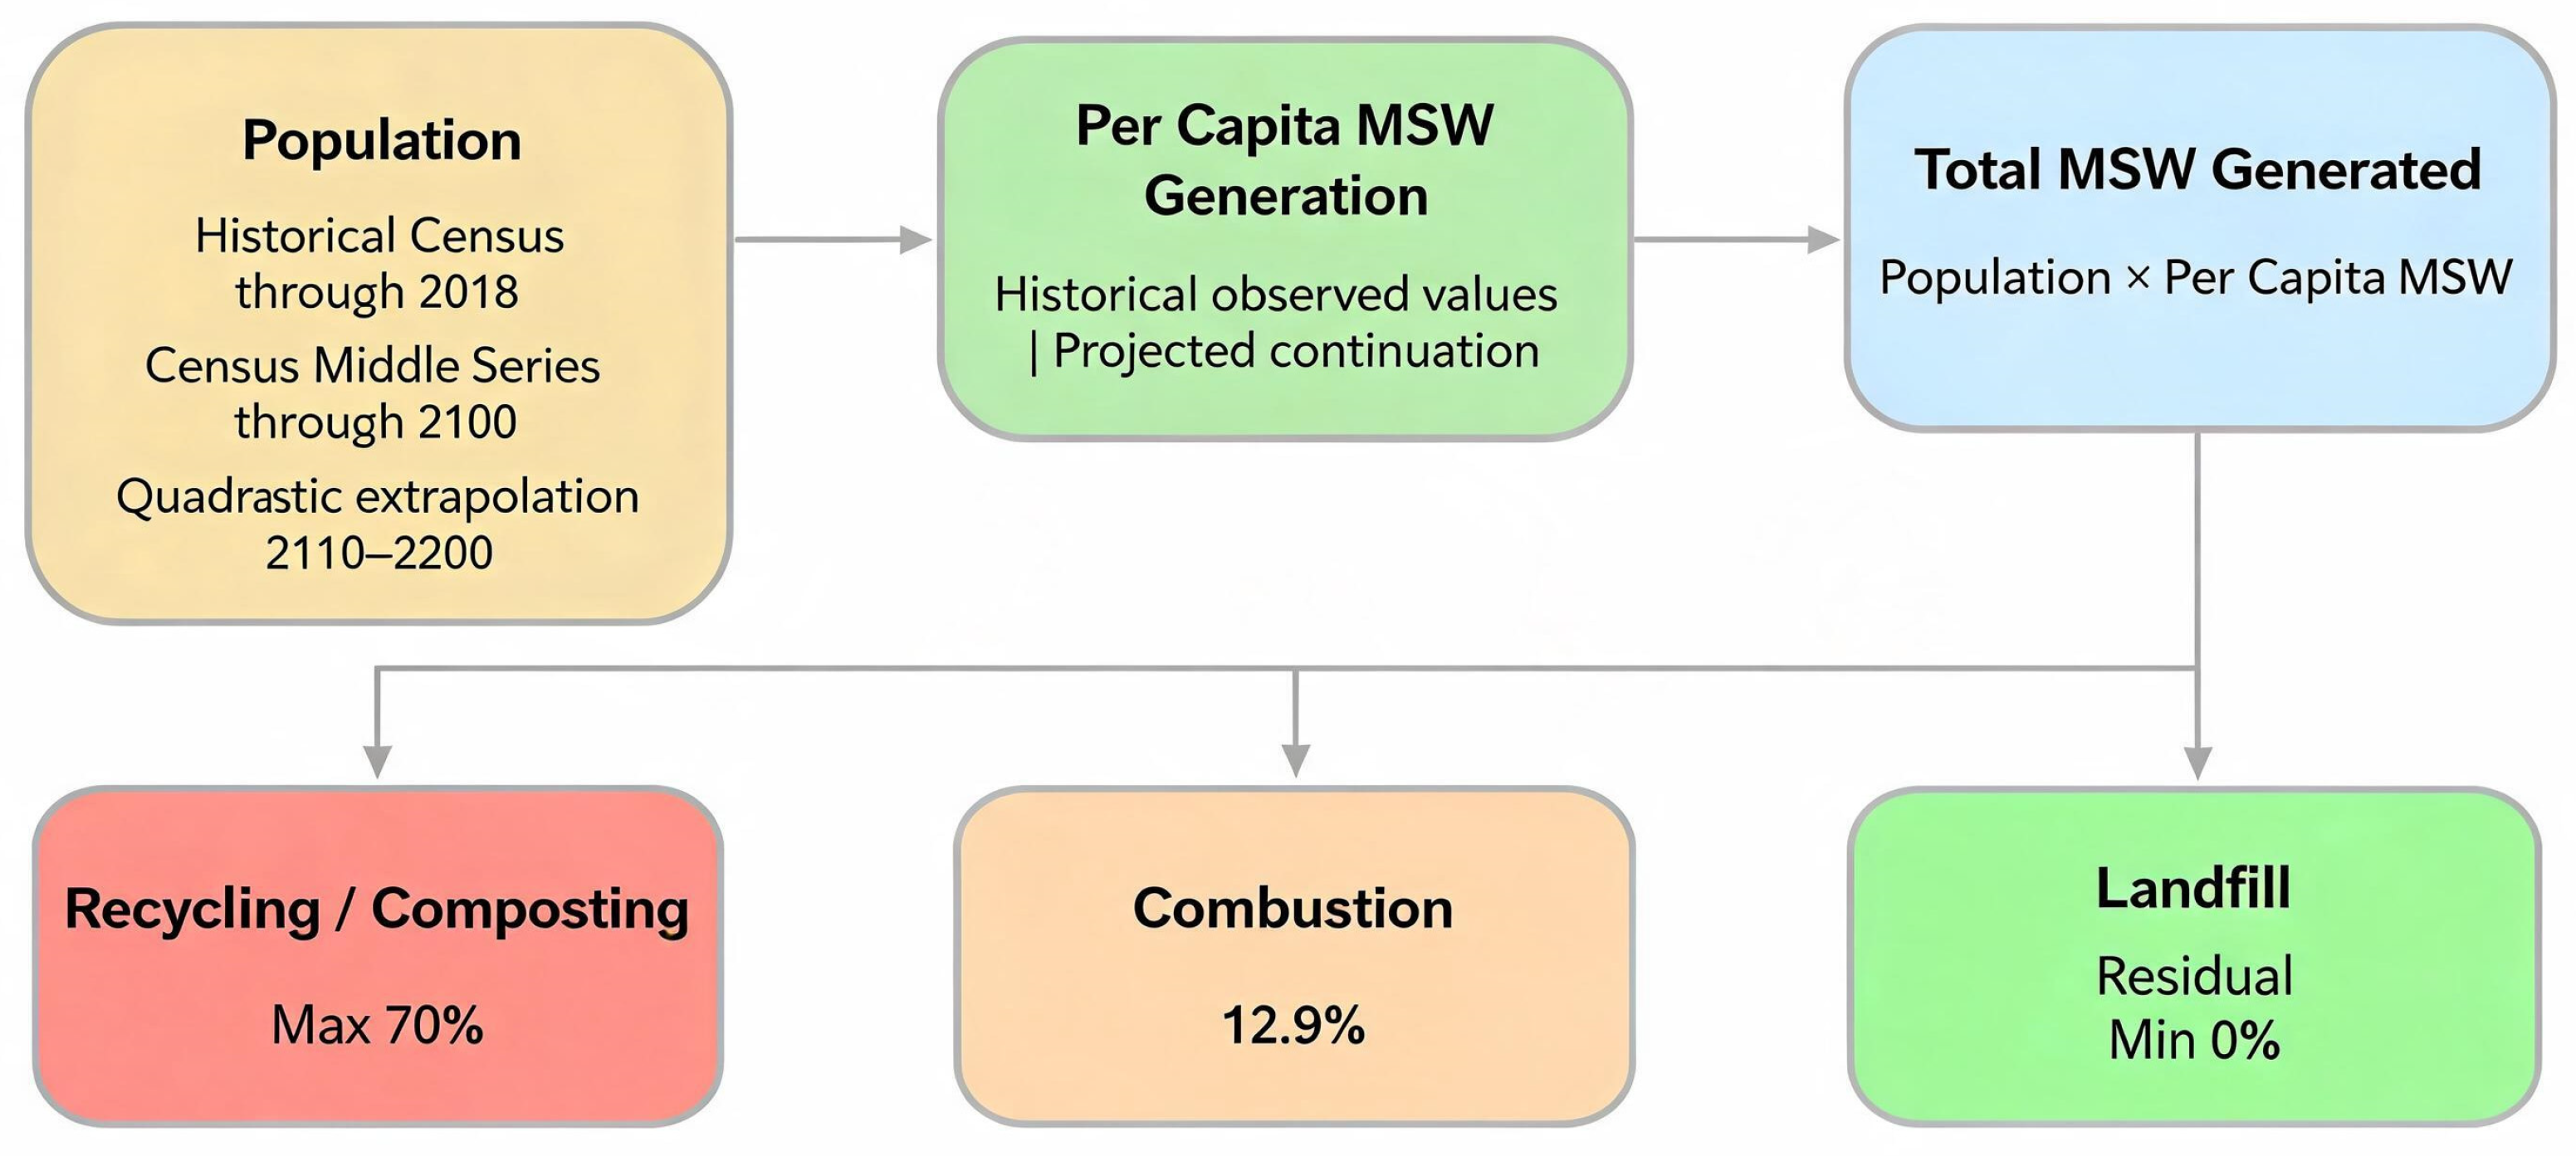
To project the data over a long horizon (182 years), a hybrid regression and validation framework was applied to the historical dataset. To ensure robust predictive validity, the modeling architecture was subjected to an out-of-sample validation step by truncating the training window at 2008 and evaluating predictive accuracy against the historical 2009–2018 window. These models assume the continuation of current political, economic, and technological drivers under explicit caps. Equations (1)–(11) represent the formulation used in the forecasting model. The overall modeling framework is summarized in Figure 1, which depicts how projected population and per-capita MSW generation feed into the total waste stream and how this stream is subsequently allocated to recycling, combustion, and landfill under the imposed caps.
  • Population Growth (P):
Historical metrics through 2018 rely on empirical counts. From 2026 through to the 2100 horizon, the model matches the official deceleration pathway mapped by the U.S. Census Bureau’s Middle Series. To smoothly project from 2110 out to the 2200 system boundary at a 10-year frequency, a quadratic regression is fitted to the late-century turning-point data to extend the demographic trajectory beyond the official projection horizon.
P t = 369,363,000 58,350   t a p e x 6595   t a p e x 2   f o r   Y e a r 2110
where t a p e x represents the number of elapsed years since the projected demographic apex in 2080 ( t a p e x = Year − 2080).
2.
Per Capita MSW Generation ( G p c , t ):
To track waste generation efficiencies across the shifting demographic landscape without relying on a simplified two-phase piecewise constant breakdown, the per capita parameter is formulated to respond directly to the three distinct population methodologies defining the manuscript’s long-term horizons:
Case 1: Historical Baseline Window (Years 1960–2018)
During the empirical baseline era, the per capita waste generation rate is derived directly from the relationship between verified EPA waste outputs and real historical census population counts, tracking the long-term industrial consumption curve:
G p c , t = H i s t o r i c a l   M a t e r i a l s   G e n e r a t e d t R e a l   H i s t o r i c a l   P o p u l a t i o n t
This approach ensures that the model preserves exact historical data points capturing the rise from approximately 0.49 tons per person annually in 1960 to the 0.87 tons per person peak in 2018 prior to executing any future projections.
Case 2: Official Census Projection Window (Years 2026–2100)
For the contemporary projection horizon, the per capita metric is coupled directly with the decelerating population trajectory officially projected by the U.S. Census Bureau’s Middle Series:
G p c , t = P r o j e c t e d   M a t e r i a l s   G e n e r a t e d t C e n s u s   P r o j e c t e d   P o p u l a t i o n t
By modeling per capita generation as a direct quotient of the official census demographic parameters, the framework ensures that mid-to-end century waste dynamics remain strictly synchronized with official national demographic expectations.
Case 3: Extended Quadratic Polynomial Window (Years 2110–2200)
For the long-term, 22nd-century system boundary, the per capita generation rate is evaluated against the population values derived from the best-fit second-degree polynomial equation:
G p c , t = P r o j e c t e d   M a t e r i a l s   G e n e r a t e d t 369,363,000 58,350 t a p e x 6595 t a p e x 2
where t a p e x = year − 2080. This configuration isolates the behavior of the waste stream during the projected long-range demographic contraction period, fulfilling the conditions required for the policy stress test.
3.
Total MSW Generated ( G T o t a l , t ):
The total waste stream is calculated as a joint multiplicative function of the projected population and the per capita generation saturation baseline. This joint total calculation achieves a combined out-of-sample validation score of MAPE = 6.09%.
G T o t a l , t   = P t × G p c , t
4.
Recycling/Composting Rate ( R t ):
The trend of recycling adoption is projected from its historical parameters but remains capped at a maximum institutional and physical recovery ceiling of 70% (0.70), encountering this absolute saturation boundary in the year 2062:
r t   = Historical   Vaseline   Data   for   Year 2018
r t   = min ( 0.0089 .   ( Year 2018 )   +   0.3121 ,   0.70 )   for   Year   > 2018
5.
Combustion Rate ( C t ):
Based on stabilization after 1990, we use the average rate from the last decade of historical data (2008–2018) as a constant:
Ct = 0.129 (Constant at 12.9%)
6.
Landfilled Rate ( L t ) and Tonnage:
The remaining waste after recycling/composting and combustion is assumed to be landfilled. It is capped at zero to prevent negative projections.
L t = max   ( 1 R t C t , 0 )
7.
Tonnage for Each Category:
The tonnage for each management category is derived from the total MSW generated and its projected rate:
Tonnage   for   Each   Category   =   G T o t a l , t   ×   ( r a t e   f o r   e a c h   c a t e g o r y )

3. Results and Discussion

The results of this study show that the long-term challenge of MSW in the USA is not only how waste is managed after generation, but how much waste enters the system in the first place. Historical trends demonstrate substantial progress in landfill diversion, recycling, composting, and energy recovery. However, the scenario results indicate that these improvements may be insufficient when total MSW generation continues to increase. The discussion therefore focuses on the central implication of the analysis: percentage-based improvements in recovery can mask persistent or increasing landfill burden due to urbanization in absolute terms. This distinction is critical for long-term waste planning because landfill capacity, environmental risk, infrastructure demand, and circular economy performance are determined by total waste quantities, not diversion rates alone.
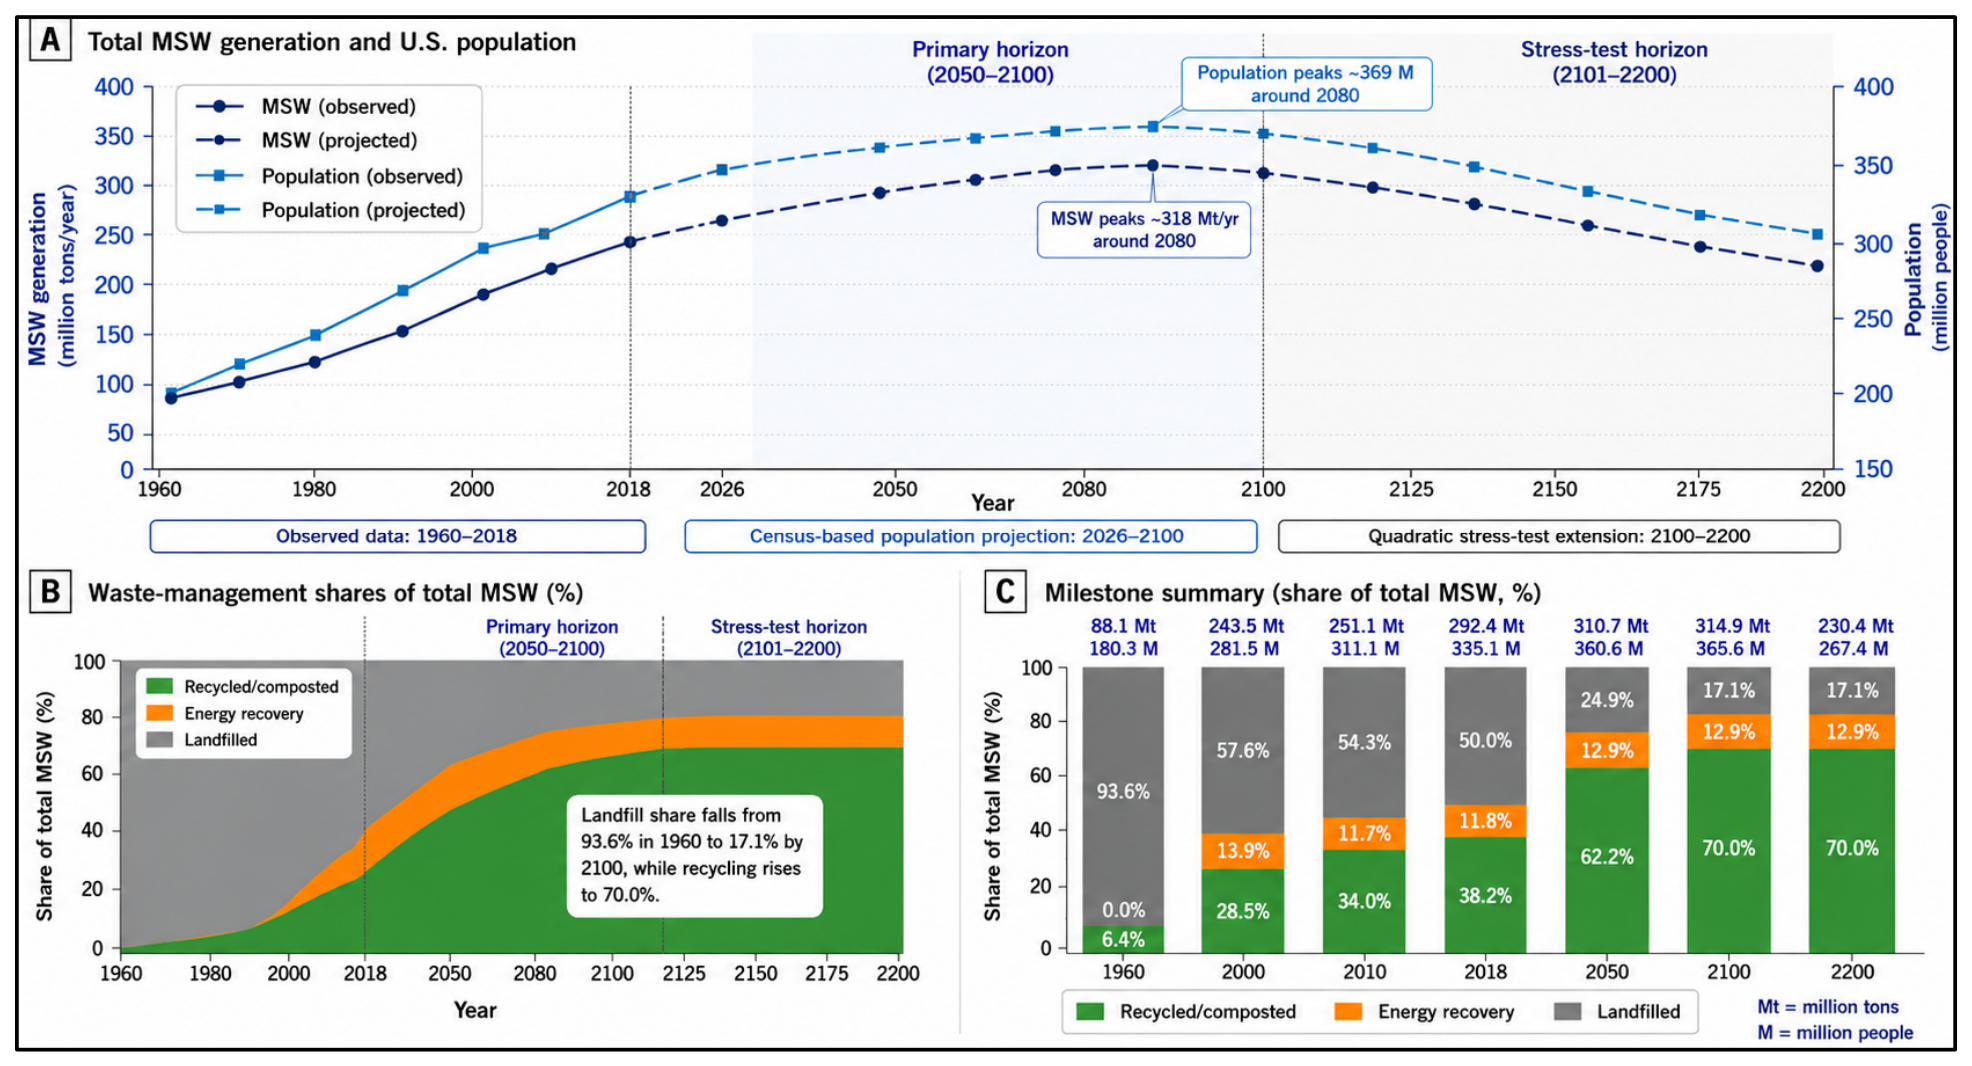
The comparison between historical performance (1960–2018) and the long-term forecast (2026–2200) reveals a fundamental shift in landfilling as a share of total waste from 93.6% to 50.0% MSW management challenge. Historically, the share of total MSW sent to landfills declined from 93.6% in 1960 to 50.0% in 2018. However, a declining landfill share does not necessarily translate into a proportional reduction in absolute disposal burden, particularly as total MSW generation increases through approximately 2080 before declining during the long-term stress-test period.
The high goodness-of-fit values obtained for the 2018–2200 MSW trajectories should be interpreted cautiously because they describe how closely quadratic functions reproduce the modeled projection series rather than how accurately the models predict independent future observations. Total MSW generation showed the strongest fit, with R2 = 0.9972 and adjusted R2 = 0.9968, indicating that nearly all variation in the projected series was explained by the quadratic time trend. Energy recovery also exhibited a strong fit (R2 = 0.9741), whereas recycled and composted waste (R2 = 0.8899) and landfilled waste (R2 = 0.8736) showed comparatively greater deviations from a single quadratic curve.
The quadratic models provided strong fits to the modeled 2018–2200 municipal solid waste (MSW) trajectories (Table 2). The models explained 99.72% of the variation in total MSW generation, 88.99% in recycling and composting, 97.41% in combustion with energy recovery, and 87.36% in landfilled waste. The analysis of variance presented in Table 3 confirmed that all models were statistically significant (p < 0.001), indicating that the quadratic year terms explained substantially more variation than intercept-only models. Total MSW generation and energy recovery exhibited the smallest residual standard errors (1.441 and 0.575 Mt yr−1, respectively), reflecting highly smooth trajectories, whereas recycling and composting and landfilled waste showed larger residual standard errors (11.220 and 11.062 Mt yr−1, respectively). These differences are consistent with changes in trajectory slope resulting from the management constraints imposed in the scenario.
The model behavior was consistent with the assumptions used to generate the projections, including population-based waste generation, a 70% upper limit for recycling and composting, a constant 12.9% combustion share, and landfilling as the residual management pathway. As summarized by the goodness-of-fit statistics in Table 2 and the ANOVA results in Table 3, the quadratic functions provide concise mathematical representations of the modeled trajectories. However, because projected values after 2018 are scenario outputs derived from explicit assumptions rather than independent observations, the reported R2, adjusted R2, F-statistics, and p-values should be interpreted as measures of internal model fit rather than external validation or evidence of forecast accuracy. Overall, the results demonstrate the mathematical consistency of the projected MSW scenario and provide a structured basis for evaluating how demographic trends and management constraints could influence long-term waste-management pathways.

3.1. Historical Shift from Landfill Dominance to Diversified Waste Management

The historical record indicates that the MSW system in the USA has become more diversified with the share of waste sent to landfills declining from 93.6% to 50.0%. However, this improvement should not be interpreted as conclusive evidence of sustainability. A lower landfill percentage does not necessarily mean a lower landfill burden if total MSW generation continues to grow. This distinction reveals a diversion paradox: the system can become more efficient in relative terms while still producing large residual waste quantities requiring disposal.
This finding is important because many waste-management targets emphasize recycling rates, composting rates, or landfill diversion percentages (see Figure 2B for the model considerations). These indicators are useful for measuring management efficiency, but they do not fully describe environmental or infrastructure pressure. Absolute landfill tonnage more directly determines landfill capacity requirements, hauling demand, land use, methane-generation potential, leachate-control needs, and long-term monitoring obligations. Therefore, MSW sustainability should be evaluated using both relative indicators, such as diversion rates, and absolute indicators, such as total MSW generation and landfill tonnage.
The small residual standard errors for total MSW and energy recovery further reflect the smoothness of these modeled trajectories, while the larger errors for recycling and landfilling indicate that their long-term changes are less uniformly represented by one quadratic relationship. All models were statistically significant overall, as indicated by large F statistics and p < 0.001, confirming that year and year squared jointly explained substantial variation in the modeled series. However, these statistics do not constitute external validation because the projection-period values were generated from deterministic population-based assumptions and smooth management trajectories. Consequently, the high R2 values primarily demonstrate internal consistency between the fitted equations and the projected data. Predictive performance should instead be evaluated using observed historical data and an independent or temporally withheld validation period, while the 2018–2200 statistics should be described as curve-fit measures used to summarize the projected trajectories.

3.2. Long-Term Recovery and Residual Landfill Burden

The long-term scenario indicates that increased recovery can substantially reduce landfill dependence even when total MSW generation initially increases. Under the bounded modeling assumptions, recycling and composting increase until reaching the assumed 70% ceiling, while combustion with energy recovery remains fixed at 12.9% of total MSW generation. As these recovery pathways account for a larger share of the waste stream, the proportion of MSW requiring landfilling declines substantially relative to historical conditions.
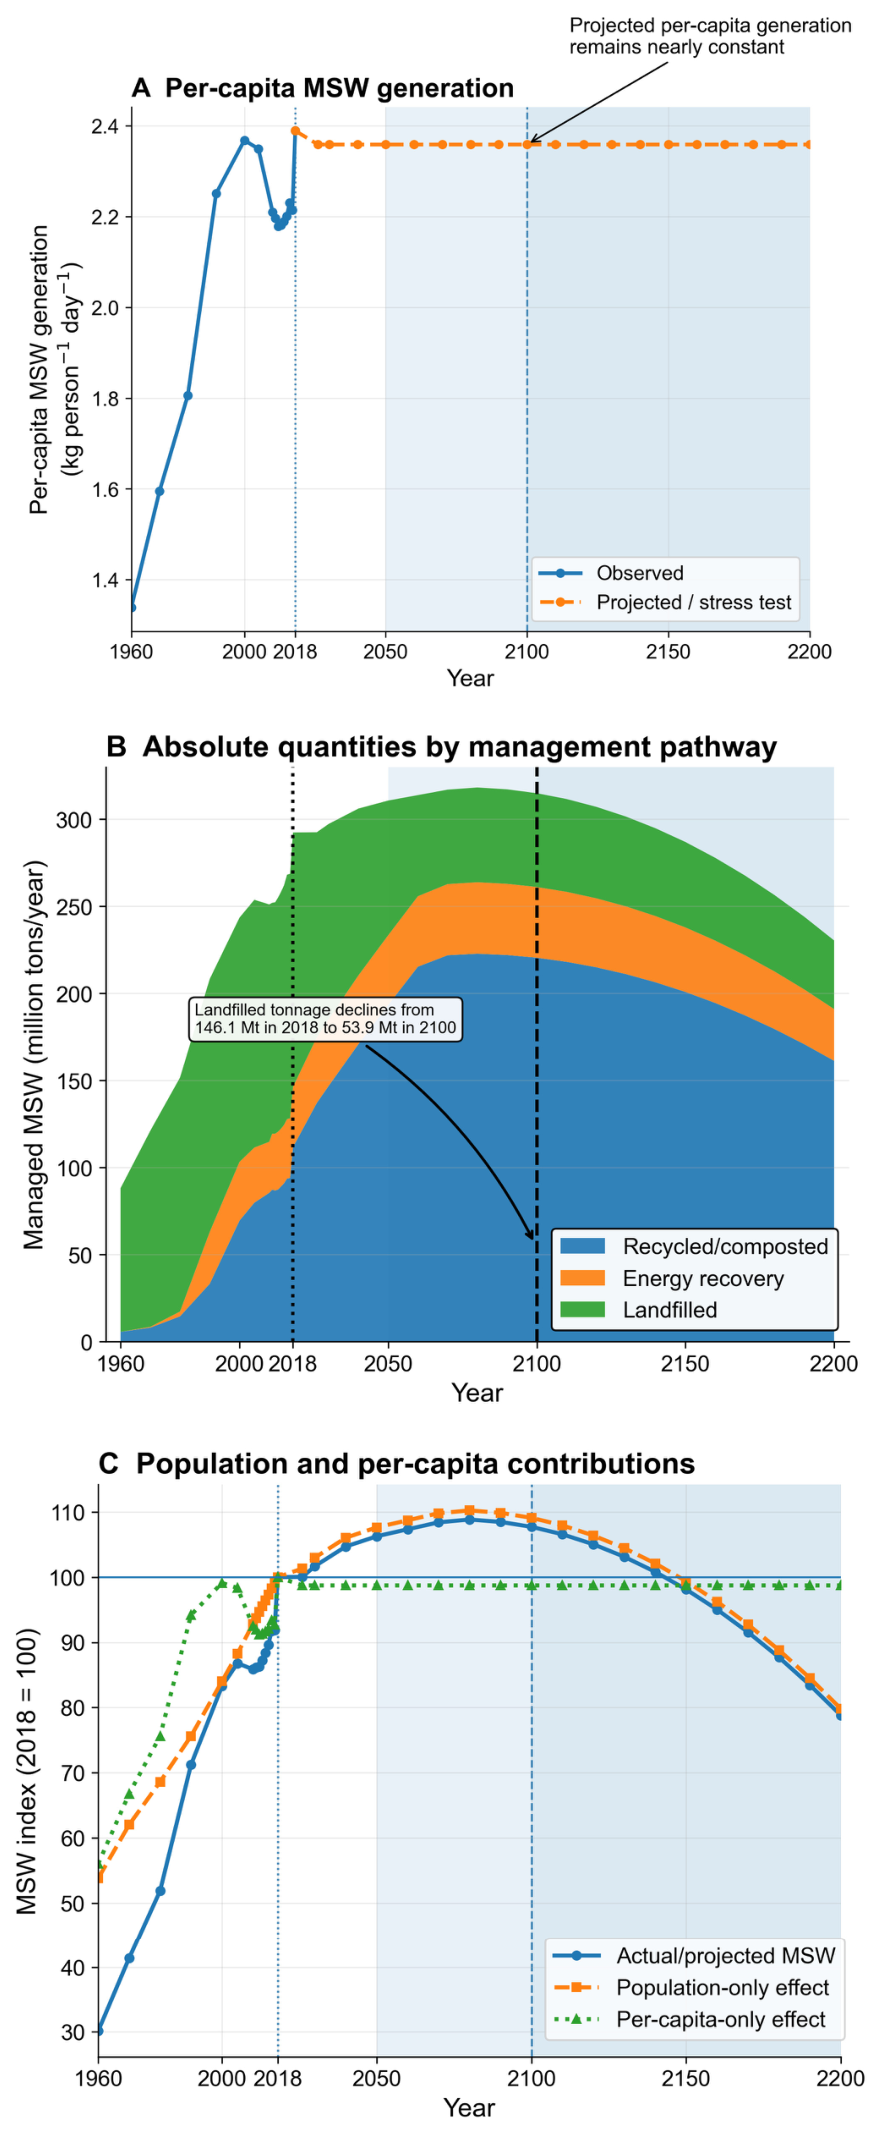
This shift is also evident in the absolute quantities of waste managed through each pathway. Although total MSW generation increases modestly through approximately 2080 before declining, landfilled waste decreases from approximately 146.1 million tons in 2018 to 53.9 million tons in 2100 as recycling and composting expand. During the 2101–2200 stress-test period, the absolute quantities managed through recycling and composting, combustion, and landfilling decline as projected population and total MSW generation decrease. These results therefore indicate that improvements in recovery can reduce both the relative share and absolute quantity of waste sent to landfills under the assumptions of the model.
However, recovery alone does not eliminate landfill demand. Once recycling and composting reach the assumed 70% ceiling and combustion remains fixed at 12.9%, a residual portion of the waste stream continues to require disposal. Further reductions in landfill burden under this scenario would therefore depend on reducing total waste generation, increasing recovery beyond the assumed limits, or shifting waste toward additional management pathways. The results emphasize that recycling, composting, and energy recovery remain important components of long-term MSW management, but their effectiveness is strengthened when combined with upstream strategies such as source reduction, reuse, product redesign, and waste prevention.

3.3. Per-Capita Waste Generation as a Structural Constraint

Per-capita waste generation remains a substantial constraint on long-term MSW sustainability. In the projection, annual MSW generation remains within the range of 2.0 to 2.6 tons per person, while landfill disposal remains above 0.3 tons per person. These values indicate that the system’s future performance depends strongly on material throughput at the source. Even a highly developed recovery system cannot fully compensate for sustained growth in waste generation per person.
This result helps explain why landfill totals can remain significant share when landfill shares improve. After recovery systems mature, further gains become limited by contamination, collection efficiency, sorting constraints, material markets, and the composition of the residual waste stream. Mixed plastics, multilayer packaging, contaminated recyclables, textiles, and other heterogeneous materials are difficult to recover completely. These material constraints make it unlikely that recycling and composting alone can eliminate landfill demand. Therefore, reducing per-capita waste generation is essential for moving from improved waste management toward actual waste reduction.

3.4. Implications for Policy and Engineering Practice

The main policy implication is that diversion targets should be paired with explicit targets for reducing total MSW generation and absolute landfill tonnage. Recycling, composting, and energy recovery remain necessary components of the MSW system, but they should not be treated as stand-alone solutions. If population growth, consumption, packaging use, and material throughput continue to increase, end-of-life recovery will reduce landfill share but may not reduce landfill burden.
For policymakers, this finding supports stronger emphasis on source reduction, product redesign, packaging reduction, reuse systems, repair infrastructure, organics prevention, and extended producer responsibility. For engineers and waste managers, it emphasizes the need to design systems that improve recovery quality while also reducing residual waste. This includes better sorting technologies, contamination control, material-specific recovery pathways, adaptive infrastructure, and planning tools that evaluate absolute waste quantities rather than diversion percentages alone.
The broader implication is that circular economy performance should not be measured only by how much waste is diverted from landfills. A circular system must also reduce the total amount of material becoming waste. Therefore, future MSW planning should shift from asking how to process increasing waste volumes toward asking how to prevent waste generation while maintaining reliable recovery pathways for unavoidable waste.

3.5. Limitations and Future Research

The projection to 2200 should be interpreted as a bounded long-term stress test rather than a precise forecast. The model uses simplifying assumptions, including bounded population extrapolation beyond 2100, a 70% recycling and composting cap, and a fixed combustion rate. These assumptions are useful for testing whether high recovery efficiency can offset continued waste growth, but they cannot capture all future changes in technology, policy, economic structure, material design, demographic patterns, or consumer behavior.
Future research should improve this framework by incorporating independently observable drivers that influence waste generation and management outcomes. Suitable predictors include population, urbanization, household size, gross domestic product, income per capita, consumption expenditures, recycling program coverage, landfill tipping fees, waste-to-energy capacity, material composition, packaging trends, and regional policy differences. Additional scenarios should evaluate aggressive source reduction, extended producer responsibility, organics diversion, reuse-based systems, and circular economy adoption. These extensions would help identify which combinations of policy, infrastructure, and behavioral change are most effective in reducing absolute landfill burden while maintaining high levels of resource recovery.
Figure 3 decomposes the projected municipal solid waste trajectory into changes associated with population and per-capita waste generation. Historical per-capita MSW generation increased from approximately 1.34 kg person−1 day−1 in 1960 to 2.39 kg person−1 day−1 in 2018, but remains nearly constant at about 2.36 kg person−1 day−1 throughout the projection and stress-test periods. Consequently, the projected evolution of total MSW closely follows the population-only counterfactual, increasing modestly through to approximately 2080 before declining until 2200 as the projected population decreases. In contrast, the per-capita-only index remains close to the 2018 baseline, indicating that changes in population dominate the long-term variation in projected MSW under the assumptions of the model. The management-pathway results further show a substantial redistribution of waste away from landfilling and toward recycling and composting. Although total MSW reaches a maximum near 2080, landfilled waste declines from 146.1 million tons in 2018 to 53.9 million tons in 2100, while recycled and composted quantities increase markedly over the same period. During the 2101–2200 stress-test horizon, the absolute quantities managed through all pathways decline as both population and total waste generation decrease.

4. Conclusions

This study shows that MSW changed substantially between 1960 and 2018, but also reveals important limits to end-of-life recovery. During this period, total MSW increased from 88 million tons to 292 million tons, while the share of waste sent to landfills declined from 93.6% to 50%. However, this decline in landfill share did not eliminate the absolute disposal burden as landfill tonnage increased from 82.5 million tons in 1960 to 146 million tons in 2018. Recycling and composting increased from just over 6.4% of MSW generation in 1960 to 38.2% in 2018, with additional food-management pathways further expanding the recovered and managed waste fraction. Combustion with energy recovery also became an established component of the national MSW portfolio, accounting for 11.8% of MSW management in 2018.
The long-term scenario analysis highlights a critical recovery limit. Under the bounded modeling assumptions used in this study, recycling and composting reach an assumed 70% upper limit, while combustion remains fixed at 12.9% of total MSW generation. Total MSW generation increases through approximately 2080 before declining during the later stress-test period. Although higher recovery rates substantially reduce the share and absolute quantity of waste sent to landfills, a residual landfill burden persists throughout the modeled period. These results demonstrate that improvements in diversion efficiency alone do not eliminate the need for disposal and reinforce the importance of source reduction, reuse, and other upstream strategies for achieving long-term reductions in waste generation.
These findings indicate that recycling, composting, and energy recovery are necessary but not sufficient as stand-alone strategies for sustainable MSW management. Long-term reductions in landfill demand will require stronger emphasis on source reduction, material reuse, product redesign, packaging reduction, producer responsibility, and policies that decouple waste generation from population and consumption growth. For engineers, planners, and policymakers, the central implication is that MSW sustainability should be evaluated not only based on diversion rates but also on absolute waste generation and landfill tonnage.
Future research should improve this framework by incorporating independently observable drivers of waste generation, including population, urbanization, household size, gross domestic product, income, consumption expenditures, recycling program coverage, landfill tipping fees, waste-to-energy capacity, material composition, and regional policy differences. These additions would allow future studies to test alternative waste-management pathways, including aggressive source reduction, extended producer/manufacturer responsibility, organics diversion, and circular economy adoption.
Overall, the modeling indicates that improvements in recovery mechanisms alone are insufficient to offset the long-term increase in municipal solid waste generation. Although diversion through recycling, composting, and energy recovery continues to rise, the projected expansion of the waste stream remains a substantial residual burden on landfilling in absolute terms. This suggests that the system may achieve higher efficiency in relative terms while still experiencing persistent disposal pressure. Accordingly, the results underscore the importance of upstream interventions, including waste prevention, reuse, product redesign, and policy measures that decouple material consumption from waste generation if long-term sustainability is to be achieved.

Author Contributions

Conceptualization, S.V.H.M. and A.S.P.P.; methodology, S.V.H.M. and A.S.P.P.; software, S.V.H.M.; validation, S.V.H.M. and A.S.P.P.; formal analysis, S.V.H.M.; investigation, S.V.H.M.; resources, S.V.H.M. and A.S.P.P.; data curation, S.V.H.M.; writing—original draft preparation, S.V.H.M.; writing—review and editing, S.V.H.M. and A.S.P.P.; visualization, S.V.H.M.; supervision, A.S.P.P.; project administration, S.V.H.M.; funding acquisition, Not applicable. All authors have read and agreed to the published version of the manuscript.

Funding

This research received no external funding.

Institutional Review Board Statement

Not applicable. This study did not involve humans or animals.

Informed Consent Statement

Not applicable. This study did not involve humans.

Data Availability Statement

The data used in this study are derived from publicly available sources, including the U.S. Environmental Protection Agency’s municipal solid waste Facts and Figures datasets, as well as publicly accessible demographic and waste-management records cited in the manuscript. The population data used in this study were obtained from Our World in Data and the U.S. Census Bureau.

Acknowledgments

The authors acknowledge the publicly available datasets and reports that supported this research, including national municipal solid waste data from the U.S. Environmental Protection Agency and population datasets from Our World in Data and the U.S. Census Bureau.

Conflicts of Interest

The authors declare no conflicts of interest. All findings, conclusions, and interpretations presented in this work reflect the authors’ independent analyses and professional judgment. They do not represent the positions, views, or endorsements of any data providers or external organizations whose publicly available datasets were used in this study. The authors also declare that they have no known competing financial interests or personal relationships that could have appeared to influence the work reported in this paper.

Abbreviations

The following abbreviations are used in this manuscript:
MSWMunicipal Solid Waste
MtMetric Tons
USAUnited States of America
EPAEnvironmental Protection Agency
RCRAResource Conservation and Recovery Act

References

  1. Louis, G.E. A Historical Context of Municipal Solid Waste Management in the United States. Waste Manag. Res. 2004, 22, 306–322. [Google Scholar] [CrossRef] [Scilit] [PubMed]
  2. Voukkali, I.; Papamichael, I.; Loizia, P.; Zorpas, A.A. Urbanization and Solid Waste Production: Prospects and Challenges. Environ. Sci. Pollut. Res. 2024, 31, 17678–17689. [Google Scholar] [CrossRef] [Scilit] [PubMed]
  3. Melosi, M.V. The Sanitary City: Environmental Services in Urban America from Colonial Times to the Present; University of Pittsburgh Press: Pittsburgh, PA, USA, 2008; Volume 66, ISBN 0-8229-7337-5. [Google Scholar]
  4. Adjei, F.; Afriyie, A. Navigating Solid Waste Management in the United States: A Comparative Analysis of Federal and State Regulatory Frameworks and Practices. Eng. Sci. Technol. J. 2025, 6, 340–354. [Google Scholar] [CrossRef] [Scilit]
  5. McAllister, J. Factors Influencing Solid-Waste Management in the Developing World. Master’s Thesis, Utah State University, Logan, UT, USA, 2015. [Google Scholar]
  6. Madiraju, S.V.H.; Pamula, A.S.P. A Brief Guide to the 50 Eco-Friendly Materials Transforming Sustainable Construction. Austin Environ. Sci. 2024, 9, 1105. [Google Scholar] [CrossRef] [Scilit]
  7. Chamie, J. Population Levels, Trends, and Differentials; Springer: Berlin/Heidelberg, Germany, 2022. [Google Scholar]
  8. Our World in Data Population with UN Projections—United States. Available online: https://ourworldindata.org/grapher/population-with-un-projections?country=~USA&mapSelect=~USA (accessed on 20 December 2025).
  9. Lehmann, S. Optimizing Urban Material Flows and Waste Streams in Urban Development through Principles of Zero Waste and Sustainable Consumption. Sustainability 2011, 3, 155–183. [Google Scholar] [CrossRef] [Scilit]
  10. Chen, D.M.-C.; Bodirsky, B.L.; Krueger, T.; Mishra, A.; Popp, A. The World’s Growing Municipal Solid Waste: Trends and Impacts. Environ. Res. Lett. 2020, 15, 074021. [Google Scholar] [CrossRef] [Scilit]
  11. Mandal, P.; Kundu, A.K.; Mondal, A. Innovations in Waste Management: A Review. In Sustainable Chemical Insight in Biological Exploration; Lincoln University College: Petaling Jaya, Malaysia, 2024; pp. 58–71. [Google Scholar]
  12. Tammemagi, H.Y. The Waste Crisis: Landfills, Incinerators, and the Search for a Sustainable Future; Oxford University Press: Oxford, UK, 1999; ISBN 0-19-988091-3. [Google Scholar]
  13. Jayaraman, A.; Tripathi, S.; Ramakrishnan, S. Regulatory Concerns for Solid Waste Management. In Solid Waste Management: Challenges, Sustainability and Advancements; John Wiley & Sons: Hoboken, NJ, USA, 2026; pp. 397–430. [Google Scholar]
  14. Wilson, D.C. Learning from the Past to Plan for the Future: An Historical Review of the Evolution of Waste and Resource Management 1970–2020 and Reflections on Priorities 2020–2030—The Perspective of an Involved Witness. Waste Manag. Res. 2023, 41, 1754–1813. [Google Scholar] [CrossRef] [Scilit] [PubMed]
  15. Elliott, J.R.; Frickel, S. The Historical Nature of Cities: A Study of Urbanization and Hazardous Waste Accumulation. Am. Sociol. Rev. 2013, 78, 521–543. [Google Scholar]
  16. Madiraju, S.V.H.; Duddu, A.M. Tax Incentives for Industrial PFAS Mitigation: A Potential Environmental Policy Pathway. Int. J. Mod. Trends Sci. Technol. 2025, 11, 29–34. [Google Scholar] [CrossRef]
  17. Madhavaraj, M.; Karthikeyan, K. A Review of Municipal Solid Waste Management and Landfills in India: Environmental Impacts, Sustainable Strategies and Policy Insights. J. Mater. Cycles Waste Manag. 2025, 27, 3076–3099. [Google Scholar] [CrossRef] [Scilit]
  18. Suryawan, I.W.K.; Lee, C.-H. Achieving Zero Waste for Landfills by Employing Adaptive Municipal Solid Waste Management Services. Ecol. Indic. 2024, 165, 112191. [Google Scholar] [CrossRef] [Scilit]
  19. Escamilla-García, P.E. Landfills in Developing Economies: Drivers, Challenges, and Sustainable Solutions. In Technical Landfills and Waste Management: Volume 1: Landfill Impacts, Characterization and Valorisation; Springer: Berlin/Heidelberg, Germany, 2024; pp. 157–170. [Google Scholar]
  20. Madiraju, S.V.H.; Pamula, A. Environmental Sustainability: A Continuous Commitment to Living in Harmony with the Earth. SustainE 2023, 1, 1–8. [Google Scholar] [CrossRef] [Scilit]
  21. US EPA. National Overview: Facts and Figures on Materials, Wastes and Recycling. Available online: https://www.epa.gov/facts-and-figures-about-materials-waste-and-recycling/national-overview-facts-and-figures-materials (accessed on 22 February 2026).
  22. US EPA. Energy Recovery from the Combustion of Municipal Solid Waste (MSW). Available online: https://www.epa.gov/smm/energy-recovery-combustion-municipal-solid-waste-msw (accessed on 22 February 2026).
  23. Wani, A.A.; Khan, I.A.; Yaseen, T. Urbanisation and Urban Governance: Patterns, Institutions and Interventions. In Intersections and Transformations; Routledge: London, UK, 2026; pp. 179–208. [Google Scholar]
  24. US EPA. Circular Economy. Available online: https://www.epa.gov/circulareconomy (accessed on 10 November 2025).
  25. Kemp, R.; Pontoglio, S. The Innovation Effects of Environmental Policy Instruments—A Typical Case of the Blind Men and the Elephant? Ecol. Econ. 2011, 72, 28–36. [Google Scholar] [CrossRef] [Scilit]
  26. Ren, Y.; Zhang, Z.; Huang, M. A Review on Settlement Models of Municipal Solid Waste Landfills. Waste Manag. 2022, 149, 79–95. [Google Scholar] [CrossRef] [Scilit] [PubMed]
  27. US EPA. Advancing Sustainable Materials Management: 2020 Tables and Figures; U.S. Environmental Protection Agency: Washington, DC, USA, 2023.
Figure 1. Model schematic showing how MSW generation is derived from population and per capita waste generation and then allocated to recycling/composting, combustion, and landfill under the study’s assumed constraints (70% recycling cap; 12.9% combustion rate).
Eesp 45 00008 g001
Figure 2. Long-term modeling of MSW generation, population and waste-management pathways (A) Total MSW generation and population of USA. (B) Waste-management shares of total MSW (%). (C) Milestone summary (share of total MSW, %).
Eesp 45 00008 g002
Figure 3. Population and per-capita drivers of long-term U.S. municipal solid waste generation. (A) Historical and projected per-capita MSW generation. (B) Absolute quantities managed through recycling and composting, energy recovery, and landfilling. (C) MSW index decomposed into population-only and per-capita-only effects using 2018 as the baseline. Shading denotes the primary projection horizon (2050–2100) and stress-test horizon (2101–2200).
Eesp 45 00008 g003
Table 1. Key assumptions and their implications for the model.
AreaAssumptionImplications
Long-Term DriversThe analysis assumes that current political, economic, and technological drivers (e.g., waste policy implementation) will continue unchanged for the entire 182-year period.This is highly speculative; in reality, major disruptive events, resource depletion, or new technologies (e.g., full circular economy adoption) could drastically alter these trends.
Population GrowthU.S. Population (P) utilizes official historical census numbers (1960–2018), integrates the official U.S. Census Middle-Series Projections through to 2100, and applies a second-degree polynomial best-fit deceleration model out to 2200 [8].Captures realistic modern demographic shifts, declining birth rates, and population stabilization curves, avoiding the compounding overestimations of simple linear lines.
Combustion Rate CapThe Combustion Rate ( C t ) is assumed to remain constant at 12.9% (the average of the last decade of historical data (2008–2018)) [27].This assumes that energy policy and combustion facility capacity will plateau and not expand significantly, nor will combustion be entirely phased out.
Recycling Rate CapThe Recycling/Composting Rate ( R t ) is capped at a practical maximum of 70% (0.70) [12,24].While the trend would mathematically project rates over 100% in the deep future, a 70% capture rate is considered a realistic maximum efficiency given the heterogeneity of the MSW stream (e.g., waste residuals, difficult-to-separate materials).
Landfill MinimumThe Landfilled Rate ( L t ) is capped at a minimum of 0% [25,26].This is a logical constraint to prevent negative tonnage, ensuring that if recycling and combustion rates increase significantly, they only completely eliminate the need for landfills, but do not result in negative waste quantities.
Per Capita GenerationPer Capita MSW Generation ( G p c ) is modeled using an empirical framework evaluated across three distinct population execution contexts.Reflects the empirical decoupling of consumption from population growth, stabilizing at an established historical maximum baseline rather than projecting infinite growth.
Table 2. Goodness-of-fit statistics for quadratic models of projected U.S. municipal solid waste generation and management, 2018–2200.
Modeled ResponseR2Adjusted R2Residual Standard Error (Mt yr−1)F StatisticModel p-Value
Total MSW generated0.99720.99681.4412981.062.28 × 10−22
Recycled and composted0.88990.876911.22068.687.18 × 10−9
Combusted with energy recovery0.97410.97100.575319.323.29 × 10−14
Landfilled0.87360.858811.06258.772.31 × 10−8
Table 3. Analysis of variance for quadratic models of projected U.S. municipal solid waste trajectories, 2018–2200.
ResponseSourceSum of SquaresMean SquareF Statisticp-Value
Total MSW generatedRegression12,378.46189.22981.12.28 × 10−22
Residual35.32.1
Total12,413.7
Recycled and compostedRegression17,292.18646.168.77.18 × 10−9
Residual2140.2125.9
Total19,432.3
Combusted with energy recoveryRegression210.9105.4319.33.29 × 10−14
Residual5.60.3
Total216.5
LandfilledRegression14,381.97190.958.82.31 × 10−8
Residual2080.2122.4
Total16,462.1
Disclaimer/Publisher’s Note: The statements, opinions and data contained in all publications are solely those of the individual author(s) and contributor(s) and not of MDPI and/or the editor(s). MDPI and/or the editor(s) disclaim responsibility for any injury to people or property resulting from any ideas, methods, instructions or products referred to in the content.