1. Introduction
Water is increasingly recognized not only as a vital resource but also as an economic, environmental, and social asset. However, pricing and cost-recovery mechanisms in many urban water distribution networks (WDN) still fail to reflect the true value and full cost of water services (FWC). This challenge is intensified by the combined pressures of the climate crisis and persistently high levels of Non-Revenue Water (NRW), which threaten both the financial sustainability of water utilities and the long-term availability of water resources. The FWC concept integrates three interrelated components: Direct Costs related to infrastructure operation/maintenance; Environmental Costs associated with ecosystem impacts; and Resource Costs reflecting the opportunity cost of resource depletion, particularly under water scarcity conditions. In practice, pricing policies often account only for direct costs while neglecting environmental and resource costs. Additionally, tariff structures frequently include high fixed charges, which may obscure real losses and weaken incentives for efficient water use and investment in water loss reduction strategies. Previous studies highlighted that the allocation of NRW-related costs among stakeholders remains a major challenge for water utilities and policymakers [
1,
2,
3,
4,
5,
6,
7,
8,
9]. In response, this paper examines the role of cost-reflective and socially fair pricing strategies in promoting sustainable water management. Using the freshwater pipe network of Kozani, Greece, as a case study, the research explores how integrating the full cost of water with transparent tariff structures can support water loss reduction and equitable cost allocation. The study ultimately seeks to address whether a balance can be achieved between financial sustainability, resource stewardship, and social equity in urban water pricing.
2. The Fixed Charge Effect: The Paradox of Inaction Despite High NRW Levels
High NRW levels are widely recognized as one of the main operational and financial challenges for water utilities. NRW represents water that although abstracted, treated, and transported through the WDN does not generate revenues due to unbilled authorized consumption, physical losses, commercial/apparent losses (i.e., meter inaccuracies, data errors), and unauthorized consumption [
3,
10]. Despite the technical and economic importance of NRW reduction, many utilities exhibit a do-nothing or delayed-action approach, even when NRW levels are known to be high. One important structural factor behind this paradox lies in the design of water tariff systems, particularly the extensive use of excessive fixed charges [
3,
6,
7,
10,
11,
12,
13,
14,
15].
2.1. The Role of Fixed Charges in the Water Tariff Structures
Fixed charges are commonly included in water tariffs to ensure stable revenue for water utilities, covering costs related to infrastructure availability, administrative services, and customer connections. These charges, which should be independent of the actual volume of water consumed, are billed per billing period or per connection. While justified fixed charges support financial stability, when they exceed their justified levels (called Minimum Charge Difference-MCD), they decouple revenue from actual water consumption. This decoupling reduces the financial visibility of water losses. When a significant share of utility revenue originates from fixed components rather than volumetric charges, the economic consequences of high NRW levels become less apparent in financial statements. As a result, utilities may experience weaker incentives to invest in leak detection, network rehabilitation, pressure management, or improved metering systems, since revenue streams remain relatively stable regardless of operational inefficiencies.
2.2. The Impact of the MCD on the NRW Perception and the Revenue-Protection Paradox
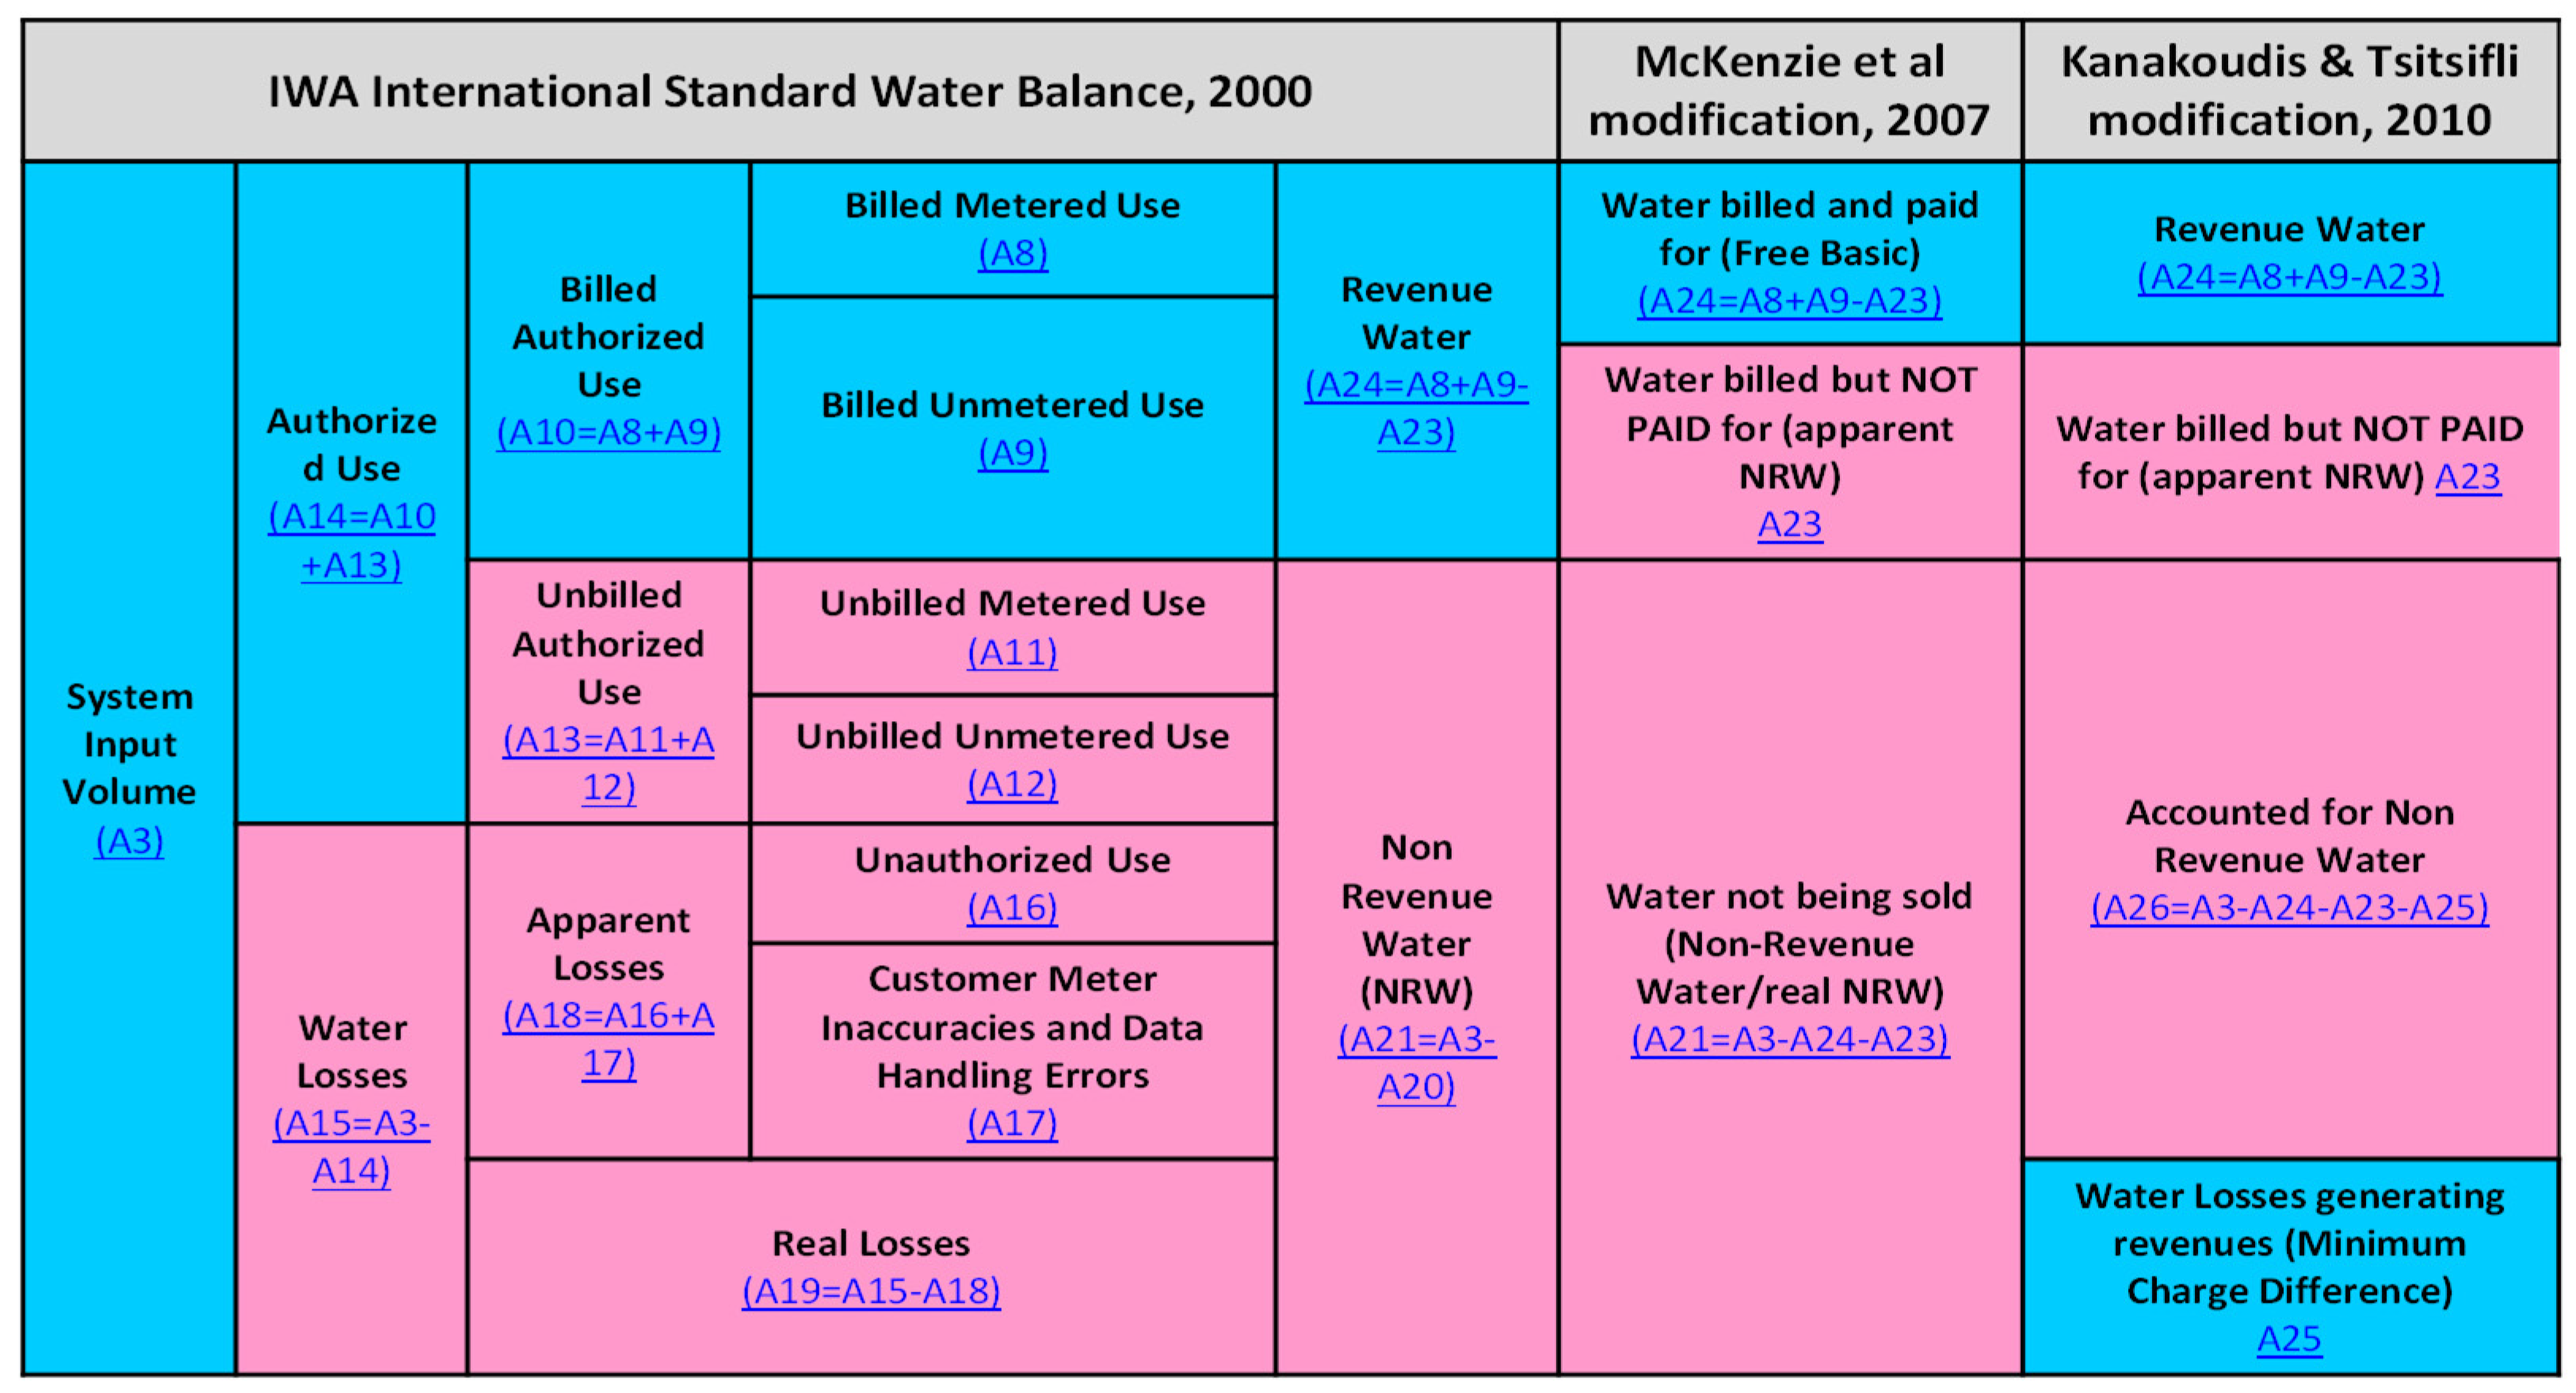
As the MCD-related volumes are included in billed authorized consumption, they artificially increase the level of revenue water. Since NRW is calculated as the difference between System Input Volume and billed consumption, this accounting practice leads to an underestimation of actual NRW levels. This distortion may create a misleading perception of system performance. Utilities may appear to have lower NRW levels than they do, which can delay corrective measures and investment in water-loss reduction programs.
Figure 1 illustrates the mechanism through which the MCD affects NRW [
1,
16,
17], demonstrating how the MCD artificially increases the billed water use volume, thereby reducing the calculated NRW percentage even though the physical losses remain unchanged.
Empirical observations from several European and Mediterranean urban water utilities indicate that tariff structures characterized by high fixed charges often coexist with high NRW levels [
3,
10]. In these cases, the fixed charge acts primarily as a revenue-protection mechanism, ensuring financial stability despite operational inefficiencies. This situation creates a structural paradox: utilities may maintain adequate revenues without addressing the underlying causes of water losses. Consequently, tariff structures that aim to guarantee cost recovery may inadvertently reduce incentives for operational improvements.
2.3. Implications for Water Pricing Policy
The analysis highlights a fundamental misalignment between tariff design and operational performance accountability. If pricing structures are not aligned with actual water consumption and water loss levels, utilities may lack sufficient economic incentives to prioritize NRW reduction. Addressing this issue requires a shift toward tariff structures that better reflect real water use, ensuring transparency in both cost recovery and water consumption. Reducing the dominance of fixed charges and strengthening volumetric pricing components could enhance the visibility of water losses and encourage utilities to invest in efficient water management strategies. Ultimately, aligning tariff policies with the true cost and value of water services is essential for achieving both financial sustainability and sustainable water resource management.
3. Pricing the Cost of the Water Losses Reduction Strategies: Who Is Paying the Bill?
The implementation of Water Loss Reduction Strategies (WLRS) in WDNs requires substantial capital investments and operational expenditures aimed at reducing Current Annual Real Losses (CARL) toward the Economic Annual Real Losses (EARL) level. Typical interventions include pressure management, active leakage control, infrastructure rehabilitation, improved metering systems, and enhanced monitoring technologies. Although these measures significantly improve system efficiency and reduce unnecessary water abstraction, their implementation often faces financial constraints, which delay or discourage utilities from undertaking the necessary investments [
4,
5,
6,
7]. A critical policy issue therefore emerges regarding the allocation of the costs associated with NRW reduction. In practice, utilities frequently attempt to recover these costs through tariff increases or the introduction of additional fixed charges. While such approaches may provide short-term financial relief, they undermine affordability, reduce public acceptance, and generate social inequities. Furthermore, transferring the full cost burden to consumers weakens the incentives for utilities to improve operational efficiency/optimize system performance.
From an economic perspective, the benefits of WLRS are distributed among multiple stakeholders. Utilities benefit from reduced operational costs and improved system performance, society benefits from enhanced environmental protection and resource conservation, and consumers benefit from improved service reliability and long-term cost stability. Consequently, allocating the entire financial burden to a single stakeholder group would fail to reflect the distribution of benefits generated by WLRS investments. To address this imbalance, a tripartite cost-allocation framework is presented here, grounded in principles of economic efficiency, operational responsibility, and distributive justice. Within this framework, the financial burden of WLRS is shared among three key actors: the water utility, the State, and the consumers. Such a balanced allocation recognizes both the operational responsibilities of utilities and the broader societal benefits associated with improved water resource management, thereby supporting both financial sustainability and social equity in urban water services.
3.1. The Role of the Water Utility
The water utility, as the primary operator of the WDN, holds direct responsibility for its operation, maintenance, and management. Consequently, it should assume a substantial share of the investments required for the implementation of WLRS. This responsibility arises not only from the utility’s operational role but also from the direct benefits it derives from improved system performance. Reducing real losses generates multiple economic advantages for the utility. Lower leakage levels reduce the volume of water being abstracted, treated, and pumped, thereby decreasing energy consumption and operational costs. In addition, improved network performance enhances service reliability, reduces the frequency of emergency repairs, and extends the lifespan of WND’s assets. These improvements translate into long-term financial savings and increased operational efficiency, making the allocation of a significant portion of WLRS investments to the utility economically justified. From a managerial perspective, water utilities are also the stakeholders best positioned to identify network vulnerabilities, prioritize infrastructure rehabilitation, and implement technical interventions such as pressure management, active leakage control, and advanced monitoring systems [
16,
17,
18,
19,
20,
21]. Their access to operational data and system knowledge enables them to design targeted and cost-effective loss-reduction programs. Therefore, the active participation of water utilities in both the financing and implementation of WLRS is a critical prerequisite for achieving sustainable WDN management. By internalizing part of the investment costs, utilities are incentivized to optimize operational practices and improve overall system performance.
3.2. The Role of the State
The State plays an important role in water governance through regulation, infrastructure planning, and environmental protection policies. WLRS contribute not only to improved utility performance but also to broader public objectives, including water resource conservation, climate resilience, and environmental protection. For this reason, the State should participate in financing WLRS investments through mechanisms such as grants, subsidies, or co-financing programs. Public financial support can be particularly justified in cases where existing infrastructure was originally developed through public funding or where WLRS contribute to national or regional sustainability goals [
17,
18]. State participation also helps ensure that utilities operating in economically constrained regions can still implement necessary WLRS without imposing excessive tariff increases on consumers.
3.3. The Role of the Consumers
Water consumers ultimately benefit from improved water services resulting from effective water loss reduction strategies. These benefits include increased reliability of supply, improved water quality, reduced environmental pressures on water resources, and lower long-term costs associated with water production and treatment. However, consumers should only bear a proportionate share of WLRS costs through water tariffs. Excessive cost transfers to consumers can negatively affect affordability and undermine public trust in utilities. Thus, a balanced approach is necessary, ensuring that tariff adjustments reflect the real benefits received by consumers without disproportionately burdening them. In this context, pricing mechanisms should aim to distribute costs in a manner that preserves equity, affordability, and transparency while still contributing to cost recovery.
3.4. Toward a Socially Balanced Cost-Recovery Framework
The proposed tripartite allocation framework challenges the prevailing practice in many water utilities of transferring the majority of NRW-related lost revenues and WRLS costs to consumers through fixed charges or uniform tariff increases. Such approaches often weaken price signals, reduce incentives for efficient water use, and may obscure the economic implications of system inefficiencies. Instead, a scientifically grounded and socially balanced cost-recovery mechanism should be adopted, integrating economic analysis with principles of fairness and sustainability. By distributing the financial burden of WRLS among utilities, the State, and consumers, it becomes possible to advance effective NRW mitigation strategies while maintaining both financial viability and social equity in water service provision. This approach ensures that investments in WRLS are treated not only as operational expenditures but also as strategic investments in long-term resource sustainability and infrastructure resilience.
4. Calculating the Socially Fair Water Price: A Case Study from Kozani (Greece)
This section applies the proposed methodological framework to estimate a socially fair and financially viable water tariff, using the WDN of Kozani, Greece, as a case study. The analysis aims to determine a pricing structure capable of achieving FWC recovery while simultaneously preserving affordability and promoting efficient water use [
6,
7]. The methodology operationalizes the three core components of FWC—Direct Costs (DC), Environmental Costs (EC), and Resource Costs—within a dynamic analytical framework that incorporates both water demand elasticity and water loss reduction mechanisms. By explicitly linking tariff design with system performance parameters, the model captures the interactions between pricing signals, consumption behavior, and operational efficiency. This integrated approach enables the evaluation of how cost-reflective pricing can influence demand patterns, reduce system losses, and improve overall cost recovery. In doing so, the framework provides a basis for assessing pricing strategies that balance financial sustainability, resource stewardship, and social equity in urban WDNs.
4.1. Decomposition of the Full Water Cost
The first step of the analysis consisted of decomposing the financial accounts of the Kozani municipal utility into detailed operational and capital cost categories. These expenditures were then allocated across the seven functional components of the urban water cycle: water abstraction, water conveyance, water treatment, water storage, water distribution, administration and management, and wastewater management. Each cost component was subsequently classified according to the FWC framework, distinguishing between DC, EC, and RC. This decomposition allowed the calculation of the total system cost associated with water service provision, ensuring that both operational expenses and externalities were incorporated into the pricing analysis.
4.2. Baseline Price for Full Cost Recovery
Based on the calculated FWC and the existing System Input Volume (SIV), a baseline unit water price is estimated. This price represents the tariff required to achieve full cost recovery under current demand conditions, assuming that consumption levels remain unchanged. Thus, the baseline price reflects the true economic cost of water services, accounting for infrastructure operation, environmental impacts, and the opportunity cost of water resource depletion. However, implementing such a tariff directly may significantly influence consumer behavior, as water demand typically responds to price changes.
4.3. Incorporating Demand Elasticity and Loss Reduction
To address this interaction, the methodology incorporates the price elasticity of water demand. When water tariffs increase, consumption generally decreases, which leads to a reduction in the total water supplied by the system. Lower water production reduces operational costs as well as environmental and resource pressures associated with water abstraction and treatment. In addition, changes in system demand influence the economically optimal level of water losses, represented by the transition from Current Annual Real Losses (CARL) toward Economic Annual Real Losses (EARL). Lower demand reduces system pressures and infrastructure stress, potentially contributing to lower leakage rates and improved network efficiency [
22,
23,
24]. These interactions are modeled through an iterative simulation process, where water demand, water losses, and the Full Water Cost are recalculated under successive pricing scenarios.
4.4. Determination of the Socially Fair Water Price
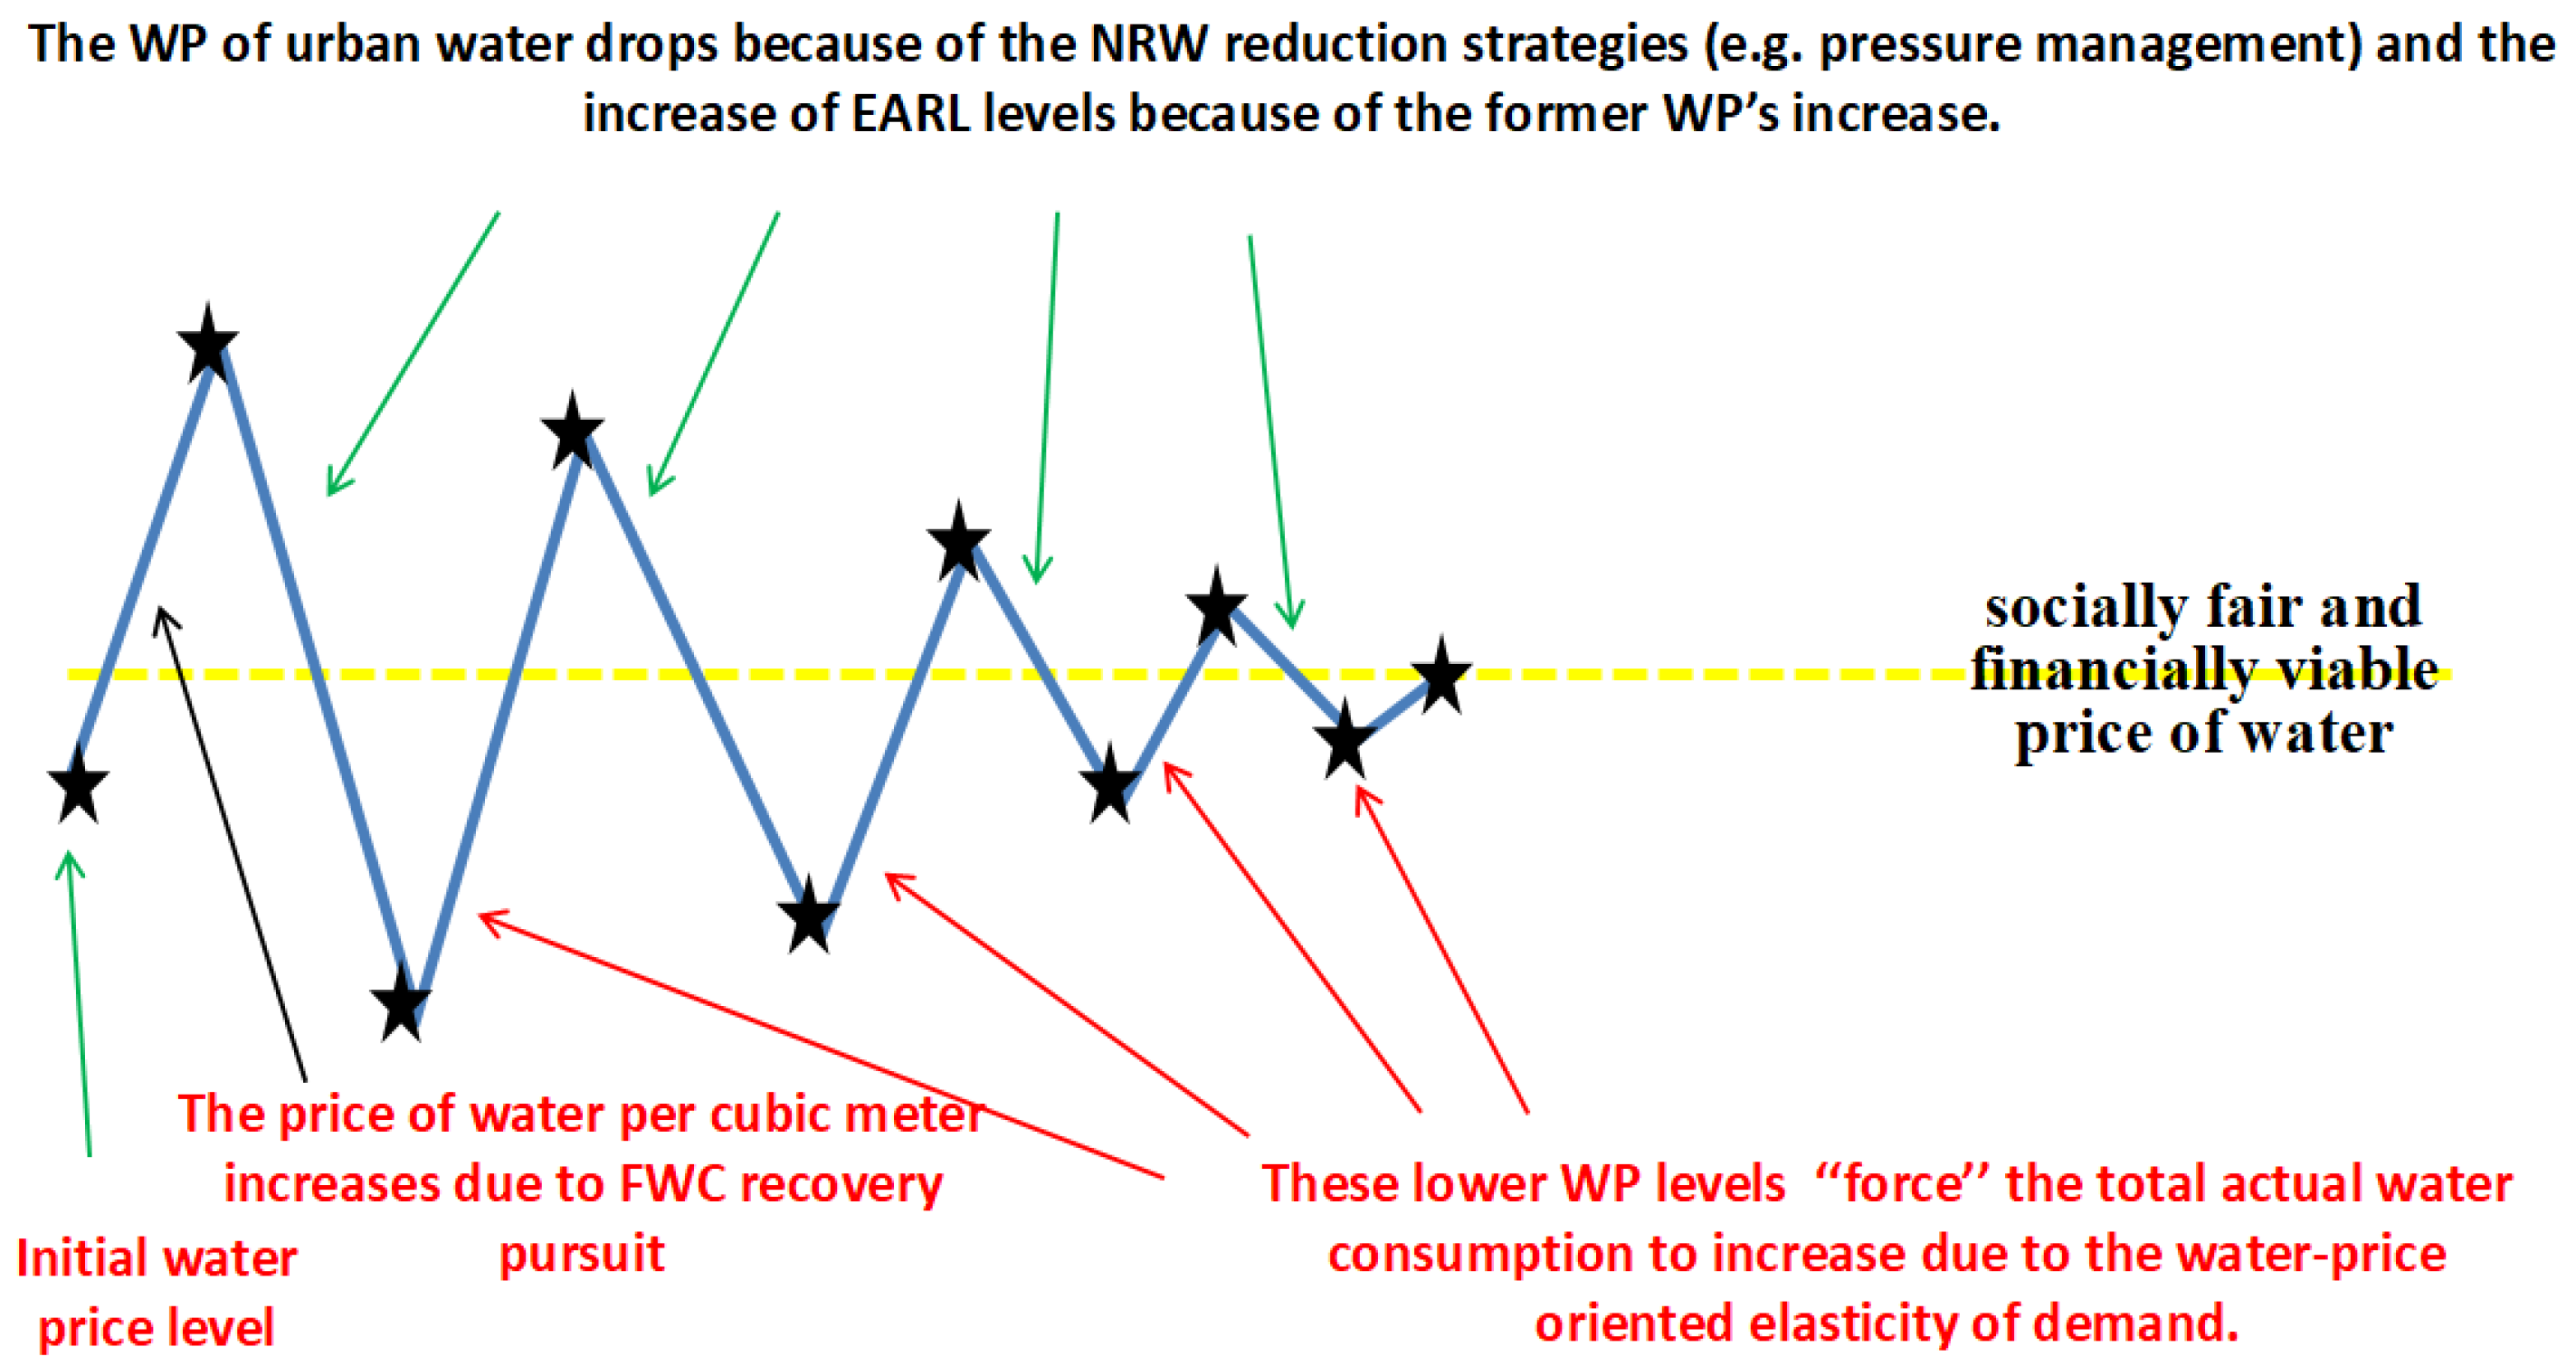
The simulation results indicate that, for the Kozani case study, an initial increase of approximately 47% in the average unit water price would be required to achieve full recovery of Direct, Environmental, and Resource Costs under current demand conditions. Although this adjustment may appear significant in the short term, the dynamic modeling shows that tariff levels may gradually decline over time as system efficiency improves. Lower water demand, reduced leakage levels, and decreased environmental and resource costs contribute to a progressive reduction in the FWC. This interaction highlights the feedback mechanism between pricing, demand, and operational efficiency, where appropriate pricing signals lead to lower consumption and improved system performance.
Figure 2 presents the evolution of the socially fair and financially viable water price under different system conditions, illustrating the convergence toward a balanced equilibrium between cost recovery, resource conservation, and affordability.
4.5. Stepwise Methodology for Price Adjustment
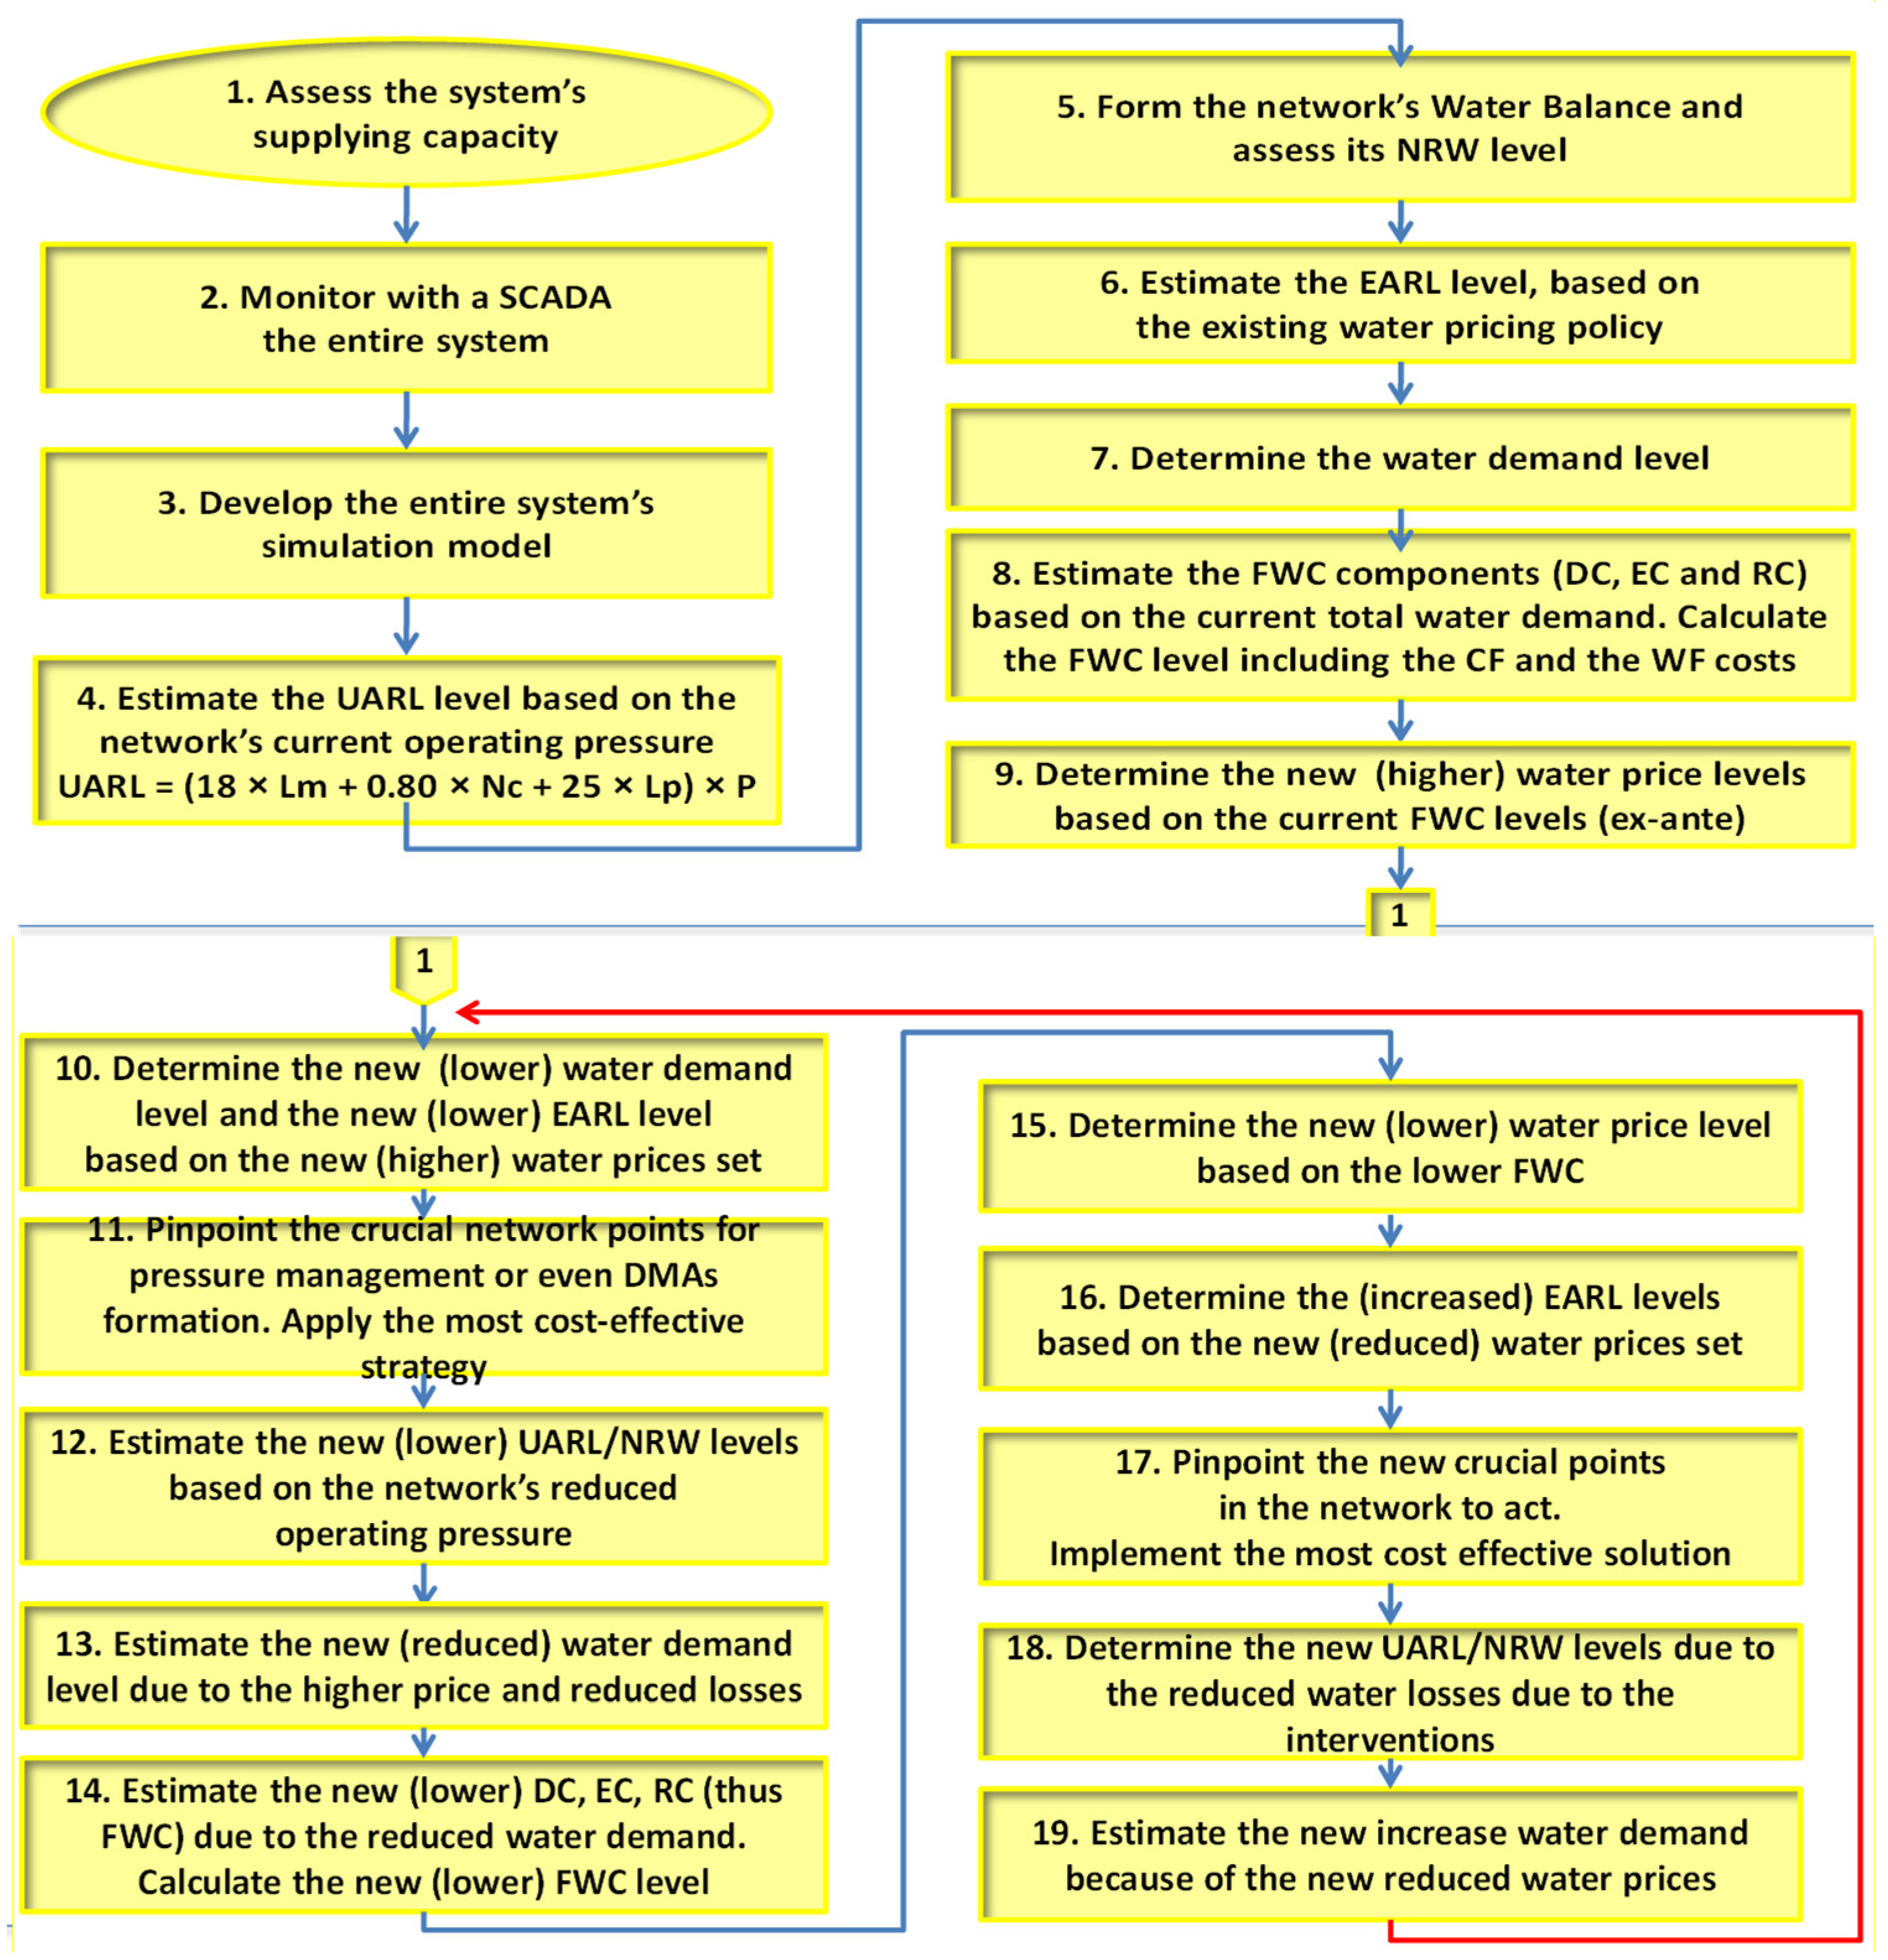
The process of determining a socially fair tariff can be described through a stepwise analytical framework. The methodology begins with the estimation of the system’s Full Water Cost and the calculation of the baseline price required for cost recovery. Subsequently, demand elasticity effects are introduced to estimate how consumption responds to tariff adjustments. The reduction in water demand leads to adjustments in water production levels, environmental impacts, and resource costs. These changes modify the Full Water Cost and therefore require recalculation of the corresponding tariff level. The process continues iteratively until a stable equilibrium between demand, losses, and cost recovery is reached (
Figure 2). This stepwise approach ensures that pricing policies remain responsive to both economic conditions and system performance improvements.
Figure 3 summarizes the overall methodological framework, which presents the sequence of analytical steps used to determine a socially fair and financially viable water price.
The application of the proposed methodology to Kozani’s case demonstrates that adaptive, data-driven pricing mechanisms can simultaneously support full cost recovery, promote efficient water use, and facilitate the implementation of water loss reduction strategies. By integrating economic pricing signals with operational system performance, the approach provides a structured framework for addressing both financial and resource management challenges in urban water supply systems. An increase in the water tariff generates adjustments in water consumption due to the price elasticity of demand. As consumption declines, the total volume of water supplied by the system is reduced, which subsequently lowers environmental and resource costs associated with water abstraction and treatment. These changes influence the economically optimal level of water losses and lead to a recalibration of the Full Water Cost. Through successive iterations of the model, water price, demand, and water loss levels gradually converge toward a system equilibrium, where tariff levels ensure cost recovery while maintaining economically efficient consumption levels [
25,
26,
27,
28,
29]. In the Kozani case, the resulting equilibrium corresponds to a socially fair and financially sustainable water price, which balances affordability, operational efficiency, and resource conservation. Overall, the case study illustrates how integrating water pricing policy, NRW reduction strategies, and Full Water Cost recovery principles can provide a coherent analytical framework for supporting evidence-based decision-making in urban water utilities.
4.6. Per Capita Tariff Structuring and Social Fairness Assessment
To complement the Full Water Cost framework, an additional analysis was conducted to assess the impact of tariff structure on social equity. A per capita pricing approach was introduced, where both volumetric charges and fixed components are expressed per individual rather than per connection. All scenarios were calibrated under a revenue neutrality condition, ensuring constant total utility revenues.
Table 1 summarizes the results of the revenue-normalized scenarios. The existing connection-based tariff leads to distortions, as larger households are shifted to higher consumption blocks, resulting in disproportionately higher per capita charges. In contrast, per capita pricing aligns charges with actual individual use. Results indicate increased charges for single-person households with high per capita consumption, marginal changes for two-person households, and significant reductions for larger households. This demonstrates that per capita pricing improves proportionality and redistributes costs more equitably.
4.7. NRW-Related Lost Revenues: Who Is Paying Them Actually?
Socially fair water pricing should not only include a fair estimation of the opportunity cost that consumers should pay but also allocate the FWC to the users. However, it is crucial to see what will happen in cases where NRW levels are high. The water utilities usually charge all the NRW-related lost revenues to the consumers, although they are not fully responsible for it. For example, if a WDN experiences a 50% NRW, the water utility will charge twice the price of water to recover the lost revenues [
8,
11,
12,
13,
14,
15,
22,
23,
24,
30,
31,
32,
33,
34,
35,
36,
37,
38,
39,
40]. A socially fair cost allocation of the water users among the users should take place. A WDN has two major water users: all kinds of consumers and the water network itself, since water is being lost through leaks and breaks. The water volume entering the network (Q
SIV) can thus be divided into two uses: (a) the actual consumption (Q
CUST); and (b) the NRW partially used (i.e., water losses) by the network (Q
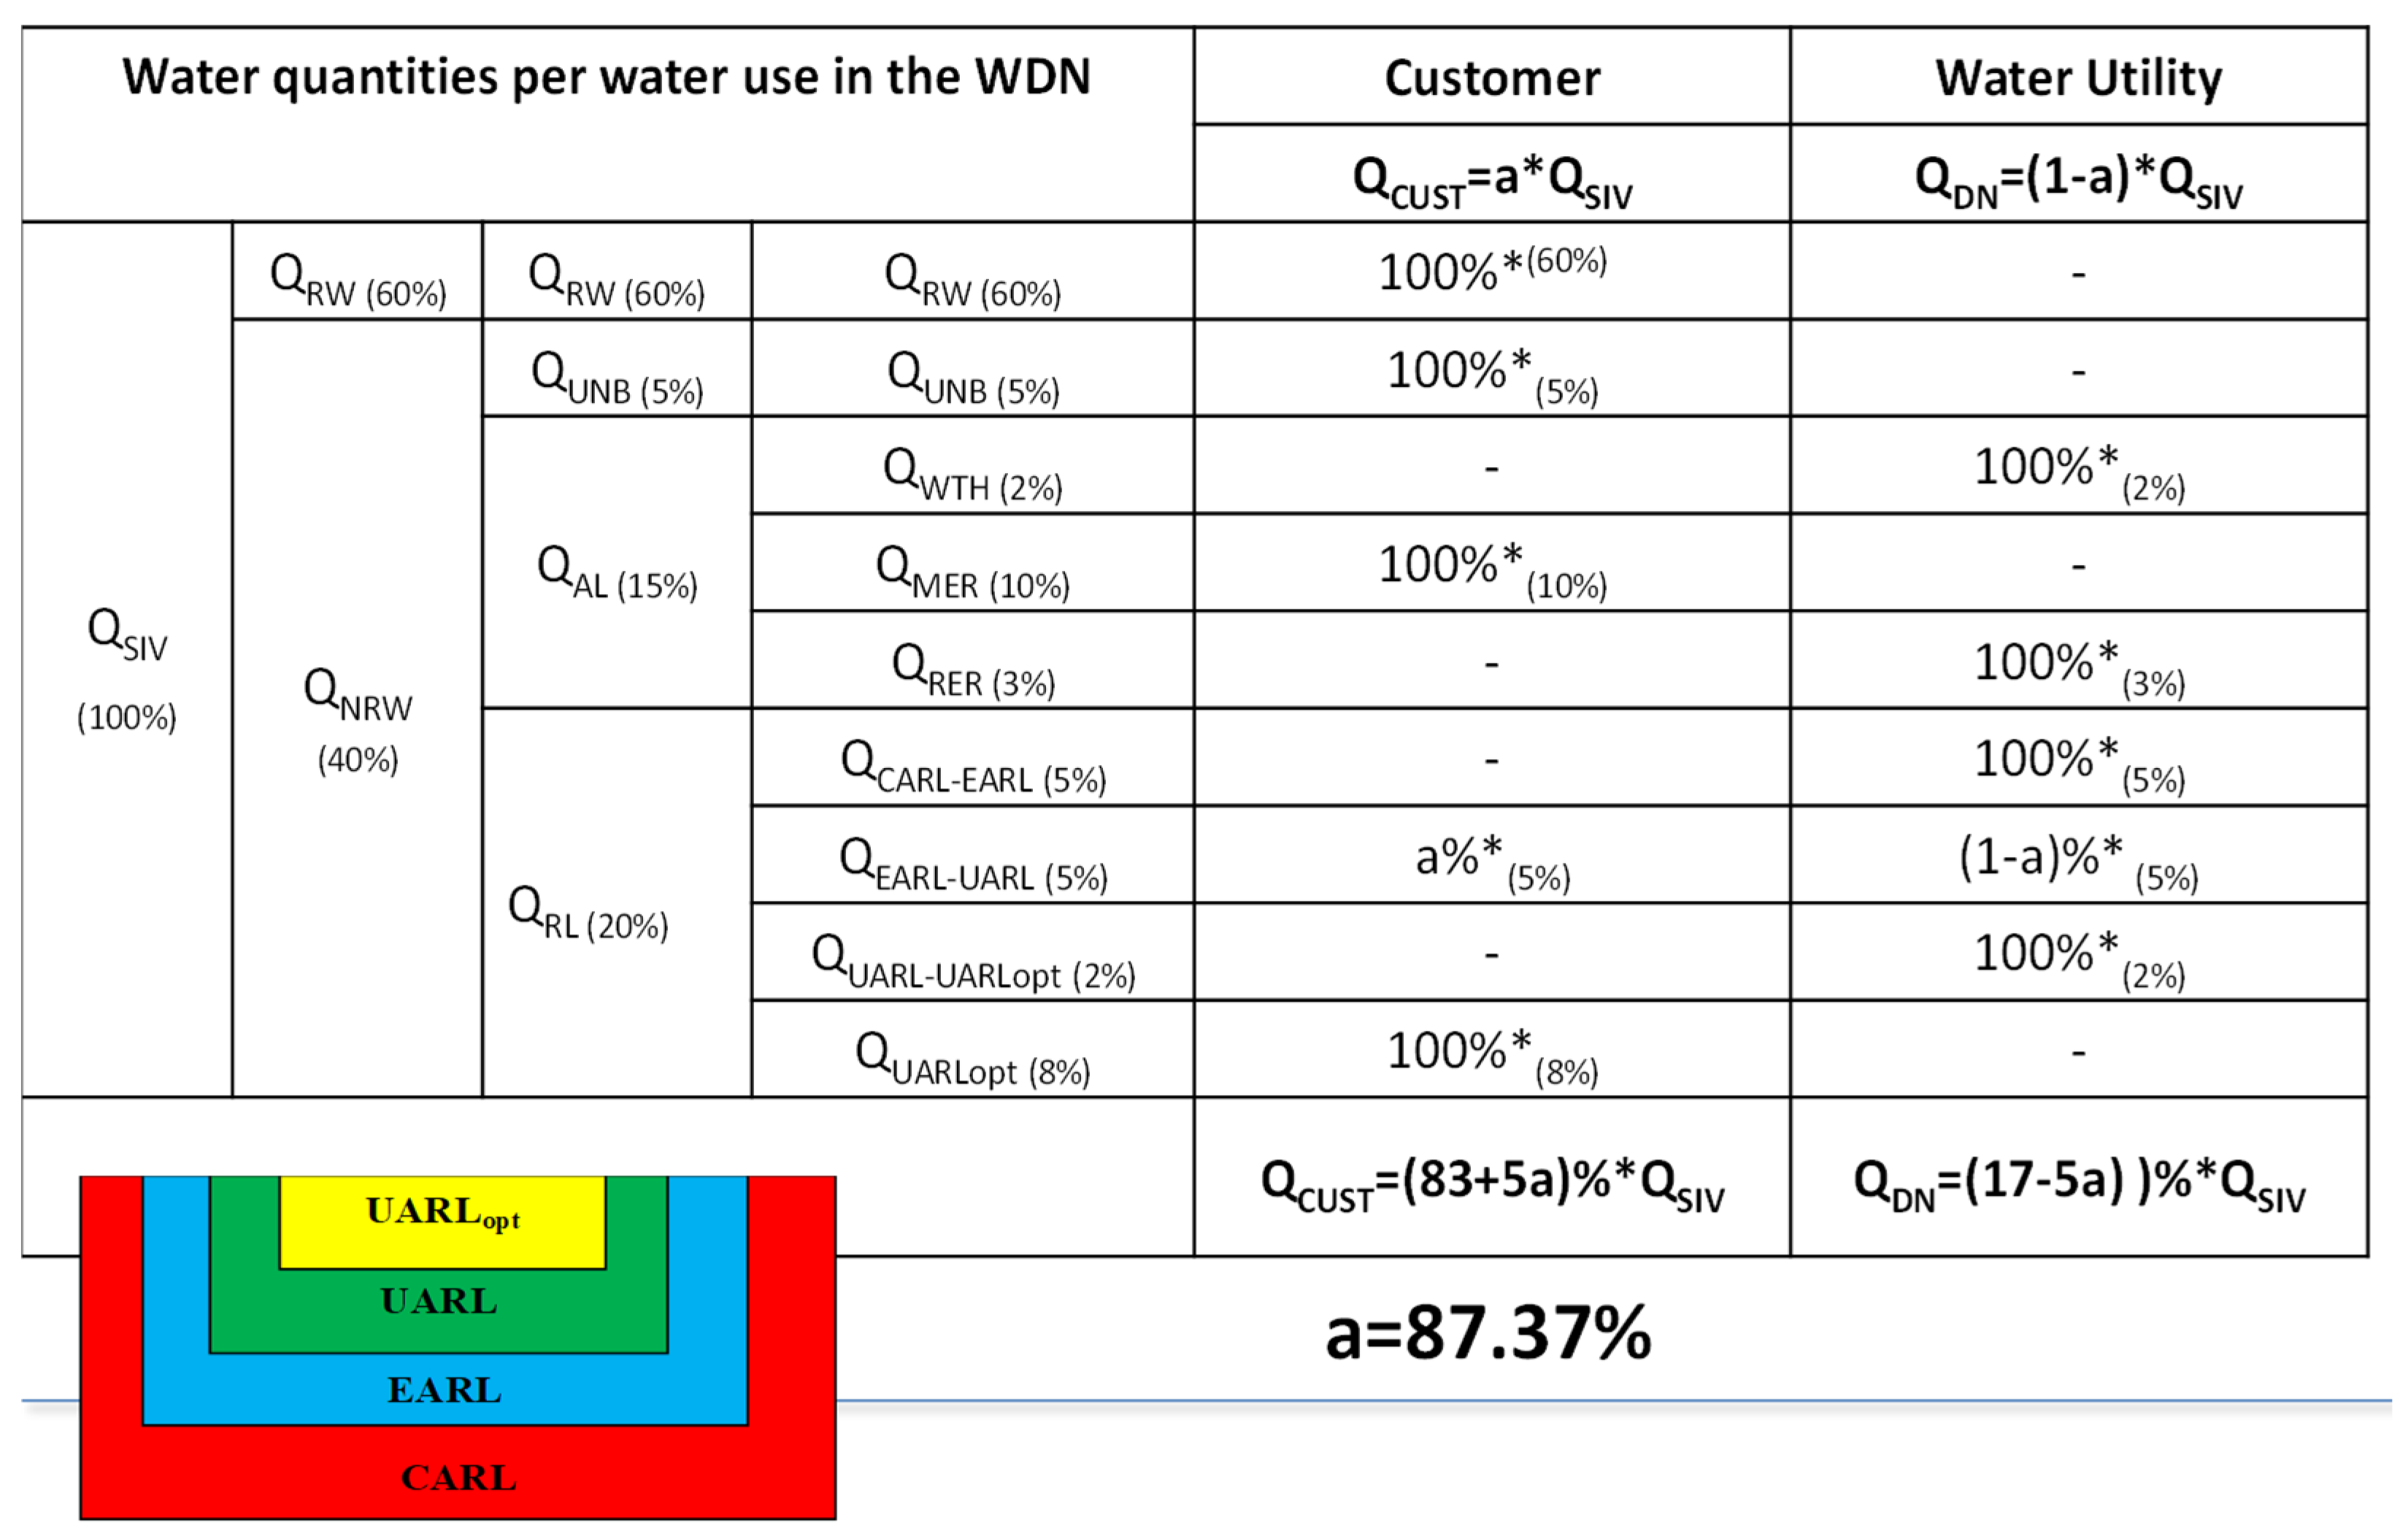
DN). If for example the Revenue water is 60% of the Q
SIV and the water consumption is shared according to
Figure 4, then the allocation of the water consumption related costs between the consumers and the WDN can be quantified.
The results (
Figure 4) show that although the consumers are billed for 60% of the SIV as this is their actual consumption, the water cost that must be recovered through their water bills is 87.37% (Q
CUST). This can be achieved through the respective variation in the weighted average unit price of water use. This practice is more socially fair than the one applied today, as water utilities try to recover 100% of the NRW cost, charging extra 60% of the revenue water. The practice used has to do with charging the weighted average unit price of water use, increased by 14.46% (=100/87.37). The specific water cost allocation is fairer for the water utility too, since it recovers part of the NRW-related lost revenues. It must be stressed that this allocation refers to the average charge variables.
5. Conclusions
Water is increasingly recognized as not only a vital resource but also as an economic, environmental, and social asset. Despite its essential role, the pricing and cost recovery mechanisms usually applied by water utilities fail to reflect the true value and full cost of water. The challenge becomes more pressing under the combined stresses of climate crisis and persistently high levels of NRW, which jeopardize the financial viability of water utilities and the sustainability of water resources. The concept of FWC incorporates three interrelated components. Current pricing policies, however, often consider only direct costs, neglecting environmental degradation and long-term resource depletion. Moreover, tariff structures frequently include high fixed charges, which obscure real losses and disincentivize efficient water use and investment in WLRS. These disconnects between actual and perceived costs of water contribute to systemic inefficiencies and undermine both economic rationality and ethical equity in water provision. NRW economic burden and the allocation of related costs among stakeholders represent critical challenges for water utilities and policymakers. The real value of water—its contribution to public health, quality of life, and environmental resilience—is rarely fully reflected in financial models, partly due to its qualitative and context-specific nature. Although methodologies such as Willingness to Pay offer tools for estimating the social value of water, their integration into water tariffs remains limited. In response to all these, this study investigates the role of cost-reflective and socially fair pricing strategies in supporting sustainable water management. It explores how integrating the FWC with transparent tariff structures can promote loss reduction and ensure equitable cost allocation. Kozani’s case findings further demonstrate that tariff structure is not a neutral component of pricing policy, but a key determinant of cost distribution and social equity. Transitioning from connection-based to per capita pricing can significantly reduce structural distortions and improve fairness without compromising revenue stability. Therefore, tariff design should be treated as an integral element of water pricing strategies alongside FWC recovery and NRW management. In doing so, it addresses a fundamental question: can a balance be achieved between financial sustainability, resource stewardship, and social justice in urban water pricing?